Global Movements of Rust Pathogens in the Atmosphere
|
|
|
- Aileen Jefferson
- 5 years ago
- Views:
Transcription

1 Global Movements of Rust Pathogens in the Atmosphere Scott A. Isard Departments of Plant Pathology and Meteorology Pennsylvania State University University Park, PA USA & Joseph M. Russo Senior Research Scientist ZedX Inc. Bellefonte, PA APS Field Crops Rust Symposium; 16 Dec 2011; San Antonio, TX
2 Long-Distance Dispersal Routes for Fungal Pathogens Red arrows indicate sweeps. Black arrows show leaps and jumps. Redrawn from Nagarajan and Singh, Annual Review of Phytopathology.
3 Selected Aerial Dispersal Events of Rusts Cereal rusts and powdery mildew Cereal stem rust Tobacco blue mold Wheat yellow rust Sugarcane rust (1978) Wheat brown and stem rust Coffee leaf rust (1970) Wheat yellow rust (1980) Wheat stem rust pathotypes (1969) Red arrows indicate direct aerial invasions of new territories (first year recorded in brackets) Black arrows indicate periodic migrations of airborne spores in extinction-recolonization cycles Redrawn from Brown and Hovmoller, Science.
4 Some Recent Dispersal Events of Field Crop Rusts Stripe rust Sugarcane rust Soybean rust Stem rust Dotted arrows indicate sweeps. Solid arrows show leaps and jumps. Red arrows indicate suspected aerial pathways of soybean rust (2001-present) Brown arrows represents movements of Ug99 stem rust race group (1999-present) Orange arrow indicates suspected areal movement of orange sugarcane rust in 2007 Redrawn from Brown and Hovmoller, Science. Black arrows indicates movement of stripe rust in 2010
5 Questions How frequently are there opportunities for rust pathogens to be transported: From locations in the Eastern Hemisphere to the Western Hemisphere? From locations in subtropical regions to the continental interior of North America?
6 Aerobiota Transport Process Conceptual Model Horizontal Transport Takeoff and Ascent Earth s atmosphere Descent and Landing Preconditioning Earth s surface Impact SOURCE AREA DESTINATION AREA
7 Synoptic Scale Airflows Govern Transport Direction and Speed Ultraviolet Radiation Turbulent Diffusion and Wind Shear Govern Dilution Turbulent Transport and Dilution in the Atmosphere Survival of Spores while Airborne Temperature and Relative Humidity Vertical Distribution of Spores in Canopy Canopy Density & Structure Wind & Turbulence Time of Spore Release Escape of Spores from Canopy Integrated Aerobiology Modeling System (IAMS) modules Deposition of Spores into a Crop Dry Deposition Due to Wind and Turbulence Wet Deposition Due to Washout by Precipitation Plant Growth Stage of Disease Weather Spore Production Colonization of Crop Temperature & Leaf Wetness Crop Growth Stage Isard et al BioScience 55:

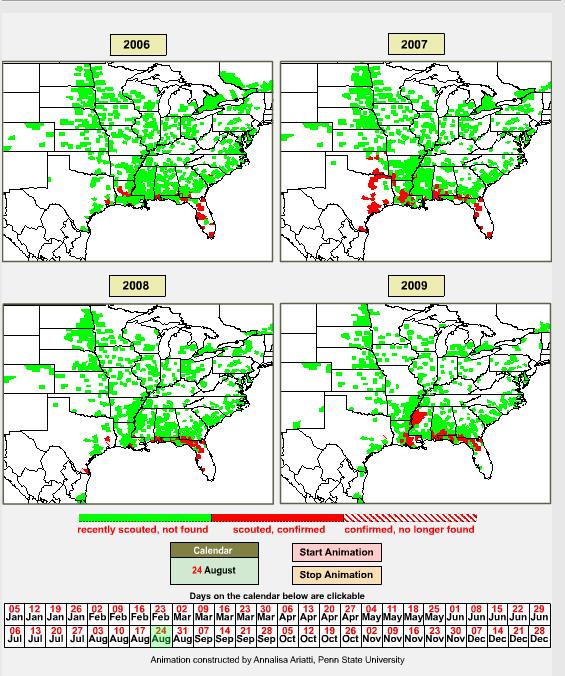
8 Observation of Soybean Rust Red color indicates counties with soybean rust PSU & ZedX have been providing daily forecasts of SBR spread for 7 years Accuracy of model output depends on reliable and timely disease observations IAMS Output Wet Deposition of Viable Spores 8 Sept 2007


9 Field Crop Rust Forecast Bulletins Ensemble Forecasting Team Soybean Rust Disease Risk Map


10 National Atmospheric Deposition Network Rainwater collector Rainwater collection sites

11 Maps showing 2007 collection weeks for which rain samples and IAMS output both indicate deposition of P. pachyrhizi urediniospores in the continental interior of North America Isard, S.A., C.W. Barnes, S. Hambleton, A. Ariatti, J.M. Russo, A.Tenuta, D.A. Gay and L.J. Szabo Predicting seasonal soybean rust incursions into the North American continental interior using sentinel plot monitoring, spore trapping, and aerobiological modeling. Plant Disease 95:
12 Questions How frequently are there opportunities for rust pathogens to be transported: 1. From locations in the Eastern Hemisphere to the Western Hemisphere?
13 Potential Source and Destination Regions Used in Analysis Alaska Aleutian Islands British Columbia Washington & Oregon California Gulf Coast Hawaii Mexico & Central America Northern Chile Central Chile Eastern Canada U.S. Northeast Coast U.S. Southeast Coast Florida Greater Antilles Lesser Antilles Sierra Leone Northeastern South America Southeastern South America United Kingdom Spain/Morocco Nigeria Cameroon Angola South Africa Northern China Southern China Philippine Islands Eastern Australia Southern Chile
, - Vertical resolution was defined by the standard pressure levels (1000, 950, 900, 850, 800, 700, 600, 500 hpa) - One hr time step.")
14 Parameters and Input Data for IAMS Simulations - Grid spatial resolution was degrees (~ 14 km), - Vertical resolution was defined by the standard pressure levels (1000, 950, 900, 850, 800, 700, 600, 500 hpa) - One hr time step. - National Center for Environmental Prediction Department of Energy Reanalysis 2 data set for the period - Each simulation was initiated for 1 January 1998 with the daily spore production held constant in source area for the duration of the 10-yr run. - Nine grid cells (equivalent to about 125,000 ha at the Equator), distributed throughout a source area, were assumed to have a healthy crop and rust infection severity of 50%. - Parameters for the spore release and escape, dispersion, mortality and deposition modules were those used in a previous soybean rust study (Isard et al. 2007)
15 Frequency of Days with Deposition of Viable Rust Spores in Western Hemisphere as Simulated by IAMS for Averaged for for February January Year 0.3/mo 2.2/mo 9.3/mo 11.6/mo 9.6/mo 16.6/mo 29.9/mo 27.2/mo 3.4/mo 11.5/mo 9.5/mo 0.7/mo 4.1/mo 1.7/mo 1.5/mo 0.6/mo 1.5/mo 0.6/mo 0.4/mo 8.1/mo 9.4/mo 13.7/mo 0.2/mo 0.3/mo 0.1/mo
16 Frequency of Days with Deposition of Viable Rust Spores in Western Hemisphere as Simulated by IAMS for Averaged for for February January March April Year May 0.3/mo 0.1/mo 2.2/mo 1.3/mo 2.6/mo 11.6/mo 9.6/mo 9.3/mo 7.0/mo 6.1/mo 16.6/mo 29.9/mo 27.2/mo 22.3/mo 13.0/mo 12.6/mo 3.4/mo 11.5/mo 9.5/mo 2.2/mo 0.1/mo 0.7/mo 4.1/mo 1.7/mo 0.4/mo 1.5/mo 0.6/mo 1.2/mo 2.5/mo 1.5/mo 0.6/mo 0.5/mo 0.4/mo 3.6/mo 8.1/mo 9.4/mo 13.7/mo 16.7/mo 18.0/mo 10.4/mo 0.2/mo 0.1/mo 0.3/mo 0.7/mo
17 Frequency of Days with Deposition of Viable Rust Spores in Western Hemisphere as Simulated by IAMS for Averaged for for February January August March June April Year May July 0.3/mo 0.1/mo 0.4/mo 0.9/mo 2.2/mo 1.3/mo 2.6/mo 1.2/mo 1.1/mo 5.4/mo 11.6/mo 9.6/mo 9.3/mo 7.0/mo 6.1/mo 11.0/mo 11.7/mo 8.7/mo 16.6/mo 29.9/mo 27.2/mo 22.3/mo 13.0/mo 12.6/mo 18.4/mo 5.9/mo 1.1/mo 3.4/mo 11.5/mo 9.5/mo 2.2/mo 0.1/mo 1.6/mo 0.7/mo 4.1/mo 1.7/mo 0.4/mo 1.5/mo 0.6/mo 1.2/mo 2.5/mo 1.1/mo 6.5/mo 2.2/mo 1.5/mo 0.6/mo 0.5/mo 2.0/mo 3.5/mo 4.1/mo 3.6/mo 0.8/mo 0.4/mo 0.1/mo 8.1/mo 9.4/mo 13.7/mo 16.7/mo 18.0/mo 10.4/mo 4.7/mo 6.3/mo 2.1/mo 0.2/mo 0.3/mo 0.7/mo 0.1/mo
18 Frequency of Days with Deposition of Viable Rust Spores in Western Hemisphere as Simulated by IAMS for Averaged for November 0.2/mo 28.1/mo 10.1/mo 2.7/mo 0.9/mo 0.5/mo 4.6/mo 0.2/mo
19 Frequency of Days with Deposition of Viable Rust Spores in Western Hemisphere as Simulated by IAMS for Averaged for for for September November December February October January August March June April Year May July 0.1/mo 0.4/mo 0.9/mo 0.6/mo 1.3/mo 0.2/mo 0.3/mo 1.3/mo 2.6/mo 1.2/mo 1.1/mo 5.4/mo 9.5/mo 5.0/mo 2.2/mo 11.6/mo 9.6/mo 6.1/mo 11.0/mo 11.7/mo 8.7/mo 5.3/mo 7.0/mo 10.1/mo 14.4/mo 9.3/mo 29.9/mo 27.2/mo 22.3/mo 13.0/mo 12.6/mo 18.4/mo 5.9/mo 1.1/mo 0.7/mo 9.4/mo 28.1/mo 30.8/mo 16.6/mo 11.5/mo 9.5/mo 2.2/mo 0.1/mo 1.6/mo 2.7/mo 12.8/mo 3.4/mo 4.1/mo 1.7/mo 0.4/mo 0.9/mo 1.3/mo 0.7/mo 0.6/mo 2.5/mo 1.1/mo 6.5/mo 2.2/mo 0.4/mo 1.2/mo 1.5/mo 0.6/mo 2.0/mo 3.5/mo 4.1/mo 3.9/mo 1.8/mo 0.5/mo 1.0/mo 1.5/mo 3.6/mo 0.8/mo 0.1/mo 0.4/mo 9.4/mo 13.7/mo 16.7/mo 18.0/mo 10.4/mo 4.7/mo 6.3/mo 2.1/mo 0.8/mo 3.3/mo 4.6/mo 7.6/mo 8.1/mo 0.3/mo 0.7/mo 0.1/mo 0.4/mo 0.2/mo
20 Frequency of Days with Deposition of Viable Rust Spores from Eastern Hemisphere Source Regions in U.S. & Canadian Destination Regions 0.4/mo 0.1/mo 0.3/mo 0.3/mo 0.4/mo 0.2/mo 0.1/mo 0.1/mo 0.1/mo Averaged for All Months in Year 0.1/mo 0.1/mo 0.2/mo Averaged for entire year Simulated by IAMS for
21 Frequency of Days with Deposition of Viable Rust Spores from African Source Regions in the Caribbean Islands Averaged for entire year 4.1/mo 2.4/mo 4.7/mo 0.1/mo 0.4/mo 0.03/mo 0.01/mo 0.01/mo Simulated by IAMS for


22 Frequency of Days with Deposition of Viable Rust Spores from African Source Regions in Eastern South America Trade Winds > 90% of days 70-90% of days 70-50% of days 7.9/mo January 15.9/mo 3.2/mo 0.7/mo July 0.4/mo 7.2/mo 5.5/mo 0.4/mo 0.03/mo > 90% of days 70-90% of days 70-50% of days Averaged for entire year 0.03/mo 2.1/mo Simulated by IAMS for
23 IAMS Model Output May January 1998

24 Summary of Insights from IAMS Simulations The frequency of trans-oceanic transport and deposition of viable rust spores in the Western Hemisphere : Europe, north of Pyrenees/Alps low Eastern Asia/Australia low Africa, tropics low Africa, poleward of the tropics high relatively short distance persistent trade winds Regions in the Western Hemisphere that are influenced by the ITCZ have the highest likelihood of receiving viable rust spores from the Eastern Hemisphere high frequency & high intensity deposition events Risk of direct aerial transport of viable rust spores to U.S. and Canada low Risk of aerial transport of Ug99 stem rust spores to Western Hemisphere - low

25 Questions How frequently are there opportunities for rust pathogens to be transported: 2. From locations in subtropical regions to the continental interior of North America?
26 Frequency of Airflows with Potential to Move Spores between Regions (% of Days in April & May) 19% 19% 40% 23% 33% 23% 8%
27 Frequency of Airflows with Potential to Move Spores between Regions (% of Days in June & July) 8% 15% 4% 10% 7% 5% 5%
 3% 8% 4% 4% 10% 8%")
28 Frequency of Airflows with Potential to Move Spores between Regions (% of Days in August & September) 3% 8% 4% 4% 10% 8% 7%

29 Winter Wheat 2010 Harvested Acres by U.S. County Soybean 2010 Harvested Acres by U.S. County Winter Wheat Crop Calendar for Central Texas Plant Soybean Crop Calendar for Delta Region Plant Head Harvest J F M A M J J A S O N D Harvest J F M A M J J A S O N D Risk of long-distance aerial spread of soybean rust less than for wheat rusts during the periods when they could potentially cause crop losses in major North American production regions

30 Late August Late November

31 Summary of Insights from Analysis Frequency of strong low-level advection of air northward from the subtropics in North America varies greatly with the seasons: High from early April to June midlatitude cyclones Low from mid-june to mid-september tropical cyclones High after mid-september midlatitude cyclones

32 Underlying Premises of Aerobiology Forecasting Organisms that use the atmosphere for transport from one geographic place to another, flow within motion systems along routes that are mediated by physical and biological features of the Earth surface. The pathways and timing of flow of biota are to a large degree regular, and thus the movement of organisms in the atmosphere is predictable. x Thank You
An assessment of the risk of aerial transport of rust pathogens to the Western Hemisphere and within North America
 An assessment of the risk of aerial transport of rust pathogens to the Western Hemisphere and within North America Scott A. Isard Departments of Plant Pathology and Meteorology Pennsylvania State University
Application of the Integrated Aerobiology Modeling System to Soybean Rust Forecasting in 2006
 Application of the Integrated Aerobiology Modeling System to Soybean Rust Forecasting in 2006 Scott A. Isard Penn State University & Joseph M. Russo ZedX Inc. Integrated Aerobiology Modeling System (IAMS)
Monitoring: Spore Trapping. Presenter John Rupe
 Monitoring: Spore Trapping Presenter John Rupe Projects Florida SBR Collection Network UF, UI, USDA-ARS Dry and rain deposition Syngenta Spore Trap Network Syngenta, UA Dry deposition Detection of SBR
Wind: Global Systems Chapter 10
 Wind: Global Systems Chapter 10 General Circulation of the Atmosphere General circulation of the atmosphere describes average wind patterns and is useful for understanding climate Over the earth, incoming
Tropical Moist Rainforest
 Tropical or Lowlatitude Climates: Controlled by equatorial tropical air masses Tropical Moist Rainforest Rainfall is heavy in all months - more than 250 cm. (100 in.). Common temperatures of 27 C (80 F)
Chapter 1 Climate in 2016
 Chapter 1 Climate in 2016 1.1 Global climate summary Extremely high temperatures were frequently observed in many regions of the world, and in particular continued for most of the year in various places
Early May Cut-off low and Mid-Atlantic rains
 Abstract: Early May Cut-off low and Mid-Atlantic rains By Richard H. Grumm National Weather Service State College, PA A deep 500 hpa cutoff developed in the southern Plains on 3 May 2013. It produced a
Weather and Climate Summary and Forecast November 2017 Report
 Weather and Climate Summary and Forecast November 2017 Report Gregory V. Jones Linfield College November 7, 2017 Summary: October was relatively cool and wet north, while warm and very dry south. Dry conditions
 Page 1 of 5 Home research global climate enso effects Research Effects of El Niño on world weather Precipitation Temperature Tropical Cyclones El Niño affects the weather in large parts of the world. The
Monthly Long Range Weather Commentary Issued: May 15, 2014 Steven A. Root, CCM, President/CEO
 Monthly Long Range Weather Commentary Issued: May 15, 2014 Steven A. Root, CCM, President/CEO sroot@weatherbank.com APRIL 2014 REVIEW Climate Highlights The Month in Review The average temperature for
KUALA LUMPUR MONSOON ACTIVITY CENT
 T KUALA LUMPUR MONSOON ACTIVITY CENT 2 ALAYSIAN METEOROLOGICAL http://www.met.gov.my DEPARTMENT MINISTRY OF SCIENCE. TECHNOLOGY AND INNOVATIO Introduction Atmospheric and oceanic conditions over the tropical
PRMS WHITE PAPER 2014 NORTH ATLANTIC HURRICANE SEASON OUTLOOK. June RMS Event Response
 PRMS WHITE PAPER 2014 NORTH ATLANTIC HURRICANE SEASON OUTLOOK June 2014 - RMS Event Response 2014 SEASON OUTLOOK The 2013 North Atlantic hurricane season saw the fewest hurricanes in the Atlantic Basin
Weather and Climate Summary and Forecast October 2017 Report
 Weather and Climate Summary and Forecast October 2017 Report Gregory V. Jones Linfield College October 4, 2017 Summary: Typical variability in September temperatures with the onset of fall conditions evident
Climate Outlook for March August 2018
 The APEC CLIMATE CENTER Climate Outlook for March August 2018 BUSAN, 26 February 2018 The synthesis of the latest model forecasts for March to August 2018 (MAMJJA) from the APEC Climate Center (APCC),
Weather and Climate Summary and Forecast Winter
 Weather and Climate Summary and Forecast Winter 2016-17 Gregory V. Jones Southern Oregon University February 7, 2017 What a difference from last year at this time. Temperatures in January and February
Climate Outlook through 2100 South Florida Ecological Services Office Vero Beach, FL September 9, 2014
 Climate Outlook through 2100 South Florida Ecological Services Office Vero Beach, FL September 9, 2014 Short Term Drought Map: Short-term (
MDA WEATHER SERVICES AG WEATHER OUTLOOK. Kyle Tapley-Senior Agricultural Meteorologist May 22, 2014 Chicago, IL
 MDA WEATHER SERVICES AG WEATHER OUTLOOK Kyle Tapley-Senior Agricultural Meteorologist May 22, 2014 Chicago, IL GLOBAL GRAIN NORTH AMERICA 2014 Agenda Spring Recap North America Forecast El Niño Discussion
2013 ATLANTIC HURRICANE SEASON OUTLOOK. June RMS Cat Response
 2013 ATLANTIC HURRICANE SEASON OUTLOOK June 2013 - RMS Cat Response Season Outlook At the start of the 2013 Atlantic hurricane season, which officially runs from June 1 to November 30, seasonal forecasts
Northwest Outlook October 2016
 Northwest Outlook October 2016 Rainfall Opportunities and Challenges Rainfall over the month of September presented some challenges for the fall harvest while other producers benefitted. Figure 1a shows
Keys to Climate Climate Classification Low Latitude Climates Midlatitude Climates High Latitude Climates Highland Climates Our Changing Climate
 Climate Global Climates Keys to Climate Climate Classification Low Latitude Climates Midlatitude Climates High Latitude Climates Highland Climates Our Changing Climate Keys to Climate Climate the average
L.O Students will learn about factors that influences the environment
 Name L.O Students will learn about factors that influences the environment Date 1. At the present time, glaciers occur mostly in areas of A) high latitude or high altitude B) low latitude or low altitude
The Pennsylvania Observer
 The Pennsylvania Observer April 2, 2010 March 2010 Pennsylvania Weather Recap Prepared by: Katelyn Johnson March did come in as a lion cub this year. The 1 st proved to be a calm day; however most of Pennsylvania
CPTEC and NCEP Model Forecast Drift and South America during the Southern Hemisphere Summer
 CPTEC and NCEP Model Forecast Drift and South America during the Southern Hemisphere Summer José Antonio Aravéquia 1 Pedro L. Silva Dias 2 (1) Center for Weather Forecasting and Climate Research National
Weather and Climate Summary and Forecast February 2018 Report
 Weather and Climate Summary and Forecast February 2018 Report Gregory V. Jones Linfield College February 5, 2018 Summary: For the majority of the month of January the persistent ridge of high pressure
Weather and Climate Summary and Forecast March 2019 Report
 Weather and Climate Summary and Forecast March 2019 Report Gregory V. Jones Linfield College March 2, 2019 Summary: Dramatic flip from a mild winter to a top five coldest February on record in many locations
ENSO: Recent Evolution, Current Status and Predictions. Update prepared by: Climate Prediction Center / NCEP 9 November 2015
 ENSO: Recent Evolution, Current Status and Predictions Update prepared by: Climate Prediction Center / NCEP 9 November 2015 Outline Summary Recent Evolution and Current Conditions Oceanic Niño Index (ONI)
Weather and Climate Summary and Forecast April 2018 Report
 Weather and Climate Summary and Forecast April 2018 Report Gregory V. Jones Linfield College April 4, 2018 Summary: A near Miracle March played out bringing cooler and wetter conditions to the majority
Weather Report 29 November 2017
 Weather Report 29 November 2017 South Africa - Weather The erratic rain pattern will continue for portions of eastern and central India during the coming week. Moisture totals through next Tuesday morning
Climate Variability and El Niño
 Climate Variability and El Niño David F. Zierden Florida State Climatologist Center for Ocean Atmospheric Prediction Studies The Florida State University UF IFAS Extenstion IST January 17, 2017 The El
Weather and Climate Summary and Forecast Fall/Winter 2016
 Weather and Climate Summary and Forecast Fall/Winter 2016 Gregory V. Jones Southern Oregon University November 5, 2016 After a year where we were seemingly off by a month in terms of temperatures (March
Elements of weather and climate Temperature Range of temperature Seasonal temperature pattern Rainfall
 Climate Earth Science Chapter 20 Pages 560-573 Elements of weather and climate Temperature Range of temperature Seasonal temperature pattern Rainfall Overall rainfall Seasonal distribution of rainfall
Stripe Rust (Yellow Rust) of Wheat
 of Wheat") Stripe Rust (Yellow Rust) of Wheat Alfredo Martinez, John Youmans, and James Buck Department of Plant Pathology-Griffin Campus Introduction Stripe rust (Puccinia striiformis f. sp. tritici) is an important
Stripe Rust (Yellow Rust) of Wheat Alfredo Martinez, John Youmans, and James Buck Department of Plant Pathology-Griffin Campus Introduction Stripe rust (Puccinia striiformis f. sp. tritici) is an important
Benjamin J. Moore. Education. Professional experience
 Benjamin J. Moore Department of Atmospheric and Environmental Sciences University at Albany, State University of New York 1400 Washington Avenue Albany, New York, 12222 phone: +1 507 398 7427 email: bjmoore@albany.edu
Weather and Climate Summary and Forecast October 2018 Report
 Weather and Climate Summary and Forecast October 2018 Report Gregory V. Jones Linfield College October 4, 2018 Summary: Much of Washington, Oregon, coastal California and the Bay Area and delta region
WeatherManager Weekly
 Issue 288 July 14, 2016 WeatherManager Weekly Industries We Serve Agriculture Energy/Utilities Construction Transportation Retail Our Weather Protection Products Standard Temperature Products Lowest Daily
What Is the Weather Like in Different Regions of the United States?
 Learning Set 1 What Is Weather, and How Is It Measured and Described? 1.3 Explore What Is the Weather Like in Different Regions of the United States? trends: patterns or tendencies you can see over a broad
El Niño / Southern Oscillation
 El Niño / Southern Oscillation Student Packet 2 Use contents of this packet as you feel appropriate. You are free to copy and use any of the material in this lesson plan. Packet Contents Introduction on
Weather and Climate Summary and Forecast March 2018 Report
 Weather and Climate Summary and Forecast March 2018 Report Gregory V. Jones Linfield College March 7, 2018 Summary: The ridge pattern that brought drier and warmer conditions from December through most
NOAA 2015 Updated Atlantic Hurricane Season Outlook
 NOAA 2015 Updated Atlantic Hurricane Season Outlook Dr. Gerry Bell Lead Seasonal Forecaster Climate Prediction Center/ NOAA/ NWS Collaboration With National Hurricane Center/ NOAA/ NWS Hurricane Research
Temporal and Spatial Distribution of Tourism Climate Comfort in Isfahan Province
 2011 2nd International Conference on Business, Economics and Tourism Management IPEDR vol.24 (2011) (2011) IACSIT Press, Singapore Temporal and Spatial Distribution of Tourism Climate Comfort in Isfahan
Weather and Climate Summary and Forecast August 2018 Report
 Weather and Climate Summary and Forecast August 2018 Report Gregory V. Jones Linfield College August 5, 2018 Summary: July 2018 will likely go down as one of the top five warmest July s on record for many
CropCast Corn and Soybean Report Kenny Miller Monday, March 13, 2017
 Accumulated Rainfall (inches) Accumulated GDDs Temperature ( F)/Wind Speed (mph) Precipitation (inches) CropCast Corn and Soybean Report Kenny Miller Monday, March 13, 2017 Peoria, IL Regional Forecast
Monthly Long Range Weather Commentary Issued: SEPTEMBER 19, 2016 Steven A. Root, CCM, Chief Analytics Officer, Sr. VP,
 Monthly Long Range Weather Commentary Issued: SEPTEMBER 19, 2016 Steven A. Root, CCM, Chief Analytics Officer, Sr. VP, sroot@weatherbank.com SEPTEMBER 2016 Climate Highlights The Month in Review The contiguous
The Pennsylvania Observer
 The Pennsylvania Observer October 1, 2015 September 2015 - Pennsylvania Weather Recap By: Quinn Lease The month of September will be remembered for its above normal temperatures and dry conditions that
Climate Outlook for October 2017 March 2018
 The APEC CLIMATE CENTER Climate Outlook for October 2017 March 2018 BUSAN, 25 September 2017 The synthesis of the latest model forecasts for October 2017 to March 2018 (ONDJFM) from the APEC Climate Center
Monthly Long Range Weather Commentary Issued: February 15, 2015 Steven A. Root, CCM, President/CEO
 Monthly Long Range Weather Commentary Issued: February 15, 2015 Steven A. Root, CCM, President/CEO sroot@weatherbank.com JANUARY 2015 Climate Highlights The Month in Review During January, the average
Page 1. Name: 4) State the actual air pressure, in millibars, shown at Miami, Florida on the given weather map.
 State the actual air pressure, in millibars, shown at Miami, Florida on the given weather map.") Name: Questions 1 and 2 refer to the following: A partial station model and meteorological conditions table, as reported by the weather bureau in the city of Oswego, New York, are shown below. 1) Using
Name: Questions 1 and 2 refer to the following: A partial station model and meteorological conditions table, as reported by the weather bureau in the city of Oswego, New York, are shown below. 1) Using
California 120 Day Precipitation Outlook Issued Tom Dunklee Global Climate Center
 California 120 Day Precipitation Outlook Issued 11-01-2008 Tom Dunklee Global Climate Center This is my second updated outlook for precipitation patterns and amounts for the next 4 s of the current rainy
DEPARTMENT OF EARTH & CLIMATE SCIENCES Name SAN FRANCISCO STATE UNIVERSITY Nov 29, ERTH 360 Test #2 200 pts
 DEPARTMENT OF EARTH & CLIMATE SCIENCES Name SAN FRANCISCO STATE UNIVERSITY Nov 29, 2018 ERTH 360 Test #2 200 pts Each question is worth 4 points. Indicate your BEST CHOICE for each question on the Scantron
Weather Report 04 April 2018
 Weather Report 04 April 2018 South Africa - Weather Alternating periods of rain and sunshine will evolve across South Africa during the coming week. Moisture totals through next Tuesday morning will range
Mediterranean Climates (Csa, Csb)
") Climatic Zones & Types Part II I've lived in good climate, and it bores the hell out of me. I like weather rather than climate. 1 John Steinbeck Mediterranean Climates (Csa, Csb) Main locations Western
Climatic Zones & Types Part II I've lived in good climate, and it bores the hell out of me. I like weather rather than climate. 1 John Steinbeck Mediterranean Climates (Csa, Csb) Main locations Western
World Geography Chapter 3
 World Geography Chapter 3 Section 1 A. Introduction a. Weather b. Climate c. Both weather and climate are influenced by i. direct sunlight. ii. iii. iv. the features of the earth s surface. B. The Greenhouse
UNITED STATES AND SOUTH AMERICA SNAPSHOT REPORT Thursday, December 21, 2017
 T-storm Weather Summary A small but key corn and soybean area in western Argentina was wetter than expected overnight. T-storms affect varying areas of South America at varying times into January, but
Weather and Climate Summary and Forecast Summer 2017
 Weather and Climate Summary and Forecast Summer 2017 Gregory V. Jones Southern Oregon University August 4, 2017 July largely held true to forecast, although it ended with the start of one of the most extreme
CropCast Corn and Soybean Report Kenny Miller Friday, March 17, 2017
 Accumulated Rainfall (inches) Accumulated GDDs Temperature ( F)/Wind Speed (mph) Precipitation (inches) CropCast Corn and Soybean Report Kenny Miller Friday, March 17, 2017 Peoria, IL Regional Forecast
Weather Report 30 November 2017
 Weather Report 30 November 2017 South Africa - Weather The frequent precipitation pattern will continue for portions of eastern and central South Africa during the coming week. Moisture totals through
Analysis of Fall Transition Season (Sept-Early Dec) Why has the weather been so violent?
 Why has the weather been so violent?") WEATHER TOPICS Analysis of Fall Transition Season (Sept-Early Dec) 2009 Why has the weather been so violent? As can be seen by the following forecast map, the Fall Transition and early Winter Season of
WEATHER TOPICS Analysis of Fall Transition Season (Sept-Early Dec) 2009 Why has the weather been so violent? As can be seen by the following forecast map, the Fall Transition and early Winter Season of
CropCast Corn and Soybean Report Kenny Miller Tuesday, March 14, 2017
 Accumulated Rainfall (inches) Accumulated GDDs Temperature ( F)/Wind Speed (mph) Precipitation (inches) CropCast Corn and Soybean Report Kenny Miller Tuesday, March 14, 2017 Peoria, IL Regional Forecast
Weather and Climate Summary and Forecast December 2017 Report
 Weather and Climate Summary and Forecast December 2017 Report Gregory V. Jones Linfield College December 5, 2017 Summary: November was relatively cool and wet from central California throughout most of
Module 11: Meteorology Topic 3 Content: Climate Zones Notes
 Introduction Latitude is such an important climate factor that you can make generalizations about a location's climate based on its latitude. Areas near the equator or the low latitudes are generally hot
West Africa: The 2015 Season
 HIGHLIGHTS The West Africa 2015 growing season developed under an evolving El Nino event that will peak in late 2015. This region tends to have seasonal rainfall deficits in the more marginal areas during
UPDATE OF REGIONAL WEATHER AND SMOKE HAZE (February 2018)
") UPDATE OF REGIONAL WEATHER AND SMOKE HAZE (February 2018) 1. Review of Regional Weather Conditions for January 2018 1.1 The prevailing Northeast monsoon conditions over Southeast Asia strengthened in January
UPDATE OF REGIONAL WEATHER AND SMOKE HAZE (February 2018) 1. Review of Regional Weather Conditions for January 2018 1.1 The prevailing Northeast monsoon conditions over Southeast Asia strengthened in January
Analysis of meteorological measurements made over three rainy seasons in Sinazongwe District, Zambia.
 Analysis of meteorological measurements made over three rainy seasons in Sinazongwe District, Zambia. 1 Hiromitsu Kanno, 2 Hiroyuki Shimono, 3 Takeshi Sakurai, and 4 Taro Yamauchi 1 National Agricultural
Impacts of Changes in Extreme Weather and Climate on Wild Plants and Animals. Camille Parmesan Integrative Biology University of Texas at Austin
 Impacts of Changes in Extreme Weather and Climate on Wild Plants and Animals Camille Parmesan Integrative Biology University of Texas at Austin Species Level: Climate extremes determine species distributions
2015: A YEAR IN REVIEW F.S. ANSLOW
 2015: A YEAR IN REVIEW F.S. ANSLOW 1 INTRODUCTION Recently, three of the major centres for global climate monitoring determined with high confidence that 2015 was the warmest year on record, globally.
Mid-season Storm Surge Update: December, 2013
 December 17, 2012 Ambleside Beach (Photograph by: Mark van Manen, PNG) Mid-season Storm Surge Update: December, 2013 Mid-season discussion of tidal and climate conditions affecting extreme water levels
North Pacific Climate Overview N. Bond (UW/JISAO), J. Overland (NOAA/PMEL) Contact: Last updated: August 2009
, J. Overland (NOAA/PMEL) Contact: Last updated: August 2009") North Pacific Climate Overview N. Bond (UW/JISAO), J. Overland (NOAA/PMEL) Contact: Nicholas.Bond@noaa.gov Last updated: August 2009 Summary. The North Pacific atmosphere-ocean system from fall 2008 through
North Pacific Climate Overview N. Bond (UW/JISAO), J. Overland (NOAA/PMEL) Contact: Nicholas.Bond@noaa.gov Last updated: August 2009 Summary. The North Pacific atmosphere-ocean system from fall 2008 through
Operational Monsoon Monitoring at NCEP
 Operational Monsoon Monitoring at NCEP Wassila M. Thiaw Climate Prediction Center National Centers for Environmental Predictions Operational Monsoon Monitoring at NCEP Wassila M. Thiaw Climate Prediction
National Wildland Significant Fire Potential Outlook
 National Wildland Significant Fire Potential Outlook National Interagency Fire Center Predictive Services Issued: September, 2007 Wildland Fire Outlook September through December 2007 Significant fire
Weather and Climate Summary and Forecast January 2018 Report
 Weather and Climate Summary and Forecast January 2018 Report Gregory V. Jones Linfield College January 5, 2018 Summary: A persistent ridge of high pressure over the west in December produced strong inversions
2011 National Seasonal Assessment Workshop for the Eastern, Southern, & Southwest Geographic Areas
 2011 National Seasonal Assessment Workshop for the Eastern, Southern, & Southwest Geographic Areas On January 11-13, 2011, wildland fire, weather, and climate met virtually for the ninth annual National
El Niño 2015/2016 Impact Analysis
 El Niño 2015/2016 Impact Analysis Dr Linda Hirons and Dr Nicolas Klingaman August 2015 This report has been produced by University of Reading and National Centre for Atmospheric Science for Evidence on
The Atmospheric Circulation
 The Atmospheric Circulation Vertical structure of the Atmosphere http://www.uwsp.edu/geo/faculty/ritter/geog101/textbook/atmosphere/atmospheric_structure.html The global heat engine [courtesy Kevin Trenberth,
November 2018 Weather Summary West Central Research and Outreach Center Morris, MN
 November 2018 Weather Summary Lower than normal temperatures occurred for the second month. The mean temperature for November was 22.7 F, which is 7.2 F below the average of 29.9 F (1886-2017). This November
Impacts of Spring versus Winter Lake Eyre Dust Storms
 Impacts of Spring versus Winter Lake Eyre Dust Storms Application of Online Hysplit Trajectory and Dispersion Models Lucia Bawagan (#41884157) University of British Columbia GEOB 402 Air Pollution Meteorology
Climate Outlook for December 2015 May 2016
 The APEC CLIMATE CENTER Climate Outlook for December 2015 May 2016 BUSAN, 25 November 2015 Synthesis of the latest model forecasts for December 2015 to May 2016 (DJFMAM) at the APEC Climate Center (APCC),
8.1 Attachment 1: Ambient Weather Conditions at Jervoise Bay, Cockburn Sound
 8.1 Attachment 1: Ambient Weather Conditions at Jervoise Bay, Cockburn Sound Cockburn Sound is 20km south of the Perth-Fremantle area and has two features that are unique along Perth s metropolitan coast
Thai Meteorological Department, Ministry of Digital Economy and Society
 Thai Meteorological Department, Ministry of Digital Economy and Society Three-month Climate Outlook For November 2017 January 2018 Issued on 31 October 2017 -----------------------------------------------------------------------------------------------------------------------------
Climate Prediction Center National Centers for Environmental Prediction
 NOAA s Climate Prediction Center Monthly and Seasonal Forecast Operations Wassila M. Thiaw Climate Prediction Center National Centers for Environmental Prediction Acknowlegement: Mathew Rosencrans, Arun
Satellites, Weather and Climate Module??: Polar Vortex
 Satellites, Weather and Climate Module??: Polar Vortex SWAC Jan 2014 AKA Circumpolar Vortex Science or Hype? Will there be one this year? Today s objectives Pre and Post exams What is the Polar Vortex
The benefits and developments in ensemble wind forecasting
 The benefits and developments in ensemble wind forecasting Erik Andersson Slide 1 ECMWF European Centre for Medium-Range Weather Forecasts Slide 1 ECMWF s global forecasting system High resolution forecast
Range Cattle Research and Education Center January CLIMATOLOGICAL REPORT 2012 Range Cattle Research and Education Center.
 1 Range Cattle Research and Education Center January 2013 Research Report RC-2013-1 CLIMATOLOGICAL REPORT 2012 Range Cattle Research and Education Center Brent Sellers Weather conditions strongly influence
THEME: Seasonal forecast: Climate Service for better management of risks and opportunities
 CENTRE AFRICAIN POUR LES APPLICATIONS DE LA METEOROLOGIE AU DEVELOPPEMENT AFRICAN CENTRE OF METEOROLOGICAL APPLICATIONS FOR DEVELOPMENT Institution Africaine parrainée par la CEA et l OMM African Institution
but 2012 was dry Most farmers pulled in a crop
 After a winter that wasn t, conditions late in the year pointed to a return to normal snow and cold conditions Most farmers pulled in a crop but 2012 was dry b y M i k e Wr o b l e w s k i, w e a t h e
By: J Malherbe, R Kuschke
 2015-10-27 By: J Malherbe, R Kuschke Contents Summary...2 Overview of expected conditions over South Africa during the next few days...3 Significant weather events (27 October 2 November)...3 Conditions
2011 Year in Review TORNADOES
 2011 Year in Review The year 2011 had weather events that will be remembered for a long time. Two significant tornado outbreaks in April, widespread damage and power outages from Hurricane Irene in August
SEVERE WEATHER AND FRONTS TAKE HOME QUIZ
 1. Most of the hurricanes that affect the east coast of the United States originally form over the A) warm waters of the Atlantic Ocean in summer B) warm land of the southeastern United States in summer
CHAPTER IV THE RELATIONSHIP BETWEEN OCEANOGRAPHY AND METEOROLOGY
 CHAPTER IV THE RELATIONSHIP BETWEEN OCEANOGRAPHY AND METEOROLOGY THE relationship between oceanography and meteorology is of an order different from that between it and geology or biology, because meteorologic
Weather and Climate Summary and Forecast January 2019 Report
 Weather and Climate Summary and Forecast January 2019 Report Gregory V. Jones Linfield College January 4, 2019 Summary: December was mild and dry over much of the west, while the east was much warmer than
1. Which weather map symbol is associated with extremely low air pressure? A) B) C) D) 2. The diagram below represents a weather instrument.
 B) C) D) 2. The diagram below represents a weather instrument.") 1. Which weather map symbol is associated with extremely low air pressure? 2. The diagram below represents a weather instrument. Which weather variable was this instrument designed to measure? A) air pressure
1. Which weather map symbol is associated with extremely low air pressure? 2. The diagram below represents a weather instrument. Which weather variable was this instrument designed to measure? A) air pressure
NIWA Outlook: April June 2019
 April June 2019 Issued: 28 March 2019 Hold mouse over links and press ctrl + left click to jump to the information you require: Outlook Summary Regional predictions for the next three months Northland,
March 1, 2003 Western Snowpack Conditions and Water Supply Forecasts
 Natural Resources Conservation Service National Water and Climate Center 101 SW Main Street, Suite 1600 Portland, OR 97204-3224 Date: March 17, 2003 Subject: March 1, 2003 Western Snowpack Conditions and
Chapter 1. Global agroclimatic patterns
 14 CROPWATCH BULLETIN FEBRUARY 2018 Chapter 1. Global agroclimatic patterns Chapter 1 describes the CropWatch Agroclimatic Indicators (CWAIs) rainfall (RAIN), temperature (TEMP), and radiation (RADPAR),
August Forecast Update for Atlantic Hurricane Activity in 2012
 August Forecast Update for Atlantic Hurricane Activity in 2012 Issued: 6 th August 2012 by Professor Mark Saunders and Dr Adam Lea Dept. of Space and Climate Physics, UCL (University College London), UK
EXECUTIVE BRIEF: El Niño and Food Security in Southern Africa October 2009
 El Niño is a phenomenon which occurs in the Pacific Ocean, but affects climate globally. This document summarizes the known historic impacts of El Niño in southern Africa. The impact of El Niño in the
Verification of the Seasonal Forecast for the 2005/06 Winter
 Verification of the Seasonal Forecast for the 2005/06 Winter Shingo Yamada Tokyo Climate Center Japan Meteorological Agency 2006/11/02 7 th Joint Meeting on EAWM Contents 1. Verification of the Seasonal
Climate. Earth Science Chapter 20 Pages
 Academic Excellence Showcase Thursday, May 27 Two points credit for each talk you attend in Earth science 8:30 to 10:30 AM, in NS 101 General Science video productions: Energy 9:00 to 11:00 AM, in NS 218
GLOBAL CLIMATES FOCUS
 which you will learn more about in Chapter 6. Refer to the climate map and chart on pages 28-29 as you read the rest of this chapter. FOCUS GLOBAL CLIMATES What are the major influences on climate? Where
August Forecast Update for Atlantic Hurricane Activity in 2015
 August Forecast Update for Atlantic Hurricane Activity in 2015 Issued: 5 th August 2015 by Professor Mark Saunders and Dr Adam Lea Dept. of Space and Climate Physics, UCL (University College London), UK
Climate Forecast Applications Network (CFAN)
") Forecast of 2018 Atlantic Hurricane Activity April 5, 2018 Summary CFAN s inaugural April seasonal forecast for Atlantic tropical cyclone activity is based on systematic interactions among ENSO, stratospheric
Forecast of 2018 Atlantic Hurricane Activity April 5, 2018 Summary CFAN s inaugural April seasonal forecast for Atlantic tropical cyclone activity is based on systematic interactions among ENSO, stratospheric