Comparing Full-Scale and Wind Tunnel Results
|
|
|
- Christopher Reynolds
- 6 years ago
- Views:
Transcription

1 A Resource for the State of Florida HURRICANE LOSS REDUCTION FOR HOUSING IN FLORIDA: Section 6 Comparing Full-Scale and Wind Tunnel Results A Research Project Funded by The State of Florida Department of Community Affairs Through Contract # 06RC-A% Prepared by: David O. Prevatt, Ph.D., Wind Load Test Facility Department of Civil Engineering Clemson University In Partnership with: The International Hurricane Research Center Florida International University
2 TABLE OF CONTENTS 1. PROJECT SCOPE BACKGROUND SOURCES OF FULL-SCALE DATA THE FCMP PROJECT THE 2005 HURRICANE SEASON DEPLOYMENTS FULL-SCALE DATA COLLECTION AND ANALYSIS FIELD SURVEYS OF PROTOTYPE HOUSES Prototype House FL Prototype House FL Prototype House FL Prototype House FL Prototype House FL FULL-SCALE ANALYSIS OF PRESSURE COEFFICIENTS Data Collection NEAR REAL-TIME UPDATES VALIDATED WIND SPEED SUMMARY DATA ANALYSIS WIND SPEED DATA AND PRESSURE COEFFICIENTS PRESSURE RESULTS FL-18 PROTOTYPE HOUSE WIND TUNNEL TESTING WIND TUNNEL TESTING MODELS DATA COLLECTION COMPARISON OF FULL-SCALE AND MODEL-SCALE PRESSURE DATA WIND PRESSURE VISUALIZATION SOFTWARE BACKGROUND STRUCTURE OF THE PROGRAM RESULTS WEB PAGE CONCLUSIONS REFERENCES...47 FIU Final Report RCMP Year 6: Wind Tunnel Section 6-ii
3 LIST OF FIGURES Figure 1. Tower Deployed for Data Collection....5 Figure 2. Track of Hurricane Dennis and FCMP Towers and House Locations...8 Figure 3. Track of Hurricane Katrina and FCMP Towers and House Locations....9 Figure 4. Track of Hurricane Rita and FCMP Towers and House Locations....9 Figure 5. Track of Hurricane Wilma and FCMP Towers and House Locations...10 Figure 6. Cardinal Directions for FL Figure 7. Roof Plan of Prototype FL-18 Showing Tap Locations Figure 8. Front View of Prototype FL Figure 9. Roof Plan of Prototype FL-19 Showing Tap Locations Figure 10. Front View of Prototype FL Figure 11. View of Prototype FL-19 Attached Porch at Rear of House...16 Figure 12. Roof Plan of Prototype FL-23 Showing Tap Locations Figure 13. Front View of Prototype FL Figure 14. Roof Plan of Prototype FL-24 Showing Tap Locations Figure 15. Partial Front View of Prototype FL Figure 16. Roof Plan of Prototype FL-26 Showing Tap Locations Figure 17. Front View of Prototype FL Figure 20. Aerial View of Tower T0 Location During Hurricane Katrina...22 Figure 21. Plot of Wind Speed and Direction Collected by T3 - Hurricane Dennis Figure 22. Plot of Wind Speed and Direction Collected by T1 - Hurricane Katrina...24 Figure 23. Plot of Wind Speed and Direction Collected by T0 - Hurricane Rita...24 Figure 24. Plot of Wind Speed and Direction Collected by T0 - Hurricane Wilma Figure 30. Schematic of FL-18 with preliminary peak minimum pressure results...30 Figure 31. Schematic of FL-19 with preliminary peak minimum pressure results...31 Figure 32. Wind tunnel terrain arrangement for 1:50 suburban exposure...32 Figure 33. Wind Velocity and Turbulence Intensity Profile for 1:50 Suburban Terrain...33 Figure 34. Peak Minima and Maxima External Pressure Coefficients for FL Figure 35. Peak Minima and Maxima External Pressure Coefficients for FL Figure 36. Program Flowchart for the SeeBreeze Visualization Software Figure 37. Screenshot of the SeeBreeze Program...45 Figure 38. Rotated Views of the House Model Showing Pressure Contours...46 FIU Final Report RCMP Year 6: Wind Tunnel Section 6-iii
4 LIST OF TABLES Table 1. List of Storms with Wind Towers Deployments...4 Table FCMP Wind Tower Deployments...7 Table 3. Data Summary from Instrumented Houses Collected in Table 4. FCMP House Identifications and Locations Table 5. Comparison of ARA Model Wind Speeds to Full-scale Wind Speeds...26 Table 6. Preliminary Uncorrected External Pressure Coefficients for FL-18 for Table 7. Preliminary Uncorrected External Pressure Coefficients for FL-19 for FIU Final Report RCMP Year 6: Wind Tunnel Section 6-iv
5 SUMMARY This report summarizes results of Clemson University s continuing field research on wind effects on buildings during the land falling hurricanes of The project goal is to analyze field data of wind pressures and wind tunnel studies on model houses and compare pressure coefficients. The report presents results of full-scale pressure measurements made during tropical cyclones in the 2005 Hurricane season, experimental wind tunnel test results from scale model buildings and a pressure visualization prototype end-user software. Partial results are details are presented through the World-Wide Web. The report was prepared by David O. Prevatt, Ph.D., Assistant Professor and Director of the Wind Load Test Facility at Clemson University. The author wishes to acknowledge the contributions of Clemson University graduate and undergraduate students who participated in this research and assisted with the final preparation of the report. In particular, recognition is paid to two graduate students, Mr. Russell R. Carter who led field investigation exercises and to Mr. Peter L. Datin who carried out full-scale and wind tunnel analyses of pressure data. The author is grateful for the contributions and consultation with Dr. Stanley T. Birchfield, Assistant Professor of Electrical and Computer Engineering at Clemson University and his students for leading the research effort to develop the pressure visualization software. KEYWORDS: Aerodynamics, boundary layer, buildings, wind engineering, full-scale, wind tunnels, suburban terrain, residential. FIU Final Report RCMP Year 6: Wind Tunnel Section 6-v
6 1. PROJECT SCOPE The primary goal of this project is analysis of field data of wind pressures and wind tunnel studies on models of houses located in a typical Florida neighborhood. The pressure measurements were recorded during the passage of four hurricanes during the 2004 Hurricane season. The report presents results on the following sub-tasks described below: Subtask 1 Data Analysis of Field Data on neighborhood houses Five instrumented prototype homes were hit by tropical cyclone-strength winds during 2005, yielding pressure and wind speed data for further analysis. The field data included near-ground level hurricane-strength wind speeds and directions, and pressure measurements from sensors located in critical corner roof areas of houses situated in residential neighborhoods. We performed the following scope: 1. Conduct field investigations at the houses to record location of surrounding buildings, and large obstructions relative to the prototype house. 2. Analyze pressure server data and available wind speed data to derive pressure coefficient time-histories for the houses affected by the hurricanes. Subtask 2 Wind Tunnel Model Studies ASCE 7 wind design pressure coefficients are based on research conducted in boundary layer wind tunnels. There is limited full-scale data available to validate wind load results. Wind tunnel studies on models of the prototype houses need to be compared to fullscale results with wind tunnel studies. Conduct wind tunnel studies to develop a pressure coefficient database to serve as a baseline for future studies that include the wind load variation in open and suburban terrain. 1. Construct 1:50 scale geometrically-similar models of the prototype houses, measure pressures at equivalent locations to full-scale, and determine the pressure coefficients at pressure taps for the incident wind direction of the storm. 2. Compare wind tunnel test results for incident wind with prototype pressure data derived from the houses in the storm direction. FIU Final Report RCMP Year 6: Wind Tunnel Section 6-1
7 Subtask 3 Wind Pressure Visualization To aid in the review and analysis of this data, wind tunnel studies require analysis of very large volumes of data, since a high sampling rate is needed (greater than 400 samples per second) and models need a dense tap array of several hundred pressure taps. Developing prototype end-user visualization software would be vital to achieve this goal. The proposed software should be capable of 3D-display of pressure distributions, and provide flexibility to allow the user view model at any rotation, translation, or scale. 1. Develop a file format to relate the wind pressure statistical data with the 3D building geometry structure and coordinates of the pressure sensors. 2. Write software to parse the statistical data, and to display results in 3D. 2. BACKGROUND Hurricanes remain one of the most costly natural hazards within the United States. The average annual loss due to windstorm damage in the East and Gulf Coast states is about $5 billion. Recent hurricane damage in 2005 from Hurricanes Katrina, Rita and Wilma highlight the vulnerability of residential buildings in coastal areas. Damage from high winds disproportionately affects low-rise residential buildings located along vulnerable coastal areas of the Carolinas, Florida and Gulf States. The provision of reliable scientific information that relates damaging wind speeds with failure loads of building components is needed to evaluate the effectiveness of retrofit and existing structural design of houses and to validate current methodologies for boundary layer wind tunnel tests. The analysis of time-histories of wind speeds and wind-induced pressures on buildings are critical for post-storm engineering analyses of building damage. However, existing anemometers at regional airports typically do not provide the high-quality data on wind characteristics and in many cases, these anemometers typically are switched off or prior to the storm or lose power during the event. In addition, typically the flat, airport terrain FIU Final Report RCMP Year 6: Wind Tunnel Section 6-2
8 around the anemometers are not representative of the rougher suburban environments in which most homes are located. To address this shortfall, the Florida Coastal Monitoring Program, started in 1998, has conducted field measurements of hurricane wind velocities and wind-induced pressures on residential buildings. This related study carries out model scale experiments in Clemson s boundary layer wind tunnel and provides a comparison between full-scale and model scale wind pressures. Until recently there has been very limited data available on the full-scale pressure distribution for low-rise buildings exposed to hurricane-force winds. The majority of previous full-scale and wind tunnel studies (Levitan and Mehta 1992) focused primarily on commercial construction that built in less complex terrain and with simpler building shapes than the typical residential neighborhood. In addition, the few wind tunnel studies on houses used relatively simple house shapes (Holmes 1982) that did not incorporate intersecting roofs and architectural features commonly seen in residential neighborhoods today. Even fewer full-scale wind tunnel results are available for houses located in suburban exposures. As a result, building codes currently provide neither wind pressure coefficients nor sufficient guidance for estimating wind loads for typical residential construction with complex shapes and architectural features. Residential structures typically have suffered more damage than commercial structures, owing to the prescriptive nature of building codes for non-engineered structures and limited wind design guides. There is an urgent need to understand the wind load generated on low- FIU Final Report RCMP Year 6: Wind Tunnel Section 6-3
9 rise buildings and to improve building code provisions to address the design requirements for these unique geometries. 2.1 Sources of Full-Scale Data The FCMP Project In 1998, university research collaboration by Clemson University and Florida International University initiated a program called the Florida Coastal Monitoring Program (FCMP) to conduct research aimed for a better understanding of wind loads that typical houses in suburban areas experience during hurricanes. The FCMP is a research collaboration between Clemson University, University of Florida, Florida International University, and the Institute for Business and Home Safety, which has mobilized research teams before a hurricane makes landfall to place instrumentation on houses in the path of the storm. This instrumentation was developed at Clemson University and consists of two main components, 10-m (33-ft) tall wind towers, pressure-sensors, and data acquisition and communication equipment to measure windinduced pressures on the roofs of buildings (Masters et al 2003). The FCMP program has successfully deployed the wind towers and instrumentation in several storms since 1998 (Table 1). Table 1. List of Storms with Wind Towers Deployments Year Storm 1998 Georges 1999 Dennis Floyd Irene 2000 Gordon 2001 Gabrielle Michelle 2002 Isidore Lili 2003 Isabel 2004 Charley Frances Ivan Jeanne 2005 Dennis Katrina FIU Final Report RCMP Year 6: Wind Tunnel Section 6-4
.")
10 Rita Wilma The following sections briefly explain the main FCMP instrumentation components: Wind Anemometer Towers Portable towers designed to resist 200 mph winds support instruments to measure wind speed at 5 m and 10 m heights, temperature and barometric pressure changes during a hurricane (see Figure 1). Summary wind speed data is collected from each tower and stored on a computer before being transmitted in near real-time to the World Wide Web, Currently six self-powered wind towers are available for deployment. Figure 1. Tower Deployed for Data Collection. FIU Final Report RCMP Year 6: Wind Tunnel Section 6-5
11 Pressure Sensors on Residential Buildings Pre-selected and pre-wired residential structures located in suburban neighborhoods are fitted with pressure sensors prior to a hurricane landfall. Battery operated computers collect the time histories of wind induced pressures from up to 28 absolute pressure transducers installed on the roofs of the buildings. An additional pressure transducer, located either in the attic or in the yard, away from the structure, identified as the reference pressure transducer, is used to monitor changes in atmospheric pressure. This reference pressure gage is necessary to convert pressures measured at roof sensors to the non-dimensional pressure coefficients. 2.2 The 2005 Hurricane Season Deployments 2005 was the most active hurricane season on record, with 28 named storms, with four of those making landfall in the United States. Hurricane Dennis (Figure 2) was the first storm to make landfall, affecting both the Louisiana and Florida coasts. The season was most memorable for Hurricane Katrina (Figure 3), which became the most costly hurricane disaster to hit the US, resulting in over 1800 deaths and over $100 billion in damage. Hurricane Rita (Figure 4) caused several hours of traffic gridlock as residents of Galveston County, Texas, attempted to evacuate the coast. Hurricane Wilma (Figure 5) made landfall in Florida s Gulf Coast and caused damage that included the failures of glass curtain-wall structures in Miami, FL. The FCMP program deployed wind towers in all four events and collected 817 hours of wind speed and directional data (Table 2). Additionally, the five instrumented houses in the FCMP that were hit by hurricane-force winds yielded approximately 204 hours of wind-pressure data (Table 3). Three houses were subjected to hurricane force winds FIU Final Report RCMP Year 6: Wind Tunnel Section 6-6
12 during Hurricane Dennis (peak 3-second gusts of 54 m/s (121 mph)), two in Destin, FL, and one in Navarre, FL (Figure 2). Hurricane Wilma (peak 3-second gusts of 49 m/s (109 mph)) struck the other two houses, one located in Naples, FL, and the other in Marco Island, FL (Figure 5). Table FCMP Wind Tower Deployments. Tower Data Storm Tower Number of Files Hours of Data Dennis T T T Katrina T T T T T Rita T T T T Wilma T T T T FIU Final Report RCMP Year 6: Wind Tunnel Section 6-7

13 Table 3. Data Summary from Instrumented Houses Collected in House Data Storm House No. Number of Files Hours of Data Wind Speed Wind Direction Reference Pressure # of Pressure Taps Dennis FL No Yes Yes 23 FL Yes Yes No 26 FL Yes Yes Yes 20 Wilma FL Yes Yes Yes 26 FL Yes Yes Yes 25 Totals Figure 2. Track of Hurricane Dennis and FCMP Towers and House Locations. FIU Final Report RCMP Year 6: Wind Tunnel Section 6-8
14 Figure 3. Track of Hurricane Katrina and FCMP Towers and House Locations. Figure 4. Track of Hurricane Rita and FCMP Towers and House Locations. FIU Final Report RCMP Year 6: Wind Tunnel Section 6-9
15 Figure 5. Track of Hurricane Wilma and FCMP Towers and House Locations. 3. FULL-SCALE DATA COLLECTION AND ANALYSIS 3.1 Field Surveys of Prototype Houses In January and February 2006, a team of Clemson University civil engineering students, led by Russell Carter and including Peter Datin, Stephen Furr and Kenneth Hill, conducted field surveys of the five houses that were hit by strong winds in the 2005 hurricane season (see Table 4). The team documented the dimensions of the prototype houses and of its immediate neighboring buildings and verified locations of the pressure sensors on the roofs of these buildings. The team used digital photographs of the terrain and surroundings in eight cardinal directions around the house (shown in Figure 6). FIU Final Report RCMP Year 6: Wind Tunnel Section 6-10


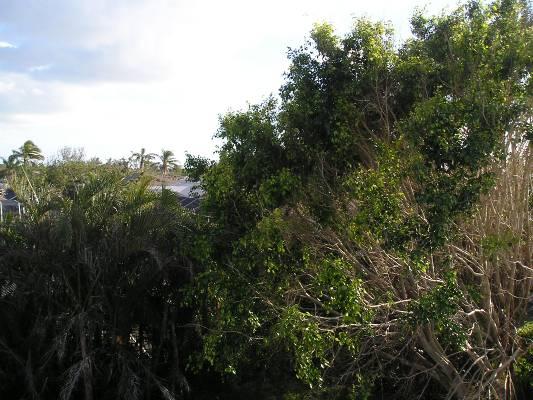
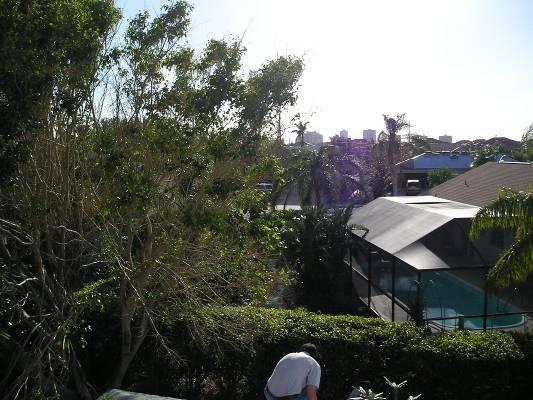
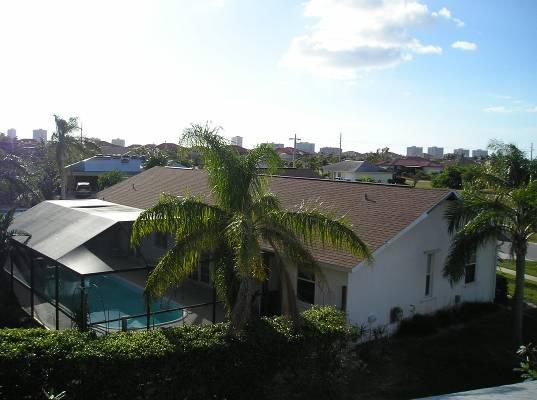
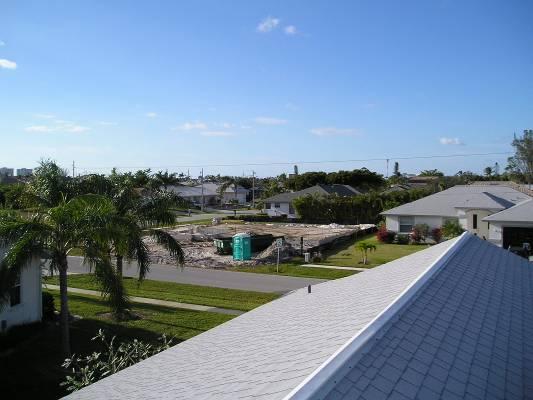
16 North Northeast East Southeast South Southwest West Northwest Figure 6. Cardinal Directions for FL-18. FIU Final Report RCMP Year 6: Wind Tunnel Section 6-11
17 House Identification Number Table 4. FCMP House Identifications and Locations. City, State Hurricane Latitude Longitude Date of Field Survey FL-18 Marco Island, FL Wilma /21/06 FL-19 Naples, FL Wilma /21/06 FL-23 Destin, FL Dennis /3/06 FL-24 Destin, FL Dennis /3/06 FL-26 Navarre, FL Dennis /4/06 Field documentation of neighborhoods is needed in order to create scale models of the prototype building s immediate surroundings in the wind tunnel. Accurate measurements of pressure tap locations are also needed to ensure agreement between the prototype and scale-model structures. Brief descriptions of the prototype houses follows below: Prototype House FL-18 The FL-18 House is a single-story, L-shaped house on Marco Island, Florida (Figure 7). The roof shape consists of inter-connected Dutch-hips and a gable end roof over the garage. The house has extensive lawns with low hedges along the property boundaries (Figure 8). There are a few ornamental trees that are approximately 30 ft or less in height. The surrounding houses are approximately similar in size to the prototype house. FIU Final Report RCMP Year 6: Wind Tunnel Section 6-12
18 35'-4" 30'-2" NORTH 37'-6" 65'-6" ' '-6" Figure 7. Roof Plan of Prototype FL-18 Showing Tap Locations. FIU Final Report RCMP Year 6: Wind Tunnel Section 6-13
.")
19 Figure 8. Front View of Prototype FL Prototype House FL-19 The FL-19 House is a single-story rectangular house measuring approximately 49 ft by 39 ft in plan and approximately 15 ft 7 in tall at the roof ridge (Figure 9). The roof structure is a Dutch-hip shape with low-sloped roofs over the porch at the rear of the home (Figure 10 and 11). Some of the neighboring lots are densely covered with vegetation and trees, while other lots are sparsely covered. Maximum tree height ranges between 30 and 40 ft. FIU Final Report RCMP Year 6: Wind Tunnel Section 6-14
20 39'-1" 9'-5" NORTH '-2" '-10" 11'-7" 16'-3" 8'-2" 11'-8" Figure 9. Roof Plan of Prototype FL-19 Showing Tap Locations. FIU Final Report RCMP Year 6: Wind Tunnel Section 6-15


21 Figure 10. Front View of Prototype FL-19. Figure 11. View of Prototype FL-19 Attached Porch at Rear of House. FIU Final Report RCMP Year 6: Wind Tunnel Section 6-16
22 3.1.3 Prototype House FL-23 The FL-23 House is a single-story house located in Destin, FL, situated in a suburban neighborhood with wide lawns and ornamental plants. The building measures approximately 56 ft by 50 ft in plan and 16 ft 7 in. to the ridge (Figure 12). The roof structure consists of inter-connected gable roof areas (Figure 13). The tree heights in the area range from approximately 16 to 24 ft. The neighboring houses are of similar geometry and height. NORTH '-5" ' " 55'-10" Figure 12. Roof Plan of Prototype FL-23 Showing Tap Locations. FIU Final Report RCMP Year 6: Wind Tunnel Section 6-17
.")
23 Figure 13. Front View of Prototype FL Prototype House FL-24 The FL-24 House is a single-story house located on flat site in Destin, Florida. The building measures approximately 72 ft by 45 ft in plan and is 13 ft 3 in tall at the roof ridge (Figure 14). The roof structure consists of relatively low-sloped inter-connected gable roof areas, and the center section is approximately 6 in. taller than either side (Figure 15). There is a mix of ornamental, deciduous, and pine trees within the neighborhood, ranging in height from 1 to 1.5 times the ridge height of FL-24. The neighboring structures vary in geometry but are of similar height. 6 ft tall wood fences surround most of the backyards in the neighborhood. FIU Final Report RCMP Year 6: Wind Tunnel Section 6-18

24 NORTH ' " '-21 4 " 24'-1" 24' " Figure 14. Roof Plan of Prototype FL-24 Showing Tap Locations. Figure 15. Partial Front View of Prototype FL-24. FIU Final Report RCMP Year 6: Wind Tunnel Section 6-19
25 3.1.5 Prototype House FL-26 The FL-26 House is a single-story ranch house located on flat site in Navarre, Florida. The building measures approximately 56 ft by 54 ft in plan and is about 16 ft tall at the roof ridge (Figure 16). The roof structure consists of a gable-roofed section that intersects with a hip roof section over the principal living area of the structure (Figure 17). There are a few trees surrounding the building in its immediate vicinity and along the east side a pine forest dominates the terrain. A 6 ft high privacy fence divided the adjoining properties. The investigators found that the roof of this building was replaced since Hurricane Dennis, since the pressure sensor brackets are no longer in place. 55'-11" NORTH '-9" ' " ' " Figure 16. Roof Plan of Prototype FL-26 Showing Tap Locations. FIU Final Report RCMP Year 6: Wind Tunnel Section 6-20

26 Figure 17. Front View of Prototype FL Full-Scale Analysis of Pressure coefficients Data Collection Prior to the landfalls of the storms, we installed approximately 25 to 28 absolute pressure sensors (Michot 1999) on the roofs of the prototype houses locating sensors at corners, near eaves and ridges. We installed a wind anemometer (3-cup and vane) to monitor the wind velocity and direction at the edge of the roof at ridge height of the roof. Note that each house had been pre-wired and had unobtrusive metal cleats installed on the roofs in order to facilitate rapid installation of sensors and data collection equipment. We setup sturdy house boxes containing a data acquisition computer and battery power to collect and store pressures and wind speed data during the passage of the hurricane. The computer interface is written in C++ programming language and data is collected at 100 samples per second and stored in 15 min long files for the duration of the storm. A FIU Final Report RCMP Year 6: Wind Tunnel Section 6-21

27 typical data record for one house would contain 150 to 200 files covering 30 to 40 hours. The wind speed data from the 3-cup anemometer is reported directly in mph and is a 3- second gust wind speed. Figure 20. Aerial View of Tower T0 Location During Hurricane Katrina. 3.3 Near Real-time Updates Once a portable tower is located and starts collecting data it uplinks to the FCMP database via cell phone every 15 minutes. The summary tower data collected and processed by the laptop Tower XP data acquisition system is uploaded. The data summary includes the wind speeds for different averaging times, longitudinal and lateral FIU Final Report RCMP Year 6: Wind Tunnel Section 6-22
28 turbulence intensity, temperature, relative humidity, and barometric pressure. The two most predominantly used numbers are the 3 sec gust speed and the 60 sec mean wind speed from the 10 m anemometers. 3.4 Validated Wind Speed Summary After each hurricane, the data record updates include validated plots of the wind speed recorded by each tower (Figure 21 to 24). The data joins results from individual 15 minute data files into a single graph showing wind speed and direction for the entire time the tower was operational before during and after the peak winds of the hurricane. The data plot is set to the coordinated universal time (UTC) and plotted for various averaging times. Figure 21. Plot of Wind Speed and Direction Collected by T3 - Hurricane Dennis. FIU Final Report RCMP Year 6: Wind Tunnel Section 6-23
29 Figure 22. Plot of Wind Speed and Direction Collected by T1 - Hurricane Katrina. Figure 23. Plot of Wind Speed and Direction Collected by T0 - Hurricane Rita. FIU Final Report RCMP Year 6: Wind Tunnel Section 6-24
30 Figure 24. Plot of Wind Speed and Direction Collected by T0 - Hurricane Wilma. 3.5 Data Analysis For every pressure sensor output reading, we used a pressure calibration chart to convert raw voltage to engineering units (i.e. pound per square foot (psf)). We used the pressure values obtained at a reference sensor located a short distance away from the house to establish changes in ambient barometric pressure. We subtracted this barometric pressure reading from each roof top sensor value and made temperature corrections to obtain the wind-induced pressures on the roof, as developed in (Dearhart 2003). FIU Final Report RCMP Year 6: Wind Tunnel Section 6-25
31 3.6 Wind Speed Data and Pressure Coefficients Applied Research Associates (ARA), Raleigh, NC provided the simulated wind speed and directional information used in this analysis. We selected this data because it is based on a wide collection of independent data sources and has its methodology has shown to provide reasonable results. A comparison of the ARA s simulated wind speed and the measured wind speed for each of the houses is provided in Table 5. The ARA model simulated wind speeds in open terrain at 10 m height and we adjusted these values, using theoretical conversion (Simiu, 1996), to reflect the 3 sec gust speed to suburban terrain and ridge height of the house roof. In our analysis, we used the wind speed estimates developed by Applied Research Associates (ARA 2006) provided in Figures 25 through 29. Table 5. Comparison of ARA Model Wind Speeds to Full-scale Wind Speeds. House Peak 3 Sec. Gust Wind Speed (mph) 1 ARA Model Data Corrected Peak 3 Sec. Gust Wind Speed (mph) 2 Wind Direction (degrees) Peak 3 Sec. Gust Speed (mph) 3 Full Scale Data Peak 15 Min. Wind Speed (mph) 3 Wind Direction (degrees) FL N/A N/A N/A FL N/A N/A N/A FL N/A N/A N/A FL N/A FL N/A 1. Simulated in open terrain at 10 meter height. 2. Corrected for suburban terrain at mean roof height. 3. Peak wind speeds were measured at roof height and in suburban terrain. We adjusted the roof pressure measurements for atmospheric pressure and temperature changes during the storm. We used temperature measurements from the FIU Final Report RCMP Year 6: Wind Tunnel Section 6-26
32 meteorological towers located near to the prototype houses for temperature corrections. Using the roof pressure and wind speed we calculated the external pressure coefficients at the sensor locations on the roof using the formula given below: C p P = Eqn V Simulated Wind Speed and Direction for FL-18 During Hurricane Wilma Coordinates: N Latitude and W Longitude Gust wind speed (3 sec) in open terrain Direction Maximum Wind Speed is 110 mph at 319 degrees Wind Gust Speed (mph) Wind Direction (degrees) 10/22/ :36 10/22/ :12 10/22/ :48 10/23/2005 2:24 10/23/2005 6:00 10/23/2005 9:36 10/23/ :12 10/23/ :48 10/23/ :24 10/24/2005 0:00 10/24/2005 3:36 Time (hours) 10/24/2005 7:12 10/24/ :48 10/24/ :24 10/24/ :00 10/24/ :36 10/25/2005 1:12 10/25/2005 4:48 10/25/2005 8:24 Figure 25. ARA s modeled wind speed and direction at the FL-18 site. FIU Final Report RCMP Year 6: Wind Tunnel Section 6-27
33 Simulated Wind Speed and Direction for FL-19 During Hurricane Wilma Coordinates: N Latitude and W Longitude 120 Gust wind speed (3 sec) in open terrain Direction Maximum Wind Speed is 104 mph at 355 degrees Wind Gust Speed (mph) Wind Direction (degrees) 0 10/22/ :36 10/22/ :12 10/22/ :48 10/23/2005 2:24 10/23/2005 6:00 10/23/2005 9:36 10/23/ :12 10/23/ :48 10/23/ :24 10/24/2005 0:00 10/24/2005 3:36 Time (hours) 10/24/2005 7:12 10/24/ :48 10/24/ :24 10/24/ :00 10/24/ :36 10/25/2005 1:12 10/25/2005 4:48 10/25/2005 8:24 0 Figure 26. ARA s modeled wind speed and direction at the FL-19 site. Simulated Wind Speed and Direction for FL-23 During Hurricane Dennis Coordinates: N Latitude and W Longitude Gust wind speed (3 sec) in open terrain Direction Maximum Wind Speed is 78 mph at 133 degrees Wind Gust Speed (mph) Wind Direction (degrees) 0 7/9/ :48 7/10/2005 2:24 7/10/2005 6:00 7/10/2005 9:36 7/10/ :12 7/10/ :48 7/10/ :24 7/11/2005 0:00 Time (hours) 7/11/2005 3:36 7/11/2005 7:12 7/11/ :48 7/11/ :24 7/11/ :00 7/11/ :36 0 Figure 27. ARA s modeled wind speed and direction at the FL-23 site. FIU Final Report RCMP Year 6: Wind Tunnel Section 6-28
34 Simulated Wind Speed and Direction for FL-24 During Hurricane Dennis Coordinates: N Latitude and W Longitude Gust wind speed (3 sec) in open terrain Direction Maximum Wind Speed is 85 mph at 109 degrees Wind Gust Speed (mph) Wind Direction (degrees) 0 0 7/10/2005 9:36 7/10/ :12 7/10/ :48 7/10/ :24 7/11/2005 0:00 7/11/2005 3:36 7/11/2005 7:12 7/11/ :48 7/11/ :24 7/11/ :00 7/11/ :36 Time (hours) Figure 28. ARA s modeled wind speed and direction at the FL-24 site. Simulated Wind Speed and Direction for FL-26 During Hurricane Dennis Coordinates: N Latitude and W Longitude Gust wind speed (3 sec) in open terrain Direction Maximum Wind Speed is 117 mph at 141degrees Wind Gust Speed (mph) Wind Direction (degrees) 0 7/9/ :48 7/10/2005 2:24 7/10/2005 6:00 7/10/2005 9:36 7/10/ :12 7/10/ :48 7/10/ :24 7/11/2005 0:00 Time (hours) 7/11/2005 3:36 7/11/2005 7:12 7/11/ :48 7/11/ :24 7/11/ :00 7/11/ :36 0 Figure 29. ARA s modeled wind speed and direction at the FL-26 site. FIU Final Report RCMP Year 6: Wind Tunnel Section 6-29
35 3.7 Pressure Results FL-18 Prototype House The FL-18 House experienced a peak 3-second gust wind speeds of 31 m/s (70 mph) during Hurricane Wilma, from a direction of 355 degrees NORTH Tap C p 1 NA Figure 30. Schematic of FL-18 with preliminary peak minimum pressure results. FIU Final Report RCMP Year 6: Wind Tunnel Section 6-30
36 The FL-18 House experienced a peak 3-second gust wind speeds of 31 m/s (70 mph) during Hurricane Wilma, from a direction of 355 degrees NORTH Tap C p 1 NA Figure 31. Schematic of FL-19 with preliminary peak minimum pressure results. FIU Final Report RCMP Year 6: Wind Tunnel Section 6-31
37 4. WIND TUNNEL TESTING 4.1 Wind Tunnel Testing We conducted wind tunnel studies on models of the prototype structures in the atmospheric boundary layer wind tunnel at the Wind Load Test Facility (WLTF) of Clemson University. This open flow boundary layer wind tunnel has a working section that measures 3 m (10 ft) wide and 2 m (6.7 ft) high and overall length of 30 m (100 ft). We simulated upwind terrain at 1:50 geometric scale and modeled the velocity and turbulence intensity profiles to model suburban exposure. Details of the tunnel set up (Figure 25) and instrumentation are provided by Chen (Chen 2000). We established the velocity and turbulence intensity profiles by using a combination of spires measuring mm (9.5 in) wide at the top and mm (16 in) wide at the base), a 25.4 mm x mm (1 in x 8 in) trip board at the based of the spires, and 76.2 mm (3 in) cube roughness elements randomly installed along the wind tunnel floor to simulate suburban terrain roughness. 3@9x16" spires 1x8" tripboard 10' 44' 4' Turn table 3" Cubes Blank 1:50 Suburban Terrain Exposure Setting Figure 32. Wind tunnel terrain arrangement for 1:50 suburban exposure. FIU Final Report RCMP Year 6: Wind Tunnel Section 6-32
38 We obtained the simulated mean wind velocity and turbulence intensity profiles shown in Figure 26. We compared the measurements with the log-law which showed good agreement with a velocity profile roughness element z 0 =0.4 m. Height (m) Turbulence Intensity U/Uref ( z0=0.40 m) U/Uref ( z0=0.15 m) ASCE 7 minimum U/Uref ( z0=0.7 m) ASCE 7 maximum Wind Tunnel U/Uref Wind Tunnel lu lu ( z0=0.40 ) U/Uref Figure 33. Wind Velocity and Turbulence Intensity Profile for 1:50 Suburban Terrain. 4.2 Models We constructed the pressure tap models of the prototype houses using 5.6 mm (0.22 in) thick acrylic sheet and 1.6 mm (0.063 in) diameter stainless steel pressure taps installed at the locations of the full-scale pressure sensors. We modeled the surrounding houses FIU Final Report RCMP Year 6: Wind Tunnel Section 6-33
39 out of blue extruded 50.8 mm (2 in) and 76.2 mm (3 in) polystyrene sheets that were then glued together with silicone sealant. 4.3 Data Collection The wind tunnel data collection system uses a Scanivalve Corporation USB based data acquisition system, consisting of Scanivalve ZOC33/64PX miniature pressure scanners. Each pressure tap on the model is attached to the pressure scanner using 1.6 mm (0.063 in) I.D. vinyl tubing. The pressure scanners are connected to a 16-bit RAD A/D3200 analog-to-digital converter that converts the analog pressure data to digital format for input to the computer. The A/D3200 is mounted into a RADBASE 3200 that includes the USB system to relay the digital data to a control/storage computer. The data acquisition system is software controlled linked to the storage computer through a Telnet protocol over the wind tunnel s Ethernet/Fiber Optic internet system. We took 120 seconds of data sampled at 300 Hz for each wind direction measured. We varied the wind direction in 10-degree intervals for 360. We analyzed the wind tunnel pressure data collected for each of the 36 wind directions on 1:50 scale models in flat suburban terrain conditions. Summary statistics are provided in Figures 27 and 28 below (Note: top value is peak minima / bottom value is peak maxima pressure coefficients.) FIU Final Report RCMP Year 6: Wind Tunnel Section 6-34
40 Key Peak Min Peak Max NORTH Figure 34. Peak Minima and Maxima External Pressure Coefficients for FL-18. FIU Final Report RCMP Year 6: Wind Tunnel Section 6-35
41 Key Peak Min Peak Max NORTH Figure 35. Peak Minima and Maxima External Pressure Coefficients for FL Comparison of Full-Scale and Model-Scale Pressure Data The peak external measured minimum (negative) pressure coefficients from the fullscale data are compared to that of the model-scale tests for corresponding angle of attack in Tables 6 and 7 below. The external pressure coefficients from FL-18 and FL- 19 presented are preliminary values and further analysis and validation are continuing. The lack of reliable wind speed data from non-functional anemometers at the houses did not provide independent validation of ARA s simulated wind speed used for the determination of pressure coefficients. FIU Final Report RCMP Year 6: Wind Tunnel Section 6-36
42 Table 6. Preliminary Uncorrected External Pressure Coefficients for FL-18 for 320. Full - Scale Analysis Wind Tunnel Test Tap C p Minimum C p Maximum C p C p Minimum C p Maximum C p 1 N/A N/A N/A FIU Final Report RCMP Year 6: Wind Tunnel Section 6-37
43 Table 7. Preliminary Uncorrected External Pressure Coefficients for FL-19 for 355. Full Scale Analysis Wind Tunnel Test Tap C p Minimum C p Maximum C p C p Minimum C p Maximum C p FIU Final Report RCMP Year 6: Wind Tunnel Section 6-38
44 5. WIND PRESSURE VISUALIZATION SOFTWARE Prototype wind pressure visualization software has been written to display 3D pressure distributions overlaid on a building. With this software, an end user can analyze and interact with wind pressure data by immediately viewing the data from different locations, and by observing the impact of various statistical analyses of the data. A basic flowchart of the program is shown in the figure below. Start program Parse file Open file Load wind pressure data Wait for user input Change wind direction Interpolate data Exit program Change viewing direction Compute visualization contours Display contours Figure 36. Program Flowchart for the SeeBreeze Visualization Software. 5.1 Background Previous researchers have attempted to visualize wind pressures on buildings (Banks et al. 2000). This has been a common problem in wind tunnel testing for some time. Studies on flat roofs have shown that the largest mean and peak suction values are observed for taps beneath the conical `delta-wing type' corner vortices that occur for oblique winds. It has been assumed that similar results occur on sloped roofs, but to date no studies have confirmed the phenomenon. Since most buildings of a non- FIU Final Report RCMP Year 6: Wind Tunnel Section 6-39
45 residential nature do not have this problem, studies have not been conducted on sloped roofs. The effect of aerodynamic buffeting around two- and three-dimensional bluff bodies in tandem was investigated by (Havel 2001), for moderate Reynolds number, turbulent flows. Havel combined flow visualizations, surface pressure and velocity measurements, changes in aerodynamic loading and macroscale flow features to study the phenomena. The civil engineer is concerned mostly with the surface pressures generated. Prior research has investigated other means to visualize the flow. (Lopes 1997) developed a graphical use interface, FlowVis, as a visualization tool for graphical postprocessing of data defined in a 2D or 3D raster grid. Written in the C programming language, this software provides a quick and efficient way to display analysis results obtained either from numerical models or experimental setup. More recent work has sought to process the visual information in a form that is more usable (Machacek and Rosgen 2001). The authors developed a measurement system using a stereo arrangement of two CCD cameras to visualize, classify (based on topological features) and quantify complex flows in large scale wind tunnel experiments. The authors proposed using topological features of the flow, e.g. stream lines, separation and reattachment regions, stagnation points and vortex lines are extracted directly and preferably visualized in real-time in a virtual wind tunnel environment. The system is based on a three dimensional particle tracking method (3D-PTV) using a stereo arrangement of two CCD cameras. A frame rate of 120 frames per second allows measurements at high flow velocities. For the 3D-PTV method an approach is taken FIU Final Report RCMP Year 6: Wind Tunnel Section 6-40
46 where the tracer particles are recorded such that consecutive frames form continuous path lines. The 3-dimensional positions and shapes of the particle path lines are reconstructed by means of the epipolar constraint and the stereo camera model. The particle path segments which contain both velocity and topological information are then analysed to extract the relevant information. Neutrally buoyant helium bubbles are used as tracer particles. Matching the density of the ambient air, the bubbles are ideal flow tracers in this respect. Finally the closest project to what was discussed for the wind tunnel was by (Uselton 1998) who developed software to apply visualization techniques to aeronautics data collected during wind tunnel experiments. Interaction between the software developers and the wind engineers has been crucial in making the software useful to these particular users. The interaction has also been important in building the scientists' confidence in the use of interactive, computer-mediated analysis tools. The motivation for this work stems from the available database of wind tunnel studies and the need to determine new uses. Full scale data from the FCMP houses will provide real-world pressure variations. With the help of the wind tunnel the researchers will be able to determine the maximum loaded areas on houses. The purpose of this study is to identify the common features in a house that contribute to extreme pressure values. The objective of this software is to utilize wind tunnel pressure data to generate contour plots on residential buildings. The program will allow for rapid comparison of the variability of wind pressures with wind direction and variation among different building shapes and with different terrain conditions. FIU Final Report RCMP Year 6: Wind Tunnel Section 6-41
47 5.2 Structure of the Program The wind tunnel data results is collected from the experimental output and stored in very large data files (typically about 30 GB per test), containing information on the building geometry, tap locations, and wind pressure data (min, max, and mean) for all the taps and sampling instants. The location of the pressure taps on the building surfaces are stored in x, y co-ordinates related to each planar surface. The pressure coefficient information is stored in this file for each wind direction, and there are several files used for a complete experiment, to cover all wind directions tested. An interpolation algorithm was needed to convert the individual pressure tap readings into contours displayed on a 2-dimensional plane. Several methodologies were attempted to see which would work, including nearest neighbor and linear interpolation. The v4 algorithm included in the Matlab code has been used in the past by Clemson s WLTF wind engineering researchers with reasonable results. However, after trial and error the SeeBreeze development team selected a weighted averaging algorithm as the initial methodology, because it was simpler to implement and provides reasonable results. The interpolation algorithm computes the color of the pixel at location (x,y) on a surface as follows: For each tap i on the surface, o Compute the distance d i from the pixel location to the tap (in our implementation di is computed on the full-scale model in inches) o Compute the inverse exponential π i = exp( - d i ) Compute the normalization constant by summing the values of all taps: z = π i i FIU Final Report RCMP Year 6: Wind Tunnel Section 6-42
48 Compute the interpolated pressure value using a weighted average of the taps: p( x, y) = π i pi / z i Use table lookup to determine the color associated with p(x,y), given the current color map The visualization software, called SeeBreeze, for parsing the file and displaying the data was written primarily in the Spring 2006 semester by students in a combined senior-level / graduate-level Software Engineering course in the Electrical and Computer Engineering Department at Clemson. Two of the students from the class continued to work on the project during the summer to refine and extend the capabilities of the software. The code was written in Visual C++ with MFC for controlling the basic window functionality and OpenGL for rendering the data in 3D. Writing the code in C++ has enabled us to achieve display speeds far greater than are possible with higher-level languages such as Matlab. The software uses a novel file format that we have developed specifically for this project that is divided into four sections. First, the coordinates of the vertices of the wireframe building are stored. Secondly, the sequence of vertices that define the various surfaces of the building are recorded. Thirdly, the file contains the format of the filenames containing the sensor coordinates and actual wind data, along with the actual wind directions contained in those files. Finally, auxiliary data such as the offset of the coordinate systems of the sensors and building surfaces is stored. Being composed of ASCII text, this file is easily edited by the user by hand. FIU Final Report RCMP Year 6: Wind Tunnel Section 6-43
49 In this prototype version the SeeBrreeze software can be used to display statistical data (mean, peak minimum, peak maximum and standard deveiations) of the pressure coefficients on a geometrically complex roof structure. Future versions of thesoftware will include the ability to display time-history data that illustrates the spatial and temporal variations of wind pressures, as well as press-coefficients data from wall and other building surfaces. 5.3 Results A screenshot of the wind pressure overlaid on a residential building (the FIU 1 house) is shown in the figure below. By clicking and dragging the mouse, the user can translate and rotate around the building, as well as zoom in and out. The arrows on the menu bar allow the user to change the wind direction, which is shown both by the black arrow to the right of the house, as well as the value along the right side of the status bar at the bottom of the window. In addition to the mean of the data over time, which is displayed in this example, the user may also choose to display the minimum or maximum instead. FIU Final Report RCMP Year 6: Wind Tunnel Section 6-44

50 Figure 37. Screenshot of the SeeBreeze Program Views of this house from several different directions are shown below. Such views are obtained in real time as the mouse is dragged, thus providing instantaneous visualizations of the data from arbitrary viewpoints. The same is true for changing the wind direction. Future versions of the software are expected to allow the user to change the time instant as well. FIU Final Report RCMP Year 6: Wind Tunnel Section 6-45


51 Figure 38. Rotated Views of the House Model Showing Pressure Contours. 5.4 Web Page Further information is provided on the program and the course instruction at and the course information is provided at Real-time updates of the progress of the field deployment during the hurricane landfall can be tracked at the Florida Coastal Monitoring Program (FCMP) website at Through the FCMP website people can monitor the deployments of the towers and locations of full-scale prototype buildings in relation to the hurricane path. 6. CONCLUSIONS The data collection possible during the 2005 hurricane season and the novel development of pressure visualization software program has advanced available knowledge on the wind-structure interactions for residential structures. Several iterations are yet required to validate these preliminary results and provide final comparative data between the wind tunnel and full-scale experiments. FIU Final Report RCMP Year 6: Wind Tunnel Section 6-46
Wind Tower Deployments and Pressure Sensor Installation on Coastal Houses Preliminary Data Summary _ Sea Grant Project No.
 Wind Tower Deployments and Pressure Sensor Installation on Coastal Houses Preliminary Data Summary _ Sea Grant Project No.:1020040317 Submitted to: South Carolina Sea Grant Consortium 287 Meeting Street
Weather Middle School Teacher Instructions and Activity
 Weather Middle School Teacher Instructions and Activity Based on the guidelines of the Saffir-Simpson Scale for hurricane severity and the Fujita Scale for tornado damage, students will write a brief synopsis
Windborne debris risk analysis - Part II. Application to structural vulnerability modeling
 Wind and Structures, Vol. 13, No. 2 (2010) 207-220 207 Windborne debris risk analysis - Part II. Application to structural vulnerability modeling Ning Lin*, Erik Vanmarcke and Siu-Chung Yau Department
Wind Engineering Research at UIUC
 Wind Engineering Research at UIUC Franklin T. Lombardo (and students) Assistant Professor University of Illinois at Urbana-Champaign Department of Civil and Environmental Engineering THE Conference Illini
Date: 27 April UF Research Contract Number: Project Date: Project Start: 6 November 2017 Project End: 30 June 2018
 Date: 27 April 2018 Project: Performance of Single-Family Residential Buildings in Hurricane Irma Evaluating the Impact of the 1st March 2002 Florida Building Code and Homeowner/Occupant Survey on Risk
Kimberly J. Mueller Risk Management Solutions, Newark, CA. Dr. Auguste Boissonade Risk Management Solutions, Newark, CA
 1.3 The Utility of Surface Roughness Datasets in the Modeling of United States Hurricane Property Losses Kimberly J. Mueller Risk Management Solutions, Newark, CA Dr. Auguste Boissonade Risk Management
Surviving Nature s Fury:
 Surviving Nature s Fury: Performance of Asphalt Shingle Roofs in the Real World Zhuzhao Liu, Research Engineer, Institute for Business & Home Safety, 4775 E. Fowler Ave., Tampa, FL 33617, zliu@ibhs.org
Severe Weather: Tornadoes and Hurricanes
 Severe Weather: Tornadoes and Hurricanes Tornadoes Grab Toto!! TORNADOES Are a low pressure storm that usually forms over land in an average year, 800 tornadoes are reported in the U.S. a tornado is defined
The Saffir-Simpson Hurricane Wind Scale
 The Saffir-Simpson Hurricane Wind Scale The Saffir-Simpson Hurricane Wind Scale is a one to five categorization based on the hurricane's intensity at the indicated time. The scale provides examples of
Standard Practices for Air Speed Calibration Testing
 Standard Practices for Air Speed Calibration Testing Rachael V. Coquilla Bryza Wind Lab, Fairfield, California Air speed calibration is a test process where the output from a wind measuring instrument
The Worst Places for Hurricanes
 The Worst Places for Hurricanes Hurricane Hotspots By now, everyone knows that the last two hurricane seasons have been particularly severe. Severe yes, but compared to what? Hurricane experts are saying
Using Remote Sensing Technologies to Improve Resilience
 4 Using Remote Sensing Technologies to Improve Resilience Ronald T. Eguchi CEO, ImageCat, Inc. 6 years ago The world had just survived the Y2K bug with no major incidents Nations around the world commit
LECTURE #18: Hurricane Damage, Monitoring & Case Study
 GEOL 0820 Ramsey Natural Disasters Spring, 2018 LECTURE #18: Hurricane Damage, Monitoring & Case Study Date: 27 March 2018 I. Exam II grades now posted online o high: 98, low: 46, average: 80 (~3 points
NEWSLETTER - OCTOBER 2012
 NEWSLETTER - OCTOBER 2012 A word from our Chairman The Cyclone Testing Station continues to focus on sustainable and economical buildings that have adequate resistance to wind events. To support that process,
Hurricane Irma. Willis Re Hurricane Damage Survey Report. Executive Summary
 Willis Re Hurricane Damage Survey Report Hurricane Irma Willis Re s post-event field damage survey report Representatives from Willis Re spent four days in the field assessing the damage caused by Hurricane
MEASUREMENT, VALIDATION, ANALYSIS AND DISSEMINATION OF HURRICANE WIND DATA LUIS D. APONTE-BERMUDEZ
 MEASUREMENT, VALIDATION, ANALYSIS AND DISSEMINATION OF HURRICANE WIND DATA By LUIS D. APONTE-BERMUDEZ A REPORT PRESENTED TO THE GRADUATE SCHOOL OF THE UNIVERSITY OF FLORIDA IN PARTIAL FULFILLMENT OF THE
Hurricane Wilma Post Storm Data Acquisition Estimated Peak Wind Analysis and Storm Tide Data. December 27, 2005
 Hurricane Wilma Post Storm Data Acquisition Estimated Peak Wind Analysis and Storm Tide Data December 27, 2005 Hurricane Wilma was the sixth major hurricane of the record-breaking 2005 Atlantic hurricane
IBHS Roof Aging Program Data and Condition Summary for 2015
 IBHS Roof Aging Program Data and Condition Summary for 2015 Ian M. Giammanco Tanya M. Brown-Giammanco 1 Executive Summary In 2013, the Insurance Institute for Business & Home Safety (IBHS) began a long-term
An Assessment of the Climatology of Florida Hurricane-Induced Tornadoes (HITs): Technology versus Meteorology
: Technology versus Meteorology") 5218 J O U R N A L O F C L I M A T E VOLUME 24 An Assessment of the Climatology of Florida Hurricane-Induced Tornadoes (HITs): Technology versus Meteorology ERNEST M. AGEE AND ALYSSA HENDRICKS Department
5218 J O U R N A L O F C L I M A T E VOLUME 24 An Assessment of the Climatology of Florida Hurricane-Induced Tornadoes (HITs): Technology versus Meteorology ERNEST M. AGEE AND ALYSSA HENDRICKS Department
NR402 GIS Applications in Natural Resources
 NR402 GIS Applications in Natural Resources Lesson 1 Introduction to GIS Eva Strand, University of Idaho Map of the Pacific Northwest from http://www.or.blm.gov/gis/ Welcome to NR402 GIS Applications in
THE 3D SIMULATION INFORMATION SYSTEM FOR ASSESSING THE FLOODING LOST IN KEELUNG RIVER BASIN
 THE 3D SIMULATION INFORMATION SYSTEM FOR ASSESSING THE FLOODING LOST IN KEELUNG RIVER BASIN Kuo-Chung Wen *, Tsung-Hsing Huang ** * Associate Professor, Chinese Culture University, Taipei **Master, Chinese
STORM HISTORY FOR COLLIER COUNTY
 STORM HISTORY FOR COLLIER COUNTY In 1960, when hurricane 'Donna' struck, there were approximately 15,500 people living full time in Collier County. Today there are more than 330,000 residents, most of
Quick Response Report #126 Hurricane Floyd Flood Mapping Integrating Landsat 7 TM Satellite Imagery and DEM Data
 Quick Response Report #126 Hurricane Floyd Flood Mapping Integrating Landsat 7 TM Satellite Imagery and DEM Data Jeffrey D. Colby Yong Wang Karen Mulcahy Department of Geography East Carolina University
WEATHER ON WHEELS Elementary School Program
 WEATHER ON WHEELS Elementary School Program MAST ACADEMY OUTREACH On-Site Packet Miami-Dade County Public Schools Miami, Florida MAST ACADEMY OUTREACH WEATHER ON WHEELS ELEMENTARY ON-SITE HIGHLIGHTS PACKET
Forecast Predictions of Winds, Waves and Storm Surge during Hurricane Arthur (2014)
") Forecast Predictions of Winds, Waves and Storm Surge during Hurricane Arthur (2014) R Cyriac 1, JC Dietrich 1, JG Fleming 2, BO Blanton 3, RA Luettich Jr 4, C Kaiser 5 1 Dept. of Civil, Construction, and
Forecast Predictions of Winds, Waves and Storm Surge during Hurricane Arthur (2014) R Cyriac 1, JC Dietrich 1, JG Fleming 2, BO Blanton 3, RA Luettich Jr 4, C Kaiser 5 1 Dept. of Civil, Construction, and
Development of Operational Storm Surge Guidance to Support Total Water Predictions
 Development of Operational Storm Surge Guidance to Support Total Water Predictions J. Feyen 1, S. Vinogradov 1,2, T. Asher 3, J. Halgren 4, Y. Funakoshi 1,5 1. NOAA/NOS//Development Laboratory 2. ERT,
Careful, Cyclones Can Blow You Away!
 Title: Careful, Cyclones Can Blow You Away! (Meteorology) Grade(s): 6-8 Introduction: Most people associate twisters with tornadoes, but in fact tropical twisters come from hurricanes. Hurricanes are what
2d-Laser Cantilever Anemometer
 2d-Laser Cantilever Anemometer Introduction Measuring principle Calibration Design Comparative measurement Contact: Jaroslaw Puczylowski University of Oldenburg jaroslaw.puczylowski@forwind.de Introduction
WIND DATA REPORT FOR THE YAKUTAT JULY 2004 APRIL 2005
 WIND DATA REPORT FOR THE YAKUTAT JULY 2004 APRIL 2005 Prepared on July 12, 2005 For Bob Lynette 212 Jamestown Beach Lane Sequim WA 98382 By John Wade Wind Consultant LLC 2575 NE 32 nd Ave Portland OR 97212
Estimating the 3-Second Gust on Rooftops of Residential and Low-Rise Buildings during a Hurricane
 Global Journal of Researches in Engineering Civil And Structural Engineering Volume 13 Issue 5 Version 1.0 Type: Double Blind Peer Reviewed International Research Journal Publisher: Global Journals Inc.
MAST ACADEMY OUTREACH. WOW (Weather on Wheels)
") MAST ACADEMY OUTREACH ELEMENTARY PROGRAM Adventures Aboard WOW (Weather on Wheels) Teacher Instructions / Answer Keys MAST Academy Maritime and Science Technology High School Miami-Dade County Public Schools
MAST ACADEMY OUTREACH ELEMENTARY PROGRAM Adventures Aboard WOW (Weather on Wheels) Teacher Instructions / Answer Keys MAST Academy Maritime and Science Technology High School Miami-Dade County Public Schools
30 If Vmax > 150, HSI intensity pts = 25
 Hurricane Severity Index: A New Way of Estimating a Tropical Cyclone s Destructive Potential 1. Introduction Christopher G. Hebert*, Robert A. Weinzapfel*, Mark A. Chambers* Impactweather, Inc., Houston,
Your Task: Read each slide then use the underlined red or underlined information to fill in your organizer.
 Severe Weather: Tornadoes and Hurricanes Thunderstorms and Lightning S6E4 d. Construct an explanation of the relationship between air pressure, weather fronts, and air masses and meteorological events
KCC White Paper: The 100 Year Hurricane. Could it happen this year? Are insurers prepared? KAREN CLARK & COMPANY. June 2014
 KAREN CLARK & COMPANY KCC White Paper: The 100 Year Hurricane Could it happen this year? Are insurers prepared? June 2014 Copyright 2014 Karen Clark & Company The 100 Year Hurricane Page 1 2 COPLEY PLACE
Caribbean Tropical Cyclone Modeling
 Caribbean Tropical Cyclone Modeling Filmon Habte, PhD 2018 RAA Catastrophe Risk Management Conference Orlando, Florida February 14, 2018 Agenda Hurricane risk in the Caribbean 2017 hurricane season Lessons
2015 Hurricane Season BY: STORM TEAM 8 METEOROLOGIST JULIE PHILLIPS
 2015 Hurricane Season BY: STORM TEAM 8 METEOROLOGIST JULIE PHILLIPS FORECAST COLORADO STATE UNIVERSITY FORECAST IS CALLING FOR ONE OF THE LEAST ACTIVE SEASONS SINCE THE MID 20 TH CENTURY! THE OFFICIAL
Welcome Jeff Orrock Warning Coordination Meteorologist National Weather Service Raleigh
 Welcome Jeff Orrock Warning Coordination Meteorologist National Weather Service Raleigh Jeff.orrock@noaa.gov Sources: Operational Significant Event Imagery and the Environmental Applications Team (EAT)
Review of Anemometer Calibration Standards
 Review of Anemometer Calibration Standards Rachael V. Coquilla rvcoquilla@otechwind.com Otech Engineering, Inc., Davis, CA Anemometer calibration defines a relationship between the measured signals from
Analysis & Optimization of Electricity Infrastructure Hardening Measures
 Analysis & Optimization of Electricity Infrastructure Hardening Measures Workshop for Research in Electricity Infrastructure Hardening Gainesville, FL June 9, 2006 Francis M Lavelle, PhD, PE Applied Research
SURGE IMPACT LOADING ON WOOD RESIDENTIAL STRUCTURES
 SURGE IMPACT LOADING ON WOOD RESIDENTIAL STRUCTURES Jason Miles, REU (Research Experience for Undergraduates) Student Home Institution: Louisiana State University REU Institution: Oregon State University
Application of high-resolution (10 m) DEM on Flood Disaster in 3D-GIS
 DEM on Flood Disaster in 3D-GIS") Risk Analysis V: Simulation and Hazard Mitigation 263 Application of high-resolution (10 m) DEM on Flood Disaster in 3D-GIS M. Mori Department of Information and Computer Science, Kinki University, Japan
Risk Analysis V: Simulation and Hazard Mitigation 263 Application of high-resolution (10 m) DEM on Flood Disaster in 3D-GIS M. Mori Department of Information and Computer Science, Kinki University, Japan
Tracking Storm Tide and Coastal Flooding During Hurricane Matthew
 Tracking Storm Tide and Coastal Flooding During Hurricane Matthew Stephen Harden, Jeanne Robbins, and Eric Frantz U.S. Geological Survey, South Atlantic Water Science Center Presented to: WRRI Annual Conference
Hurricanes. Cause: a low pressure storm system over warm ocean water. Effect: potential massive widespread destruction and flooding.
 Hurricanes Hurricanes Cause: a low pressure storm system over warm ocean water. Effect: potential massive widespread destruction and flooding. Hurricanes also known as: cyclone (Indian Ocean) or typhoon
Weather Research Center
 Weather Research Center 3227 Audley Houston, Texas 77098 Phone: 713-529-3076 Fax: 713-528-3538 E-mail: wrc@wxresearch.org Press Release For Immediate Release November 29, 2005 For Information Contact:
Visualizing hurricanes
 Visualizing hurricanes NAME: DATE: Scientific visualization is an integral part of the process of simulating natural phenomena. In the computational sciences, the main goal is to understand the workings
Experimental Investigation of the Aerodynamic Forces and Pressures on Dome Roofs: Reynolds Number Effects
 Experimental Investigation of the Aerodynamic Forces and Pressures on Dome Roofs: Reynolds Number Effects *Ying Sun 1), Ning Su 2), Yue Wu 3) and Qiu Jin 4) 1), 2), 3), 4) Key Lab of Structures Dynamic
THE HISTORY OF WEATHER OBSERVING IN CHEYENNE, WYOMING,
 THE HISTORY OF WEATHER OBSERVING IN CHEYENNE, WYOMING, 1870-2004 Downtown Cheyenne, Wyoming, circa 1890 From Wyoming State Archives, Department of State Parks and Cultural Resources Current as of January
AASHTO Committee on Maintenance 2018 Annual Meeting July 25, Hurricane Irma- Preparation and Response
 AASHTO Committee on Maintenance 2018 Annual Meeting July 25, 2018 Hurricane Irma- Preparation and Response Rudy Powell Director, Office of Maintenance Satellite Aerial Image (September 10, 2017) Hurricane
11/28/2017 MET Cyclone Tracy. David & Frederic in Hurricane Hugo in 1989
 MET 4532 Cyclone Tracy Lecture 37 Final Exam Review 6 8 December 2017 Formed on 20DEC74, 500 km NE of Darwin Became visible on Darwin Radar on the 22 nd as a 50 m/s cyclone Slowed and tracked around Bathurst
A multi-tiered ADCIRC-based storm surge and wave prediction system
 A multi-tiered ADCIRC-based storm surge and wave prediction system Brian Blanton, Renaissance Computing Institute, UNC-Chapel Hill Rick Luettich, Institute of Marine Sciences, UNC-Chapel Hill, co-pi Jason
WeatherHawk Weather Station Protocol
 WeatherHawk Weather Station Protocol Purpose To log atmosphere data using a WeatherHawk TM weather station Overview A weather station is setup to measure and record atmospheric measurements at 15 minute
Enhanced Fujita Scale
 Enhanced Fujita Scale Ken Waters National Weather Service Phoenix, AZ Nov. 16, 2017 Original Fujita Scale Developed by Dr. T. Theodore Fujita 1971 and published as Proposed Characterization of Tornadoes
MAST ACADEMY OUTREACH. WOW (Weather on Wheels)
") MAST ACADEMY OUTREACH MIDDLE SCHOOL PROGRAM Adventures Aboard WOW (Weather on Wheels) On-Site Highlights Packet MAST Academy Maritime and Science Technology High School Miami-Dade County Public Schools
MAST ACADEMY OUTREACH MIDDLE SCHOOL PROGRAM Adventures Aboard WOW (Weather on Wheels) On-Site Highlights Packet MAST Academy Maritime and Science Technology High School Miami-Dade County Public Schools
2006 & 2007 Pre-Hurricane Scenario Analyses
 2006 & 2007 Pre-Hurricane Scenario Analyses Executive Summary May 2007 Page 1 OF X FOR OFFICIAL USE ONLY 4 Public Availability to be Determined Under 5 U.S.C. 552 NOTE: Limited Distribution. Release of
Table-Top Exercise for Emergency Preparedness Evaluation: Little Anse, Isle Madame
 Table-Top Exercise for Emergency Preparedness Evaluation: Little Anse, Isle Madame Alexander Chung, M.Sc. Candidate C-Change Student Research Associate May 2013 The Community of Little Anse Coastal community
Hurricane Basics and Preparedness. Jim Weyman Director, Central Pacific Hurricane Center Phone Office:
 Hurricane Basics and Preparedness Jim Weyman Director, Central Pacific Hurricane Center Phone Office: 973-5270 james.weyman@noaa.gov United States Hurricane/Typhoon Centers National Hurricane Center, Miami
Comparative Analysis of Hurricane Vulnerability in New Orleans and Baton Rouge. Dr. Marc Levitan LSU Hurricane Center. April 2003
 Comparative Analysis of Hurricane Vulnerability in New Orleans and Baton Rouge Dr. Marc Levitan LSU Hurricane Center April 2003 In order to compare hurricane vulnerability of facilities located in different
MAST ACADEMY OUTREACH. WOW (Weather on Wheels)
") MAST ACADEMY OUTREACH ELEMENTARY SCHOOL PROGRAM Adventures Aboard WOW (Weather on Wheels) On-Site Packet MAST Academy Maritime and Science Technology High School Miami-Dade County Public Schools Miami,
MAST ACADEMY OUTREACH ELEMENTARY SCHOOL PROGRAM Adventures Aboard WOW (Weather on Wheels) On-Site Packet MAST Academy Maritime and Science Technology High School Miami-Dade County Public Schools Miami,
Monitoring Hurricane Rita Inland Storm Surge
 Monitoring Hurricane Rita Inland Storm Surge By Benton D. McGee, Roland W. Tollett, and Burl B. Goree Pressure transducers (sensors) are accurate, reliable, and cost-effective tools to measure and record
Photo by Herb Stein. Center for Severe Weather Research. Hurricane Studies. Photo by Herb Stein
 Photo by Herb Stein Center for Severe Weather Research Hurricane Studies Photo by Herb Stein DOW Hurricane Studies (or, what the DOWs do after tornado season is over) Missions are very challenging compared
Popular Mechanics, 1954
 Introduction to GIS Popular Mechanics, 1954 1986 $2,599 1 MB of RAM 2017, $750, 128 GB memory, 2 GB of RAM Computing power has increased exponentially over the past 30 years, Allowing the existence of
Flooding in Western North Carolina: Some Spatial, Hydrologic, and Seasonal Characteristics CAUTION!! Outline. Basic Flood Facts.
 Flooding in Western North Carolina: Some Spatial, Hydrologic, and Seasonal Characteristics J. Greg Dobson CAUTION!! National Environmental Modeling and Analysis Center RENCI at UNC-Asheville Engagement
Appendix B Lesson 1: What Is Weather Exit Ticket
 Appendix B Lesson 1: What Is Weather Exit Ticket Name Date Period What is Weather? Exit Ticket List 3 things that you learned during the demonstrations today. What are two questions that you still have?
Lecture 9: Reference Maps & Aerial Photography
 Lecture 9: Reference Maps & Aerial Photography I. Overview of Reference and Topographic Maps There are two basic types of maps? Reference Maps - General purpose maps & Thematic Maps - maps made for a specific
Standardizing hurricane size descriptors for broadcast to the public
 Standardizing hurricane size descriptors for broadcast to the public Lori Drake, Hurricane Roadmap Project AMS 40th Conference on Broadcast Meteorology August 22-24, 2012, Boston, MA, Operational Forecasting
HURRICANE IVAN CHARACTERISTICS and STORM TIDE EVALUATION
 HURRICANE IVAN CHARACTERISTICS and STORM TIDE EVALUATION By Robert Wang and Michael Manausa Sponsored by Florida Department of Environmental Protection, Bureau of Beaches and Coastal Systems Submitted
Your web browser (Safari 7) is out of date. For more security, comfort and the best experience on this site: Update your browser Ignore
 is out of date. For more security, comfort and the best experience on this site: Update your browser Ignore") Your web browser (Safari 7) is out of date. For more security, comfort and the best experience on this site: Update your browser Ignore Educator Version 2005 HU RRICANE SEASO N Map traces a stormy season
Your web browser (Safari 7) is out of date. For more security, comfort and the best experience on this site: Update your browser Ignore Educator Version 2005 HU RRICANE SEASO N Map traces a stormy season
Welcome to NR502 GIS Applications in Natural Resources. You can take this course for 1 or 2 credits. There is also an option for 3 credits.
 Welcome to NR502 GIS Applications in Natural Resources. You can take this course for 1 or 2 credits. There is also an option for 3 credits. The 1st credit consists of a series of readings, demonstration,
2008 Hurricane Caravan. Daniel Noah Meteorologist National Weather Service x1 May 22, 2008
 2008 Hurricane Caravan Daniel Noah Meteorologist National Weather Service daniel.noah@noaa.gov, 813-645-2323 x1 May 22, 2008 National Weather Service We never close! Open 24 hours a day 365 days per year
AN INTERNATIONAL SOLAR IRRADIANCE DATA INGEST SYSTEM FOR FORECASTING SOLAR POWER AND AGRICULTURAL CROP YIELDS
 AN INTERNATIONAL SOLAR IRRADIANCE DATA INGEST SYSTEM FOR FORECASTING SOLAR POWER AND AGRICULTURAL CROP YIELDS James Hall JHTech PO Box 877 Divide, CO 80814 Email: jameshall@jhtech.com Jeffrey Hall JHTech
Hurricane Tracking Lab
 Hurricane Tracking Lab Background: Hurricanes are one of nature s most powerful disasters. To equal the power of a hurricane, one would have to set off about a thousand nuclear devices per second for as
Introduction. One way to monitor the status of this energy is though monitoring sea surface
 Sears 1 Understanding Hurricane Intensity Using Sea Surface Height and Temperature Information John Sears (Plymouth State University) Robbie Hood (NASA-MSFC) Frank LaFontaine (Raytheon) Abstract Warmer
Interaction of a translating tornado with a low-rise builsing
 Graduate Theses and Dissertations Graduate College 2010 Interaction of a translating tornado with a low-rise builsing Hephzibah Thampi Iowa State University Follow this and additional works at: http://lib.dr.iastate.edu/etd
Urban Dispersion Program New York City Mesonet ROOFTOP WEATHER STATION NETWORK
 Urban Dispersion Program New York City Mesonet ROOFTOP WEATHER STATION NETWORK GENERAL DESCRIPTION Introduction The Department of Homeland Security has established a meteorological research program in
A New Wind Power Harvesting Interpolation Technique
 Seventh LACCEI Latin American and Caribbean Conference for Engineering and Technology (LACCEI 2009) Energy and Technology for the Americas: Education, Innovation, Technology and Practice June 2-5, 2009,
ERTH 365 Homework #2: Hurricane Harvey. 100 points
 ERTH 365 Homework #2: Hurricane Harvey 100 points Due by 6pm, Tuesday 30 October 2018, ELECTRONIC SUBMISSON BY EMAIL ONLY BY 6PM (send to klevey@sfsu.edu) (acceptable formats: MS Word, Google Doc, plain
Page 1. Name: 4) State the actual air pressure, in millibars, shown at Miami, Florida on the given weather map.
 State the actual air pressure, in millibars, shown at Miami, Florida on the given weather map.") Name: Questions 1 and 2 refer to the following: A partial station model and meteorological conditions table, as reported by the weather bureau in the city of Oswego, New York, are shown below. 1) Using
Name: Questions 1 and 2 refer to the following: A partial station model and meteorological conditions table, as reported by the weather bureau in the city of Oswego, New York, are shown below. 1) Using
Module 10 Summative Assessment
 Module 10 Summative Assessment Activity In this activity you will use the three dimensions of vulnerability that you learned about in this module exposure, sensitivity, and adaptive capacity to assess
An Experimental Validation of Numerical Post-Stall Aerodynamic Characteristics of a Wing
 Proceedings of ICTACEM 2017 International Conference on Theoretical, Applied, Computational and Experimental Mechanics December 28-30, 2017, IIT Kharagpur, India ICTACEM-2017/XXXX(paper No.) An Experimental
Evaluation of Storm Tide Measurements at Panama City Beach, FL
 Evaluation of Storm Tide Measurements at Panama City Beach, FL 1993-2007 Prepared by Mark E. Leadon Beaches and Shores Resource Center Florida State University May 2009 Prepared for Florida Department
A Hurricane Outlook for the 21st Century.
 A Hurricane Outlook for the 21st Century. Hugh Willoughby Florida International University Cat Winds Effects One 74-95 mph No real damage to building structures. Two Three Four Five 96-110 mph 111-130
Journal of Wind Engineering and Industrial Aerodynamics
 J. Wind Eng. Ind. Aerodyn. 98 (2010) 533 547 Contents lists available at ScienceDirect Journal of Wind Engineering and Industrial Aerodynamics journal homepage: www.elsevier.com/locate/jweia Surface wind
Top 10 Actions a CIO Can Take to Prepare for a Hurricane
 May 2013 Walter E. Washington Convention Center Washington, DC Top 10 Actions a CIO Can Take to Prepare for a Hurricane Lessons learned from Hurricane Sandy Bill Venteicher Marketing Manager Dell Email
Module 7, Lesson 2 In the eye of the storm
 Module 7, Lesson 2 In the eye of the storm October 21, 1998 A tropical storm is brewing in the Atlantic Ocean. It began as a tropical wave a few weeks earlier, off the coast of western Africa. Today it
Consumer Guide. Southwest Windpower 1801 W. Route 66 Flagstaff, AZ USA
 Consumer Guide wind turbine SITING Southwest Windpower 80 W. Route 66 Flagstaff, AZ 8600 USA www.windenergy.com Introduction Is wind power right for you? Wind generators are an effective source of renewable
2. To measure the emission lines in the hydrogen, helium and possibly other elemental spectra, and compare these to know values.
 4.1. Purpose 1. To record several elemental emission spectra using arc lamps filled with each element using the Ocean Optics USB650 spectrometer. 2. To measure the emission lines in the hydrogen, helium
Aerodynamic torsional loads on L-shaped low-rise buildings
 Aerodynamic torsional loads on L-shaped low-rise buildings Zhitian Zhang* 1 ; Mohamed Elsharawy 2a ; and Ted Stathopoulos 2b 1 Wind Engineering Research Center, Hunan University, Changsha, China. 2 Department
The Wind Speeds in Selected Islands During Hurricanes Irma and Maria in 2017 compiled by Tony Gibbs FREng
 The Wind Speeds in Selected Islands During Hurricanes Irma and Maria in 2017 compiled by Tony Gibbs FREng Structural failures leading to serious damage or collapse, or those severely affecting the use
Erin Mack Ashley, PhD, LEED AP Diana Castro, PE
 Impact and mitigation options for residential fires following Hurricane Sandy Erin Mack Ashley, PhD, LEED AP Diana Castro, PE June 9-14, 2013 Hurricane Hazards Storm Surge Winds Heavy Rain Tornadoes FIRE?
A Comparison of Force Balance and Pressure Integration Techniques for Predicting Wind-Induced Responses of Tall Buildings
 A Comparison of Force Balance and Pressure Integration Techniques for Predicting Wind-Induced Responses of Tall Buildings Authors: Calin Dragoiescu, Jason Garber and K. Suresh Kumar RWDI, 650 Woodlawn
Chapter 16, Part Hurricane Paths. 2. Hurricane Paths. Hurricane Paths and Damage
 Chapter 16, Part 2 Hurricane Paths and Damage 1. Hurricane Paths Start over tropical water except South Atlantic and eastern South Atlantic, where water is too cold. Initially steered by easterly winds
FLOOD HAZARD AND RISK ASSESSMENT IN MID- EASTERN PART OF DHAKA, BANGLADESH
 FLOOD HAZARD AND RISK ASSESSMENT IN MID- EASTERN PART OF DHAKA, BANGLADESH Muhammad MASOOD MEE07180 Supervisor: Prof. Kuniyoshi TAKEUCHI ABSTRACT An inundation simulation has been done for the mid-eastern
Air Masses, Fronts and Weather Systems
 Air Masses, Fronts and Weather Systems Can you name the air mass? 2 1 3 4 5 6 7 8 What is a Front? Fronts are boundaries that separate air masses Where air masses meet and do not mix. Types of Fronts:
Transactions on Information and Communications Technologies vol 18, 1998 WIT Press, ISSN
 GIS in the process of road design N.C. Babic, D. Rebolj & L. Hanzic Civil Engineering Informatics Center, University ofmaribor, Faculty of Civil Engineering, Smetanova 17, 2000 Maribor, Slovenia. E-mail:
October 17, 2018 Sea level rise observed since 1970 responsible for 43% of homes impacted by Hurricane Irma s storm surge
 October 17, 2018 Sea level rise observed since responsible for 43% of homes impacted by s storm surge (NEW YORK, N.Y.) Data scientists from the non-profit First Street Foundation in collaboration with
Communicating Hurricane Threats and Impacts on a National Scale. Daniel Brown Warning Coordination Meteorologist National Hurricane Center
 Communicating Hurricane Threats and Impacts on a National Scale Daniel Brown Warning Coordination Meteorologist National Hurricane Center New NWS Products to Help Communicate Potential Impacts New probabilistic
Climate. Annual Temperature (Last 30 Years) January Temperature. July Temperature. Average Precipitation (Last 30 Years)
 January Temperature. July Temperature. Average Precipitation (Last 30 Years)") Climate Annual Temperature (Last 30 Years) Average Annual High Temp. (F)70, (C)21 Average Annual Low Temp. (F)43, (C)6 January Temperature Average January High Temp. (F)48, (C)9 Average January Low Temp.
Climate Annual Temperature (Last 30 Years) Average Annual High Temp. (F)70, (C)21 Average Annual Low Temp. (F)43, (C)6 January Temperature Average January High Temp. (F)48, (C)9 Average January Low Temp.
QGIS FLO-2D Integration
 EPiC Series in Engineering Volume 3, 2018, Pages 1575 1583 Engineering HIC 2018. 13th International Conference on Hydroinformatics Karen O Brien, BSc. 1, Noemi Gonzalez-Ramirez, Ph. D. 1 and Fernando Nardi,
The Hardening of Utility Lines Implications for Utility Pole Design and Use
 NORTH AMERICAN WOOD POLE COUNCIL TECHNICAL BULLETIN The Hardening of Utility Lines Implications for Utility Pole Design and Use Prepared by: Martin Rollins, P.E. Abstract The hurricanes of 2005 caused
AN ENGINEERING ANALYSIS OF THE GRAND ISLAND, NE TORNADOES
 (Presented at the 12th Conf. on Severe Local Storms, San Antonio, Texas, January 1982, p. 293-296). AN ENGINEERING ANALYSIS OF THE GRAND ISLAND, NE TORNADOES Timothy P. Marshall and James R. McDonald Institute