Using Climate Forecasts in Agriculture
|
|
|
- Samuel Walker
- 6 years ago
- Views:
Transcription


1 Lesson Plan Using Climate Forecasts in Agriculture SART Training Media
2 Using Climate Forecasts in Agriculture Lesson Plan Prepared by: Clyde Fraisse, Climate Extension Scientist, University of Florida, Gainesville John Bellow, Climate Extension Specialist, Center for Ocean-Atmospheric Prediction Studies, Florida State University, Tallahassee David Zierden, Assistant State Climatologist, Tallahassee Carol J. Lehtola, Associate Professor, University of Florida, Gainesville Susan Williams, University of Florida, Gainesville Charles M. Brown, University of Florida, Gainesville Copyright 2005 by Florida Department of Agriculture and Consumer Services SART Training Media are available for download from the Florida SART Web site < Development of Using Climate Forecasts in Agriculture was supported by a grant from USDA Risk Management Agency.
3 Using Climate Forecasts in Agriculture Lesson Plan 3 Contents About Florida SART 4 Introduction 5 Session Outline 5 Specific Learning Objectives 6 Learning Environment/Aids 6 Before the Workshop 7 Part 1 Beginning the Session 7 Part 2 Climate and Weather 8 Part 3 The Value of Climate Forecasts to Agriculture 9 Part 4 El Niño and La Niña 10 Part 5 El Niño, La Niña and Rainfall 11 Part 6 El Niño, La Niña and Temperature 12 Part 7 El Niño, La Niña and Freezes 12 Part 8 El Niño, La Niña and Hurricanes 13 Part 9 El Niño, La Niña and Wild Fires 14 Part 10 El Niño, La Niña and Crop Production 14 Part 11 Degree-days 15 Part 12 The AgClimate Web Site 16 Part 13 Summary and Wrap-Up 17 Participant Evaluation 18 Pre- and Post-Tests and Answer Key 19 PowerPoint Slides Summary Pages 23 PowerPoint Slides Full-Size 31 PowerPoint Slides Handout Pages 119
4 4 Using Climate Forecasts in Agriculture Lesson Plan About Florida SART SART is a group of governmental and private agencies dedicated to effectively communicating and planning for animal and agriculture emergencies and disasters in Florida. SART operates at the local level through county SART organizations. SART combines the skills and resources of many agencies, organizations and individuals. SART supports county, regional, and state emergency management efforts. SART Mission Empower Floridians with training and resources to enhance animal and agriculture disaster response. SART Goals Promote the establishment of a coordinator in each county responsible for all agriculturally related incidents Provide assistance in the development and writing of county ESF-17 plans Promote the establishment of a County SART for each county Provide annual training for all SART and agriculturally-related personnel Identify county resources available for an emergency or disaster Promote counties to work at a regional level for mutual aid
5 Using Climate Forecasts in Agriculture Lesson Plan 5 Subject: Introduce basic concepts about climate, specifically the El Niño and La Niña phenomena and their impact on the southeastern United States. Introduce participants to the AgClimate Web site and the tools it provides. Introduction This lesson plan and its accompanying workbook are the basis for an introductory unit on the use of climate forecasts in agriculture. The lesson plan guides the instructor or trainer in presenting the educational portion of the workshop. The mechanics of planning the training event or an entire workshop are covered in the companion manual, Make It Happen! A Toolkit for Planning a Community-Based SART Training Event. The toolkit is available for download at the Florida SART Web site < A PowerPoint presentation has been created to accompany the lesson. Throughout the lesson plan, slide symbols indicate that a PowerPoint slide is available for that section. Slides are also reproduced in the back of this lesson plan for use as a flipbook with small classes or making overheads. Session Outline Part 1 - Beginning the Session Part 2 - Climate and Weather Part 3 - The Value of Climate Forecasts to Agriculture Part 4 - El Niño and La Niña Part 5 - El Niño and La Niña and Rainfall Part 6 - El Niño and La Niña and Temperature Part 7 - El Niño and La Niña and Freezes Part 8 - El Niño and La Niña and Hurricanes Part 9 - El Niño and La Niña and Wild Fires Part 10 - El Niño and La Niña and Crop Production Part 11 - Degree-days Part 12 - The AgClimate Web Site Part 13 - Summary and Wrap-Up (5-10 minutes) (5-10 minutes) (5-10 minutes) (5-10 minutes) (5-10 minutes) (5-10 minutes) (5-10 minutes) (5-10 minutes) (5-10 minutes) (5-10 minutes) (5-10 minutes) (5-10 minutes) (5-10 minutes)
6 6 Using Climate Forecasts in Agriculture Lesson Plan Specific Learning Objectives At the end of this training module, participants will be able to: 1. Explain climate and how it is different from weather eather. 2. Explain the value of climate forecasts to agriculture. 3. Explain El Niño and La Niña events ents and how knowing about these climate events helps agriculture? 4. Explain how El Niño and La Niña events affect rainfall all. 5. Explain how El Niño and La Niña events affect tem emperatures in the Southeast U.S. 6. Explain how El Niño and La Niña events affect freezes. 7. Explain how El Niño and La Niña events affect the chance of hurricanes hitting the U.S. 8. Explain how El Niño and La Niña events affect the risk of wild fires ires. 9. Explain how El Niño and La Niña events affect crop production in the Southeast U.S. 10. Explain degree-days ys, growing degree-days and heat-stress degree-days ys. 11. Describe the AgClimat gclimate Web site. Learning Environment/Aids To complete this lesson plan, you will need: The PowerPoint presentation Using Clilmate Forecasts in Agriculture Optional: Using Clilmate Forecasts in Agriculture Workbook. This participant workbook contains copies of the PowerPoint slides and resource information. Optional: Make It Happen! Toolkit for Planning a Community-Based SART Training Event. This publication is available to help you organize, plan and present an entire CART training event with multiple training modules. (See the Resources section of this publication to find out more about any of the materials listed above.) To conduct this training module, you will need: A means to show the PowerPoint presentation: a computer with a projector. (Note: Black-and-white copies of the slides are included in this manual if you prefer to use an overhead projector.) Sufficient seating for all participants. Each participant will need: Pen or pencil Using Climate Forecasts in Agriculture Workbook, or paper for notes
7 Using Climate Forecasts in Agriculture Lesson Plan 7 Before the Workshop On the day of the workshop, check that all equipment needed is in place. Double-check that electronic media works on the equipment you have. Also, make certain that any materials, such as paper, workbooks, and pens/pencils for participants, are available in sufficient numbers to cover all participants. Part 1: Beginning the Session Time: 5-10 minutes Focus: Welcome participants and introduce unit objectives es SLIDES 1-3 Once all participants have taken their seats, welcome them to the Using Climate Forecasts in Agriculture workshop. Introduce yourself and any other trainers. Tell them approximately how long the session will last. At this point, you may elect to give particpants the pre-test provided in this manul. Together with the post-test, this can be used to evaluate the knowledge participants gained during the session. This workshop can be used with agricultural and non-agricultural audiences. The purpose of this lesson is to introduce concepts about climate and climate forecasting, and how this knowledge can be useful to agricultural producers. Specifically, the AgClimate Web site will be introduced along with the tools it provides. Details about using the AgClimate tools is beyond the scope of this introductory lesson. The introduction should not last longer than 10 minutes. It is necessary for the trainer to balance staying on time, explaining the unit content clearly, and allowing for and answering participant questions. SLIDE 4 SLIDE 5 Introduce participants to the Southeast Climate Consortium. Six institutions in Alabama, Florida, and Georgia participate in the Consortium and are working to bring the latest climate forecasting research to agricultural producers in the form of practical tools. The primary way of providing this information is through the AgClimate Web site at < Take a moment to review the objectives for the workshop. This will help participants focus on what they are going to learn about and recognize topics as they come up in the workshop.
8 8 Part 2: Climate and Weather Using Climate Forecasts in Agriculture Lesson Plan Time: 5-10 minutes Focus: Explain climate and how it is different from weather SLIDE 6 Weather eather is a familiar concept -- weather is what is happening in the atmosphere at any specific point in time, such as the day-to-day measurements of temperature and rain. Weather deals with short-term effects that result from the movement and development of particular weather systems (such as cold and warm fronts or hurricanes). Predicting the weather is a standard feature in news broadcasts and newspapers. These predictions are usually fairly accurate for one, two or three days, but because the atmosphere changes very quickly, weather predictions for more than a few days into the future are not as reliable. Examples of weather include thunderstorms with their heavy rain and strong winds that might be caused by a cold front moving through a particular area. A lack of rain on any given day is also weather -- good weather for outdoor activities. A hard freeze is also a kind of weather. Farmers, foresters and other agricultural managers can use weather to decide what activities are appropriate in the very near future, such as how much irrigation might be needed, whether to protect crops from freeze or frost, and whether chemical spraying and fertilizing are advisable on a given day. Climate is a pattern of weather for one month or more in a certain region. When people discuss the total amount of rain for a month or a season, they are discussing the results of a pattern of weather. When the average temperature during a particular month is consistently above average, that is a pattern of weather, and therefore, climate. Local climate can be influenced by remote conditions. For example, the temperature of the ocean in the Pacific Ocean near the Equator has a definite influence on the climate in the southeastern United States. A great deal of research has gone into this subject, and it has yielded many practical results. Farmers, foresters and other agricultural managers now can know months ahead of time if less rain or more rain than normal will happen during different seasons in a year. This knowledge may change what crops to plant, how
9 Using Climate Forecasts in Agriculture Lesson Plan 9 much to irrigate and when to harvest. For example, when equatorial waters in the Pacific are cooler than normal, the climate in south Florida is likely to be hotter and drier than normal with night temperatures above 65 F. With this knowledge, tomato producers might choose hot-set tomatoes as the variety that will produce best under these conditions. Part 3: The Value of Climate Forecasts to Agriculture Time: 5-10 minutes Focus: Explain the value of climate e forecasts to agriculture SLIDE 7 Climate influences production and pricing of food, feed and fiber. Most crop failures in the United States are related to too little or too much rain. Differences in climate among the seasons are related to other production risks, such as pests and disease. Knowing possible climate shifts in the coming season helps farmers, foresters and other agricultural managers decide ahead of time how to deal with these risks. Better information about climate changes can help producers minimize climate-associated risks. Examples of other production decisions that could be influenced by climate forecasts include: Choice of crop and variety Whether to buy crop insurance and how much to buy Amount and types of fertilizers and pesticides to buy
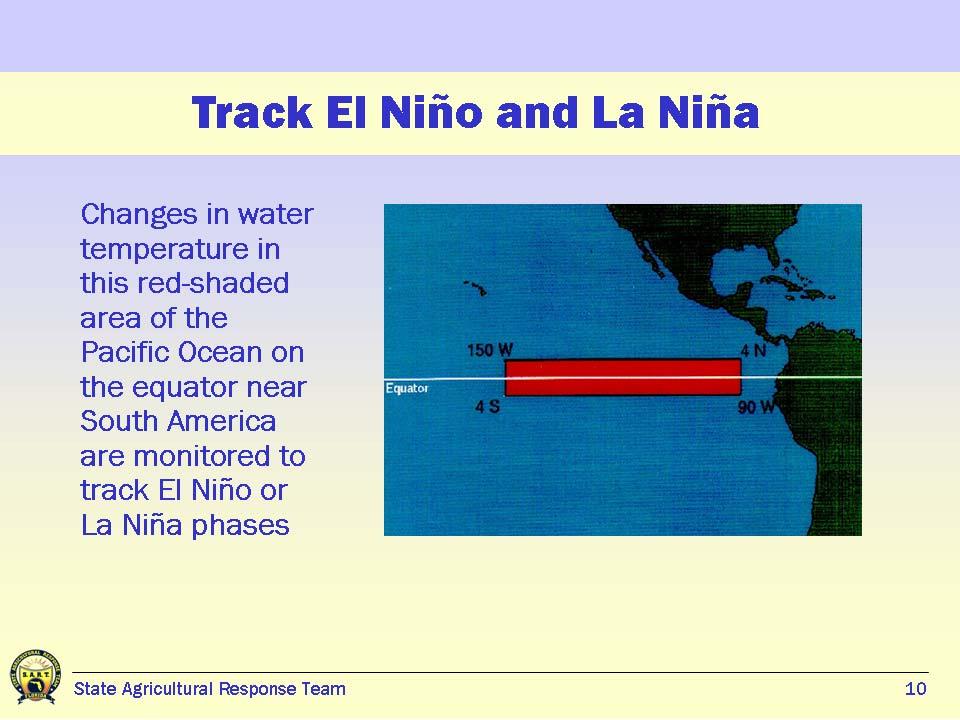
10 10 Using Climate Forecasts in Agriculture Lesson Plan Part 4: El Niño and La Niña Events Time: 5-10 minutes Focus: Explain El Niño and La Niña and how knowing about these climate events ents helps agriculture SLIDES 8 As mentioned earlier, sea surface temperatures near the equator in the Pacific Ocean can influence the climate in the southeastern United States. Sea surface temperatures can either be higher than average, lower than average, or they can be average. It takes months for the SST to change, so for example, if it is higher than normal, it can be several months to a year or more before it returns to normal or becomes lower than normal. The period of time during which the SST is high, low or normal is called a phase or sometimes an event. Normal SST is different depending on the time of year. During December through February, the normal SST is 75 F - 80 F. SLIDES 9 The warmer than normal phase is called El Niño, which refers to the infant Jesus. The reason for this name is that the warmer than normal phase has been known for hundreds of years to Peruvian fishermen, who often noticed decreased catches when December waters were warmer than usual. Much later, it was discovered that the same waters can be colder than usual, and a natural name for this opposite condition was La Niña. When SST is normal, the phase is called Neutral. So, when reading about climate issues, one might read about an El Niño phase, an El Niño event, or possibly just El Niño. SST is the most important surface condition that influences climate, particularly in the tropical parts of the world.* El Niño and La Niña have strong effects on climate patterns around the world. SLIDES 10 Normally, trade winds blow from east to west near the Equator in the Pacific Ocean. These winds pile up warm water around Indonesia and Australia. During El Niño phases, trade winds die down and the warm water moves back towards the coast of South America. This makes the SST much warmer than normal. * The tropical part of the world is the area around the world between the Tropic of Cancer and the Tropic of Capricorn. The Tropic of Cancer is 23.5 degrees north of the equator and runs through Mexico, the Bahamas, India and southern China. The Tropic of Capricorn is 23.5 degrees south of the equator and runs through Australia, Chile, southern Brazil and northern South Africa.
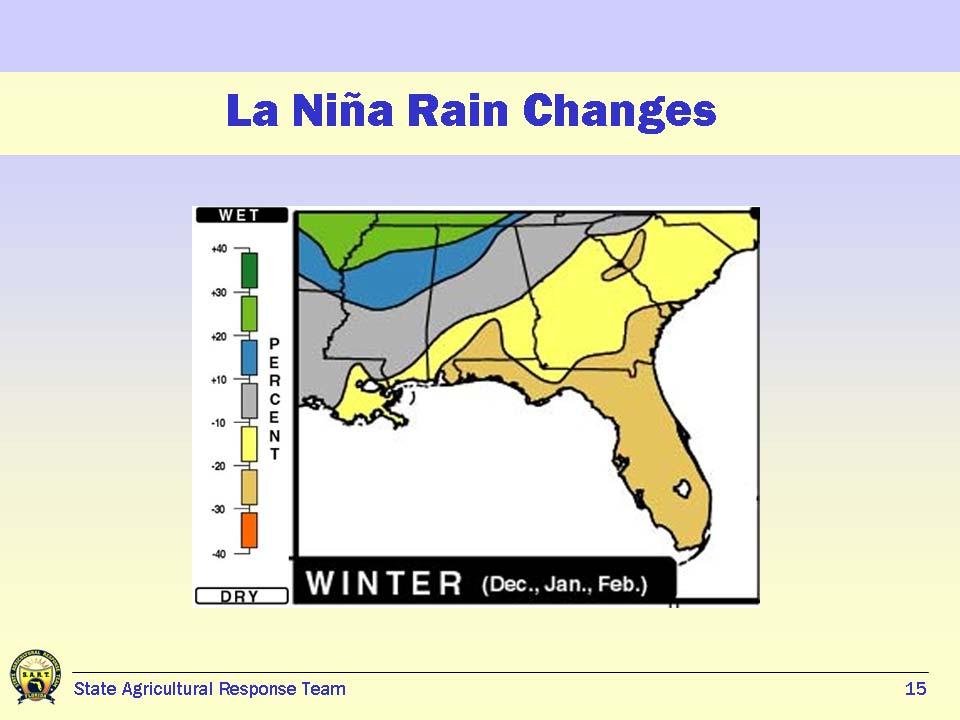
11 Using Climate Forecasts in Agriculture Lesson Plan 11 During La Niña phases, stronger than usual trade winds bring up cooler water from the depths of the Pacific Ocean. This makes the SST in the eastern tropical Pacific Ocean lower than normal. El Niño and La Niña phases return every 2 to 7 years. One does not always follow the other. For example, a La Niña phase began in 1988 followed by Neutral phases during 1989 and 1990; then, in 1991, an El Niño phase developed. SLIDES 11 Most of the time, however, the tropical Pacific Ocean is in a Neutral phase or near normal SST. Part 5: How El Niño, La Niña Affect Rainfall Time: minutes es Focus: Explain how w El Niño and La Niña affect ect rainfall all SLIDE During El Niño phases, average winter rainfall increases all across Florida by over 30%, compared to normal winter totals. La Niña phases have the opposite effect. Rainfall can be from 10% to 30% less than normal from fall through winter and spring. El Niño s influence on rainfall makes a difference in the production of several commodities in Florida, including winter vegetables, some citrus, sugarcane and field corn. More clouds during cooler and wetter winters cause plants to get less energy from the sun. Weather patterns of El Niño in winter also increase the possibility of disease which can affect the production of winter vegetables. For example, in the winter of , one of the strongest La Niña phases caused winter storms that beat up California and the Gulf Coast. Average sea surface temperature decreased by as much as 4 F.
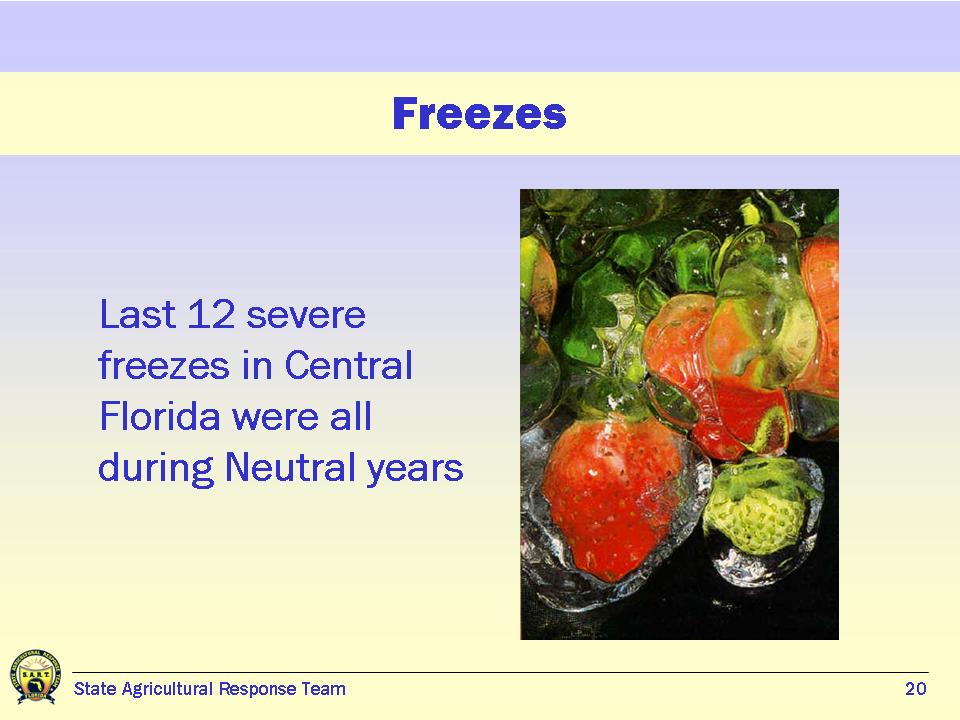
12 12 Using Climate Forecasts in Agriculture Lesson Plan Part 6: El Niño, La Niña and Temperatures Time: 5-10 minutes Focus: Explain how El Niño and La Niña affect tem emperatures SLIDE The differences between average temperatures from season to season are much greater than the average temperature change caused by El Niño or La Niña. However, in Florida, any movement away from normal temperatures is important, especially during winter. During El Niño events, Florida and the Gulf Coast have average temperatures 2 to 3 F below normal. During La Niña events, winter temperatures are 2 to 4 F above normal. La Niña s affect on temperature is more noticeable in north Florida, Alabama and Mississippi. For example, in , La Niña caused drier and warmer winters in Florida. This caused an increase in wild fires in the state. Other parts of the country were drier and warmer than normal. The effects of El Niño and La Niña phases on winter average daily minimum temperatures are not as strong. In south Florida, however, average daily minimum summer temperatures are likely to be lower than normal during La Niña phases. Lower temperatures at night may be good for growth and yield of some crops. Higher average temperatures associated with La Niña can have an effect on livestock. For example, dairy cows are sprayed with water several times a day when temperatures are high. Water keeps them cool and keeps up their milk production. Heat-stressed cows produce less milk than cool cows. Part 7: El Niño, La Niña and Freezes Time: 5-10 minutes Focus: Explain how El Niño and La Niña affect freezes SLIDE Eleven of the 12 freezes that seriously damaged agriculture over the last 103 years ( ) in the southeast happened during Neutral years. For example, very damaging freezes occurred in December 1962 and January 1982 during Neutral years.
13 Using Climate Forecasts in Agriculture Lesson Plan 13 Depending on where you are in Florida, damaging freezes with temperatures of 20 F or lower are up to 3 times more likely during Neutral years than during El Niño and La Niña events. Similar freezes may happen once every few years. For example, Alachua County may have a damaging freeze once every 5 years; south Florida may have over 20 years in between severe freezes. Freezes that last longer than 2 nights are extended freezes, and they can severely damage some agriculture enterprises, such as aquaculture in central Florida. South Florida may have one extended freeze in 20 years, but Calhoun County in Florida s Panhandle, on the other hand, may have two extended freezes in a single year. Another measure of the impact of freezing temperatures are the dates of the first frost and the last frost. For example, in Columbia County, there is a 50% chance that the first freeze will be between November 21 and November 30. Columbia County has a 50% probability that the last freeze will be between April 21 and April 30. El Niño and La Niña do not appear to affect when the first or last frosts or freezes occur. Part 8: El Niño, La Niña and Hurricanes Time: minutes es Focus: Explain how w El Niño and La Niña affect ect the chances of hurricanes hitting the U.S..S. SLIDE Upper level winds over the Atlantic Ocean Basin are not suitable for the development of a lot of hurricanes during an El Niño phase. Fewer hurricanes mean the chance for one to strike the U.S. is less likely. On the other hand, La Niña helps hurricanes develop in the Atlantic Ocean Basin, which means a greater chance one or more hurricanes may strike the U.S. The chances of at least 2 hurricanes hitting the U.S. are 28% during El Niño, 48% in Neutral phases, and 66% during La Niña. Recent examples of hurricanes formed during Neutral phases include Hurricane Andrew, which struck Miami-Dade County in August This powerful storm destroyed between 35% and 45% of 22,000 acres of commercial tropical fruit crops in Miami-Dade County. Hurricanes in the 2004 and 2005 seasons also occurred during a Neutral phase. The many storms of these two seasons caused extensive agricultural damage amounting to over $2 billion in both years.
14 14 Using Climate Forecasts in Agriculture Lesson Plan Part 9: El Niño, La Niña and Wild Fires Time: 5-10 minutes Focus: Explain how El Niño and La Niña affect the risk for wild fire in the southeast U.S. SLIDE La Niña causes below normal rainfall beginning in the fall and lasting through spring. The long dry period runs into April, one of the driest months of the year. As a result, soil and forests can be extremely dry. This can cause an increased risk of fires the following spring and summer. Fire records show that the number of acres burned in Florida each year is highly related to El Niño and La Niña. The records show an increase in the acres burned during La Niña, especially in south Florida. For , on average over 500,000 acres burned in Florida. Neutral years average around 200,000 acres burned. Wet El Niño winters seem to prevent forest fires. The Florida western Panhandle does not usually have a problem with forest fires because this area gets much more rainfall in a year than other parts of the state. Part 10: El Niño, La Niña and Crop Production Time: minutes es Focus: Explain how w El Niño and La Niña affect ect crop op production in the southeast U.S..S. SLIDE El Niño and La Niña events can influence crop production through their interactions with weather. Past studies have shown that yields of several crops in the Southeast U.S. are affected by El Niño and La Niña phases. Environmental variables such as temperature, rainfall and solar radiation strongly affect crop development and growth. Development refers to the timing of critical events in a plant s life. Growth refers to the increase in weight, volume, length, or area of part or all of the plant. For example, the winter tomato yield is about 20% lower than average during El Niño events and about 8% higher during La Niña events. Field corn yields are 10% lower during El Niño events and almost 10% higher during La Niña events.
15 Using Climate Forecasts in Agriculture Lesson Plan 15 Part 11: Degree-days: Measuring the Energy for Growth Time: 5-10 minutes Focus: Explain degree-days, growing degree-days, and heat stress degree-days SLIDE 30 SLIDE 31 SLIDE 32 Degree-days are a way of measuring the amount of energy available for growth. Researchers have found that for each developmental stage of a plant, there is a temperature below which growth slows significantly. This temperature is called the threshold, and for crops to grow effectively, there must be plenty of days during which the temperature is above this threshold. There are several ways of calculating degree-days, but the most common is to find the average of a day s high temperature and the low temperature, then subtract the threshold temperature. For example, if the threshold for a particular crop is 60 F and the average temperature on a particular day is 65 F, then that day provided 5 degree-days for the crop. We can add all daily degree-days together to find out how many total degreedays have occurred since a certain day, for a particular month, or since a planting date. Cumulative degree-days like this are often compared to past years to see if the current year is supplying more or less degree-days in the same period of time. Higher numbers of degree-days in a given month cause earlier flowering and maturity. El Niño and La Niña affect growing degreedays mainly December through February. For example, in the months December through February in South Florida, certain winter crops may grow 5% to 10% faster than normal during a La Niña phase and 10% to 15% slower during an El Niño phase. Degree-days can also be used as a way of measuring any above-normal heat that animals must endure. This is called heat-stress degree-days. For example, cattle and hog weight gain and milk production are less when temperatures are higher than 77 F. SLIDE 33 Use heat stress degree-days to figure out if livestock have heat stress. Actual loss of animals depends on other things, such as whether temperatures at night are low enough for livestock to recover from the stress. During an El Niño phase, heat stress degree-days tend to be slightly lower March through May and higher in the summer. La Niña reduces heat stress degree-days in June and July. These differences are small compared to the total average heat stress degree-days in spring and summer.
16 16 Using Climate Forecasts in Agriculture Lesson Plan Part 12: The AgClimate Web Site Time: 5-10 minutes Focus: Descirbe the AgClimat gclimate Web site and the tools it provides for producer oducers SLIDE The AgClimat gclimate Web site ( provides information and tools on how to deal with changing climate forecasts for each season in the Southeast U.S. AgClimat gclimate includes climate forecasts connected with risk management tools and information for certain crops, forestry, pasture, and livestock. The menu that helps you navigate the Web site has: AgClimat gclimate Tools ools: (a) Climate Risk: Expected and past climate information, rain and average low and high temperatures for counties; and (b) Harvest Yield Risk: Expected yield based on soil type, planting date, and basic management practices for peanuts, potatoes and tomatoes. Yield forecasts exist for limited counties depending on the crop chosen. Climate Forecasts: Gives Southeast Climate Consortium (SECC) forecasts and connections (links) to other Web sites for national and international climate forecasts. Also includes: County forecasts Regional forecasts National, linked to the National Oceanic Atmospheric Administration (NOAA) International, linking to the International Research Institute for Climate Prediction (IRI) El Niño Southern Oscillation (ENSO) forecast, reports current sea surface temperature (SST) conditions and what ENSO condition is expected to prevail during the next months Hurricane forecasts for current year and a summary of hurricane forecasts from several sources Freeze forecasts Crops: Gives producers management options and yield risk ratings fitted to climate forecasts, in addition to links to extension resources, market information and commodity-related industry Web sites. Currently, peanuts, potatoes and tomatoes are in the system but are not finished. Forestr orestry: Gives forest fire activity possibility forecast based on the Keetch-Byram Drought Index (KBDI). Also has management options for other climate scenarios as well as links to extension resources and industry Web sites.
17 Using Climate Forecasts in Agriculture Lesson Plan 17 Pasture and Livest estock: ock: Offers documentation of the effect of climate differences on pasture and hay and livestock production, such as planting cool and warm season grasses, fertilization, grazing and stocking rates, forage quality and pasture improvement. Climate e and El Niño: Provides background information about the El Niño event in the tropical Pacific and how it influences the climate of the Southeast U.S., graphics and animation showing El Niño events impact on temperature and rain across the region. It also includes links to general climate and weather resources on the Worldwide Web. Your our Feedback and About bout : Your Feedback section collects knowledge, thoughts, attitudes, and possible use of seasonal climate forecasts from visitors to AgClimate. The About section covers AgClimate and the SECC. Part 13: Summary and Wrap-Up Time: minutes es SLIDE Prior to answering your audience s final questions or comment, provide a summary of key points from the training session: Climate is a long-term pattern of weather. Climate is an important influence on weather. Patterns of warming in the equatorial Pacific have a strong effect on climate and weather in the southeast U.S. Degree-days are a useful way of measuring how much energy for growth is available. Degree-days can also be used to determine heat stress in livestock. The AgClimate Web site provides information and decision-making tools based on climate research. The AgClimate Web site can be found at: < Thank your audience for their attention and participation. Encourage them to visit the AgClimate Web site and learn more about the decision-making tools it provides. Participants may wish to know about other training units related to climate. Visit the Florida SART Web site to find out more.
18 18 Using Climate Forecasts in Agriculture Lesson Plan Participant s Evaluation of Using Climate Forecasts in Agriculture Please circle the number that best expresses your opinions about the following statements. 1. The training module s format was appropriate. 2 The information presented is useful to me. 3. The time it took to complete this module was acceptable. 4. The reasons that climate can pose risks to agriculture were explained. 5. The importance of climate forecasting was explained in sufficient detail. 6. The climate phases -- El Niño, La Niña, and Neutral -- were adequately explained. 7. The influence of climate phases on rainfall, temperature, and several other factors was adequately explained. 8. It was clearly explained that the AgClimate Web site provides useful climate information for agricultural producers. 9. As a result of the session, you are likely to look further into using the AgClimate Web site. 10. We welcome your comments about this program: Fully Dis- Neutral Agree Fully Dis- Agree Agree Agree Please use the back of this sheet for any further comments. Thank you for your time!
19 Using Climate Forecasts in Agriculture Lesson Plan 19 Using Climate Forecasts in Agriculture Participant Pre-Test This pre-test is intended to gauge the level of knowledge that you have before participating in the Using Climate Forecasts in Agriculture training. Please answer all the following questions to the best of your ability. 1. What is the major difference between climate and weather? 2. Climate forecasts can assist producers in what activity: 3 Name the three important climate features caused by sea surface temperature: 4. The climate phases listed in question 3 affect Florida agriculture most strongly in what season? 5. List six areas affected by the climate phases listed in question Which climate phase can cause winter temperatures to be lower than normal? 7. However, damaging freezes are most likely during what climate phase? 8. Degree-days are a measure of: 9. List information items available through the AgClimate Web site that are most important to you.
20 20 Using Climate Forecasts in Agriculture Lesson Plan Using Climate Forecasts in Agriculture Participant Post-Test This post-test is intended to gauge the level of knowledge that you have after participating in the Using Climate Forecasts in Agriculture training. Please answer all the following questions to the best of your ability. 1. What is the major difference between climate and weather? 2. Climate forecasts can assist producers in what activity: 3 Name the three important climate features caused by sea surface temperature: 4. The climate phases listed in question 3 affect Florida agriculture most strongly in what season? 5. List six areas affected by the climate phases listed in question Which climate phase can cause winter temperatures to be lower than normal? 7. However, damaging freezes are most likely during what climate phase? 8. Degree-days are a measure of: 9. List information items available through the AgClimate Web site that are most important to you.
21 Using Climate Forecasts in Agriculture Lesson Plan 21 Answer Key to Climate Forecasts in Agriculture Pre- and Post-Tests 1. What is the major difference betw tween climate e and weather? long-term versus short-term; duration; length of time 2. Climate e forecasts can assist producer oducers s in what activity: planning; decision-making (some may list specific tasks, such as planting, etc.) 3 Name the three impor portant climate e features caused by y sea surface tem emperature: El Niño, La Niña, and Neutral 4. The climate phases listed in question 3 affect Florida agriculture most strongly in what season? winter 5. List six areas affect ected ed by y the climate phases listed in question 3. rainfall, temperature, freezes, hurricanes, wild fires, crop production 6. Which climate phase can cause winter tem emperatures to be lower than normal? El Niño 7. However er,, damaging freezes are most likely during what climate phase? Neutral 8. Degree-days are a measure of: the energy available for plant growht or development 9. List information items available ailable through the AgClimat gclimate Web site that are most impor portant to you. (Answers will vary.)
22 22 Using Climate Forecasts in Agriculture Lesson Plan
23 Using Climate Forecasts in Agriculture Lesson Plan 23 PowerPoint Slides Slides 1-6
24 24 Using Climate Forecasts in Agriculture Lesson Plan PowerPoint Slides Slides 7-12
25 Using Climate Forecasts in Agriculture Lesson Plan 25 PowerPoint Slides Slides 13-18
26 26 Using Climate Forecasts in Agriculture Lesson Plan PowerPoint Slides Slides 19-24
27 Using Climate Forecasts in Agriculture Lesson Plan 27 PowerPoint Slides Slides 25-30
28 28 Using Climate Forecasts in Agriculture Lesson Plan PowerPoint Slides Slides 31-36
29 Using Climate Forecasts in Agriculture Lesson Plan 29 PowerPoint Slides Slides 37-42
30 30 Using Climate Forecasts in Agriculture Lesson Plan PowerPoint Slides Slides 43
31 Using Climate Forecasts in Agriculture Lesson Plan 31 PowerPoint Slides The Using Climate Forecasts in Agriculture PowerPoint slides are reproduced full-size on the following pages. You can use these pages as a display or photocopy them onto plastic overhead sheets for use with an overhead projector. Color versions of these slides can be downloaded from the SART Web site: <
32 [ SLIDE 1 ]

33 Slide 1
34 [ SLIDE 2 ]

35
36 [ SLIDE 3 ]

37
38 [ SLIDE 4 ]

39
40 [ SLIDE 5 ]

41
42 [ SLIDE 6 ]

43
44 [ SLIDE 7 ]

45
46 [ SLIDE 8 ]

47
48 [ SLIDE 9 ]
49
50 [ SLIDE 10 ]
51
52 [ SLIDE 11 ]
53
54 [ SLIDE 12 ]
55
56 [ SLIDE 13 ]

57
58 [ SLIDE 14 ]
59
60 [ SLIDE 15 ]
61
62 [ SLIDE 16 ]

63
64 [ SLIDE 17 ]

65
66 [ SLIDE 18 ]
67
68 [ SLIDE 19 ]
69
70 [ SLIDE 20 ]
71
72 [ SLIDE 21 ]
73
74 [ SLIDE 22 ]
75
76 [ SLIDE 23 ]

77
78 [ SLIDE 24 ]

79
80 [ SLIDE 25 ]
81
82 [ SLIDE 26 ]
83
84 [ SLIDE 27 ]
85
86 [ SLIDE 28 ]

87
88 [ SLIDE 29 ]
89
90 [ SLIDE 30 ]

91
92 [ SLIDE 31 ]

93
94 [ SLIDE 32 ]

95
96 [ SLIDE 33 ]
97
98 [ SLIDE 34 ]

99
100 [ SLIDE 35 ]

101
102 [ SLIDE 36 ]

103
104 [ SLIDE 37 ]

105
106 [ SLIDE 38 ]
107
108 [ SLIDE 39 ]
109
110 [ SLIDE 40 ]
111
112 [ SLIDE 41 ]

113
114 [ SLIDE 42 ]
115
116 [ SLIDE 43 ]

117
118 Introducing SART Lesson Plan 119 PowerPoint Slides Handout Pages The Using Climate Forecasts in Agriculture PowerPoint slides are reproduced on the following pages at reduced size with space for participant notes. Also included in Using Climate Forecasts in Agriculture Workbook, available on the SART Web site: <
119 Using Climate Forecasts in Agriculture page 1 Slides 1-3
120 Using Climate Forecasts in Agriculture page 2 Slides 4-6


121 Using Climate Forecasts in Agriculture page 3 Slides 7-9


122 Using Climate Forecasts in Agriculture page 4 Slides 10-12


123 Using Climate Forecasts in Agriculture page 5 Slides 13-15

124 Using Climate Forecasts in Agriculture page 6 Slides 16-18


125 Using Climate Forecasts in Agriculture page 7 Slides 19-21
126 Using Climate Forecasts in Agriculture page 8 Slides 22-24


127 Using Climate Forecasts in Agriculture page 9 Slides 25-27


128 Using Climate Forecasts in Agriculture page 10 Slides 28-30

129 Using Climate Forecasts in Agriculture page 11 Slides 31-33
130 Using Climate Forecasts in Agriculture page 12 Slides 34-36


131 Using Climate Forecasts in Agriculture page 13 Slides 37-39


132 Using Climate Forecasts in Agriculture page 14 Slides 40-42
133 Using Climate Forecasts in Agriculture page 15 Slides 43
Climate Outlook through 2100 South Florida Ecological Services Office Vero Beach, FL September 9, 2014
 Climate Outlook through 2100 South Florida Ecological Services Office Vero Beach, FL September 9, 2014 Short Term Drought Map: Short-term (
Issue Overview: El Nino and La Nina
 Issue Overview: El Nino and La Nina By Bloomberg, adapted by Newsela staff on 09.28.16 Word Count 748 TOP: A Category 5 typhoon in the Pacific Ocean. BOTTOM: Graphics courtesy of the U.S. National Oceanic
Climate Outlook through 2100 South Florida Ecological Services Office Vero Beach, FL January 13, 2015
 Climate Outlook through 2100 South Florida Ecological Services Office Vero Beach, FL January 13, 2015 Short Term Drought Map: Short-term (
MDA WEATHER SERVICES AG WEATHER OUTLOOK. Kyle Tapley-Senior Agricultural Meteorologist May 22, 2014 Chicago, IL
 MDA WEATHER SERVICES AG WEATHER OUTLOOK Kyle Tapley-Senior Agricultural Meteorologist May 22, 2014 Chicago, IL GLOBAL GRAIN NORTH AMERICA 2014 Agenda Spring Recap North America Forecast El Niño Discussion
Name. El Nino. by Cindy Grigg
 Name El Nino by Cindy Grigg Answer the following questions BEFORE you read this book. It is okay if you do not know as much as you thought. Do the best you can! 1. What do you already know about El Nino?
Weather and Climate Summary and Forecast October 2017 Report
 Weather and Climate Summary and Forecast October 2017 Report Gregory V. Jones Linfield College October 4, 2017 Summary: Typical variability in September temperatures with the onset of fall conditions evident
Table 1. August average temperatures and departures from normal ( F) for selected cities.
 for selected cities.") Climate Summary for Florida August 2016 Prepared by Lydia Stefanova and David Zierden Florida Climate Center, The Florida State University, Tallahassee, Florida Online at: http://climatecenter.fsu.edu/products-services/summaries
Climate Summary for Florida August 2016 Prepared by Lydia Stefanova and David Zierden Florida Climate Center, The Florida State University, Tallahassee, Florida Online at: http://climatecenter.fsu.edu/products-services/summaries
Weather and Climate Summary and Forecast November 2017 Report
 Weather and Climate Summary and Forecast November 2017 Report Gregory V. Jones Linfield College November 7, 2017 Summary: October was relatively cool and wet north, while warm and very dry south. Dry conditions
Winter. Here s what a weak La Nina usually brings to the nation with tempseraures:
 2017-2018 Winter Time again for my annual Winter Weather Outlook. Here's just a small part of the items I considered this year and how I think they will play out with our winter of 2017-2018. El Nino /
El Niño / Southern Oscillation
 El Niño / Southern Oscillation Student Packet 2 Use contents of this packet as you feel appropriate. You are free to copy and use any of the material in this lesson plan. Packet Contents Introduction on
 Page 1 of 5 Home research global climate enso effects Research Effects of El Niño on world weather Precipitation Temperature Tropical Cyclones El Niño affects the weather in large parts of the world. The
Pacific Decadal Oscillation ( PDO ):
:") Time again for my annual Winter Weather Outlook. Here's just a small part of the items I considered this year and how I think they will play out with our winter of 2015-2016. El Nino / La Nina: When looking
Time again for my annual Winter Weather Outlook. Here's just a small part of the items I considered this year and how I think they will play out with our winter of 2015-2016. El Nino / La Nina: When looking
Ocean in Motion 7: El Nino and Hurricanes!
 Ocean in Motion 7: El Nino and Hurricanes! A. Overview 1. Ocean in Motion -- El Nino and hurricanes We will look at the ocean-atmosphere interactions that cause El Nino and hurricanes. Using vocabulary
Weather and Climate Summary and Forecast March 2018 Report
 Weather and Climate Summary and Forecast March 2018 Report Gregory V. Jones Linfield College March 7, 2018 Summary: The ridge pattern that brought drier and warmer conditions from December through most
Weather versus Climate: What is the difference? Sources of Weather Information
 Joel O. Paz, Extension Agrometerologist and Gerrit Hoogenboom, Professor & REI Coordinator Department of Biological and Agricultural Engineering Weather versus Climate: What is the difference? The difference
Weather and Climate Summary and Forecast August 2018 Report
 Weather and Climate Summary and Forecast August 2018 Report Gregory V. Jones Linfield College August 5, 2018 Summary: July 2018 will likely go down as one of the top five warmest July s on record for many
Here s what a weak El Nino usually brings to the nation with temperatures:
 Time again for my annual Winter Weather Outlook. Here's just a small part of the items I considered this year and how I think they will play out with our winter of 2018-2019. El Nino / La Nina: When looking
Weather and Climate Summary and Forecast February 2018 Report
 Weather and Climate Summary and Forecast February 2018 Report Gregory V. Jones Linfield College February 5, 2018 Summary: For the majority of the month of January the persistent ridge of high pressure
Weather and Climate Summary and Forecast Winter
 Weather and Climate Summary and Forecast Winter 2016-17 Gregory V. Jones Southern Oregon University February 7, 2017 What a difference from last year at this time. Temperatures in January and February
Weather and Climate Summary and Forecast December 2017 Report
 Weather and Climate Summary and Forecast December 2017 Report Gregory V. Jones Linfield College December 5, 2017 Summary: November was relatively cool and wet from central California throughout most of
Weather and Climate Summary and Forecast January 2018 Report
 Weather and Climate Summary and Forecast January 2018 Report Gregory V. Jones Linfield College January 5, 2018 Summary: A persistent ridge of high pressure over the west in December produced strong inversions
1 What Is Climate? TAKE A LOOK 2. Explain Why do areas near the equator tend to have high temperatures?
 CHAPTER 17 1 What Is Climate? SECTION Climate BEFORE YOU READ After you read this section, you should be able to answer these questions: What is climate? What factors affect climate? How do climates differ
Weather and Climate Summary and Forecast Summer 2017
 Weather and Climate Summary and Forecast Summer 2017 Gregory V. Jones Southern Oregon University August 4, 2017 July largely held true to forecast, although it ended with the start of one of the most extreme
SEASONAL RAINFALL FORECAST FOR ZIMBABWE. 28 August 2017 THE ZIMBABWE NATIONAL CLIMATE OUTLOOK FORUM
 2017-18 SEASONAL RAINFALL FORECAST FOR ZIMBABWE METEOROLOGICAL SERVICES DEPARTMENT 28 August 2017 THE ZIMBABWE NATIONAL CLIMATE OUTLOOK FORUM Introduction The Meteorological Services Department of Zimbabwe
Name Date Class. growth rings of trees, fossilized pollen, and ocean. in the northern hemisphere.
 Lesson Outline LESSON 2 A. Long-Term Cycles 1. A(n) climate cycle takes much longer than a lifetime to complete. a. To learn about long-term climate cycles, scientists study natural records, such as growth
Agricultural Outlook Forum Presented: February 17, 2006 THE SCIENCE BEHIND THE ATLANTIC HURRICANES AND SEASONAL PREDICTIONS
 Agricultural Outlook Forum Presented: February 17, 2006 THE SCIENCE BEHIND THE ATLANTIC HURRICANES AND SEASONAL PREDICTIONS Gerald Bell Meteorologist, National Centers for Environmental Prediction NOAA,
Climate Variability and El Niño
 Climate Variability and El Niño David F. Zierden Florida State Climatologist Center for Ocean Atmospheric Prediction Studies The Florida State University UF IFAS Extenstion IST January 17, 2017 The El
National Wildland Significant Fire Potential Outlook
 National Wildland Significant Fire Potential Outlook National Interagency Fire Center Predictive Services Issued: September, 2007 Wildland Fire Outlook September through December 2007 Significant fire
Weather and Climate Summary and Forecast Winter
 Weather and Climate Summary and Forecast Winter 2016-17 Gregory V. Jones Southern Oregon University December 5, 2016 Well after an October that felt more like November, we just finished a November that
Warm Up Vocabulary Check
 Warm Up Vocabulary Check Surface current Coriolis Effect global winds upwelling Gulf Stream deep current climate El Nino convection current continental deflection 1.The apparent curving of the path of
Weather and Climate Summary and Forecast January 2019 Report
 Weather and Climate Summary and Forecast January 2019 Report Gregory V. Jones Linfield College January 4, 2019 Summary: December was mild and dry over much of the west, while the east was much warmer than
NIWA Outlook: October - December 2015
 October December 2015 Issued: 1 October 2015 Hold mouse over links and press ctrl + left click to jump to the information you require: Overview Regional predictions for the next three months: Northland,
Weather and Climate Summary and Forecast Fall/Winter 2016
 Weather and Climate Summary and Forecast Fall/Winter 2016 Gregory V. Jones Southern Oregon University November 5, 2016 After a year where we were seemingly off by a month in terms of temperatures (March
1 What Is Climate? TAKE A LOOK 2. Explain Why do areas near the equator tend to have high temperatures?
 CHAPTER 17 1 What Is Climate? SECTION Climate BEFORE YOU READ After you read this section, you should be able to answer these questions: What is climate? What factors affect climate? How do climates differ
Global Weather Trade Winds etc.notebook February 17, 2017
 Global Weather 1 north pole northern hemisphere equator southern hemisphere south pole 2 We have seasons because of the Earth's tilt The seasons are opposite in the northern and southern hemispheres winter
Module 3, Investigation 1: Briefing 2 The ENSO game: Predicting and managing for El Niño and La Niña
 Part 5. The ENSO game How can prediction help avoid ENSO s tragic human consequences? Scientists from around the world are involved in forecasting, with computer models and sophisticated measurements,
What a Hurricane Needs to Develop
 Weather Weather is the current atmospheric conditions, such as air temperature, wind speed, wind direction, cloud cover, precipitation, relative humidity, air pressure, etc. 8.10B: global patterns of atmospheric
Monthly Overview Rainfall
 Monthly Overview The month of November can be described as having had two parts. The first half of the month was categorised by regular severe weather warnings with large thunderstorms occurring over large
Weather and Climate Summary and Forecast April 2018 Report
 Weather and Climate Summary and Forecast April 2018 Report Gregory V. Jones Linfield College April 4, 2018 Summary: A near Miracle March played out bringing cooler and wetter conditions to the majority
Percentage of normal rainfall for April 2018 Departure from average air temperature for April 2018
 New Zealand Climate Update No 227, May 2018 Current climate April 2018 Overall, April 2018 was characterised by lower pressure than normal over and to the southeast of New Zealand. Unlike the first three
Monthly overview. Rainfall
 Monthly overview 1 to 10 April 2018 Widespread rainfall continued to fall over most parts of the summer rainfall region during this period. Unseasonably good rain fell over the eastern half of the Northern
Percentage of normal rainfall for August 2017 Departure from average air temperature for August 2017
 New Zealand Climate Update No 219, August 2017 Current climate August 2017 Overall, mean sea level pressure was lower than normal over and to the west of New Zealand during August while higher than normal
Name: Date: Hour: Comparing the Effects of El Nino & La Nina on the Midwest (E4.2c)
") Purpose: Comparing the Effects of El Nino & La Nina on the Midwest (E4.2c) To compare the effects of El Nino and La Nina on the Midwest United States. Background Knowledge: The El Nino-Southern Oscillation
Purpose: Comparing the Effects of El Nino & La Nina on the Midwest (E4.2c) To compare the effects of El Nino and La Nina on the Midwest United States. Background Knowledge: The El Nino-Southern Oscillation
El Niño Update Impacts on Florida
 Current Issues in Emergency Management (CIEM) Sessions 1 &2 October 12 th and 26 th, 2006 Florida Division of Emergency Management Tallahassee, Florida El Niño Update Impacts on Florida Bart Hagemeyer
Weather and Climate Summary and Forecast October 2018 Report
 Weather and Climate Summary and Forecast October 2018 Report Gregory V. Jones Linfield College October 4, 2018 Summary: Much of Washington, Oregon, coastal California and the Bay Area and delta region
The New Normal or Was It?
 The New Normal or Was It? by Chuck Coffey The recent drought has caused many to reflect upon the past and wonder what is in store for the future. Just a couple of years ago, few agricultural producers
Drought Impacts in the Southern Great Plains. Mark Shafer University of Oklahoma Norman, OK
 Drought Impacts in the Southern Great Plains Mark Shafer University of Oklahoma Norman, OK Causes of Drought: Large-Scale, Stationary High Pressure Air rotates clockwise around high pressure steers storms
Texas Wildland Fire Season Outlook. for. Winter 2009
 Texas Wildland Fire Season Outlook for Winter 2009 December 5, 2008 Contents Section Page Executive Summary 1 Introduction 2 Underlying Fuels Condition 4 Weather Outlook 8 Findings 10 Credits 11 Attachments
Degree Days: Heating, Cooling, and Growing 1
 ABE 381 Degree Days: Heating, Cooling, and Growing 1 Clyde W. Fraisse, John Bellow and Charles Brown 2 Heating and Cooling Degree-Days People often discuss how hot or cold it is. Usually, it is a question
Fire Weather Drivers, Seasonal Outlook and Climate Change. Steven McGibbony, Severe Weather Manager Victoria Region Friday 9 October 2015
 Fire Weather Drivers, Seasonal Outlook and Climate Change Steven McGibbony, Severe Weather Manager Victoria Region Friday 9 October 2015 Outline Weather and Fire Risk Environmental conditions leading to
November 28, 2017 Day 1
 November 28, 2017 Day 1 Air Masses & Fronts Teachers- please out the sheet (right) for the students to fill in as we go! Review: Clouds & Precipitation? What are the 4 different clouds? Status, Cumulus,
Chapter 1 Study Guide
 Chapter 1 Study Guide Reminders: Vocabulary quiz and test will be on Tuesday, September 6th. Complete study guide and bring completed to school Friday, September 2nd. You are NOT required to print the
NIWA Outlook: March-May 2015
 March May 2015 Issued: 27 February 2015 Hold mouse over links and press ctrl + left click to jump to the information you require: Overview Regional predictions for the next three months: Northland, Auckland,
Monthly overview. Rainfall
 Monthly overview 1-10 August 2018 The month started off with light showers over the Western Cape. A large cold front made landfall around the 5th of the month. This front was responsible for good rainfall
Impacts of Climate on the Corn Belt
 Impacts of Climate on the Corn Belt Great Lakes Crop Summit 2015 2015 Evelyn Browning Garriss Conclusions Climate change is not linear. It ebbs and flows. Recent polar volcano eruptions created a cool
1 What Is Climate? TAKE A LOOK 2. Explain Why do areas near the equator tend to have high temperatures?
 CHAPTER 3 1 What Is Climate? SECTION Climate BEFORE YOU READ After you read this section, you should be able to answer these questions: What is climate? What factors affect climate? How do climates differ
How strong does wind have to be to topple a garbage can?
 How strong does wind have to be to topple a garbage can? Imagine winds powerful enough to pick up a truck and toss it the length of a football field. Winds of this extreme sometimes happen in a tornado.
Weather and Climate Summary and Forecast March 2019 Report
 Weather and Climate Summary and Forecast March 2019 Report Gregory V. Jones Linfield College March 2, 2019 Summary: Dramatic flip from a mild winter to a top five coldest February on record in many locations
South Asian Climate Outlook Forum (SASCOF-6)
") Sixth Session of South Asian Climate Outlook Forum (SASCOF-6) Dhaka, Bangladesh, 19-22 April 2015 Consensus Statement Summary Below normal rainfall is most likely during the 2015 southwest monsoon season
Sixth Session of South Asian Climate Outlook Forum (SASCOF-6) Dhaka, Bangladesh, 19-22 April 2015 Consensus Statement Summary Below normal rainfall is most likely during the 2015 southwest monsoon season
Northwest Outlook September 2017
 Northwest Outlook September 2017 Hot and dry August August 2017 continued with the pattern established in June and July that featured a large, semipermanent ridge in the flow of the jet stream. Temperatures
CLIMATOLOGICAL REPORT 2002
 Range Cattle Research and Education Center Research Report RC-2003-1 February 2003 CLIMATOLOGICAL REPORT 2002 Range Cattle Research and Education Center R. S. Kalmbacher Professor, IFAS, Range Cattle Research
Climate versus Weather
 Climate versus Weather What is climate? Climate is the average weather usually taken over a 30-year time period for a particular region and time period. Climate is not the same as weather, but rather,
Weather Atmospheric condition in one place during a limited period of time Climate Weather patterns that an area typically experiences over a long
 Weather Atmospheric condition in one place during a limited period of time Climate Weather patterns that an area typically experiences over a long period of time Many factors influence weather & climate
Effect of El Niño Southern Oscillation (ENSO) on the number of leaching rain events in Florida and implications on nutrient management
 on the number of leaching rain events in Florida and implications on nutrient management") Effect of El Niño Southern Oscillation (ENSO) on the number of leaching rain events in Florida and implications on nutrient management C. Fraisse 1, Z. Hu 1, E. H. Simonne 2 May 21, 2008 Apopka, Florida
Effect of El Niño Southern Oscillation (ENSO) on the number of leaching rain events in Florida and implications on nutrient management C. Fraisse 1, Z. Hu 1, E. H. Simonne 2 May 21, 2008 Apopka, Florida
Monthly Overview. Rainfall
 Monthly Overview Weather news during February 2017 was dominated by the arrival of Tropical Cyclone Dineo, the first cyclone to make landfall over southern Africa since cyclone Eline in February 2000.
Midwest/Great Plains Climate-Drought Outlook September 20, 2018
 Midwest/Great Plains Climate-Drought Outlook September 20, 2018 Brian Fuchs National Drought Mitigation Center University of Nebraska-Lincoln School of Natural Resources September 20, 2018 General Information
New Zealand Climate Update No 223, January 2018 Current climate December 2017
 New Zealand Climate Update No 223, January 2018 Current climate December 2017 December 2017 was characterised by higher than normal sea level pressure over New Zealand and the surrounding seas. This pressure
Seasonal Climate Watch January to May 2016
 Seasonal Climate Watch January to May 2016 Date: Dec 17, 2015 1. Advisory Most models are showing the continuation of a strong El-Niño episode towards the latesummer season with the expectation to start
Weather Atmospheric condition in one place during a limited period of time Climate Weather patterns that an area typically experiences over a long
 Weather Atmospheric condition in one place during a limited period of time Climate Weather patterns that an area typically experiences over a long period of time Many factors influence weather & climate
Extreme Rainfall in the Southeast U.S.
 Extreme Rainfall in the Southeast U.S. David F. Zierden Florida State Climatologist Center for Ocean Atmospheric Prediction Studies The Florida State University March 7, 2016 Causes of Extreme Rainfall
NIWA Outlook: April June 2019
 April June 2019 Issued: 28 March 2019 Hold mouse over links and press ctrl + left click to jump to the information you require: Outlook Summary Regional predictions for the next three months Northland,
Wind: Global Systems Chapter 10
 Wind: Global Systems Chapter 10 General Circulation of the Atmosphere General circulation of the atmosphere describes average wind patterns and is useful for understanding climate Over the earth, incoming
Northwest Outlook October 2016
 Northwest Outlook October 2016 Rainfall Opportunities and Challenges Rainfall over the month of September presented some challenges for the fall harvest while other producers benefitted. Figure 1a shows
Eastern Shore Weather and Climate. Bill Sammler Warning Coordination Meteorologist National Weather Service Wakefield, VA
 Eastern Shore Weather and Climate Bill Sammler Warning Coordination Meteorologist National Weather Service Wakefield, VA About The NWS The National Weather Service is: A Federal Government Agency Part
New Zealand Climate Update No 226, April 2018 Current climate March 2018
 New Zealand Climate Update No 226, April 2018 Current climate March 2018 March 2018 was characterised by significantly higher pressure than normal to the east of New Zealand. This pressure pattern, in
New Zealand Climate Update No 222, November 2017 Current climate November 2017
 New Zealand Climate Update No 222, November 2017 Current climate November 2017 November 2017 was characterised by higher than normal sea level pressure over New Zealand and the surrounding seas, particularly
Climate Change Impact on Air Temperature, Daily Temperature Range, Growing Degree Days, and Spring and Fall Frost Dates In Nebraska
 EXTENSION Know how. Know now. Climate Change Impact on Air Temperature, Daily Temperature Range, Growing Degree Days, and Spring and Fall Frost Dates In Nebraska EC715 Kari E. Skaggs, Research Associate
Will a warmer world change Queensland s rainfall?
 Will a warmer world change Queensland s rainfall? Nicholas P. Klingaman National Centre for Atmospheric Science-Climate Walker Institute for Climate System Research University of Reading The Walker-QCCCE
Colorado State University (CSU) Atlantic Hurricane Season Forecast
 Atlantic Hurricane Season Forecast") Colorado State University (CSU) Atlantic Hurricane Season Forecast Dr. Philip Klotzbach of Colorado State University (CSU) has issued his April forecast for the 2018 Atlantic Hurricane Season. The forecast
Colorado State University (CSU) Atlantic Hurricane Season Forecast Dr. Philip Klotzbach of Colorado State University (CSU) has issued his April forecast for the 2018 Atlantic Hurricane Season. The forecast
Highlight: Support for a dry climate increasing.
 Scott A. Yuknis High impact weather forecasts, climate assessment and prediction. 14 Boatwright s Loop Plymouth, MA 02360 Phone/Fax 508.927.4610 Cell: 508.813.3499 ClimateImpact@comcast.net Climate Impact
3) What is the difference between latitude and longitude and what is their affect on local and world weather and climate?
 What is the difference between latitude and longitude and what is their affect on local and world weather and climate?") www.discoveryeducation.com 1) Describe the difference between climate and weather citing an example of each. Describe how water (ocean, lake, river) has a local effect on weather and climate and provide
www.discoveryeducation.com 1) Describe the difference between climate and weather citing an example of each. Describe how water (ocean, lake, river) has a local effect on weather and climate and provide
Monthly Overview. Rainfall
 Monthly Overview Rainfall during August occurred mainly over the Western and Eastern Cape provinces, and KwaZulu- Natal. Rain in these provinces were regularly accompanied by cold fronts as they made landfall
Weather Systems Study Guide:
 Weather Systems Study Guide: 1. Draw a diagram of Earth s water cycle and label each part. 2. Explain how the water cycle works. 3. What happens in the troposphere and stratosphere? Atmosphere Level What
2011 Year in Review TORNADOES
 2011 Year in Review The year 2011 had weather events that will be remembered for a long time. Two significant tornado outbreaks in April, widespread damage and power outages from Hurricane Irene in August
WeatherManager Weekly
 Issue 288 July 14, 2016 WeatherManager Weekly Industries We Serve Agriculture Energy/Utilities Construction Transportation Retail Our Weather Protection Products Standard Temperature Products Lowest Daily
2013 Summer Weather Outlook. Temperatures, Precipitation, Drought, Hurricanes and why we care
 2013 Summer Weather Outlook Temperatures, Precipitation, Drought, Hurricanes and why we care Role of the ERCOT Meteorologist Forecasts Develop temperature input for hourly load forecasts (next day, days
Weather Outlook for Spring and Summer in Central TX. Aaron Treadway Meteorologist National Weather Service Austin/San Antonio
 Weather Outlook for Spring and Summer in Central TX Aaron Treadway Meteorologist National Weather Service Austin/San Antonio Outline A Look Back At 2014 Spring 2015 So Far El Niño Update Climate Prediction
NIWA Outlook: September October November 2013
 September-November 2013 Issued: 30 August 2013 Hold mouse over links and press ctrl + left click to jump to the information you require: Overview Regional predictions for the next three months: Northland,
2011 National Seasonal Assessment Workshop for the Eastern, Southern, & Southwest Geographic Areas
 2011 National Seasonal Assessment Workshop for the Eastern, Southern, & Southwest Geographic Areas On January 11-13, 2011, wildland fire, weather, and climate met virtually for the ninth annual National
Current and future climate of the Cook Islands. Pacific-Australia Climate Change Science and Adaptation Planning Program
 Pacific-Australia Climate Change Science and Adaptation Planning Program Penrhyn Pukapuka Nassau Suwarrow Rakahanga Manihiki N o r t h e r n C o o k I s l a nds S o u t h e Palmerston r n C o o k I s l
Please be ready for today by:
 Please be ready for today by: 1. HW out for a stamp 2. Paper and pencil/pen for notes 3. Be ready to discuss what you know about El Nino after you view the video clip What is El Nino? El Nino Basics El
UPDATE OF REGIONAL WEATHER AND SMOKE HAZE (December 2017)
") UPDATE OF REGIONAL WEATHER AND SMOKE HAZE (December 2017) 1. Review of Regional Weather Conditions for November 2017 1.1 In November 2017, Southeast Asia experienced inter-monsoon conditions in the first
UPDATE OF REGIONAL WEATHER AND SMOKE HAZE (December 2017) 1. Review of Regional Weather Conditions for November 2017 1.1 In November 2017, Southeast Asia experienced inter-monsoon conditions in the first
Climate Forecast Applications Network (CFAN)
") Forecast of 2018 Atlantic Hurricane Activity April 5, 2018 Summary CFAN s inaugural April seasonal forecast for Atlantic tropical cyclone activity is based on systematic interactions among ENSO, stratospheric
Forecast of 2018 Atlantic Hurricane Activity April 5, 2018 Summary CFAN s inaugural April seasonal forecast for Atlantic tropical cyclone activity is based on systematic interactions among ENSO, stratospheric
El Niño 2015/2016 Impact Analysis
 El Niño 2015/2016 Impact Analysis Dr Linda Hirons and Dr Nicolas Klingaman August 2015 This report has been produced by University of Reading and National Centre for Atmospheric Science for Evidence on
Massive Storms! 8.10C Identify the role of the oceans in the formation of weather systems such as hurricanes
 Massive Storms! 8.10C Identify the role of the oceans in the formation of weather systems such as hurricanes Instructional page: Each person in group will take on one portion or set of questions: Each
Impact on Agriculture
 Weather Variability and the Impact on Agriculture InfoAg 2017 Copyright 2017, awhere. All Rights Reserved The Problem: The Earth s Atmosphere is a Heat Engine In transition 1 C warming of atmosphere Triples
How Patterns Far Away Can Influence Our Weather. Mark Shafer University of Oklahoma Norman, OK
 Teleconnections How Patterns Far Away Can Influence Our Weather Mark Shafer University of Oklahoma Norman, OK Teleconnections Connectedness of large-scale weather patterns across the world If you poke
SEASONAL CLIMATE OUTLOOK VALID FOR JULY-AUGUST- SEPTEMBER 2013 IN WEST AFRICA, CHAD AND CAMEROON
 SEASONAL CLIMATE OUTLOOK VALID FOR JULY-AUGUST- SEPTEMBER 2013 IN WEST AFRICA, CHAD AND CAMEROON May 29, 2013 ABUJA-Federal Republic of Nigeria 1 EXECUTIVE SUMMARY Given the current Sea Surface and sub-surface
Colorado State University (CSU) Atlantic Hurricane Season Forecast
 Atlantic Hurricane Season Forecast") Colorado State University (CSU) Atlantic Hurricane Season Forecast Dr. Philip Klotzbach of Colorado State University (CSU) has issued his latest forecast for the Atlantic Hurricane Season. The forecast
Colorado State University (CSU) Atlantic Hurricane Season Forecast Dr. Philip Klotzbach of Colorado State University (CSU) has issued his latest forecast for the Atlantic Hurricane Season. The forecast
Lecture Outlines PowerPoint. Chapter 20 Earth Science 11e Tarbuck/Lutgens
 Lecture Outlines PowerPoint Chapter 20 Earth Science 11e Tarbuck/Lutgens 2006 Pearson Prentice Hall This work is protected by United States copyright laws and is provided solely for the use of instructors