Climate change and California's mountain snow pack how much will we lose?
|
|
|
- Juniper Simon
- 6 years ago
- Views:
Transcription

1 Water UCI Seminar 31 April, 2016 Irvine Climate change and California's mountain snow pack how much will we lose? Dan Cayan(1,2), 1. Scripps Ins4tu4on of Oceanography, UC San Diego 2. US Geological Survey thanks: David Pierce SIO Mary Tyree SIO Mike DeFnger USGS Phil Mote Oregon State Univ. Tapash Das CH2MHill U. Iris Stewart Santa Clara Observed Variability and Changes Projected Change-Pace and Detectability Sponsors: California Energy Commission NOAA RISA program DOE Calif Dept of Water Resources
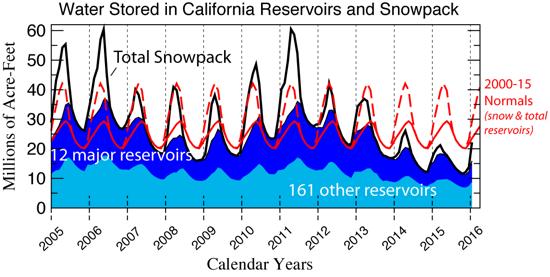
 in 12 major & 148 other California Reservoirs with Statewide April 1 Snow-water contents (stacked atop each other) 0 1970 1975 1980 1985 1990 1995 2000 2005 2010 2015 Calendar Years Total")
2 Spring snowpack water varies greatly from year to year but on average contains about 70% of the water stored in California s Reservoirs Million Acre-Feet TOTAL WATER STORED (monthly) in 12 major & 148 other California Reservoirs with Statewide April 1 Snow-water contents (stacked atop each other) Calendar Years Total Water in Apr 1 Snowpack 148 other reservoirs extraordinarily low snowpack in 2014 and 2015 Total storage in: Shasta Oroville Trinity New Melones San Luis Don Pedro Exchequer Pine Flat Folsom Millerton Castaic Perris Figure 1 Monthly totals of water stored in (dark blue) 12 major reservoirs and (light blue) 148 other, mostly smaller reservoirs, stacked on top of each other, and (green bars) estimated statewide-total of water stored in April 1 snowpacks each year, January 1970 through April 2015


3 dry spell is characteristic of California s volatile precipitation climate Sacramento Delta Drainage Annual Precipitation coef of Variation 33% mean 19.7 inches std dev 6.6 inches California has a narrow seasonal window to generate its annual water supply. If atmospheric conditions are unfavorable during that period, a dry year results 2014 ~50% of long term average California Climate Tracker Western Regional Climate Center

4 last 4 years in California preponderance of warm daytime and night-time temperatures Tmax dark black line long term average Tmin

5 Extraordinarily low western U.S. Snow Pack Spring 2015 Spring 2010 a more normal snow year
6 Temperature is only moderately correlated with California Snowpack but lowest snow years tend to be quite warm Temperature DJF April 1st Snowpack (percent of normal) 200% 150% 100% 50% 0 SWE Apr
7 Annual Temperature global Western conterminous U.S. Freezing Level N American Freezing Level Tracker Western Regional Climate Center

 Mike Dettinger,")
8 Western Snowpack declines continue TRENDS in! April 1 snow-water content at! western snow courses! DIFFERENCES in! April 1 snow-water content at! western snow courses! s minus (past 61 yr) Mike Dettinger, after Phil Mote et al
9 Snow losses (Apr 1) have occurred in lower (warmer) elevations as shown directly from snow course observations (blue) and VIC model reanalysis (red) by Phil Mote and colleagues (2005) 9

10 994 JOURNAL OF HYDROMETEOROLOGY 996 VOLUME 12 JOURNAL OF HYDROMETEOROLOGY 996 Advance in snowmelt streamflow by few-several days VOLUME 12 JOURNAL OF HYDROM change in center of timing shift toward earlier flows in snow-dominated streams shown by changes in monthly fraction of annual flow higher winter/spring flows Lower spring/summer flows FIG. 5. Trends in fraction of annual streamflow for the period, categorized by SDCs. (1 3). FIG. 3. Trends in CT for each SDC. Trend values are given in days over the 61-yr period. Iris T. andof Edzer Pebesma, 2011: FHolger IG. 5.Fritze, Trends instewart, fraction annual streamflow for the 19 Shifts in Western North American Snowmelt Runoff. J. Hydrometeor, 12, ~ In lines with change in perslopeobtained after from a particular time Y. magnitude of the CT shifts and gauge elevation are shown category shifts. Sufficiently largeachanges in the the Parameter-elevation Regressions on centage of snowmelt runoff pulses caused basins to re- Independent Slopes Model (PRISM), ~ a high-quality, by Yi 2 Y, addition to y, we define a secondary predictor2.58 in Fig. 3. Many of the higher-elevation, snowmelt~ In ceive different classifications for thei first and second topographically sensitive, climate in slope after a particular time Y. lines minutes with (4akm) change mag set all the negative values of this vector to zero, and call it dominated streams are now flowing earlier by 6 12 subperiod and be identified as having experienced a data grid that uses a combined statistical and geographic ~ days
11 Annual Temperature global Western conterminous U.S. Freezing Level N American Freezing Level Tracker Western Regional Climate Center

12 To estimate water balance, Including snow water we use the Variable Infiltration Capacity (VIC) model,a land surface hydrologic water/energy accounting model. VIC is run offline from GCMs or RCMs, using downscaled precipitation,temperature and winds as input variables. Most of the results here are from VIC calculations run at 1/8 (12km), although more recently we are using a finer (1/16 ) downscaling and attendant VIC hydrology. The GCMs, downscaling and VIC simulations cover They have been run using 2 scenarios of future GHG concentration, SRES B1 and A2 or RCP 4.5 and 8.5. Liang, X., Lettenmaier, D.P., Wood, E.P., Burges, S.J., A simple hydrologically based model of land surface water and energy fluxes for GSMs. J. Geophys. Res 99 (D7),

 driven by downscaled precipitation and")
13 We considered 32 simulations 16 AR4 GCM s 16 A2 and 16B1 BCSD downscaled to 12 km Map depicts elevation >800m Sierra Nevada+ high terrain Hydrology translated using VIC (Variable Infiltration Capacity) driven by downscaled precipitation and temperature
14 VIC modeled vs snow course (35 sites) observed April 1 SWE correla4on=0.97 observed modeled VIC snow accumulation agrees closely with observed snow course observations variability of Apr 1 Snow Water Equivalent (SWE), VIC modeled vs. observations avg of 35 snow courses
15 end of 21 st Century median ΔT ~3 C ΔT= 2 C historical mean T 2.5 C
16 change in snow water projected for Sierra Nevada+ is substantial 16 GCMs, A2 and B1 emissions scenarios declining Apr 1 SWE: 2050 median SWE ~ 2/3 historical median 2100 median SWE ~ 1/3 historical median


17 90 th %ile Precipitation precipita4on considerable variability but li]le overall change Snow Water Equivalent 10 th %ile but spring snow declines steadily
 fluctuations: +1 C ΔT!")
18 precipitation fluctuations drive year-to-year SWE fluctuations but progressive climate warming diminishes California spring SWE Precipitation (ONDJFM) fluctuations: ±10% Δprecip! ±16% ΔSWE but precip fluctuations are not trending Temperature (ONDJFM) fluctuations: +1 C ΔT! -23% ΔSWE and ttemperature change is trending strongly Precipita4on-driven SWE change--do]ed Temperature-driven SWE change--solid

 Knowles, N., and D.R.")
19 Loss of California Spring Snowpack from 21 st Century warming Under this scenario, California loses half of its spring (April 1) snow pack due to climate warming. Less snow, more rain, par4cularly at lower eleva4ons. The result is earlier run-off, more floods, Less stored water. This simulation by Noah Knowles is guided by temperature changes from PCM s Business-as-usual coupled climate simulation. (this is a low-middle of the road emissions and warming scenario) Knowles, N., and D.R. Cayan, 2002: Poten4al effects of global warming on the Sacramento/San Joaquin watershed and the San Francisco estuary. Geophysical Research LeDers, 29(18), 1891.

20 regional snow and hydrology a sensitive index of climate variation and change Douglas Alden Scripps Institution of Oceanography Installing met station Lee Vining, CA

21 As climate warms in this RCP 8.5 ensemble averaged over all all eight regions, all snow related measures change, but those that are most strongly dominated by temperature change more rapidly. David Pierce, D. Cayan : The uneven response of different snow measures to human-induced climate warming. Journal of Climate

22 Projected change temperature and precipita4on 31 Global Climate Models RCP 8.5 Los Angeles region S C a wetter a warmer future but uncertain changes in precipita4on warmer
23 Projected change temperature and precipita4on 31 Global Climate Models RCP 8.5 Los Angeles region wetter a warmer future but uncertain changes in precipita4on warmer
24 Projected change temperature and precipita4on 31 Global Climate Models RCP 8.5 Los Angeles region wetter a warmer future but uncertain changes in precipita4on warmer

25 Median Apr 1 SWE 11.9cm over 21 st Century occurs a marked decline of chances of reaching or exceeding historical median Snow Water Equivalent Sierra Nevada+ 10% 40% 10 th % Apr 1 SWE 3.6cm.and, chances of historical 10 th percentile or less SWE increases greatly

26 According to VIC--- end-of-century April 1 SWE losses in California occur mostly because of increased rainfall (and decreased snowfall), but are compounded by Increased snowmelt David Pierce, D. Cayan : The uneven response of different snow measures to human-induced climate warming. Journal of Climate
27 Projections indicate Increasing Flood Flows 50 year return period annual maximum 3-day floods for both Northern (shown below) and Southern Sierra Nevada from VIC simulations Northern Sierra Nevada % change in 50-yrs floods (2% exceedence) 5% significance 5% significance SRES A2 SRES B1 some, not all, of flood flow increase can be attributed to change in rain/snow and snowmelt Percentage change in 50-yrs (2% exceedence) flood discharge. The % change is computed with respect to the 50-yrs flood computed over the period The second, third and next on points are computed for the period with 10-yrs sliding period (e.g., the second point represents change of the flood magnitude computed for the period with respect to flood discharge computed in the period ). The plot shows 25th, 50th and 75th percentiles from sixteen climate models from SRESA2 (red color curves) and SRESB1 (blue color curves) simulations for Northern Sierra Nevada (left) and Southern Sierra Nevada (right). In the plot, black color curves show the % change in 50-yrs flood with respect to historical flood ( ) from VIC simulation as simulated by historical observed meteorologies (Hamlet and Lettenmaier, 2005). 5% significant level computed using a long control simulation (750-yrs) from PCM1 is shown as dotted gray lines. Numbers in the x-axis indicate the middle year of each 49-yrs time window used to compute the flood. Das, T., M.D. Dettinger, a D.R. Cayan and H.G. Hidalgo, 2011: Potential increase in floods in California's Sierra Nevada under future climate projections. Climatic Change

 middle 21st late 21st Cayan et al.")
28 early 21st Drier Summer Landscapes increased warming and diminished snow causes successively greater soil drying throughout 21 st Century (this picture could change somewhat under more recent CMIP5 simulations) middle 21st late 21st Cayan et al. Ch 6 Southwest Climate Assessment

29 since 1985 the number of large wildfires in western U.S. increased four-fold relative to previous 15 years, mostly forest fires, not shrubland fires Anthony Westerling et al. Science August


30 large summer wildfires occur more ooen in years with early/warm springs Late Snowmelt Years Early Snowmelt Years , NPS, USFS & BIA Fires over 1000 acres Area burned is propor4onal to size of red dots The warming and earlier springs during last few decades have extended and intensified the fire season in mid-eleva4on forests Tony Westerling et al Science 2006

31 Summary Variability of seasonal snowpack in western U.S. will con4nue to be strongly Influenced by amount of winter/spring precipita4on, but warmer temperatures will play an increasing role. In California, VIC hydrological simula4ons exhibit loss of aggregate spring Snowpack that equates to- 23% Apr 1 SWE per +1 C of warming. Snow and snowmelt hydrology is already changing: Less snow, more rain Diminished spring snow pack in mid- and low eleva4ons Earlier run-off Temperature related measures (like snow accumula4on) have much stronger long term change signal to shorter term variability noise than precipita4on measures and thus are more easily detected These trends toward snow reduc4on will con4nue as climate warms. Consequences are many, but include Higher floods Ecosystem impacts Increased wildfire vulnerability Poten4ally, less stored water
32
 key points Broad impacts of climate change will increase in future decades Average precipitation may not change much, but volatile precipitation climate in")
33 Climate Variability and Change and California Water Lahontan Water Board Barstow, CA November 13, 2014 Dan Cayan Scripps Institution of Oceanography and USGS (with Mike Dettinger, David Pierce, Suraj Polade, Mary Tyree, Alexander Gershunov) key points Broad impacts of climate change will increase in future decades Average precipitation may not change much, but volatile precipitation climate in present and future produces periodic dry (and wet) spells. Importance of the presence or absence of few very large storms
 models Some important ques4ons: Which emissions pathway will we take?")
34 virtually all climate simulations project warming, but with a wide envelope of temperature change July Temperature change Sacramento +3 C CMIP5 GCMs project C summer warming by 2060, under mid and high RCPs 14 GCMs X 3 RCP Emissions Scenarios IPCC 5th Assessment (CMIP5) models Some important ques4ons: Which emissions pathway will we take? How much summer amplificaion of warming? How will temperature change in near term?
35
36 California and much of western region has been more-or-less dry since 1999 observed precipitation departure (% of average), thru Inot including the present water year) % departure from average
37 California and much of western region has been more-or-less dry since 1999 observed precipitation departure (% of average), thru % departure from average
, D. C. Agnew(1) and D. R.")
38 Loss of water during the recent drought has caused the earth s crust to rise GPS displacements rela4ve to average 4mm upward displacement (10cm water) average over western US maximum loss of 50cm has occurred in Sierra Nevada Ongoing drought-induced upli; in the western United States by A. A. Borsa (1), D. C. Agnew(1) and D. R. Cayan(1,2) published in the online version of Science on August 20, Scripps Ins4tu4on of Oceanography, UC San Diego 2 US Geological Survey La Jolla, CA Figure 2. Maps of ver4cal GPS displacements on March 1 of 2011 through Uplio is indicated by yellow-red colors and subsidence by shades of blue. Gray region is where sta4ons were excluded in the Central Valley of California due to strong agricultural pumping signal. GPS es4mate by Borsa et al. in present study showing deficit of ~240km**3 water in March 2014 rela4ve to baseline over western U.S., west of 109 W. This is in general agreement with GRACE satellite observa4ons, S. Castle et al 2014 GRL found ~65km**3 water water loss in Colorado Basin during

39 Summary Points California s climate is prone to year-to-year and longer term varia4on in precipita4on drought is an expected part of our climate present and future. California dry spells ooen build up over mul4ple years,. A more/less dry pa]ern has been in place since A variety of climate patterns may produce drought--there is not a unique atmospheric drought-circulation pattern. The absence of a few very large storms is ooen a key driver of dry years. And large storms are frequently involved in bus4ng drought. Climate change will broadly affect California hydroclimate and impact sectors and systems across-the-board. Expected impacts of climate change: longer warm season, loss of spring snow pack, increased wildfire threat, more winter floods. Climate changes in annual precipitation is not so clear in California. However, climate change may shift precipitation characteristics fewer overall wet days but more intense heavy events. Climate change projections warmer, fewer overall wet days but more intense heavy events. Implica4ons: Less snow, more rain Earlier run-off from traditionally snow-fed mountain watersheds Higher floods Potentially, less stored water Water quality implications: warmer surface water, warmer dry spells, occasional higher runoff, greater sediment influx from high runoff events and burned landscape
40 Now consider VIC RCP 8.5 simulations over 8 regions in western U.S. that have historically been snow-laden David Pierce, D. Cayan : The uneven response of different snow measures to human-induced climate warming. Journal of Climate
41 Annual Temperature global Western conterminous U.S. Freezing Level N American Freezing Level Tracker Western Regional Climate Center


42 a few large storms (or their absence) account for a disproportionate amount of California s precipitation variability 5yr smoother 95%ile LARGE STORM CONTRIBUTION Mike Dettinger Dettinger and Cayan Drought and the Delta A Matter of Extremes accepted, San Francisco Estuary and Watershed Science, April 2014
43

44 Mike Dettinger
45 April 1st Snowpack (percent of normal) 200% 150% 100% 50%
 2020 2060 Melts SWE Rain VIC Sierra Nevada simula4ons of future decades has reduced Apr 1 SWE in response to:")
46 Total precip. (mm) Sierra Nevada +145 (50.6%) +63 (62.3%) 169 ( 30.3%) Melts SWE Rain VIC Sierra Nevada simula4ons of future decades has reduced Apr 1 SWE in response to: increased rain increased snowmelt Snow
 Fraction of Western Precipitation Falling on Days with Tmin < 0C under Various Imposed Warmings (c) Areas in the Western US subject to Rain-Snow Conversions of Various Percentages Fraction of")
47 (a) FRACTION OF ANNUAL PRECIPITATION FALLING IN THE DAILY TEMPERATURE RANGE: -2C < Tavg < 0C FRACTION (b) Fraction of Western Precipitation Falling on Days with Tmin < 0C under Various Imposed Warmings (c) Areas in the Western US subject to Rain-Snow Conversions of Various Percentages Fraction of Total Precipitation as Snow vs Rain Fraction of West with > this Precip-Form Change % increase in rain fraction 20% change 30% change 40% change 50% change Warming, in degrees C Warming, in degrees C
48
Climate Variability and Change, and Southern California Water San Gabriel Valley Water Forum, Pomona, CA, October 2, 2014
 Climate Variability and Change, and Southern California Water San Gabriel Valley Water Forum, Pomona, CA, October 2, 2014 Dan Cayan (with Mike Dettinger, David Pierce, Suraj Polade, Mary Tyree, Alexander
Projected Impacts of Climate Change in Southern California and the Western U.S.
 Projected Impacts of Climate Change in Southern California and the Western U.S. Sam Iacobellis and Dan Cayan Scripps Institution of Oceanography University of California, San Diego Sponsors: NOAA RISA
The Latest Water-Relevant Climate Change Projections for California
 The Latest Water-Relevant Climate Change Projections for California Michael Dettinger US Geological Survey, Scripps Inst Oceanography, La Jolla, CA Suraj Goladi, SIO Dan Cayan, SIO/USGS Tapash Das, SIO/CH2M
Climate Change and Water Supplies in the West. Michael Dettinger, USGS
 Climate Change and Water Supplies in the West Michael Dettinger, USGS During the past 30 years--and in the near-term future--natural climate variability has been augmented by warming trends associated
Direction and range of change expected in the future
 Direction and range of Air Temperature Over the past 30 years, air Across the greater PNW and temperature has been Columbia Basin, an ensemble increasing an average of forecast from ten of the best 0.13
Northern Rockies Adaptation Partnership: Climate Projections
 Northern Rockies Adaptation Partnership: Climate Projections Contents Observed and Projected Climate for the NRAP Region... 2 Observed and Projected Climate for the NRAP Central Subregion... 8 Observed
Climatic and Hydrologic Trends in the Western U.S.: A Review of Recent Peer-Reviewed Research
 Feature Article From Intermountain West Climate Summary, January 2007 Climatic and Hydrologic Trends in the Western U.S.: A Review of Recent Peer-Reviewed Research By Brad Udall, WWA and Gary Bates, NOAA/ESRL/PSD
El Niño, Climate Change and Water Supply Variability
 El Niño, Climate Change and Water Supply Variability Talk Overview El Niño and California California Climate Variability and Change Water Management in the Face of Change California s topography affects
Drought and Future Water for Southern New Mexico
 Drought and Future Water for Southern New Mexico David S. Gutzler University of New Mexico gutzler@unm.edu * The big drought of 2018 * Longer term challenges for water supply * Forecasting streamflow Elephant
Climate Change in Colorado: Recent Trends, Future Projections and Impacts An Update to the Executive Summary of the 2014 Report
 Climate Change in Colorado: Recent Trends, Future Projections and Impacts An Update to the Executive Summary of the 2014 Report Jeff Lukas, Western Water Assessment, University of Colorado Boulder - Lukas@colorado.edu
NIDIS Intermountain West Drought Early Warning System April 18, 2017
 1 of 11 4/18/2017 3:42 PM Precipitation NIDIS Intermountain West Drought Early Warning System April 18, 2017 The images above use daily precipitation statistics from NWS COOP, CoCoRaHS, and CoAgMet stations.
Sierra Nevada Hydroclimatology: An Experimental Prediction of Maximum Daily Snowmelt Discharge in 2005
 Sierra Nevada Hydroclimatology: An Experimental Prediction of Maximum Daily Snowmelt Discharge in 2005 David Peterson, Jessica Lundquist, Iris Stewart, Noah Knowles, Madeline Solomon and Stephen Hager
Oregon Water Conditions Report May 1, 2017
 Oregon Water Conditions Report May 1, 2017 Mountain snowpack in the higher elevations has continued to increase over the last two weeks. Statewide, most low and mid elevation snow has melted so the basin
NIDIS Intermountain West Drought Early Warning System February 12, 2019
 NIDIS Intermountain West Drought Early Warning System February 12, 2019 Precipitation The images above use daily precipitation statistics from NWS COOP, CoCoRaHS, and CoAgMet stations. From top to bottom,
Looking for Recent Climatic Trends and Patterns in California s Central Sierra
 Looking for Recent Climatic Trends and Patterns in California s Central Sierra Looking for Recent Climatic Trends and Patterns in California s Central Sierra Gary J. Freeman Introduction Pacific Gas &
NIDIS Intermountain West Regional Drought Early Warning System February 7, 2017
 NIDIS Drought and Water Assessment NIDIS Intermountain West Regional Drought Early Warning System February 7, 2017 Precipitation The images above use daily precipitation statistics from NWS COOP, CoCoRaHS,
Climate Change Scenarios in Southern California. Robert J. Allen University of California, Riverside Department of Earth Sciences
 Climate Change Scenarios in Southern California Robert J. Allen University of California, Riverside Department of Earth Sciences Overview Climatology of Southern California Temperature and precipitation
Oregon Water Conditions Report April 17, 2017
 Oregon Water Conditions Report April 17, 2017 Mountain snowpack continues to maintain significant levels for mid-april. By late March, statewide snowpack had declined to 118 percent of normal after starting
Climate Impacts to Southwest Water Sector. Dr. Dave DuBois New Mexico State Climatologist
 Climate Impacts to Southwest Water Sector Dr. Dave DuBois New Mexico State Climatologist Presented at EPA Extreme Events and Climate Adaptation Planning Workshop June 3, 2015 Water Year Precip. % of Average
NIDIS Intermountain West Drought Early Warning System January 15, 2019
 NIDIS Drought and Water Assessment NIDIS Intermountain West Drought Early Warning System January 15, 2019 Precipitation The images above use daily precipitation statistics from NWS COOP, CoCoRaHS, and
Climate Summary for the Northern Rockies Adaptation Partnership
 Climate Summary for the Northern Rockies Adaptation Partnership Compiled by: Linda Joyce 1, Marian Talbert 2, Darrin Sharp 3, John Stevenson 4 and Jeff Morisette 2 1 USFS Rocky Mountain Research Station
DEVELOPMENT OF A LARGE-SCALE HYDROLOGIC PREDICTION SYSTEM
 JP3.18 DEVELOPMENT OF A LARGE-SCALE HYDROLOGIC PREDICTION SYSTEM Ji Chen and John Roads University of California, San Diego, California ABSTRACT The Scripps ECPC (Experimental Climate Prediction Center)
Sierra Weather and Climate Update
 Sierra Weather and Climate Update 2014-15 Kelly Redmond Western Regional Climate Center Desert Research Institute Reno Nevada Yosemite Hydroclimate Workshop Yosemite Valley, 2015 October 8-9 Percent of
Upper Missouri River Basin December 2017 Calendar Year Runoff Forecast December 5, 2017
 Upper Missouri River Basin December 2017 Calendar Year Runoff Forecast December 5, 2017 Calendar Year Runoff Forecast Explanation and Purpose of Forecast U.S. Army Corps of Engineers, Northwestern Division
Presentation Overview. Southwestern Climate: Past, present and future. Global Energy Balance. What is climate?
 Southwestern Climate: Past, present and future Mike Crimmins Climate Science Extension Specialist Dept. of Soil, Water, & Env. Science & Arizona Cooperative Extension The University of Arizona Presentation
Upper Missouri River Basin February 2018 Calendar Year Runoff Forecast February 6, 2018
 Upper Missouri River Basin February 2018 Calendar Year Runoff Forecast February 6, 2018 Calendar Year Runoff Forecast Explanation and Purpose of Forecast U.S. Army Corps of Engineers, Northwestern Division
An Update on Snowpack Projections for Alaska: Chugach Results. Jeremy Littell, USGS Alaska Climate Science Center
 An Update on Snowpack Projections for Alaska: Chugach Results Jeremy Littell, USGS Alaska Climate Science Center Why snow? That depends. Photo: F. Kovalcheck. h0p://www.fs.usda.gov/detail/chugach/about-
Mozambique. General Climate. UNDP Climate Change Country Profiles. C. McSweeney 1, M. New 1,2 and G. Lizcano 1
 UNDP Climate Change Country Profiles Mozambique C. McSweeney 1, M. New 1,2 and G. Lizcano 1 1. School of Geography and Environment, University of Oxford. 2.Tyndall Centre for Climate Change Research http://country-profiles.geog.ox.ac.uk
APPLICATIONS OF DOWNSCALING: HYDROLOGY AND WATER RESOURCES EXAMPLES
 APPLICATIONS OF DOWNSCALING: HYDROLOGY AND WATER RESOURCES EXAMPLES Dennis P. Lettenmaier Department of Civil and Environmental Engineering For presentation at Workshop on Regional Climate Research NCAR
The following information is provided for your use in describing climate and water supply conditions in the West as of April 1, 2003.
 Natural Resources Conservation Service National Water and Climate Center 101 SW Main Street, Suite 1600 Portland, OR 97204-3224 Date: April 8, 2003 Subject: April 1, 2003 Western Snowpack Conditions and
TRINITY COUNTY. Board Item Request Form Phone
 County Contract No. Department Board of Supervisors TRINITY COUNTY 6.01 Board Item Request Form 2014-08-12 Contact Judy Pflueger Phone 623-1217 Requested Agenda Location County Matters Requested Board
Climate Trends & Projections
 CITY OF ASHLAND, OREGON Climate Trends & Projections FINAL REPORT AUGUST 22, 2016 Prepared by: Meghan M. Dalton Oregon Climate Change Research Institute Contents Summary of Key Findings... 3 Introduction...
January 2011 Calendar Year Runoff Forecast
 January 2011 Calendar Year Runoff Forecast 2010 Runoff Year Calendar Year 2010 was the third highest year of runoff in the Missouri River Basin above Sioux City with 38.8 MAF, behind 1978 and 1997 which
Sensitivity of Water Supply in the Colorado River Basin to Warming
 Sensitivity of Water Supply in the Colorado River Basin to Warming Greg McCabe U.S. Geological Survey, Denver, Colorado Dave Wolock U.S. Geological Survey, Lawrence, Kansas The Colorado River Basin Streamgage
NIDIS Intermountain West Drought Early Warning System October 17, 2017
 NIDIS Drought and Water Assessment NIDIS Intermountain West Drought Early Warning System October 17, 2017 Precipitation The images above use daily precipitation statistics from NWS COOP, CoCoRaHS, and
Climate Change Impact on Drought Risk and Uncertainty in the Willamette River Basin
 Portland State University PDXScholar Geography Faculty Publications and Presentations Geography 5-24-2011 Climate Change Impact on Drought Risk and Uncertainty in the Willamette River Basin Heejun Chang
January 25, Summary
 January 25, 2013 Summary Precipitation since the December 17, 2012, Drought Update has been slightly below average in parts of central and northern Illinois and above average in southern Illinois. Soil
Regional Climate Variability in the Western U.S.: Observed vs. Anticipated
 Regional Climate Variability in the Western U.S.: Observed vs. Anticipated Klaus Wolter University of Colorado at Boulder, klaus.wolter@noaa.gov Kudos to Joe Barsugli and Jon Eischeid Seasonal Precipitation
Drought in a Warming Climate: Causes for Change
 Drought in a Warming Climate: Causes for Change Dr. Guiling Wang (guiling.wang@uconn.edu) Department of Civil and Environmental Engineering University of Connecticut Storrs, CT 06269, USA http://hydroclimatology.uconn.edu/
NOAA National Centers for Environmental Information State Summaries 149-FL. Observed and Projected Temperature Change
 19-FL FLORIDA Key Messages Under a higher emissions pathway, historically unprecedented warming is projected by the end of the 1st century. Rising temperatures will likely increase the intensity of naturally-occurring
NIDIS Intermountain West Drought Early Warning System February 6, 2018
 NIDIS Intermountain West Drought Early Warning System February 6, 2018 Precipitation The images above use daily precipitation statistics from NWS COOP, CoCoRaHS, and CoAgMet stations. From top to bottom,
Minnesota s Changing Climate: Winter Impacts
 Minnesota s Changing Climate: Winter Impacts Dr. Mark Seeley Climatologist/Meteorologist Dept of Soil, Water, and Climate University of Minnesota 15 th Annual Road Salt Symposium Minnesota Landscape Arboretum
NIDIS Intermountain West Drought Early Warning System May 23, 2017
 NIDIS Drought and Water Assessment NIDIS Intermountain West Drought Early Warning System May 23, 2017 Precipitation The images above use daily precipitation statistics from NWS COOP, CoCoRaHS, and CoAgMet
Quenching the Valley s thirst: The connection between Sierra Nevada snowpack & regional water supply
 Quenching the Valley s thirst: The connection between Sierra Nevada snowpack & regional water supply Roger Bales, UC Merced Snow conditions Snow & climate change Research directions Sierra Nevada snow
CLIMATE READY BOSTON. Climate Projections Consensus ADAPTED FROM THE BOSTON RESEARCH ADVISORY GROUP REPORT MAY 2016
 CLIMATE READY BOSTON Sasaki Steering Committee Meeting, March 28 nd, 2016 Climate Projections Consensus ADAPTED FROM THE BOSTON RESEARCH ADVISORY GROUP REPORT MAY 2016 WHAT S IN STORE FOR BOSTON S CLIMATE?
Flood Risk Assessment
 Flood Risk Assessment February 14, 2008 Larry Schick Army Corps of Engineers Seattle District Meteorologist General Assessment As promised, La Nina caused an active winter with above to much above normal
Atmospheric Rivers: Western U.S. Rainmakers and Key to Forecast-Informed Reservoir Operations
 Atmospheric Rivers: Western U.S. Rainmakers and Key to Forecast-Informed Reservoir Operations F. Martin Ralph UC San Diego/Scripps Institution of Oceanography A New Frontier in Water Operations: Atmospheric
NIDIS Intermountain West Drought Early Warning System December 11, 2018
 NIDIS Drought and Water Assessment NIDIS Intermountain West Drought Early Warning System December 11, 2018 Precipitation The images above use daily precipitation statistics from NWS COOP, CoCoRaHS, and
California 120 Day Precipitation Outlook Issued Tom Dunklee Global Climate Center
 California 120 Day Precipitation Outlook Issued 11-01-2008 Tom Dunklee Global Climate Center This is my second updated outlook for precipitation patterns and amounts for the next 4 s of the current rainy
Chiang Rai Province CC Threat overview AAS1109 Mekong ARCC
 Chiang Rai Province CC Threat overview AAS1109 Mekong ARCC This threat overview relies on projections of future climate change in the Mekong Basin for the period 2045-2069 compared to a baseline of 1980-2005.
Climate Change RMJOC Study Summary
 Climate Change RMJOC Study Summary Erik Pytlak Weather and Streamflow Forecasting Bonneville Power Administration Portland, OR IPCC: International Panel on Climate Change Established by the United Nations
Monthly Long Range Weather Commentary Issued: February 15, 2015 Steven A. Root, CCM, President/CEO
 Monthly Long Range Weather Commentary Issued: February 15, 2015 Steven A. Root, CCM, President/CEO sroot@weatherbank.com JANUARY 2015 Climate Highlights The Month in Review During January, the average
FINAL PAPER CLIMATE CHANGE SCENARIOS AND SEA LEVEL RISE ESTIMATES FOR THE CALIFORNIA 2009 CLIMATE CHANGE SCENARIOS ASSESSMENT
 CLIMATE CHANGE SCENARIOS AND SEA LEVEL RISE ESTIMATES FOR THE CALIFORNIA 2009 CLIMATE CHANGE SCENARIOS ASSESSMENT A Paper From: California Climate Change Center Prepared By: Dan Cayan 1,2, Mary Tyree 1,
Will a warmer world change Queensland s rainfall?
 Will a warmer world change Queensland s rainfall? Nicholas P. Klingaman National Centre for Atmospheric Science-Climate Walker Institute for Climate System Research University of Reading The Walker-QCCCE
Climatic and Ecological Conditions in the Klamath Basin of Southern Oregon and Northern California: Projections for the Future
 Climatic and Ecological Conditions in the Klamath Basin of Southern Oregon and Northern California: Projections for the Future A Collaborative Effort by: CLIMATE LEADERSHIP INITIATIVE INSTITUTE FOR A SUSTAINABLE
HyMet Company. Streamflow and Energy Generation Forecasting Model Columbia River Basin
 HyMet Company Streamflow and Energy Generation Forecasting Model Columbia River Basin HyMet Inc. Courthouse Square 19001 Vashon Hwy SW Suite 201 Vashon Island, WA 98070 Phone: 206-463-1610 Columbia River
NIDIS Intermountain West Drought Early Warning System January 16, 2018
 NIDIS Drought and Water Assessment NIDIS Intermountain West Drought Early Warning System January 16, 2018 Precipitation The images above use daily precipitation statistics from NWS COOP, CoCoRaHS, and
NIDIS Intermountain West Drought Early Warning System March 26, 2019
 NIDIS Intermountain West Drought Early Warning System March 26, 2019 The images above use daily precipitation statistics from NWS COOP, CoCoRaHS, and CoAgMet stations. From top to bottom, and left to right:
Upper Missouri River Basin January 2018 Calendar Year Runoff Forecast January 3, 2018
 Calendar Year Runoff Forecast Upper Missouri River Basin January 2018 Calendar Year Runoff Forecast January 3, 2018 Explanation and Purpose of Forecast U.S. Army Corps of Engineers, Northwestern Division
Southern New England s Changing Climate. Raymond S. Bradley and Liang Ning Northeast Climate Science Center University of Massachusetts, Amherst
 Southern New England s Changing Climate Raymond S. Bradley and Liang Ning Northeast Climate Science Center University of Massachusetts, Amherst Historical perspective (instrumental data) IPCC scenarios
A SURVEY OF HYDROCLIMATE, FLOODING, AND RUNOFF IN THE RED RIVER BASIN PRIOR TO 1870
 A SURVEY OF HYDROCLIMATE, FLOODING, AND RUNOFF IN THE RED RIVER BASIN PRIOR TO 1870 W. F. RANNIE (UNIVERSITY OF WINNIPEG) Prepared for the Geological Survey of Canada September, 1998 TABLE OF CONTENTS
NIDIS Intermountain West Drought Early Warning System May 1, 2018
 NIDIS Intermountain West Drought Early Warning System May 1, 2018 Precipitation The images above use daily precipitation statistics from NWS COOP, CoCoRaHS, and CoAgMet stations. From top to bottom, and
ANALYZING THE IMPACT OF CLIMATE CHANGE ON MONTHLY RIVER FLOWS IN CALIFORNIA S SIERRA NEVADA AND SOUTHERN CASCADE MOUNTAIN RANGES. Gary J.
 ANALYZING THE IMPACT OF CLIMATE CHANGE ON MONTHLY RIVER FLOWS IN CALIFORNIA S SIERRA NEVADA AND SOUTHERN CASCADE MOUNTAIN RANGES Gary J. Freeman 1 ABSTRACT The impact of climate change on monthly river
Statistical Forecast of the 2001 Western Wildfire Season Using Principal Components Regression. Experimental Long-Lead Forecast Bulletin
 Statistical Forecast of the 2001 Western Wildfire Season Using Principal Components Regression contributed by Anthony L. Westerling 1, Daniel R. Cayan 1,2, Alexander Gershunov 1, Michael D. Dettinger 2
Preliminary Runoff Outlook February 2018
 Preliminary Runoff Outlook February 2018 Prepared by: Flow Forecasting & Operations Planning Water Security Agency General Overview The Water Security Agency (WSA) is preparing for 2018 spring runoff including
Prediction of Snow Water Equivalent in the Snake River Basin
 Hobbs et al. Seasonal Forecasting 1 Jon Hobbs Steve Guimond Nate Snook Meteorology 455 Seasonal Forecasting Prediction of Snow Water Equivalent in the Snake River Basin Abstract Mountainous regions of
Climate Change and Water Supply Research. Drought Response Workshop October 8, 2013
 Climate Change and Water Supply Research Drought Response Workshop October 8, 2013 DWR Photo Oroville Reservoir, 2009 Talk Overview Expectations History Atmospheric Rivers and Water Supply Current Research
Spring Water Supply and Weather Outlook How about that near Miracle March?
 Spring Water Supply and Weather Outlook How about that near Miracle March? tim.bardsley@noaa.gov NWS Reno 4.10.18 1 Out the Window March and early April have been Boom not Bust Key Points Up Front Wet
Precipitation. Standardized Precipitation Index. NIDIS Intermountain West Drought Early Warning System September 5, 2017
 9/6/2017 NIDIS Drought and Water Assessment NIDIS Intermountain West Drought Early Warning System September 5, 2017 Precipitation The images above use daily precipitation statistics from NWS COOP, CoCoRaHS,
Variability Across Space
 Variability and Vulnerability of Western US Snowpack Potential impacts of Climactic Change Mark Losleben, Kurt Chowanski Mountain Research Station, University of Colorado Introduction The Western United
Overview of a Changing Climate in Rhode Island
 Overview of a Changing Climate in Rhode Island David Vallee, Hydrologist in Charge, National Weather Service Northeast River Forecast Center, NOAA Lenny Giuliano, Air Quality Specialist, Rhode Island Department
NOAA National Centers for Environmental Information State Summaries 149-HI. Observed and Projected Temperature Change
 9-HI HAWAI I Key Messages Average annual temperature has increased by about F since 95, with a leveling off of the rate of warming in the last two decades. Under a higher emissions pathway, historically
An investigation of sampling efficiency using historical data. Patrick Didier Advisor: Justine Blanford
 An investigation of sampling efficiency using historical data Patrick Didier Advisor: Justine Blanford Overview Introduction to Airborne Snow Survey program Goals of the Capstone Project Methods and Expected
Upper Colorado River Basin Flows and Paleohydrology Jenny Ta
 Upper Colorado River Basin Flows and Paleohydrology Jenny Ta Introduction The Colorado River flows from its headwaters in the Rocky Mountains, through seven U.S. and two Mexican states into the Colorado
WSWC/NOAA Workshops on S2S Precipitation Forecasting
 WSWC/NOAA Workshops on S2S Precipitation Forecasting San Diego, May 2015 Salt Lake City at NWS Western Region HQ, October 2015 Las Vegas at Colorado River Water Users Association, December 2015 College
Highlights of the 2006 Water Year in Colorado
 Highlights of the 2006 Water Year in Colorado Nolan Doesken, State Climatologist Atmospheric Science Department Colorado State University http://ccc.atmos.colostate.edu Presented to 61 st Annual Meeting
NIDIS Intermountain West Drought Early Warning System October 30, 2018
 10/30/2018 NIDIS Drought and Water Assessment NIDIS Intermountain West Drought Early Warning System October 30, 2018 Precipitation The images above use daily precipitation statistics from NWS COOP, CoCoRaHS,
Analysis of real-time prairie drought monitoring and forecasting system. Lei Wen and Charles A. Lin
 Analysis of real-time prairie drought monitoring and forecasting system Lei Wen and Charles A. Lin Back ground information A real-time drought monitoring and seasonal prediction system has been developed
Changing Hydrology under a Changing Climate for a Coastal Plain Watershed
 Changing Hydrology under a Changing Climate for a Coastal Plain Watershed David Bosch USDA-ARS, Tifton, GA Jeff Arnold ARS Temple, TX and Peter Allen Baylor University, TX SEWRU Objectives 1. Project changes
Mapping the extent of temperature-sensitive snowcover and the relative frequency of warm winters in the western US
 Mapping the extent of temperature-sensitive snowcover and the relative frequency of warm winters in the western US Anne Nolin Department of Geosciences Oregon State University Acknowledgements Chris Daly,
2011 National Seasonal Assessment Workshop for the Eastern, Southern, & Southwest Geographic Areas
 2011 National Seasonal Assessment Workshop for the Eastern, Southern, & Southwest Geographic Areas On January 11-13, 2011, wildland fire, weather, and climate met virtually for the ninth annual National
Weather and Climate Summary and Forecast Winter
 Weather and Climate Summary and Forecast Winter 2016-17 Gregory V. Jones Southern Oregon University February 7, 2017 What a difference from last year at this time. Temperatures in January and February
A Review of the 2007 Water Year in Colorado
 A Review of the 2007 Water Year in Colorado Nolan Doesken Colorado Climate Center, CSU Mike Gillespie Snow Survey Division, USDA, NRCS Presented at the 28 th Annual AGU Hydrology Days, March 26, 2008,
Talk Overview. Concepts. Climatology. Monitoring. Applications
 Atmospheric Rivers Talk Overview Concepts Climatology Monitoring Applications Satellite View Where is the storm? Where is the impact? Atmospheric Rivers Plume or fire hose of tropical moisture Heavy precipitation
Gary J. Freeman 1 ABSTRACT
 CLIMATE CHANGE AND THE CHANGING WATER BALANCE FOR CALIFORNIA S NORTH FORK FEATHER RIVER Gary J. Freeman 1 ABSTRACT Climate change has likely had a large role the changing water balance on northern California
NIDIS Intermountain West Drought Early Warning System November 21, 2017
 NIDIS Drought and Water Assessment NIDIS Intermountain West Drought Early Warning System November 21, 2017 Precipitation The images above use daily precipitation statistics from NWS COOP, CoCoRaHS, and
Anticipated and Observed Trends in the Global Hydrological Cycle. Kevin E. Trenberth NCAR
 Anticipated and Observed Trends in the Global Hydrological Cycle Kevin E. Trenberth NCAR The presence of moisture affects the disposition of incoming solar radiation: Evaporation (drying) versus temperature
Effects of Temperature and Precipitation Variability on Snowpack Trends in the Western United States*
 1 NOVEMBER 2005 H A M L E T E T A L. 4545 Effects of Temperature and Precipitation Variability on Snowpack Trends in the Western United States* ALAN F. HAMLET JISAO/SMA CSES Climate Impacts Group, and
Drought in Southeast Colorado
 Drought in Southeast Colorado Nolan Doesken and Roger Pielke, Sr. Colorado Climate Center Prepared by Tara Green and Odie Bliss http://climate.atmos.colostate.edu 1 Historical Perspective on Drought Tourism
The Documentation of Extreme Hydrometeorlogical Events: Two Case Studies in Utah, Water Year 2005
 The Documentation of Extreme Hydrometeorlogical Events: Two Case Studies in Utah, Water Year 2005 Tim Bardsley1*, Mark Losleben2, Randy Julander1 1. USDA, NRCS, Snow Survey Program, Salt Lake City, Utah.
ROCKY MOUNTAIN CLIMATE
 future PRECIPITATION in the denver MEtRO AREA By Stephen Saunders, Tom Easley, and Melissa Mezger A report by the Rocky Mountain Climate Organization To Denver Environmental Health June 2017 the ROCKY
Zambia. General Climate. Recent Climate Trends. UNDP Climate Change Country Profiles. Temperature. C. McSweeney 1, M. New 1,2 and G.
 UNDP Climate Change Country Profiles Zambia C. McSweeney 1, M. New 1,2 and G. Lizcano 1 1. School of Geography and Environment, University of Oxford. 2. Tyndall Centre for Climate Change Research http://country-profiles.geog.ox.ac.uk
Precipitation. Standardized Precipitation Index. NIDIS Intermountain West Regional Drought Early Warning System January 3, 2017
 1/3/2017 NIDIS Drought and Water Assessment NIDIS Intermountain West Regional Drought Early Warning System January 3, 2017 Precipitation The images above use daily precipitation statistics from NWS COOP,
Water- resources adapta7ons call for be;er downscaling and understanding of extreme precipita7on events.
 THE DOWNSCALING PROBLEM: ( A2 (GFDL One day in the 21st Century... Water- resources adapta7ons call for be;er downscaling and understanding of extreme precipita7on events. Special requirements: Extremes,
Climate Change Impacts Water Resources (Drought & Snow) Richard R. Heim Jr.
 Richard R. Heim Jr.") Climate Change Impacts Water Resources (Drought & Snow) Richard R. Heim Jr. NOAA / NESDIS / Climate Monitoring Branch Asheville, North Carolina National Association of Clean Water Agencies Web Seminar,
Climate Change Impacts Water Resources (Drought & Snow) Richard R. Heim Jr. NOAA / NESDIS / Climate Monitoring Branch Asheville, North Carolina National Association of Clean Water Agencies Web Seminar,
How Will the Colorado Run? The Colorado River in a Warmer World
 How Will the Colorado Run? The Colorado River in a Warmer World The Future of the Colorado River October 13, 2018 Brad Udall Senior Scientist/Scholar Colorado State University Bradley.Udall@colostate.edu
2015: A YEAR IN REVIEW F.S. ANSLOW
 2015: A YEAR IN REVIEW F.S. ANSLOW 1 INTRODUCTION Recently, three of the major centres for global climate monitoring determined with high confidence that 2015 was the warmest year on record, globally.
NIDIS Intermountain West Drought Early Warning System April 24, 2018
 NIDIS Intermountain West Drought Early Warning System April 24, 2018 Precipitation The images above use daily precipitation statistics from NWS COOP, CoCoRaHS, and CoAgMet stations. From top to bottom,
An ENSO-Neutral Winter
 An ENSO-Neutral Winter This issue of the Blue Water Outlook newsletter is devoted towards my thoughts on the long range outlook for winter. You will see that I take a comprehensive approach to this outlook
National Wildland Significant Fire Potential Outlook
 National Wildland Significant Fire Potential Outlook National Interagency Fire Center Predictive Services Issued: April 1, 2008 Next Issue: May 1, 2008 Wildland Fire Outlook April 2008 through July 2008