Soil Moisture Precipitation Coupling: Observations from the Oklahoma Mesonet and Underlying Physical Mechanisms
|
|
|
- Darlene Wilkins
- 5 years ago
- Views:
Transcription
1 Soil Moisture Precipitation Coupling: Observations from the Oklahoma Mesonet and Underlying Physical Mechanisms Trent W. Ford 1, Anita D. Rapp 2, Steven M. Quiring 1, Jennifer Blake 3 [1] Department of Geography, Texas A&M University, College Station, Texas [2] Department of Atmospheric Sciences, Texas A&M University, College Station, Texas [3] Department of Geology and Geophysics, Texas A&M University, College Station, Texas Correspondence to: T. W. Ford (twford@tamu.edu) Abstract Interactions between soil moisture and the atmosphere are driven by the partitioning of sensible and latent heating, through which, soil moisture has been connected to atmospheric modification that could potentially lead to initiation of convective precipitation. The majority of previous studies linking the land surface to subsequent precipitation have used atmospheric reanalysis or model datasets. In this study, we link in situ observations of soil moisture from more than 100 stations in Oklahoma to subsequent unorganized afternoon convective precipitation. We use hourly NEXRAD radar-derived precipitation to identify convective events, and then compare the location of precipitation initiation to underlying soil moisture anomalies in the morning. Overall we find a statistically significant preference for convective precipitation initiation over drier than normal soils, with over 70% of events initiating over soil moisture below the long-term median. The significant preference for precipitation initiation over drier than normal soils is in contrast with previous studies using satellite-based precipitation to identify the region of maximum precipitation accumulation. We evaluated 17 convective events occurring near Lamont, Oklahoma, where soundings of the atmospheric profile at 0600 and 1200 LST are also available. For these events, soil moisture has strong negative correlations with the level of free convection, planetary boundary layer height, and surface temperature changes between 0600 to 1200 LST. We also find strong positive correlations between morning soil moisture and morning-toafternoon changes in convective available potential energy and convective inhibition. In general, the results of this study demonstrate that both positive and negative soil moisture feedbacks to are important in this region of the United States. 1
2 31 1. Introduction Background Soil moisture is vital to the climate system. Root zone soil moisture in vegetated regions has a significant influence on evapotranspiration rates (Teuling et al. 2006; McPherson, 2007) and latent and sensible heat exchange (Dirmeyer et al. 2000; Basara and Crawford, 2002; Guillod et al. 2014). Through the modification of evapotranspiration and moisture transport from the land surface to the atmosphere, soil moisture can impact regional temperature and precipitation. Because of the strong control soil moisture has on sensible and latent heating, studies have focused on the mechanistic modification of atmospheric conditions by the land surface through energy exchange. Findell and Eltahir (2003) derived a convective triggering potential and, combined with a low-level atmospheric humidity index, determined atmospheric potential for convective initiation over relatively wet or relatively dry soils in Illinois. Santanello et al. (2009) used observations of soil moisture and atmospheric conditions to describe the modification of atmospheric moisture and energy by the land surface at the hourly time scale. In addition to localscale interactions, soil moisture-precipitation coupling can be important for meso-scale circulation initiation, particularly over strong meso-scale soil moisture heterogeneity (Taylor et al. 2011). Results from these and similar studies suggest that soil moisture anomalies, which drive preferential latent or sensible heating at the surface, can alter low-level atmospheric temperature and humidity such that atmospheric dew point depressions will be generally lower (higher) over wetter (drier) soils. Through its control of surface evaporative fraction (EF), anomalously wet or dry soils can induce modification of the planetary boundary layer (PBL), including changes in the height of the lifting condensation level (LCL) and the level of free convection (LFC) (Brimelow et al. 2011). 2
3 Without consideration of free-tropospheric conditions, afternoon LCL and LFC heights generally decrease with sufficient moisture flux from a wet soil surface, which increases energy available for convection (i.e., CAPE). In turn, relatively dry soils enhance sensible heating at the surface and promote increased LCL and LFC heights (Frye and Mote, 2010a), increasing mixed-layer stability. These mechanisms act as a positive soil moisture feedback, in which convective cloud cover and subsequent precipitation is more probable over a moist land surface than a dry land surface (Findell et al. 2011). However, studies have documented an increased probability of convective precipitation over a dry soil surface, partially attributable to dry soils (enhanced sensible heating) resulting in sufficient PBL growth and eroding of strong morning convective inhibition (CIN) (Santanello et al. 2009). Ek and Holtslag (2004) demonstrate the interactive roles of soil moisture and freetropospheric stability on relative humidity tendency and convective cloud development at the PBLtop. Their model simulations show dry (wet) soils combined with weaker (stronger) above-pbl stability enhances the probability of PBL cloud development (Ek and Holtslag, 2004); a finding later corroborated with observations in the Sahel (Westra et al. 2012). Gentine et al. (2013) integrate the impacts of surface latent and sensible heat flux and free-tropospheric stability into a two-regime framework, specifically a wet-soil advantage regime and dry-soil advantage regime. Under this framework, moist convection occurs earlier over moist surfaces coinciding with strong free-tropospheric stability, and occurs earlier over dry surfaces coinciding with warm, weakly stratified free-tropospheric conditions (Gentine et al. 2013). In light of the results of these studies, we could expect unorganized convection to occur over both wet and dry soils, depending on the overlying free-tropospheric conditions. 3
4 Because soil moisture has a significant impact on atmospheric conditions and the persistence of strong land-atmosphere interactions, it is important for seasonal climate predictions. Meng and Quiring (2010) show that anomalous spring soil moisture in the North American Great Plains influenced the amount of summer precipitation in the Community Atmosphere Model (CAM3). Roundy et al. (2013) demonstrated the importance of soil moisture conditions and landatmosphere coupling in drought monitoring and forecasting in the Southeast U.S. These and other studies suggest that land-atmosphere interactions, modulated by soil moisture, can significantly influence temperature anomalies and potentially, precipitation, and can aid in climate and extreme event forecasting (Douville and Chauvin, 2000; Koster et al. 2011) Soil Moisture-Precipitation Coupling in the U.S. Southern Great Plains Although land-atmosphere interactions have considerable impact on regional climate and climate persistence, debate continues as to the sign and strength of these interactions at various scales. Global climate models have identified the U.S. Southern Great Plains as a hot spot of land-atmosphere interactions wherein the probability of precipitation responds strongly to land surface conditions (Koster et al. 2004). Studies employing soil moisture observations show less consistent results, with some suggesting a wet soil advantage regime in the region (Frye and Mote, 2010b; Ford et al. 2015), and others providing evidence of a dry soil advantage regime (Santanello et al. 2013; Guillod et al. 2015). Still other studies show no evidence of soil moisture precipitation coupling in the Southern Great Plains region, based on in situ observation (Phillips and Klein, 2014), satellite (Taylor et al. 2012), and reanalysis datasets (Findell et al. 2011). The lack of a strong, consistent land-atmosphere signal in this region is impeded by the occurrence of both positive and negative soil moisture feedbacks (Findell and Eltahir, 2003b). Additionally, the conflicting results from these and other studies are partially attributable to the breadth of datasets 4
5 and methodologies employed (e.g., Findell et al. 2011; Guillod et al. 2014). However, both wetpositive and dry-negative soil moisture feedback on precipitation are potentially relevant in the Southern Great Plains. The lack of consensus from observation-based studies on the sign and strength of soil moisture precipitation coupling, combined with the strong positive coupling in global climate models precludes solid conclusions as to the relevance of soil moisture precipitation coupling in the global climate system. Mesoscale studies are uniquely capable of documenting landatmosphere interactions while simultaneously accounting for region-specific factors that could confound the results. For example, atmospheric stability in the Southern Great Plains region is significantly impacted by the strength and location of the Great Plains Low-Level Jet (Higgins et al. 1997; Frye and Mote, 2010). This is further complicated by the intrusion of squall lines and frontal systems during the warm season (Raddatz and Hanesiak, 2008), corresponding with conditions unfavorable for surface-induced convection (Matyas and Carelton, 2010). To properly account for these factors, we use a dense network of meteorological monitoring stations with in situ soil moisture observations, combined with radar-derived precipitation estimates and atmospheric soundings to analyze the soil moisture-precipitation coupling strength in the Southern Great Plains of the United States. Specifically we address whether unorganized convective events initiate preferentially over drier or wetter than normal soils in Oklahoma and document how atmospheric conditions prior to convection respond to soil moisture variability Data and Methods Soil Moisture Data 5
6 In situ observations of soil moisture are taken from the Oklahoma Mesonet ( comprised of over 100 continuously monitoring stations across the state (Illston et al. 2008). Campbell Scientific 229-L heat dissipation sensors are deployed at four depths (5, 25, 60, 75 cm) in the soil column and measure matric potential, from which volumetric water content is derived. Mesonet soil moisture observation error is low (Scott et al. 2013), and station density in Oklahoma is among the highest in North America Daily (9:00 a.m. LST) measurements are used to characterize soil moisture conditions on the morning of each convective event. Because volumetric water content is a strong function of site-specific characteristics, we convert daily volumetric water content measurements to percentiles. For this conversion, an empirical cumulative distribution function, comprised of all daily soil moisture observations for a given calendar month, is constructed. Daily observations are then fit to the distribution, and percentiles of the overall distribution are calculated. This means that a daily percentile value on (e.g.) July 5 th of 100 represents the wettest soil moisture condition experienced during any July day over the entire study period. The percentiles are then gridded at a 0.25 spatial resolution across the study region. The location of convective precipitation initiation is matched to the soil moisture grid and a corresponding soil moisture value. It is worth mentioning that soil moisture percentiles in this study represent only local temporal variability, and therefore cannot be used to examine the impact of soil moisture spatial heterogeneity on convective precipitation initiation. Soil moisture observations from the 5 cm depth are used in all analyses Precipitation Event Identification The majority of precipitation in the central United States is caused by frontal activity and mesoscale convective systems (Raddatz and Hanesiak, 2008; Carleton et al. 2008). In these cases, 6
7 moisture is advected into the region by mid-latitude cyclones or fronts (Matyas and Carleton, 2010). Therefore, analyzing the influence of soil moisture on those precipitation events will likely result in a weak or nonexistent relationship. For example, Phillips and Klein (2014) found largescale atmospheric forcings dominated a relatively weak local feedback signal in the Southern Great Plains. Unorganized convection, as defined by Carleton et al. (2008), includes isolated convective events that occur in the absence of strong, synoptic-scale atmospheric forcing. Separating these afternoon precipitation events from organized convective events, like MCSs, and those forced by synoptic-scale atmospheric processes will help to remove confounding factors (i.e., noise) and isolate the influence of the land surface (i.e., signal) Capturing individual convective precipitation events, particularly unorganized convection most pertinent to our study, requires datasets with a high spatial and temporal resolution. Taylor et al. (2012) identified convective events using the Climate Prediction Center Morphing Method (CMORPH, Joyce et al. 2004), a global precipitation dataset with a 3-hour (temporal) and 0.25 (spatial) resolution. Their precipitation event detection methodology (also implemented by Ford et al., 2015 and Guillod et al. 2015) identifies the grid cell that resides within a 1.25 x 1.25 box in which the maximum amount of precipitation occurred. It also identifies the grid cell(s) within the same 1.25 x 1.25 box with the minimum amount of precipitation. Compositing soil moisture associated with these locations of maximum and minimum precipitation provides a means of determining whether there is a preference for convective precipitation to fall over relatively wetter or drier land surfaces. The use of CMORPH precipitation is well-suited for global-scale analyses; however the 3-hour temporal resolution precludes the identification of the point of precipitation initiation. 7
8 Our study identifies unorganized convective precipitation events using ground-based Doppler radar from the National Weather Surface (NWS) Next-Generation or NEXRAD radar network. NEXRAD includes over 160 S-band Doppler radars in the United States, including 5 in Oklahoma. The NWS produces their Stage IV hourly precipitation product at 4 km spatial resolution using a mosaic of the ground-based radar data that covers nearly all of the contiguous United States (Lin and Mitchell, 2005). The Stage IV product undergoes bias-correction, quality control, and a series of automated algorithms and manual inspection. NEXRAD precipitation products are ideal for characterizing soil moisture-precipitation interactions occurring at sub-daily time scales (Guillod et al. 2014) We examined hourly Stage IV radar images of precipitation accumulation from 3 a.m. to 8 p.m. each day between May and September, , and manually identified unorganized convective events. The manual identification procedure was completed according to a predetermined decision tree (Fig. 1), which approximates the classification system of Schoen and Ashley (2011). Schoen and Ashley s (2011) system classified storms as cellular unorganized, quasi organized, cellular organized, and linear organized, and was based on previous studies examining radar morphology of convective storms (Parker and Johnson, 2000; Klimowski et al. 2003). The decision tree process included 5 assessments or queries: (1) the location of precipitation initiation, (2) minimum event size, (3) precipitation rate, (4) shape and (5) propagation of the event. The classification systems attempts to exclude organized convective events. Specifically, organized convective events in our classification were identified as either (1) conglomerates of convective storms arranged in a linear or quasi-linear fashion or line-echo wave pattern, including bow echoes and squall lines, or (2) as individual cells which initiate and propagate in the same vicinity and direction, arranged in a linear or nonlinear fashion (Gallus et al. 2008), and that move/evolve with 8
9 respect to one another. Organized convection is undesirable because it is typically associated with the synoptic-scale atmospheric processes that we are trying to exclude from this study. The desired unorganized storm type was defined as individual cells which initiated, propagated, and evolved independently of each other and were arranged in a nonlinear fashion (Ashely and Gilson, 2009). These systems are typically shorter lived than organized events, and do not develop into or dissipate from more organized convective modes Manual event identification procedures have advantages and disadvantages. The primary advantage of a manual classification procedure is the ability of the researcher to discern isolated, unorganized cells from those which develop/evolve together or bifurcate from larger systems. The primary disadvantage of such a manual classification methodology is the lack of repeatability. Even with a well-rooted decision tree to guide the classification process, the results are researcherspecific. To test the reproducibility of this study, classification of all events was completed independently by two researchers. There was 72% agreement between the two researchers with regards to event identification. Agreement varied from year to year and month to month, ranging from 50% for 2009 events to 87% for 2007 events, and 63% for June events to 80% for events in September. Qualitatively, it seemed that the most frequent disagreements between researchers were for (1) multiple, isolated systems that initiated at the same time, and (2) systems which initiated in Oklahoma, but could have been associated with systems initiating outside the study region. Overall, there was a reasonable amount of consistency when using this methodology to detect unorganized convective events Once an unorganized convective event is identified, the location of afternoon precipitation initiation is established as the grid cell in which precipitation is first captured in the radar dataset. This procedure is different from those used by Taylor et al. (2012) and Ford et al. (in press), as we 9
10 identify the point of precipitation initiation instead of the region of maximum accumulation. Once the location of precipitation initiation was established for an event, we determined if more than 3 mm of precipitation occurred between 3:00 a.m. and noon (LST) of the preceding morning within 20 km of the location of initiation. Convective events were retained only if precipitation did not occur or less than 3 mm had accumulated near the location of initiation. Through our precipitation classification methodology, 477 unorganized events were identified by both researchers during the warm season (May September) between 2002 and 2012 in Oklahoma (Fig. 2). These events were then used to determine if unorganized convection initiates more frequently over wetter or drier than normal soils Atmospheric Conditions In addition to documenting the frequency of convection over wet and dry soils, we also use a subset of convective events to characterize atmospheric modification by the land surface in greater detail. Soundings of the atmospheric profile allow for direct connection with the underlying land-surface conditions, but are limited in spatial coverage. Therefore, we use atmospheric soundings at 1200 UTC (0600 LST) and 1800 UTC (1200 LST) from the Department of Energy Atmospheric Radiation Measurement facility at Lamont, Oklahoma for the diurnal evolution of atmospheric moisture and energy. In addition to the atmospheric soundings, we also use estimates of latent and sensible heat flux (W m -2 ) from the Atmospheric Radiation Measurement facility Energy Balance Bowen Ratio system at Lamont, Oklahoma. The instantaneous latent and sensible heat flux estimates at 1800 UTC (1200 LST) are used to calculate EF, which is the percent of incoming solar radiation used for evaporation. 10
11 Cluster analysis is used with a Ward s linkage and a 4-class maximum to separate events near Lamont. Hierarchical cluster methods, such as the Ward s method have been used frequently for distinguishing precipitation regimes (Gong and Richman, 1995; Ramos, 2001) and other environmental patterns (Allen and Walsh, 1996). The events are clustered based on their morning (0600 LST) convective triggering potential and low-level humidity (e.g. Findell and Eltahir, 2003). Within each cluster of events, we examine changes in atmospheric humidity and temperature, the level of free convection (LFC), and PBL height The convective environment and stability of the atmosphere associated with each precipitation event is also characterized using profile-integrated convective available potential energy (CAPE) and convective inhibition (CIN). Taylor and Lebel (1998) suggest that soil moisture anomalies can have a significant influence on CAPE, while Myoung and Nielsen- Gammon (2010) find a strong statistical relationship between soil moisture and CIN values in the Southern Great Plains. We calculate CAPE and CIN using the non-virtual surface parcel in this study. Atmospheric stability measures combined with changes in atmospheric humidity and temperature are linked to underlying soil moisture conditions for the events surrounding Lamont. We examine the physical mechanisms coupling the land surface with the atmosphere, potentially leading to convective precipitation. The organization of the results and discussion are presented as follows: section 3 describes the preference for convection to occur over wet or dry soils, connections between soil moisture and atmospheric conditions are presented in section 4, and section 5 provides a summary and discussion of our results with respect to the broader climate community Results 11
12 Dry or Wet Soil Moisture Preference The location of precipitation initiation was identified for each precipitation event and is used to determine the soil moisture conditions in that location (grid cell). The soil moisture percentiles underlying all convective events are presented in Fig. 3. The histogram shows a larger number of convective events occurred over drier than normal soils (< 0.5) than over wetter than normal soils (> 0.5). In fact, the three lowest soil moisture bins (0 30 th percentile) contain the highest number of convective events We evaluate the statistical significance of the preference for precipitation initiation over dry soils using a bootstrapping methodology adopted from Ford et al. (in press). The procedure compares the frequency of convective events over dry and wet soils to the frequency of dry and wet soils from of a sample of 477 randomly selected days (both event and non-event). For the sample days, soil moisture is taken from a randomly chosen grid cell. Frequency distributions generated from the 10,000 iterations of randomly-sampled days are used to assess the likelihood of achieving the ratio of convective events over dry soils to those over wet soils. Based on this evaluation, the number of convective events observed to occur over drier than normal soils is associated with the 99 th percentile of the bootstrapped distribution. This means that the probability of obtaining these results by chance is less than 1%. Therefore, we conclude that there is a statistically significant preference for unorganized precipitation to initiate over drier than normal soils. These results suggest the presence of a dry soil advantage regime (e.g., Gentine et al. 2013) in which convective cloud development is favored over a dry soil surface with a deep PBL and a weakly-stratified, warm/dry free-troposphere (Huang and Margulis, 2011). 12
13 The statistically significant preference for precipitation initiation over dry soils is seemingly in direct contrast with the wet preference found in Ford et al. (2015). The primary difference between studies is the use of CMORPH for event identification by Ford et al. (2015), and NEXRAD radar in the present study. Two important advantages of NEXRAD which may be partly responsible for the contrasting results are: (1) the ability to identify the location of precipitation initiation rather than the location of maximum accumulation, and (2) the ability to discern between unorganized and larger-scale organized systems (Guillod et al. 2014). For each of the 477 events, we identified both the location of precipitation initiation as well as the location of maximum precipitation accumulation. When we substitute the location of maximum accumulation for the location of initiation when compositing soil moisture underlying events, we find an even stronger preference for convection to initiate over dry soils (not shown). This suggests that the lack of agreement between the findings presented here and those in Ford et al. (2015) is most likely due to differences in the datasets and methods used to identify events. When the convective events identified in Ford et al. (2015) using methods adopted from Taylor et al. (2012) were reanalyzed, it was found that large-scale thunderstorms due to frontal activity, low pressure systems, and even tropical storms were grouped together with mesoscale unorganized convective events (Wang et al. in review). The ability to detect soil moisture impacts on convective precipitation initiation is hindered when events due to frontal activity and tropical storms are included because these events do not initiate over the study region. The results presented in this study, however, are based on isolating unorganized convective events and identifying the location of precipitation initiation. This gives us confidence in our assessment of the relationships between soil moisture and unorganized convective events Convective Event Spatial Variability 13
14 Land cover and land use boundaries have been shown to dramatically impact atmospheric temperature and humidity in Oklahoma (Avissar and Pielke 1989; McPherson et al. 2004). Therefore, we investigated whether the unorganized convective events identified in this study show any spatial patterns that are attributable to variations in land cover (Fig. 2). The G-function was used to provide a quantitative measure of spatial randomness (Diggle, 2003; Perry et al. 2006). This method examines the cumulative frequency distribution of nearest neighbor distances for all events. The distribution of nearest neighbor distances calculated from the 477 convective events is then compared against the theoretical distribution of distances generated from a sample of randomly generated points that is the same size as the number of events. More specifically, 477 points are randomly placed around Oklahoma, and from these points a theoretical nearest neighbor distribution is generated. This random-point generation procedure is iterated 1,000 times to create a robust theoretical distribution of nearest neighbor distances. The 50 th, 97 th and 3 rd percentiles are identified from this distribution and are used to represent the median and the confidence interval, respectively. The confidence interval is used to determine if the observed location of the convective events are spatially random Fig. 4 shows the cumulative distribution functions of nearest neighbor distances for the observed convective events (blue line), the bootstrapped median (red line) and 95% confidence envelopes (black lines). The nearest neighbor distance distribution from the convective events falls within the confidence intervals at nearly all distances and, therefore, we conclude that they are spatially random. We repeated this analysis for only wet and only dry events, and both groups were also spatially random Despite our findings of statistically significant spatial randomness, unorganized convective events seem to cluster in the southeast corner of the state. The cluster is coincident with 14
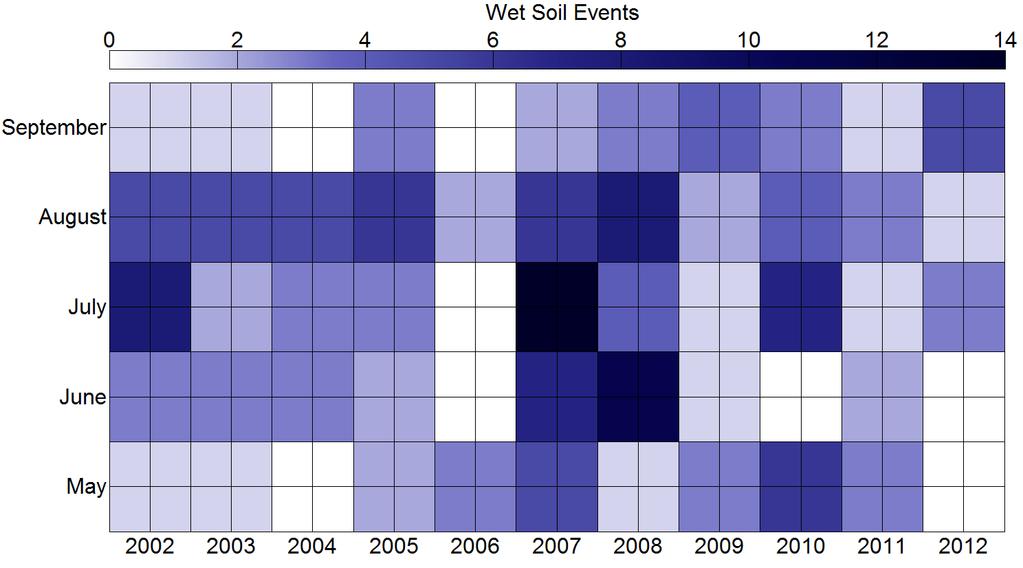
15 predominantly mixed forest land cover; however, no association can be made between the location of these events and land cover-induced atmospheric modification. Instead the grouping of these events is attributed to increased atmospheric instability in the form of mid-morning CAPE (J kg -1 ) (Fig. 5). Mid-morning (0900 LST) CAPE composited for the events that occur in the southeast corner of the state (Fig. 5a) is shown separately from 0900 LST CAPE composited for all other events (Fig. 5b). Spatial patterns of the composites are very similar, with the exception of increased CAPE in the southeast corner of the state during the clustered events. Increased potential energy and instability increases the probability of convection, and may explain the apparent grouping of events in the southeast corner of Oklahoma Convective Event Temporal Variability We examine the monthly and inter-annual variability of wet and dry convective events in Oklahoma. Fig. 6a shows the frequency of dry and wet events during each warm season between 2002 and 2012, as well as total (May September) precipitation (mm) for each year, averaged over all Oklahoma climate divisions. Precipitation totals are taken from the National Climate Data Center Climate Divisional Dataset ( The ratio of dry soil events to wet soil events closely follows the total (May September) precipitation each year. The two years, 2007 and 2008, with more wet soil events than dry soil events experienced the wettest and second wettest seasons over the study period, at 693 and 539 mm, respectively. The years with the highest dry soil to wet soil event ratios (2002, 2006, 2011, 2012) had the four lowest seasonal precipitation totals. The fact that wet soil events tend to occur in wet years and dry soil events tend to occur in dry years is expected because of the direct impact precipitation has on soil moisture, irrespective of any soil moisture feedback. In addition, because our study focuses on the location of convective precipitation initiation, we cannot account for the potential influence of atmospheric 15
16 persistence and the impact of large-scale atmospheric conditions (e.g., Taylor et al. 2011). Therefore, it is important to note that the patterns shown in Fig. 6 might simply depict the impact of precipitation on soil moisture, rather than a wet or dry soil feedback Interestingly, the total number of events per year does not seem to be connected to the seasonal precipitation totals. A similar number of events occurred in 2011 (28), a very dry year, as in 2008 (29), which was a wet year. However, the lack of correspondence between total seasonal precipitation and the number of convective events could be due to our preferential selection of unorganized convective events. Fig. 6b shows the monthly variability of all unorganized convective events, both dry and wet. Dry events occur more frequently in May and June than July and August, when the number of wet events increases. To better describe the patterns of temporal variability shown in Fig. 6, we combine monthly and annual frequency into one grid (Fig. 7). The top panel in Fig. 7 shows the frequency of all events, while the middle and bottom panels show frequencies of wet and dry events, respectively. The primary conclusion that can be drawn from Fig. 7a is that the unorganized convective events tend to occur most frequently between June and August, coinciding with the peak convective season in the Southern Great Plains (Fritsch et al. 1986). While Fig. 7a is divided somewhat horizontally between the middle and beginning/end of the warm season, Figs. 7b and 7c are split vertically. The frequency of wet events (Fig. 7b) is relatively consistent from year to year between 2002 and 2006, with August exhibiting the most frequent wet events. This pattern changes in 2007 and 2008, with a considerable increase in wet event frequency for nearly all months, except September and May. These two very wet years are followed by a pattern that is similar to that observed during 2002 to The increase in wet events in 2007 and 2008 corresponds with a simultaneous decrease in dry events during the same time period. The warm season in 2007 was the 2 nd wettest on record in Oklahoma, with total 16
17 precipitation more than 237 mm above the 30-year mean. Although the same time period in 2008 was less anomalous (25 th wettest on record), precipitation was still more than 75 mm above the mean. The abundant precipitation during these two warm seasons led to near-saturated soils for the majority of the time and helps to explain why convection initiated preferentially over wetter than normal soils (i.e., atmospheric persistence, Taylor et al. 2011) Over the 11-year study there is, on average, a statistically significant preference for precipitation to initiate over drier than normal soils. However, the total number of events and ratio of dry to wet soil events varies considerably on inter-annual and monthly timescales. Wet soil events occurred most frequently in August during years with less-than-normal to normal precipitation. Not surprisingly, seasons with dry and near-normal rainfall conditions coincided with a higher dry to wet event ratio, while convection over wet soils was most frequent during seasons with above normal precipitation totals Atmospheric Pre-Conditioning to Convection This study has produced a climatology of unorganized convection in Oklahoma and connected the location of initiation with soil moisture conditions. This analysis is useful for improving our understanding of the relationship between soil moisture and the location and timing of convection. In this section we investigate the physical mechanisms that link the land surface and atmosphere. We composited convective events occurring within 50 km of Lamont, Oklahoma, where atmospheric soundings are taken daily at 0600 and 1200 LST. These events were used to quantify the relationship between the land surface and the atmosphere. The 50 km threshold was selected based on the expected representativeness of the atmospheric profile (Potvin et al. 2010) over Lamont as well as the spatial autocorrelation of soil moisture in Oklahoma. Convective events 17
18 were only retained if: (1) they occurred within 50 km of Lamont, (2) afternoon precipitation was also recorded in Lamont, and (3) soil moisture percentiles in the grid cell where convection occurred had the same anomaly (wet or dry) as Lamont. Based on these criteria, 17 events were selected for analysis The goal of this analysis is to document the differences in atmospheric conditions between 0600 and 1200 LST preceding convection and to account for atmospheric preconditioning to convection occurring over wet soils and that occurring over dry soils. We used convective triggering potential (CTP, J kg -1 ) and low-level humidity (HIlow, C), adopted from Findell and Eltahir (2003a), to identify events with a morning atmosphere preconditioned for convection over wet soils, dry soils, or convection regardless of the land surface. CTP is the integrated area between the environmental temperature profile and a moist adiabat from 900 to 700 mb. The HIlow is the summation of the dewpoint depression at 950 and 850 mb. The atmospheric levels used for these calculations are taken directly from Findell and Eltahir (2003a) and are assumed to be relevant for Oklahoma This comparison is important, as morning atmospheric conditions from which dry soils could potentially force convection should be very different than those favoring wet soil-forced convection. Namely, a dry soil surface modifies atmospheric conditions by forcing PBL growth and free-tropospheric air entrainment, while wet soils effect specific humidity within the PBL (Gentine et al. 2013). Preference for afternoon convective cloud development over wet or dry soils will depend on morning PBL depth and the stability, temperature, and moisture of freetropospheric air (Findell and Eltahir, 2003a; Huang and Margulis, 2011). Therefore morning (0600 LST) atmospheric profiles and CTP- HIlow conditions over dry and wet soils are expected to be noticeably different. Fig. 8a shows all 17 events composited around Lamont, plotted in dual CTP- 18
19 HIlow space. The scatter plot shows clear separation of the dry and wet soil events, particularly in the vertical (HIlow) and to a lesser extent in the horizontal (CTP). Atmospheric conditions prior to convection over wet soils are characterized by an environmental temperature profile relatively close to the moist adiabatic lapse rate, with an average CTP of 139 J kg -1 and high humidity at low levels (mean HIlow of 10 C). These conditions are similar to the findings of Findell and Eltahir (2003a) for deep convection initiating over wet soils, and are consistent with a wet soil advantage regime (Gentine et al. 2013) in which the wet soils impact PBL specific humidity and therefore PBL depth (i.e., dynamic factor). Atmospheric conditions prior to convection over dry soils have much higher CTP values (mean of 313 J kg -1 ) and higher HIlow (mean of 25 C), representing less stability of the free troposphere (Huang and Margulis, 2011). Delineation of morning atmospheric conditions between wet and dry soil convective events (Fig. 8a) is remarkably consistent with wet and dry soil advantage regimes reported by Gentine et al. (2013), representing the importance of both surface soil moisture conditions and pre-convective atmospheric thermal stability in determining a wet or dry soil preference (Huang and Margulis, 2011) In addition to the separation of dry and wet events in CTP-HIlow space, there appears to be a distinction within dry and wet events (Fig. 8a). We clustered the 17 events using the 0600 LST CTP and HIlow and a hierarchical clustering algorithm with the Ward s linkage and a 4-class maximum. Clustering has been shown to be a useful method for distinguishing disparate conditions leading to the different scatter points (Khong et al. 2015), and is therefore deemed appropriate here. The result of the clustering is shown in Fig. 8b, which displays a similar scatter plot as Fig. 8a, only with points separated into distinct clusters. The 4 clusters span the entire CTP-HIlow range and increase in both CTP and HIlow, generally from cluster 1 to cluster 4. Interestingly, despite not including soil moisture as a variable for the clustering analysis, the algorithm divided wet events 19
20 (clusters 1 and 2) from dry events (clusters 3 and 4). The clusters are used to demonstrate the 0600 LST to 1200 LST atmospheric modification in terms of underlying soil moisture and the preconditioning of the morning atmosphere to convection over wet or dry soils Physical Connections between Soil Moisture and Atmospheric Conditions Atmospheric profiles from soundings at 0600 and 1200 LST are used to characterize conditions and modification from the morning to afternoon before convection occurs. At both 0600 and 1200 LST, we calculate the LFC (mb), PBL height (m) and surface temperature ( C). Additionally for the 0600 LST sounding, we calculate convective temperature ( C), the temperature the near-surface must reach for convection to occur in the absence of synoptic forcing mechanisms, to represent the potential for convection given adequate surface heating. We also calculate CAPE and CIN (J kg -1 ) to characterize atmospheric stability at both sounding times. Large differences are observed between the clusters for all atmospheric measures. Table 1 shows the average LFC height, CAPE, CIN, convective temperature and PBL height from 0600 and 1200 LST as well as the average 0900 LST soil moisture percentile for events in each cluster. CAPE (CIN) values are much higher (lower) at both 0600 and 1200 LST for clusters 1 and 2 events, corresponding with relatively wet soils. Additionally, these clusters have relatively lower LFC and PBL heights and much lower 0600 LST convective temperatures. In direct contrast, dry soil events in clusters 3 and 4 are characterized by relatively low (high) CAPE (CIN) values, deeper PBLs and higher LFC heights. However, more interesting than atmospheric conditions at any one point during the day, are the modifications of atmospheric conditions between 0600 and 1200 LST Fig. 9 shows scatter plots of the soil moisture percentiles and the 1200 LST 0600 LST difference in (a) LFC height (mb), (b) PBL height (m) and (c) surface temperature ( C), delineated 20
21 by cluster. Additionally, Fig. 9d shows the same scatter plot, only with 0600 LST convective temperature on the y-axis. The drier soils of clusters 3 and 4 correspond to increased LFC height, stronger PBL growth and increased surface air temperature and morning convective temperature. The change in these atmospheric conditions is an ideal example of the thermodynamic effect for a deep boundary layer over strong surface sensible heating, with decreased LCL and LFC height compared to PBL growth (Santanello et al. 2011; Gentine et al. 2013). In contrast, events from wet soils events of clusters 1 and 2 show limited PBL growth, decreased LFC heights, lower convective temperature, and smaller changes in surface temperature from 0600 to 1200 LST. This is characteristic of a stable PBL moistened by increased latent heating from a relatively wet surface (i.e., dynamic effect, Gentine et al. 2013). Despite the small sample size, all of the relationships depicted in Fig. 9 are statistically significant. The coefficients of determination for soil moisture and changes in LFC height, PBL height, surface temperature and convective temperature are 0.26, 0.49, 0.60, and 0.53 respectively. Obviously the relationship between soil moisture and nearsurface atmospheric temperature is strongest; however, even with varying atmospheric conditions from 17 events, soil moisture percentiles at 0900 LST still explain more than 25% of the variance in LFC height change from 0600 to 1200 LST Along with changes in the atmospheric temperature and LFC/PBL heights, we also relate soil moisture percentiles from the 17 events to atmospheric stability. Fig. 10a shows scatter plots of soil moisture percentile and the change (difference) in CAPE (ΔCAPE, J kg -1 ) between 1200 and 0600 LST. Fig. 10b shows the same scatter plot, only showing the 1200 LST 0600 LST difference in CIN (ΔCIN, J kg -1 ) delineated by cluster. For clarity, negative ΔCIN values represent a decrease in CIN (decrease in stability) between 0600 and 1200 LST. The general relationship between soil moisture and the changes in both CAPE and CIN are positive, with (wet soil) events 21
22 in clusters 1 and 2 corresponding with larger (smaller) changes in CAPE (CIN). Mechanistically, drier than normal soils enhance sensible heating at the surface, which results in increased nearsurface air temperature and heating of the air parcel near the surface (Fig. 9c). The enhanced warming of the surface allows the surface temperature to approach (or to reach) the convective temperature, essentially decreasing CIN values. Wet soils diminish surface heating, which results in a negligible change in CIN between 0600 and 1200 LST. Concurrently, wetter than normal soils provide enhanced moisture flux to the atmosphere through increased latent heating (Ek and Holtslag, 2004; Gentine et al., 2013). This decreases the level of the LFC (Fig. 9a) and increases CAPE throughout the profile. Through the modification of CAPE and CIN, both wet and dry soils have the potential to initiate convection, and in the case of our 17 events, are physically linked to modifications of the atmosphere. The coupling between soil moisture and CAPE/CIN is also statistically significant, with coefficient of determination values of 0.42 and 0.77, respectively. This means that an overwhelming amount of variance in the evolution of CIN between 0600 and 1200 LST (77%) is captured by 0900 LST soil moisture percentiles Gentine et al. (2013) delineate positive and negative regions of relative humidity sensitivity to EF, through which convection is induced. We examine our 17 convective events in (1200 LST) potential temperature slope (γθ, K km -1 ) EF space to determine if we can similarly separate the events into regions of positive and negative relative humidity sensitivity (Fig. 11). Although not as distinct as the separation demonstrated by Gentine et al. (2013), the 17 convective events show a delineation along γθ EF space. Mixed layer relative humidity is most sensitive to changes in surface energy flux when evaporation is constrained under a less stable boundary layer and when evaporation is enhanced under a more stratified boundary layer. The convective events are colored in Fig. 11 based on the 5 cm soil moisture percentile underlying the initiation point. Event 22
23 separation is further demonstrated as wet and dry soil advantage regimes (e.g., Gentine et al. 2013), corresponding with positive and negative regions of relative humidity sensitivity, respectively. Overall, the pattern shown in Fig. 11 supports the dual wet soil-dry soil advantage regimes proposed by Gentine et al. (2013), and suggest that convective initiation can occur under both regimes in the Southern Great Plains Through the manual event identification procedure, we were able to quantify individual event duration (hours), average size (pixels), and total precipitation accumulation (mm) (Table 1). We relate these event characteristics to precedent land surface and atmospheric conditions using correlation analysis. All three event characteristics (duration, size, total precipitation) are significantly, negatively related to the change in PBL height (m) between 0600 and 1200 LST. Larger PBL growth (over predominantly drier soils) corresponds with decreased atmospheric relative humidity, which results in events with shorter duration, smaller size, and less overall precipitation. The coefficient of determination between the change in PBL height and duration, size, and total precipitation are 0.22, 0.31 and 0.40, respectively. Two of the three characteristics, duration and total precipitation, are significantly, positively related to CAPE at 0600 LST. Events exhibiting larger CAPE values correspond to longer event duration and more total precipitation, with coefficient of determination values of 0.41 and 0.85, respectively. The soil moisture percentile does not have a statistically significant relationship with any of the event characteristics Summary and Conclusions Soil moisture-precipitation interactions have been a major avenue of hydroclimatic research for decades. Previous studies have found evidence of a wet-positive soil moisture feedback in which increased latent heating from a wet soil surface moistens a stable PBL, 23
24 decreasing surface temperatures, the lifting condensation level, and the level of free convection, and increasing CAPE (Pielke, 2001; Pal and Eltahir, 2003; Ek and Holtslag, 2004; Ferguson and Wood, 2011; Huang and Margulis, 2011). In contrast, other studies have found that anomalously dry soils can impact convective initiation more strongly than wet soils through increased sensible heat flux, a decrease in CIN and increase in PBL height (Santanello et al. 2009; Taylor et al. 2012). The preference for convective development over relatively dry soils is particularly evident when PBL growth entrains relatively warm, dry air from a weakly stratified free-troposphere (Westra et al. 2012; Gentine et al. 2013) Our results show a statistically significant preference for unorganized convection to occur over drier than normal soils, although there are a non-negligible number of events that occur over wet soils. Importantly, the ability of our analysis to discern between unorganized convection and organized systems associated with frontal passage and low-pressure systems is dependent on our precipitation event identification. Automated event identification algorithms using other datasets, such as CMORPH, tend to lump together unorganized convective events (e.g., those initiating from local-scale processes), with large-scale frontal systems and tropical storms that do not initiate over the region of interest (Wang et al. in review). We compare maximum hourly precipitation accumulation between the 477 events identified here using NEXRAD and the 353 events identified in Ford et al. (in press) using CMORPH (Fig. 12). The CMORPH events have a significant larger median maximum hourly accumulation rate, as determined using the Kruskill-Wallis test, than the NEXRAD events. However, the largest differences between the datasets are in the right tail of the distribution, with many CMORPH event accumulation rates exceeding 100 mm/hr. The occurrence of extremely large precipitation rates in the CMORPH dataset suggests that events associated with large-scale systems are being included in the 353 events. Therefore, the lack of agreement between 24
25 the results of this study and previous studies (Taylor et al. 2012; Ford et al. in press) can be partly attributed to the different data products and methods used for event identification. With these results in mind, we argue that our manual event identification procedure works best for (1) identifying the point of precipitation initiation and (2) separating unorganized from organized convective events. Therefore, we have confidence in our assessment of the relationships between soil moisture and unorganized convective events After compositing 17 events near Lamont, OK where atmospheric soundings observations were available, we found strong connections between soil moisture and atmospheric modification between 0600 LST and 1200 LST. The strongest modification was to CIN and surface air temperature during this time period, as soil moisture explained 77% and 60% of the variance, respectively. Soil moisture has been previously connected to changes in near-surface air temperature in Oklahoma, albeit at much longer time scales (Ford and Quiring, 2014b). Basara and Crawford (2002) also found that the daily evolution of the PBL, including 2 m air temperature, was connected to soil moisture anomalies on clear sky days. The strong connection between soil moisture and CIN is mechanistically consistent with enhanced (diminished) surface heating over dry (wet) soils. Myoung and Nielsen-Gammon (2010) showed that on monthly time scales, CIN was a better determinant to the occurrence of precipitation during the warm season in Texas. However, their results also showed a strong, negative relationship between soil moisture and CIN such that drier than normal soils resulted in stronger CIN values and therefore stronger atmospheric stability (Myoung and Nielsen-Gammon, 2010). The results from our analysis are not necessarily in disagreement because we evaluated the relationship between soil moisture and the 0600 to 1200 LST change in CIN. In fact, as Table 1 shows, 0600 LST and 1200 LST CIN values were strongest over dry soils; however, the enhanced surface heating attributable to moisture-limited land surface 25
26 conditions in these cases allowed for more rapid surface heating and therefore a larger overall decrease in CIN over dry soils. It should be noted that although stronger CIN over drier than normal soils (e.g. Myoung and Nielsen-Gammon, 2010) can be considered a general deterrent for convection, dry soils can also erode strong CIN much more quickly than wetter soils due to increased sensible heating The results of this study show strong statistical relationships between soil moisture and several atmospheric conditions and stability indices. These relationships are mechanistically consistent with wet-positive and dry-negative feedbacks to precipitation, suggesting that both positive and negative soil moisture feedbacks are relevant in this region of the United States Acknowledgements We gratefully acknowledge the National Science Foundation (Award numbers: AGS , BCS ) for funding this work. We would also like to thank the Oklahoma Mesonet for providing soil moisture observations used in this work. Data files from the Mesonet can be obtained online at: Finally we would like to thank Dr. Pierre Gentine and two anonymous reviewers for their helpful comments and suggestions
27 591 References Allen, T. R., and Walsh, S. J.: Spatial and compositional pattern of alpine treeline, Glacier National Park, Montana. Photogram. Engin. Rem. Sens., 62, , Ashley, W. S., and Gilson, C. W.: A reassessment of U.S. lightning mortality, Bull. Amer. Meteor. Soc., 90, , doi: /2009BAMS2765.1, Basara, J. B. and Crawford, K. C.: Linear relationships between root-zone soil moisture and atmospheric processes in the PBL. J. Geophys. Res., 107, doi: /2001JD000633, Berg, A., Findell, K., Lintner, B. R., Gentine, P., and Kerr, C.: Precipitation sensitivity to surface heat fluxes over North America in reanalysis and model data, J. Hydrometeor., 14, , doi: /jhm-d , Brimelow, J. C., Hanesiak, J. M., and Burrows, W. R.: Impacts of land-atmosphere feedbacks on deep, moist convection on the Canadian Prairies. Earth Interact., 15, 1-29, doi: /2011ei407.1, Carleton, A. M., Arnold, D. L., Travis, D. J., Curran, S., and Adegoke, J. O., 2008: Synoptic circulation and land surface influences on convection in the Midwest US Corn Belt during the summers of 1999 and Part I: Composite synoptic environments. J. Clim., 21, , doi: /2007JCLI1578.1, Diggle, P. J., Ribeiro, P. J., and Christensen, O.: An introduction to model-based geostatistics. In Spatial statistics and computational methods. Lecture Notes in Statistics 173 (ed. J. Møller), Springer, New York, Dirmeyer, P. A., Zeng, F. J., Ducharne, A., Morrill, J. C., and Koster, R. D.: The sensitivity of surface fluxes to soil water content in three land surface schemes. J. Hydrometeorol., 1, , doi: / , Dirmeyer, P. A., Schlosser, C. A., and Brubaker, K. A.: Precipitation, recycling, and land memory: An integrated analysis. J. Hydrometeorol., 10, , doi: /2008jhm1016.1, Douville, H., and Chauvin, F.: Relevance of soil moisture for seasonal climate predictions: a preliminary study. Clim. Dynam., 16, , doi: /s , Ferguson, C. R., and Wood, E. F.: Observed land-atmosphere coupling from satellite remote sensing and reanalysis. J. Hydrometeorol., 12, , doi: /2011JHM1380.1, Findell, K. L. and Eltahir, E. A. B.: Atmospheric controls on soil moisture-boundary layer interactions. Part I: Framework development. J. Hydrometeorol., 4, , doi: / ,
28 Findell, K. L., Gentine, P., Lintner, B. R., and Kerr, C.: Probability of afternoon precipitation in eastern United States and Mexico enhanced by high evaporation. Nature, 4, , doi: /ngeo1174. Ford, T. W., Rapp, A. D., and Quiring, S. M.: Does afternoon precipitation occur preferentially over dry or wet soils in Oklahoma?, J. Hydrometeorol., doi: ,JHM-D , Ford, T. W., and Quiring, S. M.: Comparison and application of multiple methods for temporal interpolation of daily soil moisture. Int. J. Clim., 34, , doi: /joc.3862, 2014a. Ford, T. W., and Quiring, S. M.: In situ soil moisture coupled with extreme temperatures: A study based on the Oklahoma Mesonet. Geophys. Res. Lett., 41, , doi: /2014gl060949, 2014b. Fritsch, J. M., Kane, R. J., and Chelius, C. R.: The contribution of mesoscale convective weather systems to the warm-season precipitation in the United States. J. Appl. Clim. Meteor., 25, , doi: / , Frye, J. D. and Mote, T. L.: Convection initiation along soil moisture boundaries in the southern Great Plains. Mon. Weather Rev., 138, , doi: /2009mwr2865.1, 2010a. Frye, J. D., and Mote, T. L.: The synergistic relationship between soil moisture and the low-level jet and its role on the prestorm environment in the Southern Great Plaisn. J. Appl. Meteor. Climat., 49, , doi: /2009jamc2146.1, 2010b. Gallus, W. A. Jr., Snook, N. A., and Johnson, E. V.: Spring and summer severe weather reports over the Midwest as a function of convective mode: A preliminary study, Wea. Forecasting, 23, , doi: /2007WAF , Gentine, P., Holtslag, A.A.M., D Andrea, F., and Ek, M.: Surface and atmospheric controls on the onset of moist convection over land. J. Hydrometeorol., 14, , doi: /JHM- D , Gong, X., and Richman, M. B.: On the application of cluster analysis to growing season precipitation data in North America East of the Rockies. J. Clim., 8, , doi: / , Guillod, B. P., Orlowsky, B., Miralles, D., Teuling, A. J., Blanken, P. D., Buchmann, N., Ciais, P., Ek, M., Findell, K. L., Gentine, P., Lintner, B. R., Scott, R. L., Van den Hurk, B., and Seneviratne, S. I.: Land-surface controls on afternoon precipitation diagnosed from observational data: uncertainties and confounding factors. Atmos. Chem. Phys., 14, , doi: /acp , Illston, B. G., Basara, J. B., Fiebrich, C. A., Crawford, K. C., Hunt, E., Fisher, D. K., Elliott, R., and Humes, K.: Mesoscale monitoring of soil moisture across a statewide network. J. Atmos. Ocean. Technol., 25, , doi: /2007JTECHA993.1,
29 Joyce, R. J., Janowiak, J. E., Arkin, P. A., and Xie, P.: CMORPH: A method that produces global precipitation estimates from passive microwave and infrared data at high spatial and temporal resolution. J. Hydrometeorol., 5, , doi: / , Khong, A., Wang, J. K., Quiring, S. M., and Ford, T. W.: Soil moisture variability in Iowa, Int. J. Clim., doi: /joc.4176, Klimowski, B. A., Bunkers, M. J., Hjelmfelt, M. R., and Covert, J. N.: Severe convective windstorms over the Northern High Plains of the United States, Wea. Forecasting, 18, , doi: / , Koster, R. D., Dirmeyer, P. A., Guo, Z., Bonan, G., Chan, E., Cox, P., Gordon, C. T., Kanae, S., Kowlczyk, E., Lawrence, D., Liu, P., Lu, C., Malyshev, S., McAvaney, B., Mitchell, K., Mocko, D., Oki, T., Oleson, K., Pitman, A., Sud, Y. C., Taylor, C. M., Verseghy, D., Vasic, R., Xue, Y. and Yamada, T.: Regions of strong coupling between soil moisture and precipitation, Science, 305, , doi: /science , Koster, R. D., Mahanama, S. P. P., Yamada, T. J., Balsamo, G., Berg, A. A., Boisserie, M., Dirmeyer, P. A., Doblas-Reyes, F. J., Drewitt, G., Gordon, C. T., Guo, Z., Jeong, J. H., Lee, W. S., Li, Z., Luo, L., Malyshev, S., Merrfield, W. J., Senevirantne, S. I., Stanelle, T., van den Hurk, B. J. J. M., Vitart, F., and Wood, E. F.: The second phase of the Global Land-Atmosphere Coupling Experiment: soil moisture contributions to subseasonal forecast skill. J. Hydrometeor., 12, , doi: /2011JHM1365.1, Lin, Y., and Mitchell, K.E.: The NCEP Stage II/IV hourly precipitation analyses: development and applications. 19 th Conf. on Hydrology, American Meteorological Society, San Diego, CA, 9 13 January 2005, Paper 1.2. Matyas, C. J. and Carleton, A. M.: Surface radar-derived convective rainfall associations with Midwest US land surface conditions in summer seasons 1999 and Theor. Appl. Clim., 99, , doi: /s , McPherson, R. A.: A review of vegetation atmosphere interactions and their influences on mesoscale phenomena. Prog. Phys. Geogr., 31, , doi: / , Meng, L. and Quiring, S. M.: Examining the influence of spring soil moisture anomalies on summer precipitation in the US Great Plains using the Community Atmosphere Model version 3. J. Geophys. Res., 115, doi: /2010JD014449, Myoung, B. and Nielsen-Gammon, J. W.: The convective instability pathway to warm season drought in Texas. Part I: The role of convective inhibition and its modulation by soil moisture. J. Clim., 23, , doi: /2010jcli2946.1, Pal, J. S. and Eltahir, E. A. B.: Pathways relating soil moisture conditions to future summer rainfall within a model of the land-atmosphere system. J. Clim., 14, , doi: / ,
30 Parker, M. D., and Johnson, R. H.: Organizational models of midlatitude mesoscale convective systems, Mon. Wea. Rev., 128, , doi: / , Perry, G. L. W., Miller, B. P., and Enright, N. J.: A comparison of methods for the statistical analysis of spatial point patterns in plant ecology, Plant. Ecol., 187, 59-82, doi: /s , Pielke, R. A.: Influence of the spatial distribution of vegetation and soils on the prediction of cumulus convective rainfall. Rev. Geophys., 39, , doi: /1999rg000072, Potvin, C. K., Elmore, K. L., and Weiss, S. J.: Assessing the impacts of proximity sounding criteria on the climatology of significant tornado environments. Wea. Forecast., 25, , doi: /2010waf , Raddatz, R. L., and Hanesiak, J. M.: Significant summer rainfall in the Canadian Prairie Provinces: modes and mechanisms Int. J. Clim., 28, , doi: /joc.1670, Ramos, M. C.: Divisive and hierarchical clustering techniques to analyse variability of rainfall distribution patterns in a Mediterranean region. Atmos. Res., 57, , doi: /so , Roundy, J. K., Ferguson, C. R., Wood, E.F.: Temporal variability of land atmosphere coupling and its implications for drought over the Southeast United States. J. Hydrometeorol., 14, , doi: /jhm-d , Santanello, J. A., Peters-Lidard, C. D., Kumar, S. V., Alonge, C., and Tao, W.: A modeling and observational framework for diagnosing local land-atmosphere coupling on diurnal time scales. J. Hydrometeor., 10, , doi: /2009jhm1066.1, Santanello, J. A., Peters-Lidard, C. D., and Kumar, S. V.: Diagnosing the sensitivity of local land-atmosphere coupling via the soil moisture-boundary layer interaction. J. Hydrometeorol., 12, , doi: /JHM-D , Santanello, J. A., and Peters-Lidard, C. D.: Diagnosing the nature of land-atmosphere coupling: A case study of dry/wet extremes in the U.S. Southern Great Plains. J. Hydrometeorol., 14, 3-24, doi: /jhm-d , Schoen, J. M., and Ashley, W. S.: A climatology of fatal convective wind events by storm type. Wea. Forecasting, 26, , doi: /2010waf , Scott, B. L., Ochsner, T. E., Illston, B. G., Fiebrich, C. A., Basara, J. B., and Sutherland, A. J.: New soil property database improves Oklahoma Mesonet soil moisture estimates. J. Atmo. Ocean. Tech., 30, , doi: /TECH-D ,
31 Seneviratne, S. I., Corti, T., Davin, E. L., Hirschi, M., Jaeger, E. B., Lehner, I., Orlowsky, B., and Teuling, A. J.: Investigating soil moisture climate interactions in a changing climate: A review. Earth-Sci. Rev., 99, , doi: /j.earscirev , Taylor, C. M., de Jeu, R. A., Guichard, F., Harris, P. P., and Dorigo, W. A.: Afternoon rain more likely over drier soils, Nature, 489, , doi: /nature11377, Taylor, C. M. and Lebel, T.: Observational evidence of persistent convective-scale rainfall patterns, Mon. Weather Rev., 126, , doi: / Teuling, A. J., Seneviratne, S. I., Williams, C., and Troch, P. A.: Observed timescales of evapotranspiration response to soil moisture. Hydrol. Land Surf. Stud., 33, doi: /2006gl028178, Wu, W. and Dickinson, R. E.: Time scales of layered soil moisture memory in the context of land-atmosphere interaction. J. Clim., 17, , doi: / ,
32 Figure 1. Schematic of the decision tree that was used for manual identification of unorganized convective events. 32
 identified between May and September, 2002-2012.")
33 Figure 2. Location of all 477 convective events (black circles) identified between May and September, The land cover, taken from the National Land Cover Dataset ( is also shown
 and relatively dry (< 50 percentile) soils.")
34 Figure 3. Top panel (a) shows the distribution of 5 cm soil moisture percentiles underlying all convective events identified. The dashed-black line represents the divide between relatively wet (> 50 percentile) and relatively dry (< 50 percentile) soils. The bottom panel (b) shows the distribution of differences between soil moisture associated with the location of precipitation initiation and each of the neighboring grid cells in a 3 x 3 window. Negative values represent conditions where soil moisture was lower at the location of precipitation initiation and higher in the neighboring grid cell. 34
35 Figure 4. Cumulative distribution functions of nearest neighbor distances for all unorganized convective events (blue line), the bootstrapped median (red line) and 95% confidence envelopes (black lines). The bootstrapped samples are calculated from 1,000 iterations of 477 random events
 convective available potential energy from (a) events clustered in southeast")
36 766 a. 767 b Figure 5. Composites of morning (0600 LST) convective available potential energy from (a) events clustered in southeast corner of the study region and (b) all other convective events
 shows the frequency of dry and wet events during each warm season between 2002 and 2012, as well as the total May September precipitation (mm) for each year.")
37 774 a b. Figure 6. Top panel (a) shows the frequency of dry and wet events during each warm season between 2002 and 2012, as well as the total May September precipitation (mm) for each year. The bottom panel (b) shows the monthly variability of all events, color-coded into dry and wet categories, as well as average ( ) monthly precipitation (mm)

38 782 a. 783 b. 38

39 c. Figure 7. Frequency of unorganized convective events in each month during the study period. The top panel represents all events, the middle panel is the wet events and the bottom panel is the dry events
 convective triggering potential (J kg -1 ) humidity index ( C) space:")
40 789 a b. Figure 8. Scatter plots of the 17 unorganized convective events that occurred near Lamont, OK in dual (0600 LST) convective triggering potential (J kg -1 ) humidity index ( C) space: (a) wet events are denoted by the blue circle and dry events are denoted by a red triangle. (b) Events are grouped into 4 clusters. 40
SOIL MOISTURE IMPACTS ON CONVECTIVE PRECIPITATION IN OKLAHOMA. A Dissertation TRENTON W. FORD
 SOIL MOISTURE IMPACTS ON CONVECTIVE PRECIPITATION IN OKLAHOMA A Dissertation by TRENTON W. FORD Submitted to the Office of Graduate and Professional Studies of Texas A&M University in partial fulfillment
Diagnosing the Climatology and Interannual Variability of North American Summer Climate with the Regional Atmospheric Modeling System (RAMS)
") Diagnosing the Climatology and Interannual Variability of North American Summer Climate with the Regional Atmospheric Modeling System (RAMS) Christopher L. Castro and Roger A. Pielke, Sr. Department of
Diagnosing the Climatology and Interannual Variability of North American Summer Climate with the Regional Atmospheric Modeling System (RAMS) Christopher L. Castro and Roger A. Pielke, Sr. Department of
Charles A. Doswell III, Harold E. Brooks, and Robert A. Maddox
 Charles A. Doswell III, Harold E. Brooks, and Robert A. Maddox Flash floods account for the greatest number of fatalities among convective storm-related events but it still remains difficult to forecast
Neural Network Based Sensitivity Analysis of Summertime Convection over the Continental United States
 1958 J O U R N A L O F C L I M A T E VOLUME 27 Neural Network Based Sensitivity Analysis of Summertime Convection over the Continental United States FILIPE AIRES Estellus, and Laboratoire de l Etude du
Influence of variations in low-level moisture and soil moisture on the organization of summer convective systems in the US Midwest
 Influence of variations in low-level moisture and soil moisture on the organization of summer convective systems in the US Midwest Jimmy O. Adegoke 1, Sajith Vezhapparambu 1, Christopher L. Castro 2, Roger
11A.2 Forecasting Short Term Convective Mode And Evolution For Severe Storms Initiated Along Synoptic Boundaries
 11A.2 Forecasting Short Term Convective Mode And Evolution For Severe Storms Initiated Along Synoptic Boundaries Greg L. Dial and Jonathan P. Racy Storm Prediction Center, Norman, Oklahoma 1. Introduction
Chapter 14 Thunderstorm Fundamentals
 Chapter overview: Thunderstorm appearance Thunderstorm cells and evolution Thunderstorm types and organization o Single cell thunderstorms o Multicell thunderstorms o Orographic thunderstorms o Severe
Analysis of Severe Storm Initiation Along Drylines in the Southern Plains
 Analysis of Severe Storm Initiation Along Drylines in the Southern Plains NICOLE L. BARBEE Meteorology Program, Iowa State University, Ames Mentor: Dr. William Gallus 1 1 Department of Geological and Atmospheric
Atmospheric Moisture, Precipitation, and Weather Systems
 Atmospheric Moisture, Precipitation, and Weather Systems 6 Chapter Overview The atmosphere is a complex system, sometimes described as chaotic in nature. In this chapter we examine one of the principal
REGIONAL VARIABILITY OF CAPE AND DEEP SHEAR FROM THE NCEP/NCAR REANALYSIS ABSTRACT
 REGIONAL VARIABILITY OF CAPE AND DEEP SHEAR FROM THE NCEP/NCAR REANALYSIS VITTORIO A. GENSINI National Weather Center REU Program, Norman, Oklahoma Northern Illinois University, DeKalb, Illinois ABSTRACT
Practical Use of the Skew-T, log-p diagram for weather forecasting. Primer on organized convection
 Practical Use of the Skew-T, log-p diagram for weather forecasting Primer on organized convection Outline Rationale and format of the skew-t, log-p diagram Some basic derived diagnostic measures Characterizing
Kenneth L. Pryor* and Gary P. Ellrod Center for Satellite Applications and Research (NOAA/NESDIS) Camp Springs, MD
 Camp Springs, MD") P1.57 GOES WMSI PROGRESS AND DEVELOPMENTS Kenneth L. Pryor* and Gary P. Ellrod Center for Satellite Applications and Research (NOAA/NESDIS) Camp Springs, MD 1. INTRODUCTION A multi-parameter index has
P1.57 GOES WMSI PROGRESS AND DEVELOPMENTS Kenneth L. Pryor* and Gary P. Ellrod Center for Satellite Applications and Research (NOAA/NESDIS) Camp Springs, MD 1. INTRODUCTION A multi-parameter index has
Mesoscale Convective Complexes (or Systems)
") Mesoscale Convective Complexes (or Systems) What is an MCC Mesoscale Convectiv Complexes (MCCs) are organized clusters of storms that have to meet some size and shape criteria: * -32C IR temp > 100,000
Mesoscale Convective Complexes (or Systems) What is an MCC Mesoscale Convectiv Complexes (MCCs) are organized clusters of storms that have to meet some size and shape criteria: * -32C IR temp > 100,000
Kirsten Findell (GFDL/NOAA) and Joe Santanello (NASA) Alpine Summer School on Land-Atmosphere Interactions Valsavarenche, Italy June 30, 2015
 and Joe Santanello (NASA) Alpine Summer School on Land-Atmosphere Interactions Valsavarenche, Italy June 30, 2015") Kirsten Findell (GFDL/NOAA) and Joe Santanello (NASA) Alpine Summer School on Land-Atmosphere Interactions Valsavarenche, Italy June 30, 2015 1 Outline Diurnal Land-Atmosphere (L-A) Processes Local Coupling
Kirsten Findell (GFDL/NOAA) and Joe Santanello (NASA) Alpine Summer School on Land-Atmosphere Interactions Valsavarenche, Italy June 30, 2015 1 Outline Diurnal Land-Atmosphere (L-A) Processes Local Coupling
STATISTICAL ANALYSIS ON SEVERE CONVECTIVE WEATHER COMBINING SATELLITE, CONVENTIONAL OBSERVATION AND NCEP DATA
 12.12 STATISTICAL ANALYSIS ON SEVERE CONVECTIVE WEATHER COMBINING SATELLITE, CONVENTIONAL OBSERVATION AND NCEP DATA Zhu Yaping, Cheng Zhoujie, Liu Jianwen, Li Yaodong Institute of Aviation Meteorology
Multi-day severe event of May 2013
 Abstract: Multi-day severe event of 18-22 May 2013 By Richard H. Grumm and Charles Ross National Weather Service State College, PA A relatively slow moving Trough over the western United States and a ridge
Land Surface Processes and Interaction with the Atmosphere
 Land Surface Processes and Interaction with the Atmosphere Paul Dirmeyer Center for Ocean-Land-Atmosphere Studies George Mason University Fairfax, Virginia, USA Boundary Layer Modeling is Important! But
Type of storm viewed by Spotter A Ordinary, multi-cell thunderstorm. Type of storm viewed by Spotter B Supecell thunderstorm
 ANSWER KEY Part I: Locating Geographical Features 1. The National Weather Service s Storm Prediction Center (www.spc.noaa.gov) has issued a tornado watch on a warm spring day. The watch covers a large
GE G Climate Science Lab
 GE G Climate Science Lab North American Soil Moisture Database: Development and Applications Steven M. Quiring Texas A&M University Trenton Ford Texas A&M University http://climatology.tamu.edu http://facebook.com/geogcsl
FORECAST UNCERTAINTY UNDER
 FORECAST UNCERTAINTY UNDER DIFFERENT LAND-ATMOSPHERE COUPLING REGIMES Hyo-Jong Song and Craig R. Ferguson Atmospheric Sciences Research Center, University at Albany, SUNY, Albany, NY BACKGROUND Takeaways
Forecasting Convective Downburst Potential Over The United States Great Plains
 Forecasting Convective Downburst Potential Over The United States Great Plains Kenneth L. Pryor Center for Satellite Applications and Research (NOAA/NESDIS), Camp Springs, MD 20746, USA Abstract A favorable
A Case Study on Diurnal Boundary Layer Evolution
 UNIVERSITY OF OKLAHOMA A Case Study on Diurnal Boundary Layer Evolution Meteorological Measurement Systems Fall 2010 Jason Godwin 12/9/2010 Lab partners: Sam Irons, Charles Kuster, Nathan New, and Stefan
ANSWER KEY. Part I: Synoptic Scale Composite Map. Lab 12 Answer Key. Explorations in Meteorology 54
 ANSWER KEY Part I: Synoptic Scale Composite Map 1. Using Figure 2, locate and highlight, with a black dashed line, the 500-mb trough axis. Also, locate and highlight, with a black zigzag line, the 500-mb
DISTRIBUTION AND DIURNAL VARIATION OF WARM-SEASON SHORT-DURATION HEAVY RAINFALL IN RELATION TO THE MCSS IN CHINA
 3 DISTRIBUTION AND DIURNAL VARIATION OF WARM-SEASON SHORT-DURATION HEAVY RAINFALL IN RELATION TO THE MCSS IN CHINA Jiong Chen 1, Yongguang Zheng 1*, Xiaoling Zhang 1, Peijun Zhu 2 1 National Meteorological
WaVaCS summerschool Autumn 2009 Cargese, Corsica
 Introduction Part I WaVaCS summerschool Autumn 2009 Cargese, Corsica Holger Tost Max Planck Institute for Chemistry, Mainz, Germany Introduction Overview What is a parameterisation and why using it? Fundamentals
Tornadogenesis in Supercells: The Three Main Ingredients. Ted Funk
 Tornadogenesis in Supercells: The Three Main Ingredients Ted Funk NWS Louisville, KY Spring 2002 Environmental Parameters Supercells occur within environments exhibiting several wellknown characteristics
Conference Proceedings Paper Daily precipitation extremes in isolated and mesoscale precipitation for the southeastern United States
 Conference Proceedings Paper Daily precipitation extremes in isolated and mesoscale precipitation for the southeastern United States Thomas Rickenbach 1* Published: 06/11/2017 Academic Editor: Ricardo
1 of 7 Thunderstorm Notes by Paul Sirvatka College of DuPage Meteorology. Thunderstorms
 1 of 7 Thunderstorm Notes by Paul Sirvatka College of DuPage Meteorology Thunderstorms There are three types of thunderstorms: single-cell (or air mass) multicell (cluster or squall line) supercell Although
Large-Eddy Simulations of Tropical Convective Systems, the Boundary Layer, and Upper Ocean Coupling
 DISTRIBUTION STATEMENT A. Approved for public release; distribution is unlimited. Large-Eddy Simulations of Tropical Convective Systems, the Boundary Layer, and Upper Ocean Coupling Eric D. Skyllingstad
and 24 mm, hPa lapse rates between 3 and 4 K km 1, lifted index values
 3.2 Composite analysis 3.2.1 Pure gradient composites The composite initial NE report in the pure gradient northwest composite (N = 32) occurs where the mean sea level pressure (MSLP) gradient is strongest
CHAPTER 8 NUMERICAL SIMULATIONS OF THE ITCZ OVER THE INDIAN OCEAN AND INDONESIA DURING A NORMAL YEAR AND DURING AN ENSO YEAR
 CHAPTER 8 NUMERICAL SIMULATIONS OF THE ITCZ OVER THE INDIAN OCEAN AND INDONESIA DURING A NORMAL YEAR AND DURING AN ENSO YEAR In this chapter, comparisons between the model-produced and analyzed streamlines,
Joshua M. Boustead *1, and Barbara E. Mayes NOAA/NWS WFO Omaha/Valley, NE. William Gargan, George Phillips, and Jared Leighton NOAA/NWS WFO Topeka, KS
 7B.3 Composite Analysis of Environmental Conditions Favorable for Significant Tornadoes across Eastern Kansas Joshua M. Boustead *1, and Barbara E. Mayes NOAA/NWS WFO Omaha/Valley, NE William Gargan, George
Characteristics of extreme convection over equatorial America and Africa
 Characteristics of extreme convection over equatorial America and Africa Manuel D. Zuluaga, K. Rasmussen and R. A. Houze Jr. Atmospheric & Climate Dynamics Seminar Department of Atmospheric Sciences, University
2.1 Temporal evolution
 15B.3 ROLE OF NOCTURNAL TURBULENCE AND ADVECTION IN THE FORMATION OF SHALLOW CUMULUS Jordi Vilà-Guerau de Arellano Meteorology and Air Quality Section, Wageningen University, The Netherlands 1. MOTIVATION
Daniel J. Cecil 1 Mariana O. Felix 1 Clay B. Blankenship 2. University of Alabama - Huntsville. University Space Research Alliance
 12A.4 SEVERE STORM ENVIRONMENTS ON DIFFERENT CONTINENTS Daniel J. Cecil 1 Mariana O. Felix 1 Clay B. Blankenship 2 1 University of Alabama - Huntsville 2 University Space Research Alliance 1. INTRODUCTION
Large-Eddy Simulations of Tropical Convective Systems, the Boundary Layer, and Upper Ocean Coupling
 DISTRIBUTION STATEMENT A. Approved for public release; distribution is unlimited. Large-Eddy Simulations of Tropical Convective Systems, the Boundary Layer, and Upper Ocean Coupling Eric D. Skyllingstad
Why the Atlantic was surprisingly quiet in 2013
 1 Why the Atlantic was surprisingly quiet in 2013 by William Gray and Phil Klotzbach Preliminary Draft - March 2014 (Final draft by early June) ABSTRACT This paper discusses the causes of the unusual dearth
CYCLONIC AND FRONTAL ACTIVITY IN OHIO DURING THE SUMMER OF 1953
 CYCLONIC AND FRONTAL ACTIVITY IN OHIO DURING THE SUMMER OF 1953 ROBERT D. RUDD Department of Geography and Geology, Ohio University, Athens The summer of 1953 was an unusually dry one in most of southern
A "New" Mechanism for the Diurnal Variation of Convection over the Tropical Western Pacific Ocean
 A "New" Mechanism for the Diurnal Variation of Convection over the Tropical Western Pacific Ocean D. B. Parsons Atmospheric Technology Division National Center for Atmospheric Research (NCAR) Boulder,
The most abundant gas in the atmosphere by volume is. This gas comprises 78% of the Earth atmosphere by volume.
 The most abundant gas in the atmosphere by volume is. This gas comprises 78% of the Earth atmosphere by volume. A. Oxygen B. Water Vapor C. Carbon Dioxide D. Nitrogen An isobar is a line of constant. A.
Extremes Seminar: Tornadoes
 Dec. 01, 2014 Outline Introduction 1 Introduction 2 3 4 Introduction 101: What is a tornado? According to the Glossary of Meteorology (AMS 2000), a tornado is a violently rotating column of air, pendant
Boundary layer equilibrium [2005] over tropical oceans
![Boundary layer equilibrium [2005] over tropical oceans](/thumbs/96/128963638.jpg "Boundary layer equilibrium [2005] over tropical oceans") Boundary layer equilibrium [2005] over tropical oceans Alan K. Betts [akbetts@aol.com] Based on: Betts, A.K., 1997: Trade Cumulus: Observations and Modeling. Chapter 4 (pp 99-126) in The Physics and Parameterization
Boundary layer equilibrium [2005] over tropical oceans Alan K. Betts [akbetts@aol.com] Based on: Betts, A.K., 1997: Trade Cumulus: Observations and Modeling. Chapter 4 (pp 99-126) in The Physics and Parameterization
A COMPARISON OF THE MM5 AND THE RAMS SIMULATIONS FOR LAND-ATMOSPHERE INTERACTIONS UNDER VARYING SOIL MOISTURE. (Submitted to: Tellus A)
") A COMPARISON OF THE MM5 AND THE RAMS SIMULATIONS FOR LAND-ATMOSPHERE INTERACTIONS UNDER VARYING SOIL MOISTURE (Submitted to: Tellus A) Astrid Suarez 1, Rezaul Mahmood*, and Arturo I. Quintanar 2 Meteorology
A COMPARISON OF THE MM5 AND THE RAMS SIMULATIONS FOR LAND-ATMOSPHERE INTERACTIONS UNDER VARYING SOIL MOISTURE (Submitted to: Tellus A) Astrid Suarez 1, Rezaul Mahmood*, and Arturo I. Quintanar 2 Meteorology
An ENSO-Neutral Winter
 An ENSO-Neutral Winter This issue of the Blue Water Outlook newsletter is devoted towards my thoughts on the long range outlook for winter. You will see that I take a comprehensive approach to this outlook
Where does precipitation water come from?
 Chapter II Climate and Meteorology Where does precipitation water come from? Introduction The source of water vapor existing over Mongolia has been considered to consist of evapotranspiration at several
National Weather Service-Pennsylvania State University Weather Events
 National Weather Service-Pennsylvania State University Weather Events Historic Ohio Valley January Severe weather and Tornado Event by Richard H. Grumm National Weather Service State College PA 16803 and
Science Olympiad Meteorology Quiz #2 Page 1 of 8
 1) The prevailing general direction of the jet stream is from west to east in the northern hemisphere: 2) Advection is the vertical movement of an air mass from one location to another: 3) Thunderstorms
4.4 EVALUATION OF AN IMPROVED CONVECTION TRIGGERING MECHANISM IN THE NCAR COMMUNITY ATMOSPHERE MODEL CAM2 UNDER CAPT FRAMEWORK
 . EVALUATION OF AN IMPROVED CONVECTION TRIGGERING MECHANISM IN THE NCAR COMMUNITY ATMOSPHERE MODEL CAM UNDER CAPT FRAMEWORK Shaocheng Xie, James S. Boyle, Richard T. Cederwall, and Gerald L. Potter Atmospheric
Investigating the Impact of Land-PBL Coupling on the Water and Energy Cycle in NASA Model and Observation Products
 Investigating the Impact of Land-PBL Coupling on the Water and Energy Cycle in NASA Model and Observation Products PI: Joseph A. Santanello, Jr. Hydrological Sciences Laboratory NASA-GSFC, Greenbelt, MD
THE IMPACT OF GROUND-BASED GPS SLANT-PATH WET DELAY MEASUREMENTS ON SHORT-RANGE PREDICTION OF A PREFRONTAL SQUALL LINE
 JP1.17 THE IMPACT OF GROUND-BASED GPS SLANT-PATH WET DELAY MEASUREMENTS ON SHORT-RANGE PREDICTION OF A PREFRONTAL SQUALL LINE So-Young Ha *1,, Ying-Hwa Kuo 1, Gyu-Ho Lim 1 National Center for Atmospheric
A SATELLITE LAND DATA ASSIMILATION SYTEM COUPLED WITH A MESOSCALE MODEL: TOWARDS IMPROVING NUMERICAL WEATHER PREDICTION
 A SATELLITE LAND DATA ASSIMILATION SYTEM COUPLED WITH A MESOSCALE MODEL: TOWARDS IMPROVING NUMERICAL WEATHER PREDICTION Mohamed Rasmy*, Toshio Koike*, Souhail Bousseta**, Xin Li*** Dept. of Civil Engineering,
Using Temperature and Dew Point to Aid Forecasting Springtime Radiational Frost and/or Freezing Temperatures in the NWS La Crosse Service Area
 Using Temperature and Dew Point to Aid Forecasting Springtime Radiational Frost and/or Freezing Temperatures in the NWS La Crosse Service Area WFO La Crosse Climatology Series #21 The formation of radiational
Aviation Hazards: Thunderstorms and Deep Convection
 Aviation Hazards: Thunderstorms and Deep Convection TREND Empirical thunderstorm forecasting techniques Contents Necessary conditions for convection: Instability Low-level moisture Trigger mechanism Forecasting
For the operational forecaster one important precondition for the diagnosis and prediction of
 Initiation of Deep Moist Convection at WV-Boundaries Vienna, Austria For the operational forecaster one important precondition for the diagnosis and prediction of convective activity is the availability
Regional dry-season climate changes due to three decades of Amazonian deforestation
 In the format provided by the authors and unedited. SUPPLEMENTARY INFORMATION DOI:./NCLIMATE Regional dry-season climate changes due to three decades of Amazonian deforestation Jaya problemkhanna by using
Did we see the 2011 summer heat wave coming?
 GEOPHYSICAL RESEARCH LETTERS, VOL. 39,, doi:10.1029/2012gl051383, 2012 Did we see the 2011 summer heat wave coming? Lifeng Luo 1 and Yan Zhang 2 Received 16 February 2012; revised 15 March 2012; accepted
Performance of TANC (Taiwan Auto- Nowcaster) for 2014 Warm-Season Afternoon Thunderstorm
 for 2014 Warm-Season Afternoon Thunderstorm") Performance of TANC (Taiwan Auto- Nowcaster) for 2014 Warm-Season Afternoon Thunderstorm Wei-Peng Huang, Hui-Ling Chang, Yu-Shuang Tang, Chia-Jung Wu, Chia-Rong Chen Meteorological Satellite Center, Central
Performance of TANC (Taiwan Auto- Nowcaster) for 2014 Warm-Season Afternoon Thunderstorm Wei-Peng Huang, Hui-Ling Chang, Yu-Shuang Tang, Chia-Jung Wu, Chia-Rong Chen Meteorological Satellite Center, Central
ATS 351, Spring 2010 Lab #9 Weather Radar - 55 points
 ATS 351, Spring 2010 Lab #9 Weather Radar - 55 points 1. (5 points) If a radar has a maximum unambiguous range of 300km, what is its PRF? (The speed of light, c, is equal to 3x10 8 m/s) 2. (5 points) Explain
CHAPTER 2 - ATMOSPHERIC CIRCULATION & AIR/SEA INTERACTION
 Chapter 2 - pg. 1 CHAPTER 2 - ATMOSPHERIC CIRCULATION & AIR/SEA INTERACTION The atmosphere is driven by the variations of solar heating with latitude. The heat is transferred to the air by direct absorption
Appalachian Lee Troughs and their Association with Severe Thunderstorms
 Appalachian Lee Troughs and their Association with Severe Thunderstorms Daniel B. Thompson, Lance F. Bosart and Daniel Keyser Department of Atmospheric and Environmental Sciences University at Albany/SUNY,
The Relationship Between Cloud And Rain Cells And The Role Of The Environment In Convective Processes During CHUVA-GoAmazon2014/5
 The Relationship Between Cloud And Rain Cells And The Role Of The Environment In Convective Processes During CHUVA-GoAmazon2014/5 Cristiano W. Eichholz 1, Courtney Schumacher 2, Luiz A. T. Machado 1 1.
A Study of Convective Initiation Failure on 22 Oct 2004
 A Study of Convective Initiation Failure on 22 Oct 2004 Jennifer M. Laflin Philip N. Schumacher NWS Sioux Falls, SD August 6 th, 2011 Introduction Forecasting challenge: strong forcing for ascent and large
Anthony A. Rockwood Robert A. Maddox
 Anthony A. Rockwood Robert A. Maddox An unusually intense MCS produced large hail and wind damage in northeast Kansas and northern Missouri during the predawn hours of June 7 th, 1982. Takes a look at
Why rainfall may reduce when the ocean warms
 Why rainfall may reduce when the ocean warms Tim Hewson*, Ian Boutle** and Benedetta Dini** *ECMWF, Reading, UK **Met Office, Exeter, UK Work mainly undertaken at the Met Office Slide 1 Contents Introduction
J1.7 SOIL MOISTURE ATMOSPHERE INTERACTIONS DURING THE 2003 EUROPEAN SUMMER HEATWAVE
 J1.7 SOIL MOISTURE ATMOSPHERE INTERACTIONS DURING THE 2003 EUROPEAN SUMMER HEATWAVE E Fischer* (1), SI Seneviratne (1), D Lüthi (1), PL Vidale (2), and C Schär (1) 1 Institute for Atmospheric and Climate
Sensitivity of Convective Indices to Humidity Adjustments
 Sensitivity of Convective Indices to Humidity Adjustments M. E. Splitt University of Utah Salt Lake City, Utah R. A. Peppler Cooperative Institute for Mesoscale Meteorological Studies University of Oklahoma
Page 1. Name:
 Name: 1) As the difference between the dewpoint temperature and the air temperature decreases, the probability of precipitation increases remains the same decreases 2) Which statement best explains why
Investigation of the Arizona Severe Weather Event of August 8 th, 1997
 Investigation of the Arizona Severe Weather Event of August 8 th, 1997 Tim Hollfelder May 10 th, 2006 Abstract Synoptic scale forcings were very weak for these thunderstorms on August 7-8, 1997 over the
Crux of AGW s Flawed Science (Wrong water-vapor feedback and missing ocean influence)
") 1 Crux of AGW s Flawed Science (Wrong water-vapor feedback and missing ocean influence) William M. Gray Professor Emeritus Colorado State University There are many flaws in the global climate models. But
1 Crux of AGW s Flawed Science (Wrong water-vapor feedback and missing ocean influence) William M. Gray Professor Emeritus Colorado State University There are many flaws in the global climate models. But
Weather report 28 November 2017 Campinas/SP
 Weather report 28 November 2017 Campinas/SP Summary: 1) Synoptic analysis and pre-convective environment 2) Verification 1) Synoptic analysis and pre-convective environment: At 1200 UTC 28 November 2017
5. General Circulation Models
 5. General Circulation Models I. 3-D Climate Models (General Circulation Models) To include the full three-dimensional aspect of climate, including the calculation of the dynamical transports, requires
Impacts of the April 2013 Mean trough over central North America
 Impacts of the April 2013 Mean trough over central North America By Richard H. Grumm National Weather Service State College, PA Abstract: The mean 500 hpa flow over North America featured a trough over
PRMS WHITE PAPER 2014 NORTH ATLANTIC HURRICANE SEASON OUTLOOK. June RMS Event Response
 PRMS WHITE PAPER 2014 NORTH ATLANTIC HURRICANE SEASON OUTLOOK June 2014 - RMS Event Response 2014 SEASON OUTLOOK The 2013 North Atlantic hurricane season saw the fewest hurricanes in the Atlantic Basin
Transient and Eddy. Transient/Eddy Flux. Flux Components. Lecture 3: Weather/Disturbance. Transient: deviations from time mean Time Mean
 Lecture 3: Weather/Disturbance Transients and Eddies Climate Roles Mid-Latitude Cyclones Tropical Hurricanes Mid-Ocean Eddies Transient and Eddy Transient: deviations from time mean Time Mean Eddy: deviations
P1.34 MULTISEASONALVALIDATION OF GOES-BASED INSOLATION ESTIMATES. Jason A. Otkin*, Martha C. Anderson*, and John R. Mecikalski #
 P1.34 MULTISEASONALVALIDATION OF GOES-BASED INSOLATION ESTIMATES Jason A. Otkin*, Martha C. Anderson*, and John R. Mecikalski # *Cooperative Institute for Meteorological Satellite Studies, University of
Cuba. General Climate. Recent Climate Trends. UNDP Climate Change Country Profiles. Temperature. C. McSweeney 1, M. New 1,2 and G.
 UNDP Climate Change Country Profiles Cuba C. McSweeney 1, M. New 1,2 and G. Lizcano 1 1. School of Geography and Environment, University of Oxford. 2. Tyndall Centre for Climate Change Research http://country-profiles.geog.ox.ac.uk
A Large-Eddy Simulation Study of Moist Convection Initiation over Heterogeneous Surface Fluxes
 A Large-Eddy Simulation Study of Moist Convection Initiation over Heterogeneous Surface Fluxes Song-Lak Kang Atmospheric Science Group, Texas Tech Univ. & George H. Bryan MMM, NCAR 20 th Symposium on Boundary
P0.98 Composite Analysis of Heavy-Rain-Producing Elevated Thunderstorms in the MO-KS-OK region of the United States
 P0.98 Composite Analysis of Heavy-Rain-Producing Elevated Thunderstorms in the MO-KS-OK region of the United States Laurel P. McCoy and Patrick S. Market Department of Soil, Environmental, and Atmospheric
Solutions to Comprehensive Final Examination Given on Thursday, 13 December 2001
 Name & Signature Dr. Droegemeier Student ID Meteorology 1004 Introduction to Meteorology Fall, 2001 Solutions to Comprehensive Final Examination Given on Thursday, 13 December 2001 BEFORE YOU BEGIN!! Please
Developments at DWD: Integrated water vapour (IWV) from ground-based GPS
 from ground-based GPS") 1 Working Group on Data Assimilation 2 Developments at DWD: Integrated water vapour (IWV) from ground-based Christoph Schraff, Maria Tomassini, and Klaus Stephan Deutscher Wetterdienst, Frankfurter Strasse
1 Working Group on Data Assimilation 2 Developments at DWD: Integrated water vapour (IWV) from ground-based Christoph Schraff, Maria Tomassini, and Klaus Stephan Deutscher Wetterdienst, Frankfurter Strasse
p = ρrt p = ρr d = T( q v ) dp dz = ρg
 dp dz = ρg") Chapter 1: Properties of the Atmosphere What are the major chemical components of the atmosphere? Atmospheric Layers and their major characteristics: Troposphere, Stratosphere Mesosphere, Thermosphere
Chapter 1: Properties of the Atmosphere What are the major chemical components of the atmosphere? Atmospheric Layers and their major characteristics: Troposphere, Stratosphere Mesosphere, Thermosphere
Final Report. We will discuss the project accomplishments in two sub sections, reflecting the two major efforts given in Section 1.
 Final Report to Cooperative Program for Operational Meteorology, Education and Training (COMET) University: University of Illinois in Urbana Champaign Name of University Researcher Preparing Report: David
Sensitivity of Tropical Tropospheric Temperature to Sea Surface Temperature Forcing
 Sensitivity of Tropical Tropospheric Temperature to Sea Surface Temperature Forcing Hui Su, J. David Neelin and Joyce E. Meyerson Introduction During El Niño, there are substantial tropospheric temperature
Supplementary Figure 1. Summer mesoscale convective systems rainfall climatology and trends. Mesoscale convective system (MCS) (a) mean total
 (a) mean total") Supplementary Figure 1. Summer mesoscale convective systems rainfall climatology and trends. Mesoscale convective system (MCS) (a) mean total rainfall and (b) total rainfall trend from 1979-2014. Total
Supplementary Figure 1. Summer mesoscale convective systems rainfall climatology and trends. Mesoscale convective system (MCS) (a) mean total rainfall and (b) total rainfall trend from 1979-2014. Total
Francina Dominguez*, Praveen Kumar Department of Civil and Environmental Engineering University of Illinois at Urbana-Champaign
 P1.8 MODES OF INTER-ANNUAL VARIABILITY OF ATMOSPHERIC MOISTURE FLUX TRANSPORT Francina Dominguez*, Praveen Kumar Department of Civil and Environmental Engineering University of Illinois at Urbana-Champaign
Impact of vegetation cover estimates on regional climate forecasts
 Impact of vegetation cover estimates on regional climate forecasts Phillip Stauffer*, William Capehart*, Christopher Wright**, Geoffery Henebry** *Institute of Atmospheric Sciences, South Dakota School
Hail and the Climate System: Large Scale Environment Relationships for the Continental United States
 Hail and the Climate System: Large Scale Environment Relationships for the Continental United States 1979-2012 John T. Allen jallen@iri.columbia.edu Co-author: Michael K. Tippett WWOSC 2014, Thursday August
Illinois State Water Survey at the University of Illinois Urbana, Illinois
 Illinois State Water Survey at the University of Illinois Urbana, Illinois ASSESSMENT OF WEATHER MODIFICATION IN ALLEVIATING AGRICULTURAL WATER SHORTAGES DURING DROUGHTS by F. A. Huff and J. L. Vogel Principal
1. Header Land-Atmosphere Predictability Using a Multi-Model Strategy Paul A. Dirmeyer (PI) Zhichang Guo (Co-I) Final Report
 Zhichang Guo (Co-I) Final Report") 1. Header Land-Atmosphere Predictability Using a Multi-Model Strategy Paul A. Dirmeyer (PI) Zhichang Guo (Co-I) Final Report 2. Results and Accomplishments Output from multiple land surface schemes (LSS)
1. Header Land-Atmosphere Predictability Using a Multi-Model Strategy Paul A. Dirmeyer (PI) Zhichang Guo (Co-I) Final Report 2. Results and Accomplishments Output from multiple land surface schemes (LSS)
A CLIMATE MODEL INVESTIGATION OF LOWER ATMOSPHERIC WIND SPEED BIASES OVER WIND FARM DEVELOPMENT REGIONS OF THE CONTINENTAL UNITED STATES
 A CLIMATE MODEL INVESTIGATION OF LOWER ATMOSPHERIC WIND SPEED BIASES OVER WIND FARM DEVELOPMENT REGIONS OF THE CONTINENTAL UNITED STATES 5.2 J. Craig Collier* Garrad Hassan Amercia, Inc. San Diego, CA
2015: A YEAR IN REVIEW F.S. ANSLOW
 2015: A YEAR IN REVIEW F.S. ANSLOW 1 INTRODUCTION Recently, three of the major centres for global climate monitoring determined with high confidence that 2015 was the warmest year on record, globally.
Can the Convective Temperature from the 12UTC Sounding be a Good Predictor for the Maximum Temperature, During the Summer Months?
 Meteorology Senior Theses Undergraduate Theses and Capstone Projects 12-1-2017 Can the Convective Temperature from the 12UTC Sounding be a Good Predictor for the Maximum Temperature, During the Summer
DEPARTMENT OF EARTH & CLIMATE SCIENCES Name SAN FRANCISCO STATE UNIVERSITY Nov 29, ERTH 360 Test #2 200 pts
 DEPARTMENT OF EARTH & CLIMATE SCIENCES Name SAN FRANCISCO STATE UNIVERSITY Nov 29, 2018 ERTH 360 Test #2 200 pts Each question is worth 4 points. Indicate your BEST CHOICE for each question on the Scantron
Christopher L. Castro Department of Atmospheric Sciences University of Arizona
 Spatiotemporal Variability and Covariability of Temperature, Precipitation, Soil Moisture, and Vegetation in North America for Regional Climate Model Applications Christopher L. Castro Department of Atmospheric
ATS 351, Spring 2010 Lab #9 Weather Radar - 55 points
 ATS 351, Spring 2010 Lab #9 Weather Radar - 55 points 1. (5 points) If a radar has a maximum unambiguous range of 300km, what is its PRF? (The speed of light, c, is equal to 3x10 8 m/s) The equation to
ESCI 344 Tropical Meteorology Lesson 11 Tropical Cyclones: Formation, Maintenance, and Intensification
 ESCI 344 Tropical Meteorology Lesson 11 Tropical Cyclones: Formation, Maintenance, and Intensification References: A Global View of Tropical Cyclones, Elsberry (ed.) Global Perspectives on Tropical Cylones:
The Texas drought. Kingtse Mo Climate Prediction Center NWS/NCEP/NOAA
 The 2011-2012 Texas drought Kingtse Mo Climate Prediction Center NWS/NCEP/NOAA 1 outline Evolution of the 2011-2012 Texas drought Climatology and historical perspective The 2011 drought Onset Feedback
Severe Weather with a strong cold front: 2-3 April 2006 By Richard H. Grumm National Weather Service Office State College, PA 16803
 Severe Weather with a strong cold front: 2-3 April 2006 By Richard H. Grumm National Weather Service Office State College, PA 16803 1. INTRODUCTION A strong cold front brought severe weather to much of
Land Surface Processes and Their Impact in Weather Forecasting
 Land Surface Processes and Their Impact in Weather Forecasting Andrea Hahmann NCAR/RAL with thanks to P. Dirmeyer (COLA) and R. Koster (NASA/GSFC) Forecasters Conference Summer 2005 Andrea Hahmann ATEC
The relative impact of local connections vs distant teleconnections on a regions climate (or on hydrologic predictability) Jason Evans
 Jason Evans") The relative impact of local connections vs distant teleconnections on a regions climate (or on hydrologic predictability) Jason Evans Outline What do we need for hydrologic predictability Large scale
The relative impact of local connections vs distant teleconnections on a regions climate (or on hydrologic predictability) Jason Evans Outline What do we need for hydrologic predictability Large scale