SOIL MOISTURE IMPACTS ON CONVECTIVE PRECIPITATION IN OKLAHOMA. A Dissertation TRENTON W. FORD
|
|
|
- Jonathan Reynolds
- 5 years ago
- Views:
Transcription
1 SOIL MOISTURE IMPACTS ON CONVECTIVE PRECIPITATION IN OKLAHOMA A Dissertation by TRENTON W. FORD Submitted to the Office of Graduate and Professional Studies of Texas A&M University in partial fulfillment of the requirements for the degree of DOCTOR OF PHILOSOPHY Chair of Committee, Committee Members, Head of Department, Steven M. Quiring Oliver W. Frauenfeld Anita D. Rapp Charles W. Lafon David M. Cairns August 2015 Major Subject: Geography Copyright 2015 Trenton W. Ford
2 ABSTRACT Soil moisture is vital to the climate system, as root zone soil moisture has a significant influence on evapotranspiration rates and latent and sensible heat exchange. Through the modification of moisture flux from the land surface to the atmosphere, soil moisture can impact regional temperature and precipitation. Despite a wealth of studies examining land-atmosphere interactions, model and observation-driven studies show conflicting results with regard to the sign and strength of soil moisture feedback to precipitation, particularly in the Southern Great Plains of the United States. This research provides observational evidence for a preferential dry (or negative) soil moisture feedback to precipitation in Oklahoma. The ability of soil moisture to impact the location and occurrence of afternoon convective precipitation is constrained by synoptic-scale atmospheric circulation and resulting mid- and low-level wind patterns and sensible and latent heat flux. Overall, the preference for precipitation initiation over dry soils is enhanced when regional soil moisture gradients exhibit a weakened east to west, wet to dry pattern. Based on these results, we conclude that soil moisture can modify atmospheric conditions potentially leading to convective initiation. However, the land surface feedback signal is weak at best, suggesting that regional-scale circulation is the dominant driver of warm season precipitation in the Southern Great Plains. ii
3 DEDICATION This dissertation document and all of the work and preparation that went into the research is dedicated to my beautiful, enormously supportive wife Molly. Her love and support was invaluable to my work and happiness throughout my graduate student tenure at Texas A&M. iii
4 ACKNOWLEDGEMENTS I would like to thank my committee chair, Dr. Quiring, and my committee members, Dr. Frauenfeld, Dr. Rapp, and Dr. Lafon, for their guidance and support throughout the course of this research. Thanks also to my friends and colleagues in the Geography Department and specifically the Climate Science Lab at Texas A&M University. I also want to extend my gratitude to the National Science Foundation for providing financial support for this dissertation research. Finally and most importantly, thanks to my family for their constant support. Particular thanks to my mother and father for encouraging me to do what I love and succeed at it. Also thanks to my grandmother who s insistence in playing The Game of the States instilled in me a lifelong curiosity in Geography. iv
5 NOMENCLATURE CAPE CIN CTP DDR DM DP DT GCM HI HYSPLIT LCL LFC LLJ LST MM MP MT NARR NEXRAD PBL Convective Available Potential Energy Convective Inhibition Convective Triggering Potential Directional Difference Ratio Dry Moderate Dry Polar Dry Tropical General Circulation Model Low-level Humidity Index Hybrid Single-Particle Lagrangian Trajectory Model Lifting Condensation Level Level of Free Convection Great Plains Low Level Jet Local Standard Time Moist Moderate Moist Polar Moist Tropical North American Regional Reanalysis National Weather Service Next-Generation Radar Network Planetary Boundary Layer v
6 RMSE SDDI SOM Warm season Weather types Root Mean Square Error Standardized Directional Difference Index Self-organizing Maps May September Spatial Synoptic Classification Weather Types vi
7 TABLE OF CONTENTS Page ABSTRACT...ii DEDICATION... iii ACKNOWLEDGEMENTS... iv NOMENCLATURE... v TABLE OF CONTENTS...vii LIST OF FIGURES... x LIST OF TABLES... xv CHAPTER I INTRODUCTION Background Soil Moisture Precipitation Coupling Complications of Soil Moisture Precipitation Coupling Study Area Oklahoma Climate Oklahoma Mesonet Soil Moisture... 8 CHAPTER II DOES AFTERNOON PRECIPITATION OCCUR PREFERENTIALLY OVER DRY OR WET SOILS IN OKLAHOMA? Introduction Background Data and Methods Soil Moisture Precipitation Event Identification Synoptic Environment Atmospheric Conditions Results Synoptic Classes Soil Moisture Magnitude Temperature and Humidity Anomalies Convective Environment Summary and Conclusion Soil Moisture Feedback Context vii
8 2.4.2 Synoptic Classification Limitations Conclusions CHAPTER III SOIL MOISTURE PRECIPITATION COUPLING: OBSERVATIONS AND UNDERLYING PHYSICAL MECHANISMS Introduction Background Soil Moisture Precipitation Coupling in the U.S. Southern Great Plains Data and Methods Soil Moisture Data Precipitation Event Identification Atmospheric Conditions Results Dry or Wet Soil Preference Convective Event Spatial Variability Convective Event Temporal Variability Atmospheric Pre-Conditioning to Convection Physical Connections between Soil Moisture and Atmospheric Conditions Summary Discussion Conclusion CHAPTER IV SYNOPTIC CONDITIONS RELATED TO LAND - ATMOSPHERE INTERACTIONS AND UNORGANIZED CONVECTION Introduction Scales of Soil Moisture Precipitation Feedback Role of the Synoptic Environment Data and Methods Soil Moisture Precipitation Events North American Regional Reanalysis Self-Organizing Maps Spatial Synoptic Classification HYSPLIT Results SOM Patterns Patterns Not Associated With Convection Patterns Associated With Convection Summary and Conclusions viii
9 CHAPTER V SOIL MOISTURE PATTERNS AND GRADIENTS RELATED TO UNORGANIZED CONVECTION Introduction Land-Surface Heterogeneity and Atmospheric Modification Previous Studies Data and Methods Soil Moisture and Precipitation Events Soil Moisture Directional Differences Logistic Regression and the Probability of Convection Results Soil Moisture Directional Differences Probability of Convection Discussion and Conclusions Discussion Conclusions CHAPTER VI CONCLUSIONS Soil Moisture Precipitation Coupling Dry or Wet Soil Preferences Soil Moisture Precipitation Coupling and Atmospheric Modification Soil Moisture Precipitation Coupling and the Synoptic-Scale Environment Soil Moisture Precipitation Coupling and Soil Moisture Gradients The State of Soil Moisture Precipitation Coupling and Future Work REFERENCES APPENDIX A FIGURES ix
10 LIST OF FIGURES x Page Figure 1.1. Schematics of atmospheric modification by soil moisture leading to convective initiation. The left panel shows initiation through wet soils processes, while the right panel shows mechanisms of dry soil processes Figure 1.2. Spatial distributions of (a) annual average precipitation (mm) and (b) annual average temperature ( C). The black circles are Oklahoma Mesonet states. Precipitation and temperature data are taken from PRISM..6 Figure 1.3. Average soil moisture (% VWC) conditions between May and September at 125 stations in Oklahoma. Soil moisture from the 5 cm sensor is displayed here Figure 1.4. Average soil moisture conditions during May, June, July, August, and September. Soil moisture from the 5 cm sensor, represented as percent volumetric water content, is displayed...9 Figure 2.1. Map of precipitation events occurring in each grid cell of the study region. Grid cells are color coded based on the number of events in each cell. All events are taken from May - September, 2003 through Figure 2.2. Mean monthly distribution of precipitation events during the study period ( ). Each bar represents the total number occurring in each month. Distributions are delineated by the synoptic class...22 Figure 2.3. Distributions of 5 cm soil moisture percentiles for all (a) SP-LLJ events, (b) SB-LLJ events, (c) SP-noLLJ events, and (d) SB-noLLJ events Figure 2.4. Frequency of SP-LLJ (7a), SB-LLJ (7b), SP-noLLJ (7c), and SB-noLLJ (7d) events grouped into soil moisture percentile bins of 10. Near-surface humidity (q, blue line) and temperature (T, red line) z-scores are averaged for each percentile bin and plotted in each panel Figure 2.5. Scatter plots of humidity (q) and temperature (T) anomalies. Each point represents one event that is separated into dry soil events (red circles) and wet soils events (blue squares), and is scaled based on the corresponding CAPE anomaly (J kg-1). The gray-dashed lines are used to separate q and T into quadrants. The top plot shows anomalies for SP-LLJ events and the bottom plot shows anomalies for SB-noLLJ events.. 29 Figure 3.1. A schematic of the decision tree that was used for manual
11 identification of unorganized convective events Figure 3.2. Location of 477 convective events (black circles) identified between May and September, These are overlayed on the primary land cover, taken from the National Land Cover Dataset ( Figure 3.3. Percent monthly precipitation contributed by the 477 unorganized convective events over the study region. The percentages are separated by month and year...44 Figure 3.4. Distribution of 5 cm soil moisture percentiles underlying convective events identified. The dashed-black line represents the divide between relatively wet and relatively dry soils...46 Figure 3.5. Cumulative distribution function of nearest neighbor distances for all unorganized convective events (blue line), the bootstrapped median (red line) and 95% confidence intervals (black lines). The bootstrapped samples are calculated from 1,000 iterations of 477 random events Figure 3.6. Composites of morning (0600 LST) convective available potential energy from (a) events clustered in southeast corner of the study region and (b) all other convective events Figure 3.7. Top panel (a) shows the frequency of dry and wet events during each warm season between 2002 and The bottom panel (b) shows the monthly variability of all events, color-coded into dry and wet categories. 54 Figure 3.8. Frequency of all unorganized convective events in each morning during the study period. 55 Figure 3.9. Frequency of unorganized convective events in each morning during the study period. The top panel shows wet events and the bottom panel shows dry events Figure Scatter plots of 19 unorganized convective events that occurred near Lamont, OK in dual convective triggering potential (J kg -1 ) humidity index ( C) space: (a) wet events are denoted by the blue circle and dry events are denoted by a red triangle. (b) Events are grouped into 4 clusters. 59 Figure Soil moisture percentiles and atmospheric conditions from 19 unorganized convective events occurring near Lamont, OK. The plots xi
12 show soil moisture percentiles with (a) changes in LFC height (mb), and (b) changes in PBL height Figure Soil moisture percentiles and atmospheric conditions from 19 unorganized convective events occurring near Lamont, OK. The plots show soil moisture percentiles with (a) changes in surface air temperature ( C) and (b) 0600 LST convective temperature Figure Plots are similar as those in Figure 3.10, only (a) shows soil moisture percentiles and changes in CAPE, while (b) shows soil moisture and changes in CIN...66 Figure Scatter plots between the change in planetary boundary layer height between 0600 and 1200 LST and (a) average event size, and (b) total event precipitation...67 Figure Scatter plots between 0600 LST convective available potential energy and (a) convective event time duration and (b) total event precipitation Figure 4.1. Example HYSPLIT air mass back trajectories run (a) as a 1 1 matrix over the study region, and (b) from an individual event. All trajectories are initiated at 1200 LST from 850 hpa and run 48 hours back in time Figure 4.2. Mean 500 hpa geopotential height (m) composites associated with each of 12 self-organizing map (SOM) patterns...87 Figure 4.3. Percent (May - September) precipitation contribution from each SOM pattern, calculated for each year between 2002 and The blue line represents the 11-year mean contribution (%), while the black intervals extend from the minimum to the maximum contribution Figure 4.4. Frequency distributions of SOM patterns based on 10,000 iterations of randomly chosen sets of 477 days. The black line represents the observed frequency of each pattern for the 477 convective events. Patterns which occur at a statistically significantly (95% confidence level) different rate are denoted by an asterisk Figure 4.5. Percent of convective events that occur over dry (red) and wet (blue) soils, reported for each SOM pattern. Patterns that exhibit a statistically significant differences (95% significance level) in the xii
13 frequency of occurrence between wet and dry soils are denoted with a star Figure 4.6. Trajectory roses displaying the direction of origin of HYSPLIT back trajectories for (a, b) all days and (c, d) convective event days for patterns (left) 5 and (right) Figure 4.7. Composites of integrated moisture flux during patterns 5 and 6 (a) southerly flow days and (b) northerly flow days. Panels (c) and (d) shows composites of precipitable water on the same days Figure 4.8. Convective available potential energy at 1200 LST from pattern 5 and 6 days with predominantly (a) northern 850 hpa flow and (b) southerly 850 hpa flow Figure 4.9. Daily average (a, c) vapor pressure deficit anomalies and (b, d) maximum temperature anomalies from all pattern (a, b) 5 and 6 events over dry soils and (c, d) 7 and 8 over dry soils Figure Same as Figure 4.6, showing HYSPLIT back trajectory direction for (a) all pattern 3,2 days and (b) pattern 3,2 convective event days Figure Panels show daily (a) total solar radiation anomalies (direct + diffuse, MJ m -2 ), (b) vapor pressure deficit anomalies (mb), and (c) maximum temperature anomalies ( F) during pattern 7 dry soil event days Figure Soil moisture percentiles the morning of dry soil events during pattern 7, pattern 8, and pattern 12 conditions Figure 5.1. Boxplots of SDDI from each directional difference over (a) all events, (b) dry soil events, and (c) wet soil events. The black, dashed line represents the 0 value, by which the median of each group is tested..118 Figure 5.2. Daily SDDI values calculated from (x-axes) 5 cm soil moisture (y-axes) 25 cm soil moisture. The black line represents the 1-to-1 fit, while the dashed line represents the least squares fit Figure 5.3. Boxplots of DDR from each directional difference over dry soil events. The black, dashed line represents the 0 value, by which the median of each group is test..120 xiii
14 Figure 5.4. Probability of convection as a function of soil moisture gradients in the (blue line) east-west and (black line) northeast-southwest directions for all events Figure 5.5. Probability of convection as a function of soil moisture gradients in the east-west direction for all events over drier than normal soils Figure 5.6. Daily soil moisture gradients (cm 3 cm -3 ) versus daily maximum temperature gradients ( F) in the (a) north - south, (b) east - west, (c) northeast - southwest, and (d) northwest - southeast directions. The regression equation for each plot is shown and denoted by an asterisk if significant at the 95% confidence level xiv
15 LIST OF TABLES Page Table 2.1. Number of afternoon precipitation events in each synoptic environmental class and the percentage of overall total precipitation events in each class Table 2.2. Probabilities (p-value) of events over wet and dry soils occurring by chance. P-values are generated by comparing frequency of events occurring over wet/dry soils to distributions of wet and dry day frequencies from a resampling boot-strapping procedure. P-values are reported by synoptic class.. 24 Table 3.1. Mean atmospheric conditions at 0600 and 1200 LST from atmospheric soundings, averaged by event cluster. Conditions summarized include convective available potential energy (J kg -1 ), convective inhibition (J kg -1 ), the level of free convection (mb), convective temperature ( C), and planetary boundary layer height (m)..61 Table 4.1. Correlations between NARR and sounding-observatinos of CAPE, CIN, and surface temperature at 0600 and 1200 LST, as well as the LST change...81 Table 5.1. Probability of convection separated by soil moisture directional difference decile for all four directions. All convective events were used when calculating probabilities xv
16 CHAPTER I INTRODUCTION 1.1. Background Soil Moisture Precipitation Coupling Land-atmosphere interactions are an important component of the climate system, and are linked to temperature and precipitation anomalies in many regions of the world (Entekhabi et al. 1992; Betts et al. 1996). Land surface moisture anomalies can help enhance or inhibit the occurrence and persistence of drought and heat waves (Schubert et al. 2004; Fischer et al. 2007; Ford and Quiring, 2014c). One component of landatmosphere interactions that has received increased attention over the last decade is soil moisture precipitation coupling, or the impact of soil moisture on the occurrence and location of subsequent precipitation. Soil moisture anomalies primarily influence moisture and energy flux to the atmosphere through partitioning of latent and sensible heating (Basara and Crawford, 2002; Alfieri et al. 2008). Anomalously wet soils contain moisture sufficient for preferential latent heating and high evapotranspiration rates, which correspond with increased humidity and decreased air temperature near the surface (Brimelow et al. 2011). These atmospheric modifications lead to decreased lifting condensation level (LCL) and level of free convection (LFC) heights, along with typically increased convective available potential energy (CAPE). Decreased convective temperatures and increased potential energy improve the likelihood of convective initiation and the potential for precipitation. 1
17 In contrast, anomalously dry soils limit moisture flux to the atmosphere, leading to preferential sensible heating. Energy reaching the surface is therefore partitioned to heating the surrounding air mass, which decreases humidity and increases air temperature near the surface. These modifications increase LFC and LCL height and typically coincide with strong convective inhibition (CIN). However, higher morning convective temperatures can be reached through preferential heating of near-surface air. This combined with planetary boundary layer (PBL) growth that surpasses the LFC can lead to the initiation of deep convection and subsequent precipitation (Santanello et al. 2009). The processes through which anomalously wet and dry soils can impact the atmosphere leading to precipitation are depicted in Figure 1.1. Despite the importance of soil moisture precipitation coupling in many regions of the world (Seneviratne et al. 2010), general circulation models are unable to accurately simulate these processes (Taylor et al. 2012). This represents a major limitation of model precipitation simulation, and decreases the robustness of projected precipitation changes associated with future temperature increases (Taylor et al. 2012; Roundy et al. 2014). Concurrently, observation-based studies examining soil moisture influence on precipitation show conflicting results, with precipitation occurring preferentially over wet soils (Brimelow et al. 2011; Kang and Bryan, 2011) or dry soils (Taylor et al. 2011; 2012). Some of the factors contributing to both the inability of models to capture soil moisture precipitation coupling and the contrasting results of observation-based studies are discussed in the following section. 2
18 1.1.2 Complications of Soil Moisture Precipitation Coupling Several factors obscure the coupled relationship between soil moisture and convective precipitation. One issue is the different mechanisms by which soil moisture can modify the atmosphere. Taylor et al. (2012) found that convective precipitation fell preferentially over dry soils in the Sahel region of Africa. Their explanation was that anomalously dry soils increase sensible heat flux and surface heating, which destabilizes the atmospheric profile in the PBL and creates an area of local convergence, possibly leading to convection and precipitation over relatively dry soils. In contrast, Kang and Bryan (2011) found that greater cooling and moistening in the PBL over a relatively moist surface is consistent with earlier convective initiation than over relatively dry surfaces. Increased moisture flux into the atmosphere from evapotranspiration, when locally sourced by wet soils, increases instability and makes conditions more conducive to convection. Another issue with detecting soil moisture impacts on precipitation is the strong scale-dependency of the underlying coupled relationships (Jones and Brunsell, 2009). Soil moisture precipitation coupling is frequently evaluated at either a local-scale with high-density observations or boundary layer models over a short time period (Santanello et al. 2009; Phillips and Klein, 2014), or at continental-to-global scale by deriving generalized coupling metrics (Koster et al. 2004; Findell et al. 2011). However, studies have shown that meso-scale gradients in soil moisture can influence the location of convective precipitation (Fabry et al. 2006; Taylor et al. 2011). 3

19 Figure 1.1. Schematics of atmospheric modification by soil moisture leading to convective initiation. The left panel shows initiation through wet soils processes, while the right panel shows mechanisms of dry soil processes. 4
20 Additionally, variations in soil moisture precipitation coupling signal strength have been attributed to synoptic-scale atmospheric circulation (Carleton et al. 2008a; Frye and Mote, 2010a). This is to say that soil moisture precipitation coupling is far more complex than one metric or a wet/dry soil preference can infer. The purpose of this dissertation research is to quantify the impact of soil moisture on convective precipitation in Oklahoma, and to exhaustively evaluate the moderating roles of synoptic-scale circulation and meso-scale soil moisture gradients. The results of this study will help determine the strength and importance of soil moisture precipitation coupling in this region of the United States. Additionally, the coupled relationship between soil moisture and convective precipitation in Oklahoma will be framed in the context of prevailing atmospheric circulation features and land surface moisture gradients. Data used in this research encompasses May to October, The proposed research has three main objectives: (1) Determine if convective rainfall falls preferentially over dry or wet soils in Oklahoma, and document atmospheric modification by dry or wet soils (2) Evaluate synoptic-scale atmospheric conditions most and least frequently associated with unorganized convection in Oklahoma, and relate these patterns to soil moisture precipitation coupling (3) Quantify the impact of soil moisture gradients on convective precipitation initiation over Oklahoma. 5
 annual average")
. The black circles are Oklahoma Mesonet stations.")
21 Figure 1.2. Spatial distributions of (a) annual average precipitation (mm) and (b) annual average temperature ( C). The black circles are Oklahoma Mesonet stations. Precipitation and temperature data are taken from PRISM. 6
.")
22 1.2 Study Area Oklahoma Climate Oklahoma is located in the Southern Great Plains region of the United States, and experiences a sub-humid continental climate with cool winters and hot summers. The region experiences a significant west east precipitation gradient and north south temperature gradient (Figure 1.2). Vegetation and soil conditions exhibit great spatial variability across the state. The combination of precipitation and vegetation gradients with soil texture patterns leads to a west east, dry wet soil moisture pattern during much of the year (Figure 1.3). Figure 1.3. Average soil moisture (% VWC) conditions between May and September at 125 stations in Oklahoma. Soil moisture from the 5 cm sensor is displayed here. 7
23 Soil moisture is analyzed from May to September each year between 2002 and This period is selected as it is the peak season for convective activity in the Southern Great Plains, and it coincides with the dry-down period for soil moisture in Oklahoma (Illston et al. 2008). As Illston et al. (2008) describe, decreased precipitation during the late spring and early summer lead to a dry-down of soil that continues until the end of September. At this time, increased precipitation recharges the soil and is typically maintained throughout the cold season (Illston et al. 2008). Soil moisture patterns displayed in Figure 1.3 suggest a strong southwest northeast gradient throughout the warm season. However, when we separate the season into the five months, we see that this pattern is only apparent in May and September (Figure 1.4). The middle three months of the summer exhibit a decreased gradient, and generally dry soils throughout the state of Oklahoma. The strong seasonality of soil moisture magnitude and spatial patterns exemplifies the importance of standardizing volumetric water content observations over space and time to facilitate consistent comparisons Oklahoma Mesonet Soil Moisture Soil moisture observations from in situ sensors have rarely been used for landatmosphere diagnoses, primarily due to the lack of spatially extensive, lengthy soil moisture records (Seneviratne et al. 2010). When soil moisture precipitation coupling is characterized using in situ soil moisture, it is typically in the context of a local-scale, short time period case study such as those over the Atmospheric Radiation Monitoring station at Lamont, Oklahoma (Santanello et al. 2009; Phillips and Klein, 2014). 8

24 Figure 1.4. Average soil moisture conditions during May, June, July, August, and September. Soil moisture from the 5 cm sensor, represented as percent volumetric water content, is displayed. 9
25 To augment the lack of spatially extensive soil moisture observations, recent studies have employed soil moisture from satellite remote sensing platforms such as AMSR-E (Taylor et al. 2011, 2012) or the TRMM TMI sensor (Frye and Mote, 2010). Satellite-derived soil moisture is able to capture soil moisture conditions over sparse vegetation and limited topography; however, wet soils, dense vegetation, surface water bodies, and complex topography diminish the accuracy of remotely sensed soil moisture estimates. Soil moisture in this study is taken from the Oklahoma Mesonet ( Illston et al. 2008), which is a state-wide monitoring network of more than 100 stations. We use in situ volumetric water content (cm 3 cm -3 ) from 113 Oklahoma Mesonet stations (Figure 1.2). Volumetric water content of the soil is estimated using the thermal matric potential measured by Campbell 229-L heat dissipation sensors at 5, 25, and 60 cm. Physical soil moisture properties were recently updated at each Oklahoma Mesonet site, and soil moisture observations from the Campbell 229-L sensors were evaluated with gravimetric samples (Scott et al. 2013). Root mean square difference between direct measurements of volumetric water content and those reported by the 229-L sensors varied from 0.08 to 0.05 (cm 3 cm -3 ) with an overall network average of 0.05 (Scott et al. 2013). The Oklahoma Mesonet is the first mesoscale soil moisture observation network to quantify the network-wide uncertainty in their observations. The errors in the Oklahoma Mesonet observations are less than those of satellite and model-simulated soil moisture (Xia et al. 2014). For example, Jackson et al. (2010) showed that root mean square difference between in situ soil moisture 10
26 observations and the AMSR-E satellite remote sensing soil moisture product varied from 0.02 to 0.22 (cm 3 cm -3 ), depending strongly on the validation location and retrieval algorithm. Over Oklahoma, Jackson et al. (2007) compared AMSR-E to in situ data from 16 stations and found root mean square difference values ranged between 0.04 and 0.10 (cm 3 cm -3 ), again depending on the retrieval algorithm. Ford et al. (2014c) showed that standardized soil moisture mean absolute differences between Oklahoma Mesonet observations and remote sensing retrievals from the Soil Moisture and Ocean Salinity (SMOS) platform varied from 0.14 to 0.43 (cm 3 cm -3 ). Satellite soil moisture products can provide an accurate depiction of large-scale soil moisture variability; however, extensive validation is necessary to estimate the accuracy of the satellite-derived soil moisture products. 11
27 CHAPTER II DOES AFTERNOON PRECIPITATION OCCUR PREFERENTIALLY OVER DRY OR WET SOILS IN OKLAHOMA?* 2.1 Introduction Background Root zone soil moisture in vegetation regions has a significant influence on evapotranspiration rates (McPherson, 2007; Alfieri et al. 2008) and latent and sensible heat exchange (Dirmeyer et al. 2000; Basara and Crawford, 2002). Inclusion of soil moisture in seasonal climate predictions has been shown to increase seasonal precipitation predictive accuracy in some cases (McPherson et al. 2004; Meng and Quiring, 2010a; Koster et al. 2011; Guo et al. 2011). Meng and Quiring (2010a) found that spring soil moisture influenced summer precipitation in the Community Atmosphere Model (CAM3). Soil moisture is thought to influence precipitation and temperature on seasonal scales through soil moisture memory (Wu and Dickinson, 2004), such that anomalously low soil moisture reduces the amount of moisture available for precipitation recycling. Under these conditions, locally sourced precipitation within 200 km of initiation is less likely than when soil moisture is normal or wetter than normal (Dirmeyer et al. 2009). Despite the overwhelming evidence of soil moisture precipitation coupling in modeling studies, 1 few investigations have been able to * 1 Copyright April 2015 American Meteorological Society (AMS). Permission to use figures, tables, and brief excerpts from this work in scientific and educational works is hereby granted provided that the source is acknowledged. Any use of material in this work that is determined to be fair use under Section 107 of the U.S. Copyright Act September 2010 Page 2 or that satisfies the conditions specified in Section 108 of the U.S. Copyright Act (17 USC 108, as revised by P.L ) does not require the AMS s permission. Republication, systematic reproduction, posting in electronic form, such as on a web site or in a searchable database, or other uses of this material, except as exempted by the above statement, requires written permission or a license from the AMS. 12
28 conclusively show soil moisture impact on subsequent precipitation using observations of both soil moisture and precipitation. This is partly due to the lack of spatially and temporally extensive in situ soil moisture observations (Robock et al. 2000; Seneviratne et al. 2010), as well as the strong autocorrelation of precipitation, which can mask any signal of strong moisture forcing (Wei et al. 2008). More recently, the focus has shifted from seasonal relationships to investigations attempting to connect soil moisture to subsequent precipitation on much shorter time scales. Specifically, soil moisture feedback to convective initiation or the likelihood of convective precipitation has been examined. Ek and Holtslag (2004) explored the feedback of soil moisture on planetary boundary layer (PBL) convective cloud development and found that relative humidity at the PBL is related to surface evaporation and partitioning of energy between sensible and latent heat flux. Taylor et al. (2007) found that strong horizontal gradients in observed sensible heat flux, forced by soil moisture gradients, can generate sea breeze-like circulations in the lower atmosphere. These mesoscale circulations can provide the focus for moisture convection, which generates precipitation preferentially over dry soil adjacent to wet soils. Garcia- Carreras et al. (2011) showed that initiation of mesoscale convection is found preferentially on the warm (dry) side of dry wet soil boundaries. Myoung and Nielsen- Gammon (2011) found that anomalously wet soils were negatively correlated with convective inhibition in the North American Southern Great Plains, which suggested that wet soils are associated with increased likelihood of convective initiation in that region. 13
29 Despite several studies examining land surface impacts on precipitation, soil moisture proxies such as land surface temperature from satellites or reanalysis data products are most frequently used. We employ in situ soil moisture observations to explore soil moisture precipitation coupling in Oklahoma. Our in situ observations provide an improvement over satellite remote sensing-based soil moisture products, which are affected by signal attenuation by vegetation (Crow et al. 2001; Wagner et al. 2007), leading to significant spatial variability in product accuracy (Jackson et al. 2010; Ford et al. 2014c). The primary disadvantage of in situ data are their limited spatial representativeness. This chapter examines whether convective precipitation falls preferentially over wet or dry soils and documents the atmospheric and land-surface conditions prior to the occurrence of convection during the warm season (May September), Data and Methods Soil Moisture This study uses soil moisture observations from the Oklahoma Mesonet at 5 cm depth that were measured at 0900 LST. An empirical cumulative distribution function was determined using all 0900 LST volumetric water content measurements for each station between 2002 and The empirical cumulative distribution was generated for all daily volumetric water content measurements in a given month and was subsequently used to convert the soil moisture observations to percentiles. We remove the soil moisture seasonal cycle (i.e., Figure 1.4) by using a separate distribution for each calendar month. Percentiles provide a standardized measurement of relative soil wetness 14
30 with respective to soil moisture conditions experienced at each station during the study period. In this way, the soil moisture value in May with a percentile of 100 is the wettest soil moisture observation of any May over the entire study period at that particular station. These station-based soil moisture percentiles were gridded at a 0.25 resolution using the average of all stations with in each grid cell. Over the entire study region (431) grid cells, 113 cells have at least one Mesonet station. Out of these, 6 grid cells have 2 stations and 3 have three stations Precipitation Event Identification To capture the spatial variability and relatively short time-scales of convective precipitation, we apply the methods of Taylor et al. (2012). They use the Climate Prediction Center Morphing Method (CMORPH, Joyce et al. 2004) dataset to identify daily afternoon precipitation events in their global study of the linkage between local soil moisture conditions and the likelihood of precipitation. CMORPH merges satellite passive microwave rainfall estimates and thermal-infrared data to provide global precipitation estimates every 3 hours from 2002 to CMORPH takes advantage of the high spatial and temporal sampling of the geostationary data to derive motion vectors that are then used to propagate the less frequent passive microwave rainfall retrievals to produce the 3-hourly precipitation estimates. Similar to Taylor et al. (2012), the CMORPH 3-hourly precipitation estimates are totaled over each 0.25 grid box in Oklahoma for each day from 1200 to 2100 LST in the afternoon and from 0600 to 1800 LST on the event-day morning. Afternoon precipitation maxima are identified as grid boxes with afternoon accumulations greater 15
31 than 3 mm. To avoid biases due to morning precipitation before a convective event and after the soil moisture observation, events are excluded when precipitation accumulation is greater than 1 mm between midnight and noon (LST) the morning of an event. The daily maxima are then sorted by total afternoon accumulation and the grid cell with maximum accumulation is identified as the convective event. A 1.25 x 1.25 box is centered at the location of maximum precipitation for each event and the location of the maximum and minimum precipitation grid cells within this box are identified. These locations are then related to the corresponding soil moisture value from the gridded soil moisture observations. This analysis was originally intended by Taylor et al. (2012) to determine whether afternoon precipitation occurs more frequently when local soil moisture at the event location is higher or lower than the surrounding area; however, it also allows for analysis whether precipitation events occur preferentially over wetter or dryer soils for a given soil moisture station location. Because events are defined within a 1.25 x 1.25 box, any precipitation maxima whose surrounding box overlaps another event box with greater accumulation is excluded to maximize the independence of precipitation events Synoptic Environment Land-atmosphere interactions occur when the local land surface and subsurface conditions influence the moisture and energy budgets of the overlying atmosphere (Pielke, 2001). Therefore soil moisture impacts on convective precipitation could be more noticeable depending on the overall atmosphere conditions (i.e., synoptic forcing is weak). We account for synoptic conditions by classifying each day into one of four 16
32 types. The classification system we employed is adopted from Frye and Mote (2010) and uses the environmental lapse rate and presence/absence of the Great Plains low level jet (LLJ) to characterize synoptic conditions. Both the lapse rate and presence or absence of the LLJ were determined using daily 0900 LST data from the North American Regional Reanalysis (NARR, Mesinger et al. 2006) dataset. NARR is a high resolution, high frequency atmospheric and land surface hydrology dataset, which covers 1979 to the present and provides several meteorological and hydrological variables 8-times daily at a 32 km resolution over the Northern Lambert Conformal Conic grid (North America). The lapse rate was calculated from the atmospheric temperature profile of the NARR gird cell overlying each event between 850 and 750 hpa. If the lapse rate is less than 6 C km -1, the synoptic environment is considered stable or synoptically benign (SB, Frye and Mote, 2010). Otherwise, the synoptic environment is considered unstable and is classified as synoptically prime (SP). The LLJ is a large-scale feature that influences weather patterns throughout the central United States (Bonner, 1968) and is the primary mechanism by which moisture is advected from the Gulf of Mexico into the south and central Great Plains (Higgins et al. 1997; Wu and Raman, 1998). The LLJ can impact the stability of the lower atmosphere and the convective environment, potentially masking the influence of local moisture conditions. Here, the LLJ is classified as either present or absent using daily 0900 LST, 850 hpa level wind vector data from the NARR dataset. Similar to Frye and Mote (2010) we determine the LLJ is present if vector winds with speeds in excess of 12 ms -1 (Bonner, 1968) originating from the Gulf of Mexico influence the majority of 17
33 Oklahoma. Majority in this case means more than 75% of grid cells having a southerly or southeasterly vector wind in excess of 12 ms -1. The synoptic environment classification system results in four classes: synoptically prime LLJ present (SP-LLJ), synoptically benign LLJ present (SB-LLJ), synoptically prime LLJ absent (SPInoLLJ), and synoptically benign LLJ absent (SB-noLLJ). Every day with a precipitation event is classified into one of these four classes. This procedure allows us to separate events by the overall synoptic and dynamic conditions, and focus on events without the impact of synoptic-scale atmospheric processes that could confound the land surface relationships Atmospheric Conditions The convective environment associated with each precipitation event is also characterized using surface convective available potential energy (CAPE) calculated from 1200 LST NARR data. High values of CAPE represent unstable atmospheric conditions with high potential for moisture convection. Taylor and Lebel (1998) suggest that soil moisture anomalies can have a significant influence on CAPE. The daily CAPE values are converted to anomalies (J kg -1 ) using the mean of all days (event and nonevent) during the event month between 2003 and Along with convective environments, we also define near-surface atmospheric temperature and specific humidity from the hpa levels before each event. Temperature and humidity are from 1200 LST NARR data and they are compared to soil moisture and CAPE. Because both temperature and humidity exhibit considerable spatial variability in Oklahoma, both variables were converted to z-scores by subtracting the 18
34 mean of all days during the event month and dividing by the standard deviation of all days during the event month between 2003 and Results Synoptic Classes A total of 1,697 events are classified between May and September, Of these events, 353 occurred over grid cells with available soil moisture observations. Therefore, we only analyze these 353 events; Figure 2.1 shows the spatial distribution of the precipitation events across Oklahoma. No significant spatial patterns of event occurrence are present, and therefore the spatial gradients of temperature, precipitation, and vegetation are assumed to not impact the results. 19
. The number of events in each class is provided in Table 2.1. Nearly 70% of convective events identified occur on days when the LLJ is present, consistent with the results of Frye and Mote (2010).")
35 Figure 2.1. Map of precipitation events occurring in each grid cell of the study region. Grid cells are color coded based on the number of events in each cell. All events are taken from May - September, 2003 through Taken from Ford et al. (2015). The number of events in each class is provided in Table 2.1. Nearly 70% of convective events identified occur on days when the LLJ is present, consistent with the results of Frye and Mote (2010). The monthly distribution of events of each type (Figure 2.2) shows that events occurring a synoptically prime environment tend to occur more frequently in July and August, while those occurring in a synoptically benign environment show a relative minimum in July. 20
36 Table 2.1. Number of afternoon precipitation events in each synoptic environment class and the percentage of overall total precipitation events in each class. Taken from Ford et al. (2015). Synoptic Class Number of Events Percent Total Events SP-LLJ 88 25% SB-LLJ % SP-noLLJ 51 14% SB-noLLJ 56 16% Soil Moisture Magnitude The location (grid cell) with the maximum precipitation was identified for each precipitation event and is used to identify the soil moisture conditions in that location. For each synoptic class (SP-LLJ, SB-LLJ, SP-noLLJ, SB-noLLJ), the soil moisture conditions associated with each precipitation event are examined. The distributions of 5 cm soil moisture percentiles for each class are shown in Figs. 2.3a 2.3d. Soil moisture during the morning of precipitation events in SPI-LLJ and SB-LLJ classes (Figs. 2.3a, 2.3b) are more frequently drier than normal (< 50%), while events in SP-noLLJ and SBnoLLJ classes occur more frequently over wetter than normal (> 50%) soils. 21
.")
37 Figure 2.2. Mean monthly distribution of precipitation events during the study period ( ). Each bar represents the total number occurring in each month. Distributions are delineated by the synoptic class. Taken from Ford et al. (2015). The statistical significance of soil moisture conditions underlying events in each class is evaluated against soil moisture conditions simply occurring by chance. The evaluation compares the number of events occurring over wet (dry) soils in each synoptic-dynamic class to the number days with wet (dry) soils in a randomly selected sample of event and non-event days. For clarification purposes, afternoon precipitation could occur on non-event days; however, the precipitation would have to occur before noon or occur on an afternoon which followed a morning with precipitation. We employed a bootstrap resampling procedure with 10,000 iterations to randomly select a sample of n days. The number of days (n) in each of the 10,000 samples was equal to the number of events in each synoptic class (e.g. 88 for SP-LLJ), and synoptic conditions of days in each sample matched conditions of the respective event class. 22
")
.")


38 a. b. c. d. Figure 2.3. Distributions of 5 cm soil moisture percentiles for all (a) SP-LLJ events, (b) SB-LLJ events, (c) SP-noLLJ events, and (d) SB-noLLJ events. Taken from Ford et al. (2015). That is, all 10,000 randomly selected samples in the SB-LLJ sample were also SB-LLJ days between May and September, Soil moisture observations for each of the days in the sample were taken from a randomly chosen grid cell. For each iteration, we tallied the frequency of days with relatively wet and relatively dry soil 23
39 moisture conditions. The respective frequencies of relatively dry (< 50) and relatively wet (> 50) soil moisture events in each synoptic class were compared to the distribution of frequencies generated from a bootstrapping procedure, and the likelihood (p) of the event frequencies occurring by chance was calculated. For this evaluation, if the number of events occurring over dry soils in the SB-LLJ class represented the 96 th percentile of the SB-LLJ bootstrapped sample, then the probability (p) of that number of dry soil events occurring by chance is 4%. Table 2.2. Figure 4. Probabilities (p-value) of events over wet and dry soils occuring by chance. p-values are generated by comparing frequency of events occurring over wet/dry soils to distributions of wet and dry day frequencies from a resampling boot-strapping procedure. p-values are reported by synoptic class. Taken from Ford et al. (2015). Synoptic Class Wet Soil Event p-value Dry Soil Event p-value SP-LLJ SB-LLJ SP-noLLJ SB-noLLJ Table 2.2 shows the probability (p) of the frequency of events occurring over wet and dry soils for each synoptic class. Probabilities are calculated separately for event frequency over wet and dry soils. The preference for SP-LLJ and SB-LLJ events to occur over dry soils is statistically significant at the 95% confidence level, as is the preference for SP-noLLJ and SB-noLLJ events to occur over wet soils. Afternoon precipitation falls preferentially over both dry and wet soils, depending on the synoptic and dynamic conditions. Interestingly, the divide between precipitation falling over drier 24
40 (wetter) than normal soils coincides with presence (absence) of the LLJ. The impact of the LLJ on wet or dry soil preference is discussed further in Section Temperature and Humidity Anomalies Soil moisture does not directly influence precipitation, but instead modifies the partitioning of latent and sensible heat, impacting both temperature (Fischer et al. 2007; Teuling and Seneviratne, 2008) and humidity (Basara and Crawford, 2002; Roundy et al. 2013). Specifically, temperature is lower (higher) and humidity is higher (lower) over relatively wet (dry) soils. Increased evaporation from wet soils supplies additional moisture to the atmosphere for convection, providing a physical mechanism for positive soil moisture precipitation feedback (Koster et al. 2003; Findell et al. 2011). Conversely, increased sensible heat from dry soils supplies uplift and instability for convection, providing a physical mechanism for negative soil moisture precipitation feedback (Taylor et al. 2011). Our results in section 2.4 show afternoon precipitation falls preferentially over dry and wet soils, based on the overall synoptic and dynamic conditions. Here we examine the relationship between soil moisture and near-surface atmospheric humidity and temperature to determine the potential of soil moisture feedback. We use 1200 LST NARR near-surface temperature (T) and specific humidity (q) z-scores to examine the relationship between soil moisture and near-surface atmosphere. We first group event soil moisture percentiles into 10 bins along the soil moisture percentile gradient from 0 to 100. We then compare the average q and T anomaly of the soil moisture bins to the frequency of events in each bin. 25
, SB-LLJ (7b), SP-noLLJ (7c), and SB-noLLJ (7d) events grouped into")
 and temperature (T, red line) z-scores are averaged for")


41 a. b. c. d. Figure 2.4. Frequency of SP-LLJ (7a), SB-LLJ (7b), SP-noLLJ (7c), and SB-noLLJ (7d) events grouped into soil moisture percentile bins of 10. Near-surface humidity (q, blue line) and temperature (T, red line) z-scores are averaged for each percentile bin and plotted in each panel. Taken from Ford et al. (2015). Figs. 2.4a 2.4d show the frequency of events in binned soil moisture percentiles and the mean near-surface humidity anomaly corresponding to events within each bin. We show the individual fluctuations of near-surface q and T corresponding with bins of soil moisture percentiles; however, the samples sizes in each bin are not large enough for the fluctuations to be significant. Therefore, we only remark on the general q and T trend 26
42 as percentiles range from dry to wet. The general T z-score trends are decreasing as soil moisture increases for all event classes. Correlation coefficients (r) between soil moisture and temperature range from (SP-noLLJ) to -88 (SB-LLJ), and all are statistically significant for all four classes. There is a positive trend in q z-scores as soil moisture percentiles increase; however, the slope of the trend varies more between classes than the T trends. Negative correlations between soil moisture and temperature are contrasted by positive soil moisture humidity correlations. Correlations between soil moisture and humidity are statistically significant for all classes except SP-noLLJ and coefficients (r) are decreased from soil moisture temperature correlations, ranging from 0.20 (SP-noLLJ) to 0.73 (SP-LLJ). Figure 2.4 shows that soil moisture anomalies correlate well with near-surface atmospheric humidity and temperature anomalies. SP-LLJ and SB-LLJ events occur most frequently over relatively dry soils (Figure 2.3, Table 2.1), which correspond with below normal near-surface humidity for SP-LLJ events and above normal near-surface temperatures for SP-LLJ and SB-LLJ events. This corroborates the findings of Taylor and Ellis (2006) and Taylor et al. (2011), which suggested that dry soils increase energy partitioned to sensible heat, decreasing low-level atmospheric stability and increasing uplift. In contrast, the majority of SB-noLLJ events occur over wetter than normal soils, which corresponds with increased near-surface atmospheric humidity and decreased temperature. This in turn is consistent with a positive land-atmosphere feedback such that the probability of precipitation is increased through invigorated latent heat flux and decreased lifting condensation level height (Pal and Eltahir, 2001; Santanello et al. 27
43 2011). The connection between soil moisture percentiles and subsequent near-surface temperature and humidity z-scores suggests a physical link through which soil moisture could potentially impact atmospheric conditions. The results from these statistical analyses are consistent with negative and positive feedback mechanisms proposed in previous studies. However, the aforementioned confounding factors make it impossible to provide a causal link between soil moisture anomalies and precipitation based solely on these results Convective Environment Temperature and humidity anomalies can decrease atmospheric stability, increasing the likelihood of moist convection in the planetary boundary layer. The results in the previous section suggest interactions between soil moisture both the overlying atmospheric humidity and temperature, providing evidence of potential landatmosphere coupling. Here we examine the co-variation of soil moisture, near-surface humidity and temperature, and CAPE for each event. We use gridded CAPE, which represents general atmospheric instability and potential for moisture convection, from 1200 LST NARR data to characterize the atmosphere prior to each event. We examine the relationship between soil moisture underlying each event and the corresponding 1200 LST q and T z-scores. Figures 2.5a 2.5d show scatter points separated by dry and wet soils, plotted in dual T q z-score space. The size of the symbol is proportional to the 1200 LST CAPE anomaly corresponding with each event. Events over dry soils are represented by red circles, and events over wet soils are represented by blue squares. 28
 and wet soils events (blue")

44 a. b. c. d. Figure 2.5. Scatter plots of humidity (q) and temperature (T) anomalies. Each point represents one event that is separated into dry soil events (red circles) and wet soils events (blue squares), and is scaled based on the corresponding CAPE anomaly (J kg-1). The gray-dashed lines are used to separate q and T into quadrants. The top plot shows anomalies for SP-LLJ events and the bottom plot shows anomalies for SB-noLLJ events. Taken from Ford et al. (2015). 29
45 This provides a means to visualize how soil moisture and CAPE co-vary in humidity/temperature space. The most noticeable pattern in the panels is the larger CAPE anomalies preceding events with higher than normal near-surface humidity. This is intuitive as increased humidity in the lower troposphere, whether from local evapotranspiration or advection, directly increases CAPE. This pattern is evident for SPnoLLJ events as well; however, this is the only class without a significant relationship between soil moisture and specific humidity (Figure 2.4c). Given the strong relationship between soil moisture and near-surface temperature anomalies (Figures 2.4a 2.4d), one would expect consistently warmer (cooler) than normal temperatures over drier (wetter) than normal soils. Figures 2.5a and 2.5b show the majority of SP-LLJ and SB-LLJ events over both dry and wet soils occur more frequently in conditions with warmer than normal near-surface temperatures. This pattern is somewhat unexpected for events over wet soils, as high soil moisture generally coincides with cooler than normal temperatures. One possible explanation for warm air over wetter than normal soils is the presence of the LLJ. During the warm season, the Great Plains LLJ is mostly southerly to southwesterly (Whiteman et al. 1997). In the Great Plains, this corresponds with warm advection from the southeast, increasing lowlevel air temperature. Despite wetter than normal soils, increased precipitation events and increased CAPE could be attributed to the presence of the southerly-tosouthwesterly LLJ prior to and during SP-LLJ and SB-LLJ events. While there are clearly variations in CAPE anomalies that appear to be at least partially linked to the dynamical environment, it is also noticeable that in LLJ 30
46 conditions, dry soils correspond with larger CAPE anomalies than wet soils. For a given positive q anomaly in LLJ events, T anomalies and thus CAPE anomalies are on average larger when the soils are dry relative to when they are wet. Conversely, both event classes with no LLJ have larger CAPE anomalies for wet soils relative to dry soils, which occur even for weak positive or slightly negative T anomalies. This suggests the importance of the increased q (T) anomalies in the larger CAPE anomalies over wet (dry) soils. 2.4 Summary and Conclusion Soil Moisture Feedback Context Our results do not show unequivocal evidence for strong soil moisture precipitation coupling in Oklahoma, but instead suggest that afternoon precipitation is more likely to fall over dry or wet soils depending on the synoptic and dynamic conditions. More specifically, events which occur with the LLJ present tend to occur more frequently over drier than normal soils, while those without an LLJ occur over wetter than normal soils. These preferences are statistically significant (Table 2.2); however, our results merely suggest possible soil moisture feedback to precipitation and do not provide a causal link between the two. The common denominator between events occurring over drier (wetter) soils is the presence (absence) of the LLJ, which is consistent with the findings of Frye and Mote (2010). Past studies have shown evidence of soil moisture feedback to precipitation from wet soils (Brimelow et al. 2011) and dry soils (Westra et al. 2012). Mechanistically, wet soils partition incoming energy into a higher ratio of latent heat over sensible heat, which 31
47 increases moist static energy in the near-surface atmosphere (Pal and Eltahir, 2001). Higher atmospheric humidity near the surface lowers the lifting condensation level, and increases CAPE (Taylor and Lebel, 1998). Drier than normal soils lead to increases in sensible heat flux and rapid planetary boundary layer (PBL) growth leading to entrainment of drier, warmer air (Ek and Holtslag, 2004). Both result in increased air temperatures and decreased atmospheric humidity near the surface over dry soils. Despite less moisture flux from drier soils to the atmosphere, convection may be favored over dry soils due to rapid PBL growth, particularly if the PBL reaches the lifting condensation level (Santanello et al. 2011). Our results are consistent with both mechanisms for soil moisture feedback over wet and dry soils, in that events over wetter than normal soils correspond with increased humidity and stronger CAPE values. Events over drier than normal soils coincided with increased air temperature and decreased atmospheric humidity. The potential dominant soil moisture-precipitation feedback mechanism appears to be dependent on the presence or absence of the LLJ Synoptic Classification Limitations The synoptic classification used in this chapter was adopted from Frye and Mote (2010), and is intended to account for synoptic-scale atmospheric variability that could confound any land surface feedback signal. However, recent analysis has shown that the classification system does not sufficiently separate unorganized convective events from large-scale convective or stratiform precipitation events (Wang et al. submitted to JAMC). The majority of SB-noLLJ events, presumed to occur during benign, stable atmospheric conditions, are associated with large clusters of thunderstorms unlikely to 32
48 be largely initiated by surface heat flux anomalies and soil moisture. Overall, the results suggest that the classification system fails to isolate local convective events from stratiform precipitation under SB-noLLJ conditions Conclusions The results from this chapter show statistically significant preferences for afternoon precipitation to fall over wet soils and dry soils, depending on the presence or absence of the LLJ. This suggests that the Great Plains LLJ exerts not only a large dynamic influence on the convective environment of the southern U.S., but may also impact land-atmosphere interactions that could potentially manifest through different mechanisms when the jet is present or absent. Although the results suggest both dry negative and wet positive soil moisture feedbacks may be present in this region, the uncertainty surrounding the synoptic classification procedure suggests an alternative classification methodology be employed. 33
49 CHAPTER III SOIL MOISTURE PRECIPITATION COUPLING: OBSERVATIONS AND UNDERLYING PHYSICAL MECHANISMS 3.1 Introduction Background Soil moisture is vital to the climate system. Through the modification of evapotranspiration and moisture transport from the land surface to the atmosphere, soil moisture can impact regional temperature and precipitation. Studies have focused on the mechanistic modification of atmospheric conditions by the land surface through energy exchange. Findell and Eltahir (2003) derived a convective triggering potential and, combined with a low-level atmospheric humidity index, determined atmospheric potential for convective initiation over relatively wet or relatively dry soils in Illinois. Santanello et al. (2009) used observations of soil moisture and atmospheric conditions to describe the modification of atmospheric moisture and energy by the land surface at the hourly time scale. Results from these and similar studies suggest that soil moisture anomalies, which drive preferential latent or sensible heating at the surface, can alter low-level atmospheric temperature and humidity such that atmospheric dew point depressions will be generally lower (higher) over wetter (drier) soils. Land surface modification of the atmosphere consists of changes in the height of the lifting condensation level (LCL) and the potential for deep convection to initiate (Brimelow et al. 2011). The height of the afternoon LCL and (LFC) are decreased with sufficient moisture flux from a wet land surface to the low-level atmosphere, which then 34
50 erodes convective inhibition (CIN) and increases convective available potential energy (CAPE). These mechanisms act as a wet (positive) soil moisture precipitation feedback in which wetter than normal soils enhance atmospheric instability and strengthen the probability of subsequent convective precipitation (Findell et al. 2011). Conversely, increased sensible heating over drier than normal soils leads to increased LCL and LFC heights, which can enhance atmospheric stability (Frye and Mote, 2010a). However, enhanced surface heating over dry soils also increases planetary boundary layer (PBL) growth rate, and can more quickly erode capping inversions and CIN to increase the probability of deep convection. If the PBL can reach the LFC, deep convection can be initiated over drier than normal soils, albeit with generally less CAPE than convection generated over wet soils (Santanello et al. 2009). Convective initiation over drier than normal soils, following these mechanisms, is considered a dry (negative) soil moisture feedback Soil Moisture Precipitation Coupling in the U.S. Southern Great Plains Although land-atmosphere interactions have considerable impact on regional climate and climate persistence, debate continues as to the sign and strength of these interactions at various scales. Global climate models have identified the U.S. Southern Great Plains as a hot spot of land-atmosphere interactions wherein the probability of precipitation responds strongly to land surface conditions (Koster et al. 2004). In contrast, observations have suggested both positive (Frye and Mote, 2010b) and negative (Santanello et al. 2013) soil moisture-precipitation feedbacks in this region. Taylor et al. (2012) found no preference for convective precipitation to fall over relatively wet or dry 35
51 soils in the Southern Great Plains, suggesting the lack of significant soil moisture feedback on precipitation in the region. In contrast, Guillod et al. (2014) found that interactions between evaporative fraction and precipitation were connected to soil moisture in the Southern Great Plains. Ford et al. (2015) composite station-based soil moisture observations underlying afternoon precipitation events in Oklahoma, and find a significant preference for precipitation initiation over wetter than normal soils. The conflicting results from these and other studies are mostly attributable to the breadth of datasets and methodologies employed. However, based on the predominant literature, both wet-positive and drynegative soil moisture feedback on precipitation are potentially relevant in the Southern Great Plains. Results from the Chapter II suggest that afternoon precipitation falls preferentially over dry and wet soils, depending on the presence or absence of the LLJ. However, we also found that the synoptic classification procedure, used to separate unorganized from organized/stratiform precipitation, did not sufficient differentiate these events. In addition, the CMORPH product used in Chapter II can only be used to identify the point of maximum precipitation accumulation, and therefore soil moisture underlying these points does not directly impact precipitation initiation. The analysis in this chapter combines soil moisture observations from the dense Oklahoma Mesonet observation network with radar-derived precipitation estimates and atmospheric soundings to analyze the soil moisture-precipitation coupling strength in the Southern Great Plains of the United States. We use these datasets and improved methodologies to either corroborate 36
52 or contrast the findings from Chapter II, and provide more robust evidence for the presence or absence of potential soil moisture feedbacks. 3.2 Data and Methods Soil Moisture Data In situ observations of soil moisture are taken from the Oklahoma Mesonet ( comprising over 100 continuously monitoring stations across the state (Illston et al. 2008). The same daily (0900 LST) soil moisture percentiles used in Chapter II are employed for soil moisture observations in this section. In addition, we analyze results from 25 cm soil moisture to demonstrate the consistency of results with depth Precipitation Event Identification The majority of precipitation in the central United states is caused by stratiform or frontal activity (Raddatz and Hanesiak, 2008; Carleton et al. 2008a). In these cases, moisture is advected into the region by mid-latitude cyclones or fronts, and synopticscale atmospheric conditions are not conducive to surface-modified convection (Matyas and Carleton, 2010). Therefore, analyzing the influence of soil moisture on those precipitation events will likely result in a weak or nonexistent relationship. Unorganized convection, as defined by Carleton et al. (2008a), includes isolated convective events which occur in the absence of strong, synoptic-scale atmospheric forcing. Separating these afternoon precipitation events from those forced by synoptic-scale atmospheric processes will help to remove confounding factors (i.e., noise), and potentially isolate the influence of the land surface (i.e., signal). Results from Chapter II suggest that the 37
53 synoptic-dynamic classification combined with CMORPH precipitation product does not sufficiently separate unorganized from organized or stratiform precipitation events. Capturing individual convective precipitation events, particularly unorganized convection most pertinent to our study, requires datasets with a high spatial and temporal resolution. Taylor et al. (2012) identified convective events using the Climate Prediction Center Morphing Method (CMORPH, Joyce et al. 2004), a global precipitation dataset with a 3-hour (temporal) and 0.25 (spatial) resolution. Their precipitation event detection methodology, also implemented by Ford et al., (2015) and Chapter II, identifies the grid cell that resides within a 1.25 x 1.25 box in which the maximum amount of precipitation occurred. It also identifies the grid cell(s) within the same 1.25 x 1.25 box with the minimum amount of precipitation. Compositing soil moisture associated with these locations of maximum and minimum precipitation provides a means of determining whether there is a preference for convective precipitation to fall over relatively wetter or drier land surfaces. The use of CMORPH precipitation is wellsuited for global-scale analyses; however the 3-hour temporal resolution precludes the identification of the point of precipitation initiation. Our study identifies unorganized convective precipitation events using groundbased Doppler radar from the National Weather Surface (NWS) Next-Generation or NEXRAD radar network. NEXRAD includes over 160 S-band Doppler radars in the United States, including 5 in Oklahoma. The NWS produces their Stage IV hourly precipitation product at 4 km spatial resolution using a mosaic of the ground-based radar data that covers nearly all of the contiguous United States. The Stage IV product 38
54 undergoes bias-correction, quality control, and a series of automated algorithms and manual inspection. We examined hourly Stage IV radar images of precipitation accumulation from 3 a.m. to 8 p.m. each day between May and September, , and manually identified unorganized convective events. The manual identification procedure was completed according to a pre-determined decision tree (Figure 3.1), which approximates the classification system of Schoen and Ashley (2011). Schoen and Ashley s (2011) system classified storms as cellular unorganized, quasi organized, cellular organized, and linear organized, and was based on previous studies examining radar morphology of convective storms (Parker and Johnson, 2000; Klimowski et al. 2003). The decision tree process included 5 assessments or queries: (1) the location of precipitation initiation, (2) minimum event size, (3) precipitation rate, (4) shape and (5) propagation of the event. The classification systems attempts to exclude organized convective events. Specifically, organized convective events in our classification were identified as either (1) conglomerates of convective storms arranged in a linear or quasi-linear fashion or line-echo wave pattern, including bow echoes and squall lines, or (2) as individual cells which initiate and propagate in the same vicinity and direction, arranged in a linear or nonlinear fashion (Gallus et al. 2008), and that move/evolve with respect to one another. Organized convection is undesirable because it is typically associated with the synopticscale atmospheric processes that we are trying to exclude from this study 39
55 Figure 3.1. A schematic of the decision tree that was used for manual identification of unorganized convective events. 40
56 The desired unorganized storm type was defined as individual cells which initiated, propagated, and evolved independently of each other and were arranged in a nonlinear fashion (Ashley and Gilson, 2009). These systems are typically shorter lived than organized events, and do not develop into or dissipate from more organized convective modes. Manual event identification procedures have advantages and disadvantages. The primary advantage of a manual classification procedure is the ability of the researcher to discern isolated, unorganized cells from those which develop/evolve together or bifurcate from larger systems. The primary disadvantage of such a manual classification methodology is the lack of repeatability. Even with a well-rooted decision tree to guide the classification process, the results are researcher-specific. To test the reproducibility of this study, classification of all events was completed independently by two researchers. There was 72% agreement between the two researchers with regards to event identification. Agreement varied from year to year and month to month, ranging from 50% for 2009 events to 87% for 2007 events, and 63% for June events to 80% for events in September. Qualitatively, it seemed that the most frequent disagreements between researchers were for (1) multiple, isolated systems that initiated at the same time, and (2) systems which initiated in Oklahoma, but could have been associated with systems initiating outside the study region. Overall, there was a reasonable amount of consistency when using this methodology to detect unorganized convective events. 41
 identified between May and September, 2002-2012.")
57 Once an unorganized convective event is identified, the location of afternoon precipitation initiation is established as the grid cell in which precipitation is first captured in the radar dataset. Figure 3.2. Location of 477 convective events (black circles) identified between May and September, These are overlayed on the primary land cover, taken from the National Land Cover Dataset ( This procedure is different from those used by Taylor et al. (2012) and Ford et al. (2015), as we identify the point of precipitation initiation instead of the region of maximum accumulation. Once the location of precipitation initiation was established for an event, we determined if more than 3 mm of precipitation occurred between 3:00 a.m. and noon (LST) of the preceding morning within 20 km of the location of initiation. Convective events were retained only if precipitation did not occur or less than 3 mm 42
58 had accumulated near the location of initiation. Through our precipitation classification methodology, 477 unorganized events were identified during the warm season (May September) between 2002 and 2012 in Oklahoma (Figure 3.2). These events were then used to determine if unorganized convection initiates more frequently over wetter or drier than normal soils. Although unorganized convective precipitation events show the strongest land surface feedback signal, they do not produce the majority of precipitation to Oklahoma in the warm season. We calculate the percent of total monthly precipitation accumulation falling over the entire state of Oklahoma attributable to our 477 unorganized convective events (Figure 3.3). The largest percent monthly precipitation contribution was nearly 15% in both May and August, 2010; however, the overall average percent monthly precipitation contribution is just over 5%. Not surprisingly, the years which experience the largest number of unorganized precipitation events (2002, 2007, 2010) also exhibit the largest percentage of unorganized convective event precipitation. Precipitation contribution by unorganized convective events identified in this study are not negligible, but they are quite small. It is important to place soil moisture impact on precipitation initiation in this context, and to remember that soil moisture precipitation coupling represents a very small percent of total precipitation in this region Atmospheric Conditions In addition to documenting the frequency of convection over wet and dry soils, we also use a subset of convective events to characterize atmospheric modification by the land surface in greater detail. Soundings of the atmospheric profile allow for direct 43

59 connection with the underlying land-surface conditions, but are limited in spatial coverage. Therefore, we use atmospheric soundings at 0600 LST and 1200 LST from the Department of Energy Atmospheric Radiation Measurement facility at Lamont, Oklahoma for the diurnal evolution of atmospheric moisture and energy. Figure 3.3. Percent monthly precipitation contributed by the 477 unorganized convective events over the study region. The percentages are separated by month and year. We use a cluster analysis with a Ward s linkage and a 4-class maximum to separate events near Lamont. The events are clustered based on their morning (0600 LST) convective triggering potential and low level humidity conditions (e.g. Findell and Eltahir, 2003). Hierarchical cluster methods, such as the Ward s method have been used frequently for distinguishing precipitation regimes (Gong and Richman, 1995; Ramos, 2001) and other environmental patterns (Allen and Walsh, 1996). Within each cluster of 44
60 events, we examine changes in atmospheric humidity and temperature, LFC, and PBL height. The convective environment and stability of the atmosphere associated with each precipitation event is also characterized using profile-integrated convective available potential energy (CAPE) and convective inhibition (CIN). Taylor and Lebel (1998) suggest that soil moisture anomalies can have a significant influence on CAPE, while Myoung and Nielsen-Gammon (2010) find a strong statistical relationship between soil moisture and CIN values in the Southern Great Plains. Atmospheric stability measures combined with changes in atmospheric humidity and temperature are linked to underlying soil moisture conditions for the events surrounding Lamont. In this study, we examine the physical mechanisms coupling the land surface with the atmosphere, potentially leading to convective precipitation. The organization of the results and discussion are presented as follows: section 3 describes the preference for convection to occur over wet or dry soils, connections between soil moisture and atmospheric conditions are presented in section 4, and section 5 provides a summary and discussion of our results with respect to the broader climate community. 3.3 Results Dry or Wet Soil Preference The location of convective initiation was identified for each precipitation event and is used to determine the soil moisture conditions in that location (Figure 3.2). Soil moisture percentiles underlying all convective events are presented in Figure 3.4. The histogram shows a larger number of convective events which occurred over drier than 45

61 normal soils (< 50) than over wetter than normal soils (> 50). In fact, the three bins with the highest frequency of events are the driest soil bins, with percentiles ranging from 0 to 30. Figure 3.4. Distribution of 5 cm soil moisture percentiles underlying convective events identified. The dashed-black line represents the divide between relatively wet and relatively dry soils. The statistical significance of the preference for convection over dry soils is evaluated against soil moisture conditions occurring by chance. The evaluation is adopted from the methods used by Ford et al. (2015) and it compares the number of events occurring over wet (dry) soils to the number of days with wet (dry) soils in a randomly selected sample of event and non-event days. A bootstrap resampling procedure with 10,000 iterations was used to randomly select a sample of n event and non-event days. The number of days in each of the 10,000 samples is equal to the number of events shown in Figure 3.4. Soil moisture observations for each of the days in the sample were taken from a randomly chosen grid cell. For each iteration, we tallied 46
62 the frequency of days with relatively wet and relatively dry soil moisture conditions. The respective frequencies of relatively dry and relatively wet soil moisture events were compared to the distribution of frequencies generated from the bootstrapping procedure, and the likelihood (p) of the event frequencies occurring by chance was calculated. If the number of events occurring over dry soils from our convective events represent the 96 th percentile of the bootstrapped sample, then the probability of that number of dry soil events occurring by chance is 0.04 or 4%. Based on this evaluation, the number of events that were observed to occur over drier than normal soils is associated with the 99 th percentile of the bootstrapped distribution. This means that the probability of obtaining these results by chance is less than 1%. Therefore, we conclude that there is a statistically significant preference for unorganized precipitation to initiate over drier than normal soils. The corresponding distribution of 25 cm soil moisture underlying convective precipitation events is shown in appendix A, and shows essentially the same distribution as well as a statistically significant preference for convective events to initiate over relatively dry soils at 25 cm. The remaining analysis uses the 5 cm soil moisture observations over the 25 cm observations because of the less missing values at 5 cm. The purpose of the synoptic-dynamic classification methodology employed in Chapter II was to separate precipitation events which could potentially show a strong land surface feedback signal (unorganized convection) from those that do not (organized/stratiform). However, the inconsistency of the classification s discrimination ability lead us to employ a more direct procedure for identifying unorganized convective 47
63 events, used in this chapter. The results of the two classification procedures with respect to unorganized (or SB-noLLJ) events are contrasting, with Chapter II showing a significant preference for precipitation over wet soils and this chapter showing a significant preference for precipitation initiation over dry soils. The primary difference between the methodologies is the use of CMORPH for event identification in Chapter II, and NEXRAD radar in the present chapter. Two important advantages of NEXRAD which may be partly responsible for the contrasting results are: (1) the ability to identify the location of precipitation initiation and not just the location of maximum accumulation, and (2) the ability to discern between unorganized and larger-scale organized systems. For each of the 477 events, we identified both the location of precipitation initiation as well as the location of maximum precipitation accumulation. When we substitute the location of maximum accumulation for the location of initiation when compositing soil moisture underlying events, we find an even stronger preference for precipitation to initiate over dry soils (not shown). This suggests that the lack of agreement between the findings in Chapter III and those in Chapter II are most likely due to differences in the data sets and methods used to identify events. Based on the results in this chapter, we argue that the ability to detect soil moisture impacts on convective precipitation initiation is hindered when analysis events due to frontal activity and tropical storms, as these events do not actually initiate over the study region. The results presented in this chapter, however, accurately identify unorganized convective events and the location of precipitation initiation. This gives us 48
64 confidence in our assessment of the relationships between soil moisture and unorganized convection Convective Event Spatial Variability Land cover and land use boundaries have been shown to dramatically impact atmospheric temperature and humidity in Oklahoma (McPherson et al. 2004), which begs the question if the unorganized convective events identified here show any spatial patterns attributable to land cover (Figure 3.2). The G-function was used to provide a quantitative measure of event spatial randomness (Diggle, 2003; Perry et al. 2006). This method examines the cumulative frequency distribution of nearest neighbor distances for all events. The distribution of nearest neighbor distances is then compared against the theoretical distribution of distances generated from a sample of randomly generated points, the same size as the number of events. We use a bootstrapping procedure to iteratively generate 1,000 samples of n random points (n = 477) in Oklahoma. From this dataset, the 50 th, 97 th and 3 rd percentile distributions are generated to represent the median and the confidence interval envelopes, respectively. If the shape of the convective event distribution falls within the interval envelopes (95% confidence intervals), the events are assumed to exhibit complete spatial randomness. Figure 3.5 shows the cumulative distribution functions of nearest neighbor distances for the events (blue line), the bootstrapped median (red line) and the 95% confidence envelopes (black lines). The nearest neighbor distance distribution from the convective events falls within the confidence intervals at nearly all distances and therefore is concluded to exhibit complete spatial randomness. We repeated this analysis 49
65 for just wet and just dry events, and both groups also exhibited statistically significant spatial randomness. Figure 3.5. Cumulative distribution function of nearest neighbor distances for all unorganized convective events (blue line), the bootstrapped median (red line) and 95% confidence intervals (black lines). The bootstrapped samples are calculated from 1,000 iterations of 477 random events. Despite the result of statistically significant spatial randomness, unorganized convective events seem to cluster in the southeast corner of the state. This region is dominated by mixed forest land cover (Figure 3.2). To determine if convective events occurred with statistical preference over a certain land cover type, we calculated the percent of events (out of 477) that occurred over each land cover type. We then randomly selected a set of 477 geographic coordinates which fell within the political boundaries of Oklahoma. The percent of each of these random geographic points that fell over each land cover was also calculated. This procedure was repeated 10,000 times using a bootstrap resampling method. The distributions and the frequency with which 50
66 precipitation initiated over each land cover type are shown in Appendix A (A-2). We found that the frequency with which unorganized convective events occurred over a forest (mixed, deciduous and coniferous together), represented the 99 th percentile of the frequency distribution derived from the resampling procedure. This means that precipitation initiated with a statistically significant preference over forest land cover. The cluster is coincident with predominantly mixed forest land cover; however, no association could be made between the location of these events and land cover-induced atmospheric modification. Instead the grouping of these events is attributed to increased atmospheric instability in the form of mid-morning CAPE (J kg -1 ) (Figure 3.6). The left panel of Figure 3.6 shows 0900 LST CAPE composited from the events that are clustered in the southeast corner of the state, while the right panel shows 0900 LST CAPE composited from all other events. Spatial patterns of the composites are very similar, with the exception of increased CAPE in the southeast corner of the state during the clustered events. Increased potential energy and instability goes to increase the probability of convection, and could perhaps explain the grouping of events in the southeast corner of Oklahoma. 51
 convective")

67 a. b. Figure 3.6. Composites of morning (0600 LST) convective available potential energy from (a) events clustered in southeast corner of the study region and (b) all other convective events. 52
68 3.3.3 Convective Event Temporal Variability We examine the monthly and inter-annual variability of wet and dry convective events in Oklahoma. Figure 3.7a shows the frequency of dry and wet events during each warm season between 2002 and 2012, as well as total (May September) precipitation (mm) for each year, averaged over all Oklahoma climate divisions. Precipitation totals are taken from the National Climate Data Center Climate Divisional Dataset ( The ratio of dry soil events to wet soil events follows closely the total (May September) precipitation each year. The two years, 2007 and 2008, with more wet soil events than dry soil events experienced the wettest and second wettest seasons over the study period, at 693 and 539 mm, respectively. Concurrently, the years with the highest dry soil to wet soil event ratios (2002, 2006, 2011, 2012) experienced the four lowest seasonal precipitation totals. Interestingly, the total number of events per year does not seem to be connected to the seasonal precipitation totals, as a similar number of events occurred in the very dry 2011 season (28) as the wet 2008 season (29). Figure 3.7b shows monthly variability of total events, broken into dry and wet. Overall dry events occur more frequently in May and June than July and August, when the number of wet events increases. 53
 shows the monthly variability of all events, color-coded into dry and wet categories.")

69 a. b. Figure 3.7. Top panel (a) shows the frequency of dry and wet events during each warm season between 2002 and The bottom panel (b) shows the monthly variability of all events, color-coded into dry and wet categories. To better describe the patterns of temporal variability shown in Figure 3.7, we combine monthly and annual frequency into one grid (Figure 3.8). The primary conclusion that can be drawn from Figure 3.8 is that the unorganized convective events tend to occur most frequently between June and August, coinciding with the peak convective season in the Southern Great Plains (Fritsch et al. 1986). 54
 they show stronger annual variability.")
70 Figure 3.8. Frequency of all unorganized convective events in each month during the study period. While all convective events together show strong monthly variability, when split into events over wet and dry soils (Figs. 3.9a, 3.9b) they show stronger annual variability. The frequency of wet events (Figure 3.9a) is relatively consistent from year to year between 2002 and 2006, with August exhibiting the most frequent wet events. This pattern is inconsistent, however in 2007 and 2008 with a considerable increase in wet event frequency for nearly all months except September and May to a lesser extent. These two very wet years are followed by a pattern similar to that of the first 5 years of the dataset. The wet event increase in 2007 and 2008 corresponds with a simultaneous decrease in dry events over the same time period. The warm season in 2007 was the 2 nd wettest on record in Oklahoma, with total precipitation more than 237 mm in excess of the 30-year mean. 55


71 a. b. Figure 3.9. Frequency of unorganized convective events in each month during the study period. The top panel shows wet events and the bottom panel shows dry events. Although the same time period in 2008 was less anomalous (25 th wettest on record), precipitation was still 75 mm more than the mean. The abundant precipitation during these two warm seasons led to near-saturated soils for the majority of the time and therefore explains why convection was preferably initiated over wetter than normal soils. On average, over the 11-year study, there is a statistically significant preference for precipitation to initiate over drier than normal soils. However, the total number of events 56
72 and ratio of dry to wet soil events exhibits considerable inter-annual and monthly variability. Wet soil events during warm seasons with less-than-normal to normal precipitation occurred most frequently in August. Seasons with dry and near-normal rainfall conditions coincided with a higher dry to wet event ratio, while convection over wet soils dominated during seasons with anomalously large precipitation totals Atmospheric Pre-Conditioning to Convection Our analysis has produced a climatology of unorganized convection in Oklahoma and connected the initiation location of these events to soil moisture conditions. This analysis is useful for determining when and where convection will occur depending on soil moisture conditions and antecedent precipitation. This section investigates the physical mechanisms that link the land surface and atmosphere. To do this, we composited convective events occurring within 50 km of Lamont, Oklahoma, where atmospheric soundings are taken daily at 0600 and 1200 LST. These events are used to quantify the relationship between the land surface and the atmosphere. The 50 km threshold was selected based on the expected representativeness of the atmospheric profile (Potvin et al. 2010) over Lamont as well as the spatial autocorrelation of soil moisture in Oklahoma. Convective events were only retained if: (1) they occurred within 50 km of Lamont, (2) afternoon precipitation was also recorded in Lamont, and (3) soil moisture percentiles in the grid cell over which convection occurred showed the same anomaly (wet or dry) as the Lamont grid cell. From these criteria, 19 events were selected for analysis. 57
73 The goal of this analysis is to document the differences in atmospheric conditions between 0600 and 1200 LST preceding convection occurring over wet soils and that occurring over dry soils. However, we also want to account for atmospheric preconditioning to convection occurring preferably over dry soils, wet soils or any soils. We used the combined indices of convective triggering potential (CTP, J kg -1 ) and low level humidity (HI, C), adopted from Findell and Eltahir (2003) to distinguish between a morning atmosphere preconditioned for convection over wet soils, dry soils or convection regardless of the land surface. CTP is derived as the integrated space between the environmental temperature profile and a moist adiabat from 900 to 700 mb. The HI is the summation of the dewpoint depression at 950 and 850 mb. The atmospheric levels used for these calculations are taken directly from Findell and Eltahir (2003) and are assumed to be relevant for Oklahoma. This comparison is important as morning atmospheric conditions from which dry soils could potentially force convection should be very different than those favoring wet soil-forced convection. Namely, dry soils can decrease CIN, and increase PBL height through enhanced surface heating, while wet soils can increase CAPE and decrease the LFC height through enhanced moisture flux. Therefore morning (0600 LST) atmospheric profiles and CTP-HI conditions over dry and wet soils should be noticeably different. Figure 3.10a shows all 19 events composited around Lamont, plotted in dual CTP-HI space with CTP on the x-axis and HI on the y-axis. 58
74 a. b. Figure Scatter plots of 19 unorganized convective events that occurred near Lamont, OK in dual convective triggering potential (J kg -1 ) - humidity index ( C) space: (a) wet events are denoted by the blue circle and dry events are denoted by a red triangle. (b) Events are grouped into 4 clusters. The shapes of the scatter points delineate whether convection occurred over wet (blue circles) or dry (red triangles) soils. The scatter plot shows distinct separation of the dry and wet soil events, particularly in the vertical (HI) and to a lesser extent in the horizontal (CTP). Atmospheric conditions prior to convection over wet soils are 59
75 characterized by an environmental temperature profile relatively close to the moist adiabatic lapse rate, with an average CTP of 139 J kg -1 and high low-level humidity (mean HI of 10 C). These conditions are similar to those that Findell and Eltahir (2003) found coincided with deep convection initiating over wet soils. Concurrently, atmospheric conditions prior to convection over dry soils have much higher CTP values (mean of 313 J kg -1 ) and higher HI (mean of 25 C). Again these conditions are consistent with deep convection initiating over dry soils in the model used by Findell and Eltahir (2003). In addition to the separation of dry and wet events in CTP-HI space, there appears to be a distinction within dry and wet events (Figure 3.10a). We clustered the 19 events using the 0600 LST CTP and HI and a hierarchical clustering algorithm with the Ward s linkage and a 4-class maximum. Clustering has been shown to be a useful method for distinguishing disparate conditions leading to the different scatter points (Khong et al. 2015), and is therefore deemed appropriate here. The result of the clustering is shown in Figure 3.10b, which displays a similar scatter plot as Figure 3.10a, only with points separated into distinct clusters. The 4 clusters span the entire CTP-HI range and increase in both CTP and HI, generally from cluster 1 to cluster 4. Interestingly, even though soil moisture is not included in the clustering analysis, the algorithm divided wet events (clusters 1 and 2) from dry events (clusters 3 and 4). The clusters are used to demonstrate the 0600 LST to 1200 LST atmospheric modification in terms of underlying soil moisture and the preconditioning of the morning atmosphere to convection over wet or dry soils. 60
76 3.3.5 Physical Connections between Soil Moisture and Atmospheric Conditions Atmospheric profiles from soundings at 0600 and 1200 LST are used to characterize conditions and modification from the morning to afternoon before convection occurs. At both 0600 and 1200 LST, we calculate the LFC (mb), PBL height (m) and surface temperature ( C). Additionally for the 0600 LST sounding, we calculate convective temperature ( C) to represent the potential for convection given adequate surface heating. We calculate CAPE and CIN (J kg -1 ) to characterize atmospheric stability at both sounding times. Large differences are seen between the clusters for all atmospheric measurements. Table 3.1. Mean atmospheric conditions at 0600 and 1200 LST from atmsopheric soundings, averaged by event cluster. Conditions summarized include convective available potential energy (J kg-1 ), convective inhibition (J kg-1 ), the level of free convection (mb), convective temperature ( C), and planetary boundary layer height (m). Cluster CAPE-12Z (J kg -1 ) CAPE-18Z (J kg -1 ) CIN-12Z (J kg -1 ) CIN-18Z (J kg -1 ) LFC-12Z (mb) LFC-18Z (mb) ConvTemp-12Z ( C) PBL-12Z (m) PBL-18Z (m) Soil Moisture (percentile)
77 Table 3.1 shows the average LFC height, CAPE, CIN, convective temperature and PBL height from 0600 and 1200 LST as well as the average 0900 LST soil moisture percentile for events in each cluster. CAPE (CIN) values are much higher (lower) at both 0600 and 1200 LST for clusters 1 and 2 events, corresponding with relatively wet soils. Additionally, these clusters have relatively lower LFC and PBL heights and much lower 0600 LST convective temperature values. In direct contrast, dry soil events in clusters 3 and 4 are characterized by relatively low (high) CAPE (CIN) values, deeper PBLs and higher LFC heights. However, more interesting than atmospheric conditions at any one point during the day are the modifications of atmospheric conditions between 0600 and 1200 LST. Figure 3.11 shows scatter plots of the soil moisture percentiles and the 1200 LST 0600 LST difference in (a) LFC height (mb), (b) PBL height (m), while Figure 3.12 shows scatter plots of soil moisture percentiles and the 1200 LST 0600 LST difference in (a) surface temperature ( C). Additionally, Figure 3.12b shows the same scatter plot as 3.12a, only with 0600 LST convective temperature on the y-axis. The relationships between soil moisture and the change in LFC height, PBL height and surface temperature are negative, such that drier soils correspond to increased LFC height, strong PBL growth and increased surface air temperatures. The change in these three atmospheric conditions is typical of atmospheric response to strong sensible heat flux from a land surface that is moisture-limited (Brimelow et al. 2011; Santanello et al. 2011). In contrast, events from clusters 1 and 2 show limited PBL growth, decreased LFC heights and smaller changes in surface temperature from 0600 to 1200 LST. 62
78 a. b. Figure Soil moisture percentiles and atmospheric conditions from 19 unorganized convective events occurring near Lamont, OK. The plots show soil moisture percentiles with (a) changes in LFC height (mb), and (b) changes in PBL height. This is characteristic of atmospheric response to strong latent heating from a relatively wet land surface. Despite the small sample size, all of the relationships depicted in Figures 3.11 and 3.12 are statistically significant. Coefficient of determination for soil moisture and change in LFC height, PBL height and surface temperature are 0.26, 0.49 and 0.60, respectively. Obviously the relationship between 63
79 soil moisture and near-surface atmospheric temperature is strongest; however, even with varying atmospheric conditions from 19 events, soil moisture percentiles at 0900 LST still explain more than 25% of the variance in LFC height change from 0600 to 1200 LST. a. b. Figure Soil moisture percentiles and atmospheric conditions from 19 unorganized convective events occurring near Lamont, OK. The plots show soil moisture percentiles with (a) changes in surface air temperature ( C), and (b) 0600 LST convective temperature. 64
80 Along with changes in atmospheric temperature and LFC/PBL heights, we also correlate soil moisture percentiles from the 19 events to atmospheric stability. Figure 3.13a shows scatter plots of soil moisture percentiles and the change (difference) in CAPE (ΔCAPE, J kg -1 ) between 1200 and 0600 LST. Figure 3.13b shows the same scatter plot, only showing the 1200 LST 0600 LST change in CIN (ΔCIN, J kg -1 ), again delineated by cluster. For clarity, negative ΔCIN represents a decrease in CIN (decrease in stability) between 0600 and 1200 LST. The general relationship between soil moisture and both ΔCAPE and ΔCIN are positive, with (wet soil) events in clusters 1 and 2 corresponding with larger (smaller) changes in CAPE (CIN). Drier than normal soils enhance sensible heating at the surface, which results in increased near-surface air temperature and heating of the air parcel near the surface (Figure 3.12a). The enhanced warming of the surface allows the surface temperature to approach (or to exceed) the convective temperature, eroding CIN. Wet soils diminish surface heating, which results in a negligible decrease or slight increase in CIN between 0600 and 1200 LST. Concurrently, wetter than normal soils enhance moisture flux to the atmosphere through increased latent heating. This decreases the level of the LFC (Figure 3.11a) and increases CAPE throughout the profile. Through the modification of CAPE and CIN, both wet and dry soils have the potential to initiate convection, and in the case of our 19 events, are physically linked to modifications of the atmosphere. A surprisingly large amount of ΔCAPE and ΔCIN variance is explained by morning soil moisture percentiles, with coefficient of determination values of 0.42 (42% variance) and 0.77 (77% variance), respectively. 65
81 a. b. Figure Plots are similar as those in Figure 3.10, only (a) shows soil moisture percentiles and changes in CAPE, while (b) shows soil moisture and changes in CIN. Through the manual event identification procedure, we were able to quantify individual event duration (hours), average size (pixels) and total volumetric precipitation (mm). We relate these event characteristics to precedent land surface and atmospheric conditions using correlation analysis and scatter plots similar to those in Figures 3.11 and All three event characteristics (duration, size, total precipitation) are 66
82 significantly related to the change in PBL height (m) between 0600 and 1200 LST (Figures 3.14a, 3.14b). Figure 3.14 shows PBL height with event size and total precipitation, while the PBL scatter plot with event duration is shown in Appendix A (A- 3). a. b. Figure Scatter plots between the change in planetary boundary layer height between 0600 and 1200 LST and (a) average event size, and (c) total event precipitation. 67
83 The scatter plots show negative relationships between PBL height change and all three characteristics, meaning that larger PBL growth (over predominantly drier soils) results in events with shorter duration, smaller size and less overall precipitation. The coefficient of determination between the change in PBL height and duration, size and total precipitation are 0.22, 0.31 and 0.40, respectively. Two of the three characteristics, duration and total precipitation, are significantly related to CAPE at 0600 LST (Figs. 3.15a, 3.15b). The scatter plots show positive relationships between morning CAPE and event duration and total precipitation, with coefficient of determination values of 0.41 and 0.85, respectively. The soil moisture percentile over which precipitation initiates is not significantly related to event characteristics. 3.4 Summary Discussion Previous studies have found evidence of a wet-positive soil moisture feedback in which anomalously wet soils increase latent heating, decrease surface temperatures, the lifting condensation level, and the level of free convection, and increase CAPE (Pielke, 2001; Pal and Eltahir, 2003; Ferguson and Wood, 2011). In contrast, other studies have found that anomalously dry soils can impact convective initiation more strongly than wet soils through increased heat flux, surface heating, decreased CIN and increased PBL height (Santanello et al. 2009; Taylor et al. 2012). 68
84 a. b. Figure Scatter plots between 0600 LST convective available potential energy and (a) convective event time duration and (b) total event precipitation. 69
85 Our results show a statistically significant preference for unorganized convection to occur over drier than normal soils, although there are a non-negligible number of events that occur over wet soils. Importantly, the ability of our analysis to discern between unorganized convection and organized systems affiliated with frontal passage and low-pressure systems is dependent on our precipitation event identification. Automated event identification algorithms using other datasets, such as CMORPH, tend to lump together unorganized convective events (e.g., those initiating from local-scale processes), with large-scale frontal systems and tropical storms that do not initiate over the region of interest (Wang et al. in review). We compare maximum hourly precipitation accumulation between the 477 events identified here using NEXRAD and the 353 events identified in Ford et al. (2015) using CMORPH (Figure 2.3d). The CMORPH events have a significantly larger median maximum hourly accumulation rate, as determined using the Kruskill-Wallis test, than the NEXRAD events. However, the largest differences between the datasets are in the right tail of the distribution, with many CMORPH event accumulation rates exceeding 100 mm/hr. The occurrence of extremely large precipitation rates in the CMORPH dataset suggests that events associated with large-scale systems are being included in the 353 events. Therefore, the lack of agreement between the results of this chapter and previous studies (Taylor et al. 2012; Ford et al. in 2015) can be partly attributed to the different data products and methods used for event identification. With these results in mind, we argue that our manual event identification procedure works best for (1) identifying the point of precipitation initiation and (2) separating unorganized from organized convective events. Therefore, we have 70
86 confidence in our assessment of the relationships between soil moisture and unorganized convective events. One caveat of this manual identification procedure is that the unorganized events identified are accountable for only a small proportion of total warm season precipitation (Table 3.1), suggesting that large-scale organized convection and/or stratiform precipitation systems contribute the majority of May September precipitation in Oklahoma. After compositing 19 events near Lamont, OK where atmospheric sounding observations were available, we found strong connections between soil moisture and atmospheric modification between 0600 LST and 1200 LST. The strongest modification was to CIN and surface air temperature during this time period, as soil moisture explained 77% and 60% of the variance, respectively. Soil moisture has been previously connected to changes in near-surface air temperature in Oklahoma, albeit at much longer time scales (Ford and Quiring, 2014b). Basara and Crawford (2002) also found that the daily evolution of the PBL, including 2 m air temperature, was connected to soil moisture anomalies on clear sky days. The strong connection between soil moisture and CIN is mechanistically consistent with enhanced (diminished) surface heating over dry (wet) soils. Myoung and Nielsen-Gammon (2010) showed that on monthly time scales, CIN was a better determinant to the occurrence of precipitation during the warm season in Texas. However, their results also showed a strong, negative relationship between soil moisture and CIN such that drier than normal soils resulted in stronger CIN values and therefore stronger atmospheric stability (Myoung and Nielsen-Gammon, 2010). The results from our analysis are not necessarily in disagreement because we evaluated the 71
87 relationship between soil moisture and the 0600 to 1200 LST change in CIN. In fact, as Table 3.1 shows, 0600 LST and 1200 LST CIN values were strongest over dry soils; however, the enhanced surface heating attributable to a moisture-limited land surface in these cases allowed for a larger overall decrease in CIN over dry soils. It should be noted that although stronger CIN over drier than normal soils (e.g., Myoung and Nielsen- Gammon, 2010) can be considered a deterrent for convection, dry soils can also erode strong capping much more quickly than wetter soils due to increased sensible heating Conclusion We connect in situ observations of soil moisture from more than 100 stations in Oklahoma from to instances of warm season, unorganized convection, identified using hourly, high resolution NEXRAD radar images. Overall, we find a statistically significant preference for precipitation initiation over drier than normal soils, with over 70% of events initiating over soil moisture below the 50 th percentile. The effects of land cover and moisture gradients on the spatial organization of convective events was found to be negligible. The ratio of wet to dry events over Oklahoma varies as a function of the amount of precipitation received during the warm season (May September), while the total number of events cannot be attributed to any single aspect. We use a sub-sample of 19 convective events occurring near Lamont, Oklahoma to characterize atmospheric conditions at 0600 and 1200 LST. These events are clustered based on atmospheric pre-conditioning to convection over wet and dry soils. We then composite changes in atmospheric conditions between 0600 and 1200 LST for each cluster. We find strong, statistically significant relationships between soil moisture and 72
88 several atmospheric indices. Namely, soil moisture is negatively correlated with LFC height, PBL height and surface temperature changes, and is positive correlated with changes in CAPE and CIN. These relationships are mechanistically consistent with wetpositive and dry-negative feedbacks. This study demonstrates that both positive and negative soil moisture feedback to precipitation are relevant in this region of the United States. 73
89 CHAPTER IV SYNOPTIC CONDITIONS RELATED TO LAND-ATMOSPHERE INTERACTIONS AND UNORGANIZED CONVECTION 4.1 Introduction Scales of Soil Moisture Precipitation Feedback Anomalies of land surface moisture and energy have the potential to impact regional climate on time scales ranging from daily to seasonal. One of the more fascinating and widely-studied interactions is that between soil moisture and precipitation. In semi-arid regions, such as the United States Southern Great Plains, soil moisture has a significant influence on evapotranspiration rates (Teuling et al. 2006) and latent and sensible heat flux (Guillod et al. 2014; Ford et al. 2014a). Modification of evapotranspiration and moisture flux to the atmosphere can impact regional climate. Soil moisture memory (Wu and Dickinson, 2004), or persistence of anomalously dry or wet conditions, can force long-lasting anomalies in temperature and precipitation. This makes soil moisture important for seasonal climate predictions. Roundy et al. (2013) demonstrated the importance of soil moisture conditions for drought monitoring and forecasting in the Southeast U.S. Anomalously dry soils can influence the persistence of extreme heat events in Europe (Hirschi et al. 2010) and the United States (Ford and Quiring, 2014). Soil moisture is connected with the atmosphere through the partitioning of incoming energy into sensible and latent heating. The mechanisms and forcings that modify this relationship vary depending on the spatial and temporal scales of analysis. 74
90 Many recent studies examining diurnal soil moisture precipitation interactions have focused on the mechanistic modification of atmospheric conditions at a local scale by the land surface through energy exchange. Santanello et al. (2009) used observations of soil moisture and atmospheric conditions to demonstrate the modification of atmospheric moisture and energy by the land surface at the hourly time scale. Phillips and Klein (2014) linked land surface moisture with coincident variability in atmospheric conditions in the Southern Great Plains. By establishing connections between surface flux anomalies, forced by soil moisture, and corresponding variations of atmospheric moisture and energy, these studies have helped to further our knowledge of the physical mechanisms driving land-atmosphere interactions. Land surface moisture anomalies and heterogeneity can enhance or inhibit precipitation through modification of the lifting condensation level (LCL) height, altering the potential for deep convection to initiate (Brimelow et al. 2011). The height of the afternoon LCL and level of free convection (LFC) are decreased when there is a sufficient moisture flux from the land surface. This reduces convective inhibition (CIN) and increases convective available potential energy (CAPE). These mechanisms act as a wet (positive) soil moisture precipitation feedback in which wetter than normal soils decrease atmospheric stability and strengthen the probability of subsequent convective precipitation (Findell et al. 2011). Conversely, increased sensible heating over drier than normal soils leads to increased LCL and LFC heights, which can enhance atmospheric stability (Frye and Mote, 2010a). Concurrently, enhanced surface heating over dry soils also increases planetary boundary layer (PBL) 75
91 growth, and can more quickly erode capping inversions and CIN to increase the probability of deep convection (Santanello et al. 2009). Soil moisture heterogeneity and corresponding surface heat flux gradients can also enhance instability and force mesoscale circulations leading to precipitation (Weaver 2004; Frye and Mote, 2010b). Taylor et al. (2011), for example, found a preference for convective cloud development on the dry side of strong wet-to-dry soil gradients in the Sahel region of Africa. Model and observation studies at relatively fine spatial resolution have shown that precipitation can be triggered by wet and dry soil anomalies as well as surface heterogeneity (Alfieri et al. 2008; Taylor et al. 2011; Santanello et al. 2013). Meanwhile, global climate models show consistent positive (wet) soil moisture precipitation feedbacks (Koster et al. 2004), sometimes in direct contrast to observation-driven results (Taylor et al. 2012). Strong atmospheric response to relatively dry soils and surface heterogeneity, leading to afternoon precipitation over dry soils in Taylor et al. (2012) was contrasted with consistent positive feedback in a suite of general circulation models (GCMs). The spatial resolution of these models has a major impact on their ability to accurately simulate these interactions (Taylor et al. 2013), as cloud cover and precipitation response to surface flux anomalies is on the scale of tens of kilometers (Weaver and Avissar, 2001; Allard and Carleton, 2010; Taylor et al. 2013) Role of the Synoptic Environment The Southern Great Plains is identified as a hot spot of land-atmosphere interactions (Koster et al. 2004). The semi-arid climate of the Southern Great Plains 76
92 represents a moisture-limited environment (e.g., Seneviratne et al. 2010) throughout most of the warm season (May September). Over this time period, the majority of precipitation is sourced from deep convection, driven in part by moisture advected from the Gulf of Mexico by the Great Plains low-level jet (Frye and Mote, 2010a). This region is also influenced by advancing low pressure systems, squall lines, and the occasional tropical cyclone. In general, the warm season in the Southern Great Plains is characterized by a variety of synoptic-scale atmospheric conditions, some of which have been shown to be strongly associated with local-scale drivers of convection (Weaver, 2004). Despite the wealth of studies examining soil moisture precipitation feedbacks in this region, very few have focused on the role of the larger-scale, synoptic environment. The studies which have considered forcings at this scale with regard to land-atmosphere interactions in the Midwest and Southeast United States have identified synoptic-scale atmospheric conditions conducive to mesoscale convection driven by land surface heterogeneity (Dixon and Mote, 2003; Carleton et al. 2008; Allard and Carleton, 2010). Determining the atmospheric conditions most/least frequently associated with mesoscale convection aids forecasting of such events and contributes to the understanding of mechanisms at different scales which can impact land-atmosphere interactions. The focus of this chapter is to determine synoptic-scale atmospheric conditions most, and least frequently associated with unorganized convection in Oklahoma, and to relate these patterns to soil moisture precipitation coupling. Three objectives address our research focus, namely: (1) determining synoptic patterns that are 77
93 most and least frequently associated with unorganized convective events in Oklahoma, (2) compositing atmospheric conditions during such patterns that may lead to more or less frequent events, and (3) documenting how soil moisture precipitation coupling functions under these synoptic patterns. The paper is organized as follows: section 2 introduces the datasets and methods, section 3 describes synoptic patterns associated with enhanced and suppressed convective activity, and section 4 discusses the results and implications the future of land-atmosphere interaction studies. 4.2 Data and Methods Soil Moisture Our analysis of synoptic-scale atmospheric patterns is separated into two categories: (1) convective precipitation that initiates over drier than normal soils, and (2) convective precipitation that initiates over wetter than normal soils. This classification is based on daily soil moisture observations from the Oklahoma Mesonet ( Illston et al. 2008), a state-wide monitoring network containing over 100 stations. Several meteorological and hydrological variables are monitored at sub-hourly time scales at each station, including soil temperature and moisture at 4 depths (5, 25, 60, 75 cm) in the subsurface Daily, mid-morning (0900 LST) soil moisture observations are taken for this study to best represent morning soil moisture conditions prior to convective initiation. We convert daily volumetric water content observations to percentiles. Percentiles are then gridded at a 0.25 resolution using the average of all stations within each grid cell. The soil moisture percentile grid is used to determine if convective precipitation initiated 78
94 over dry or wet soils. Soil moisture at the point of precipitation initiation that is less than or equal to the 25 th percentile of volumetric water content is considered very dry, while values greater than or equal to the 75 th percentile of volumetric water content are very wet. Synoptic atmospheric conditions that are more or less frequently associated with convective precipitation over dry and wet soils, and the conditions forcing the associations, are easier to detect when separating events into those that occur over dry and wet soils. In addition to soil moisture percentiles, we use the 0900 LST volumetric water content measurements to characterize state-wide soil moisture patterns during days with and without convective events. Station-based measurements of daily maximum temperature ( C), dew point temperature ( C), relative humidity (%), vapor pressure deficit (mb), and solar radiation (MJ m -2 ) are used to identify how the near-surface atmosphere is modified by soil moisture conditions Precipitation Events Convective precipitation events are taken from the same set as in Chapter III, which were identified using ground-based Doppler radar from the National Weather Service Next-Generation (NEXRAD) radar network. Through this event identification procedure, 477 unorganized events were identified during the warm season (May September) between 2002 and 2012 in Oklahoma. These events were used to evaluate synoptic patterns more/less associated with unorganized convection over dry and wet soils. 79
95 4.2.3 North American Regional Reanalysis The North American Regional Reanalysis (NARR) climate dataset (Mesinger et al. 2006) is used to characterize low-level and mid-level atmospheric conditions. NARR is a relatively high resolution (32 km) atmospheric and land surface dataset that covers the entirety of North America. Variables are available from at 3-hourly and monthly resolutions. Because of the short time scales at which unorganized convective events operate, we use the 3-hourly data. NARR assimilates observations from several sources including rawinsondes, aircraft, and geostationary satellites, as well as model simulations NARR is used in this study because of its relatively high spatial and temporal resolution. NARR is used to characterize synoptic-scale atmospheric conditions associated with unorganized convective events. The variables analyzed include geopotential height anomalies (m), zonal and meridional wind velocities (m s -1 ), integrated moisture flux (kg m -2 ), and total column precipitation water (mm). These variables are composited for all convective events, as well as separated for convective events over dry and wet soils. The composite conditions associated with events are then compared with variable composites over all days (event and non-event) in which a specific synoptic pattern occurs. In addition, NARR is used to characterize atmospheric stability and convective energy for different synoptic atmospheric patterns. Atmospheric soundings from Lamont, Oklahoma are used to validate NARR representation of CAPE, CIN, and surface temperature at 0600 and 1200 LST, as well as the LST change in each of the three components (Table 4.1). Correlations between NARR and the Lamont 80
96 observations are consistently strongest for CIN and surface temperature, and slightly lower for CAPE. Interestingly, NARR is able to better capture the variability of all three parameters at 0600 and 1200 LST, but shows consistently lower correlations for the LST change, arguably most important for demonstrating soil moisture impact on convective initiation. However, in this chapter, we only use NARR to characterize the overall environmental conditions prior to convective initiation, and therefore the relatively good correspondence between NARR and the observations provides confidence in NARR s representation. Table 4.1. Correlations between NARR and sounding-observations of CAPE, CIN, and surface temperature at 0600 and 1200 LST, as well as the LST change LST 1200 LST LST CAPE CIN Surface Temp Self-Organizing Maps Classification of regional patterns of atmospheric conditions is common in synoptic climatology, and it is useful for data reduction as well as for evaluating the impact of synoptic-scale patterns on surface conditions (e.g., Kalkstein et al. 1996; Frauenfeld and Davis 2002; Hanna et al. 2011; Dayan et al. 2012; Vanos et al. 2014). Procedures range from manual classification of atmospheric pressure maps (Frakes and Yarnal, 1997) to neural networks and machine learning (Mihalakakou et al. 2002). One methodology for synoptic classification that has been gaining popularity in climate 81
97 science is self-organizing maps (SOMs), originally introduced by Kohonen (1989). SOMs provide a useful method for visualizing nonlinear associations throughout a continuum of atmospheric conditions (Hewitson and Crane, 2002). Sheridan and Lee (2011) provide an exhaustive review of the advantages and disadvantages of SOMs, as well as several examples of SOM application in climate research (e.g., Cassano et al. 2015). We implement SOMs to classify synoptic-scale patterns of 500 hpa geopotential height anomalies (m) for all days between May and September, (1683 days). The study area is N and W. Investigation of mid-level (i.e., 500 mb) atmospheric patterns provides valuable information for diagnosing and predicting weather conditions at the surface and in the low-level atmosphere (Michaelides et al. 2010; Sheridan and Lee, 2011). The SOM procedure is similar to that described in Michaelides et al. (2010). For our classification, input of daily geopotential height anomalies were randomized and the network was trained for 5,000 iterations or epochs. The neighborhood search size began as 90% of the number of output layer neurons (e.g., Michaelides et al. 2010), and was automatically decreased as training progressed. The result of the procedure is a P Q matrix of patterns or clusters, in this case, days, where P and Q represent the rows and columns of the matrix, respectively. The dimensions of this matrix are subjectively chosen based on the study needs. For example, a large matrix (36 or 48 patterns) will provide more detailed information about each pattern; however it will be much more difficult to interpret. A small matrix (4 or 8 82
98 clusters) will be more straightforward to interpret, but may lead to overgeneralization of patterns. We tested pattern matrices of 8, 12, 16 and 20 patterns (not shown). No visual differences were discernible, particularly between the 12 and 16 cluster solutions. Because we only classified geopotential height anomalies during the warm season, we concluded that a 12 cluster solution (3 x 4) is ideal. The 12 synoptic patterns are related to the frequency of convective events to determine if the synoptic-scale atmospheric circulation has an influence on land-atmosphere interactions (Figure 4.1) Spatial Synoptic Classification Another method of synoptic classification is the Spatial Synoptic Classification (SSC), developed to classify weather types (Sheridan, 2002). The SSC classifies weather types based on surface observations at individual stations. Temperature, dew point, wind, pressure, and cloud cover are used for the procedure, making the SSC a representation of surface conditions (Sheridan, 2002). The SSC classification is independent of the SOM classification because one is based on surface meteorological observations and the other on 500 hpa geopotential height anomalies. Overall, the SSC classifies weather types into one of 8 types, distinguished by the temperature and moisture content of the near-surface air. These types include dry polar (DP), dry moderate (DM), dry tropical (DT), moist polar (MP), moist moderate (MM), moist tropical (MT), and transitional (T). The transitional days are those in which large changes in pressure, dew point, and wind occur over the course of a day, representing a 83
99 shift from one weather type to another. The eighth weather type is moist tropical plus (MT+), which represents a more intense moist tropical weather type. Each calendar day is classified for an individual surface observation station. We use the daily SSC classification for Oklahoma City from 2002 to 2012 to represent the dominant weather type over the region. The nearest SSC station to Oklahoma City is Tulsa in northeast Oklahoma. All SSC-classified days over the study period were compared between Tulsa and Oklahoma City, with generally good correspondence. The two cities had the same classification over 75% of the time for MT, MT+ and DP weather type, over 70% of the time for DM and MM weather type, and over 60% of the time for DT, MP and T weather type. Although not identical, the similarities between Oklahoma City and Tulsa, along with the typical geographic size of these weather types, suggested that the SSC classification at Oklahoma City is representative of conditions across the state HYSPLIT The NOAA Hybrid Single-Particle Lagrangian Integrated Trajectory (HYSPLIT) model ( was used to identify the source region of air masses associated with unorganized convective events. The HYSPLIT model provides three-dimensional movement of air parcels in time. HYSPIT was run using data from NARR to maintain consistency with the SOMs. Air mass back trajectories were run in two different setups (Figure 4.1). First we used the model to develop a climatology of air mass back trajectories for every day during the study period. A back trajectory was determined from each location in a 50-84

100 point grid over the study area. The trajectories were initiated over each grid point at 850 hpa and 1200 LST, and run 48 hours back in time. This was repeated for each day throughout during the study period. The culmination of these trajectories allow us to identify the typical air mass origin for each day (Figure 4.1a). Figure 4.1. Example HYSPLIT air mass back trajectories run (a) as a 1 1 matrix over the study region, and (b) from an individual event. All trajectories are initiated at 1200 LST from 850 hpa and run 48 hours back in time. A second set of trajectories was calculated for the specific convective events. These trajectories were also initiated at 850 hpa at the location of precipitation initiation and run 48 hours back in time from 1200 LST (Figure 4.1b). Composites of atmospheric variables, SSC weather types and air mass back trajectories were calculated for each SOM to test whether the synoptic-scale environment has an impact on unorganized convection in Oklahoma. 85
101 4.3 Results SOM Patterns Daily composites of morning ( LST) geopotential height anomalies over the Southern Great Plains region were used to define the SOM network. The result are 12 patterns of 500 hpa geopotential height maps (Figure 4.2). The top left pattern shows an upper-air trough to the northwest of Oklahoma. This is contrasted by the bottom right pattern, which shows a mid-level ridge centered over the Southern Great Plains. Patterns 7 and 8 correspond with strong to very strong upper-air ridges and centers of high pressure at the surface, while patterns 3 and 6 show upper-air troughs to the north and northeast; both are common features during the warm season months. The patterns with strong ridging exhibit weak synoptic flow, generally from the south or west. Spatial patterns of soil moisture and event precipitation initiation within each SOM are displayed in Appendix A (A-4 to A-7). We use daily precipitation measurements from 120 Oklahoma Mesonet stations to characterize precipitation. Total daily precipitation accumulation (mm) from each (for example) pattern 1 day are averaged for each of the 120 stations and displayed as a colored point on the maps in Appendix A. From these maps we can visualize both the average precipitation amount as well as the spatial variability of precipitation associated with each SOM pattern. Patterns 1, 2, and 4 contribute the post precipitation, particularly across the northern half of the study region. 86
 composites associated")
102 Figure 4.2. Mean 500 hpa geopotential height (m) composites associated with each of 12 self-organizing map (SOM) patterns. 87
103 This isn t surprising, as these patterns are associated with upper-level troughs to the northwest of the study region, and strong low-level southerly to southwesterly flow characteristic of the Great Plains LLJ. The remaining SOM patterns show generally less precipitation across Oklahoma, particularly those associated with upper-level troughs to the northeast (patterns 9 and 10). We calculate the contribution of total (May September) precipitation from unorganized convective events within each SOM pattern (Figure 4.3). The blue line in Figure 4.3 represents the mean precipitation contribution (%) for each SOM pattern, calculated over all 11 years in the study period. The black intervals extend from the maximum contribution to the minimum contribution between 2002 and In general, the patterns which occur most often (3, 7, 12) are associated with the highest percent contribution. Similar to the results shown in Figure 3.3, the overall average May September precipitation contribution of any of the SOM classes is less than 10%, with maximum contributions all less than 25%. Because of the conditions favorable for unorganized, deep convection to initiate, certain synoptic patterns may be more or less frequently associated with convective events. To test whether the frequency of each SOM pattern is anomalous on unorganized convective days, we select random event and non-event days equal to the total number of event days (477). We then calculate the frequency of each SOM pattern within the group of 477 randomly-chosen days. A bootstrapping procedure is employed so that the random selection of days is repeated 10,000 times. This produces a distribution of the typical frequency associated with each SOM pattern (Figure 4.4). 88
104 Figure 4.3. Percent (May - September) precipitation contribution from each SOM pattern, calculated for each year between 2002 and The blue line represents the 11-year mean contribution (%), while the black intervals extend from the minimum to the maximum contribution. The mean of the distribution represents how frequently a particular SOM should occur. The actual frequency of each SOM over the 477 convective event days (black line) is then compared to these distributions to test if the SOM frequency is statistically significantly different than what would be expected by chance (Figure 4.4). If the frequency of an SOM pattern is smaller than the 2.5 percentile or larger than the 97.5 percentile of the frequency distribution, then that pattern occurs less and more frequently, respectively on days with unorganized convection than expected by chance. The frequencies of patterns 5, 6, and 10 on days with unorganized convection are statistically significantly lower than expected. These patterns are associated with 500 hpa troughs to the northeast and predominantly northwesterly flow into the region. 89

105 Patterns 7, 8, and 12 occur significantly more frequently on days with unorganized convection than expected. Figure 4.4. Frequency distributions of SOM patterns based on 10,000 iterations of randomly chosen sets of 477 days. The black line represents the observed frequency of each pattern for the 477 convective events. Patterns which occur at a statistically significantly (95% confidence level) different rate are denoted by an asterisk. These patterns are associated with ridging over the majority of the region and an upper-air high to the southeast. If we separate events occurring over very wet soils (percentile > 75) from those occurring over very dry soils (percentile < 25), we see that anomalous frequencies of patterns 5, 6, 7, 8, 10, and 12 are attributable to the occurrence, or lack thereof, of events over very dry soils (Figure 4.5). Patterns 5, 6, and 12 show a statistically significant preference for convective events to precipitate over very wet soils, with very few events precipitating over drier soils. 90
 in the frequency of occurrence between wet and dry soils are denoted with a star The opposite is true for")
106 Figure 4.5. Percent of convective events that occur over dry (red) and wet (blue) soils, reported for each SOM pattern. Patterns that exhibit a statistically significant difference (95% significance level) in the frequency of occurrence between wet and dry soils are denoted with a star The opposite is true for patterns 7, 8, and 12, which show a strong, significant preference for event precipitation to initiate over very dry soils. In general, we find that there is an association between the synoptic-scale environment and whether conditions are more or less conducive to convection. The results are also consistent with the dominant precipitation patterns associated with each SOM pattern (Appendix A). Patterns associated with the most precipitation (1, 2, 4) most likely experience the passive of large-scale organized convective precipitation systems or even stratiform systems that would be removed by the event identification procedure. Therefore, it is not surprising to see that these patterns are not significantly more frequently associated with unorganized events. The subsequent analysis will only focus on the patterns that exhibit statistically significant changes in frequency on days with unorganized convection. 91
107 a. b. c. d. Figure 4.6. Trajectory roses displaying the direction of origin of HYSPLIT back trajectories for (a, b) all days and (c, d) convective event days for patterns (left) 5 and (right) Patterns Not Associated With Convection SOM patterns 5, 6, and 10, each characterized by upper-air troughs, occur less often than expected on days with unorganized convection (Figure 4.4). We examine HYSPLIT air mass trajectories to determine the typical origin of air masses associated with patterns 5 and 6, and compare them to the trajectories associated with convective events (Figure 4.6). The direction or origin for all pattern 5 and 6 event day air masses are displayed as trajectory roses (Figures 4.6a and 4.6b). These are contrasted by roses of 92
108 air mass origin directions for all pattern 5 and 6 days (event and non-event) displayed in Figures 4.6c and 4.6d. These radial plots show the distribution of the trajectories as a percent of total days. Therefore, a trajectory-rose petal facing due south represents events which originate from a southerly direction. Trajectory plots from all days and just event days during each SOM pattern are shown in Appendix A (A-8, A-9). For both patterns 5 and 6, a large proportion of typical trajectory origins are from southeasterly and northwesterly directions. In comparison, the trajectories associated with convective events show a clear preference for southerly and southeasterly origins; more so for pattern 5 than 6. This difference in the dominant direction of atmospheric circulation corresponds to an increase of moist tropical weather types from just 28% of all pattern 5 days to over 48% for pattern 5 event days. A similar increase in moist tropical weather types occurs for pattern 6, for which 24% of all days and 40% of event days are moist tropical. These increases represent a nearly 60% increase in the prevalence of moist tropical weather types for patterns 5 and 6 during unorganized convective days as compared the prevalence during all days. Changes in low-level atmospheric flow on days with unorganized convection suggests that SOM patterns 5 and 6, combined with northerly low-level flow, are not conducive to unorganized convection. However when southerly to southeasterly flow is combined with patterns 5 and 6, instability and the corresponding likelihood of convection seemingly increases. 93
 and (d) show composites of precipitable water on the same days.")
109 a. b. c. d. Figure 4.7. Composites of integrated moisture flux during patterns 5 and 6 (a) southerly flow days and (b) northerly flow days. Panels (c) and (d) show composites of precipitable water on the same days. The matrix of HYSPLIT back trajectories initiated from every pattern 5 and 6 event and non-event day are used to determine if that day s low-level wind direction was primarily out of the north or south. For a day to be considered as having a northerly lowlevel wind, at least 75% of the HYSPLIT air mass trajectories must have initiated north of the initiation point. Pattern 5 and 6 days with northerly flow (132 total) are compared 94
110 against those with southerly flow (165 total) with respect to the conduciveness of atmospheric conditions to unorganized convection. Total integrated atmospheric moisture flux composites from northerly flow and southerly flow pattern 5 and 6 days (Figures 4.7a, 4.7b) show larger moisture fluxes associated with southerly flow, particularly over eastern Oklahoma. The patterns of total precipitable water follow those of moisture flux, with a much wetter atmosphere associated with southerly flow during patterns 5 and 6 (Figures 4.7c, 4.7d). Increased atmospheric moisture associated with southerly low-level winds results in significantly larger CAPE values across the entire state as compared with CAPE on northerly flow days (Figure 4.8). This pattern is consistent for both 0600 LST CAPE and 1200 LST CAPE, composited from NARR. Not surprisingly, southerly low-level winds advect moisture into the Southern Great Plains from the Gulf of Mexico, decreasing atmospheric stability and increasing energy available for deep convection. This explains why frequent northerly and northwesterly low-level winds during pattern 5 and 6 days are associated with fewer unorganized convective events. SOM patterns 5 and 6 exhibit a statistically significant preference for unorganized convective precipitation to initiate over wetter than normal soils (Figure 4.4). This is not necessarily attributable to prevalent northerly low-level winds described previously, but instead could be due to suppression of convective processes associated with surface heating over dry soils. 95

111 a. b. Figure 4.8. Convective available potential energy at 1200 LST from pattern 5 and 6 days with predominantly (a) northerly 850 hpa flow and (b) southerly 850 hpa flow. 96
112 Dry soils partition incoming energy into sensible heating (Ford et al. 2014a), which increases near-surface air temperature (Ford and Quiring, 2014). Preferential heating near the surface erodes CIN and can potentially push the PBL to the LFC and initiate deep convection (Santanello et al. 2009; Ford et al. 2015). Daily vapor pressure deficit (mb) anomalies at each Oklahoma Mesonet station, composited from all pattern 5 and 6 days with events over dry soils, show mostly negative anomalies (Figure 4.9a). Despite predominantly dry soils in the region, vapor pressure deficit values are generally less than normal, representing a wetter than normal low-level atmosphere. Daily maximum temperature anomalies (Figure 4.9b) from the same set of days show small, positive anomalies in the southwest and stronger, negative anomalies towards the northeast. These patterns are in strong contrast with the strong positive vapor pressure and maximum temperature anomalies from all dry soil events from patterns 7 and 8 (Figures 4.9c, 4.9d). One would expect that if dry soils were to modify the low-level atmosphere enough to force convection, vapor pressure deficit would be enhanced, and maximum temperatures increased across the state (i.e., patterns 7 and 8). The absence of these conditions during convective events over dry soils in patterns 5 and 6 suggests that atmospheric conditions forced by these patterns are not conducive to land-surface induced convective initiation. 97
 vapor pressure deficit")
 5 and 6 events over dry")
113 a. b. c. d. Figure 4.9. Daily average (a,c) vapor pressure deficit anomalies and (b,d) maximum temperature anomalies from all pattern (a,b) 5 and 6 events over dry soils and (c,d) 7 and 8 over dry soils. 98
114 Similar to patterns 5 and 6, pattern 10 occurs with significant less frequency than expected during unorganized convective events. Pattern 10 is associated with a deep trough at 500 mb over the Great Lakes and another trough over the eastern part of the study region. These features force strong northwesterly to northerly winds, particularly over western Oklahoma. All the low-level HYSPLIT trajectories for pattern 10 days (Figure 4.10a) and pattern 10 convective events (Figure 4.10b) show a predominantly northwesterly origin. a. b. Figure Same as Figure 4.6, showing HYSPLIT back trajectory direction for (a) all pattern 3,2 days and (b) pattern 3,2 convective event days. Over 50% of all pattern 10 days exhibit a dry moderate weather type, and this weather type is negatively correlated with the occurrence of unorganized convective events. An increase in dry moderate conditions corresponds to a reduction in the number of unorganized convective events over dry and wet soils. Dry moderate days are associated with a dry, cool air in the low-level atmosphere, which may inhibit instability over both wet and dry soils. 99
115 4.3.3 Patterns Associated With Convection SOM patterns 7, 8, and 12 occur more frequently than expected on days with unorganized convection. Each of these patterns also exhibits a statistically significant preference for convective precipitation to initiate over very dry soils. SOM patterns 7, 8, and 12 are characterized by ridging over the study region at 500 mb, and high pressure at the surface. These conditions force weak synoptic flow at 500 hpa (Figure 4.2) and are typically associated with reduced cloud cover and strong evaporative demand. Figures 4.11a, 4.11b, and 4.11c show daily total solar radiation anomalies (MJ m -2 ), vapor pressure deficit anomalies (mb), and maximum temperature anomalies ( C) from Oklahoma Mesonet stations during pattern 7 convective event days over dry soils (percentile < 25). Similar figures for patterns 8 and 12 (Appendix A) show the same homogeneous spatial pattern. Solar radiation on dry soil event days during SOM pattern 7 (Figure 4.11a) ranges from 3 to 6 (MJ m -2 ) greater than normal, suggesting clear sky conditions. Increased solar radiation over dry soils results in preferential sensible heating, driving increased vapor pressure deficit (Figure 4.11b), and high maximum temperatures (Figure 4.11c). Pattern 7 is the only synoptic environment that occurs significantly more frequently on days with convection over both wetter and drier soils. Geopotential height anomalies (Figure 4.2) are somewhat similar to those of pattern 12, with weak 500 hpa and 850 hpa flow. 100
116 a. b. c. Figure Panels show daily (a) total solar radiation anomalies (direct + diffuse, MJ m -2 ), (b) vapor pressure deficit anomalies (mb), and (c) maximum temperature anomalies ( F) during pattern 7 dry soil event days. 101
117 Interestingly, the atmospheric characteristics of SOM pattern 7 (e.g., 500 hpa and 850 hpa geopotential heights, wind speed and direction, moisture flux, and precipitable water) are not noticeably different during convective event days (not shown). Soil moisture percentiles were composited for dry soil event days in pattern 7, 8, and 12, and they are shown in Figs. 4.12a, 4.12b, and 4.12c. Corresponding with consistent increases in solar radiation and maximum temperatures, soil moisture across the state during these conditions is relatively homogeneous. Results from Chapter III show strong connections between 0900 LST soil moisture percentiles and the ( LST) change in surface air temperature on the morning of unorganized convective events near Lamont, Oklahoma. Hourly air temperature observations at 0600 and 1200 LST from Oklahoma Mesonet stations are compared with 0900 LST soil moisture percentiles for each event, separated by SOM pattern. For patterns 7, 8, and 12, the 0900 LST soil moisture percentile explains, on average, 56% of the variance in the change in surface air temperatures from 0600 to 1200 LST. In contrast, the same relationship for patterns 5, 6, and 10 result in an average R 2 value of just 0.22, meaning only 22% of the variance in the change in surface air temperatures is explained by soil moisture. Patterns 7, 8, and 12 occur with significantly higher frequency on days with unorganized convection than expected. 102


118 a. b. c. Figure Soil moisture percentiles the morning of dry soil events during pattern 7, pattern 8, and pattern 12 conditions. 103
119 Our results suggest that this could potentially be related to decreased cloud cover driven by a dominant upper-air ridge over the study region. This results in increased sensible heating, higher vapor pressure deficits and increased afternoon temperatures. All of these factors can initiate/enhance uplift and can potentially lead to the development of deep convection. 4.4 Summary and Conclusions One challenge in land-atmosphere interaction research is that results can be strongly dependent on the scale at which the analysis is conducted (Jones and Brunsell, 2009). Many studies have, justifiably, focused on local-scale interactions (Findell and Eltahir, 2003; Ek and Holtslag, 2004; Santanello et al. 2009; Gentine et al. 2013; Tawfik and Dirmeyer, 2014). These studies provide strong evidence that atmospheric modification by the land surface can lead to convection and enhance the probability of precipitation. Studies that have examined land-atmosphere interactions at the mesoscale (tens of kilometers) have shown convective initiation occurs preferentially along surface energy and moisture gradients (Taylor and Ellis, 2006; Taylor et al. 2011; Couvreux et al. 2012) and land use/land cover boundaries (McPherson et al. 2004; Carleton et al. 2008b). Continental-to-global scale studies have demonstrated that the relationship between soil moisture and precipitation is a function of the evaporative (moisture) regime (Seneviratne et al. 2010), with the strongest interactions in transition zones between arid and humid climates (Koster et al. 2004; Wei and Dirmeyer, 2012). In this study, we combine self-organizing maps with the spatial synoptic classification and HYSPLIT air mass trajectories to determine if the synoptic-scale 104
120 environment modulates the ability of the land surface to force unorganized convection in Oklahoma. We identify several synoptic patterns which are significantly more and less frequently associated with unorganized convection than expected. Patterns which are less frequently associated with convective events show a significant preference for the events that do occur to initiate over wetter soils. These SOM patterns (5, 6, and 10) are characterized by upper-air troughs to the north and northeast that drive northerly to northwesterly 500 mb and 850 mb winds, making for conditions less conducive (i.e., weaker CAPE) for convection to initiate. Those patterns which are more frequently associated with convective events than expected are characterized by dominant 500 mb ridging over the study region. These patterns are associated with decreased cloud cover, and more homogeneously dry soils. Consistent with these surface conditions, unorganized convective events that occur during these patterns (7, 8, and 12) have precipitation initiating preferentially over dry soils. Based on the results presented here, we argue that the synoptic-scale environment can potentially force conditions that are more or less conducive to convection forced by the land surface. Local-scale feedbacks (i.e., latent and sensible heat flux) modify the local atmosphere and can suppress or enhance convective activity (Santanello et al. 2009; Guichard et al. 2014). Mesoscale gradients in surface heat flux and moisture availability can also enhance instability and enhance the probability of convection (Frye and Mote, 2010; Taylor et al. 2011). These mechanisms, however, are modulated by the synopticscale atmosphere. In this study, we provide evidence that the synoptic-scale environment can inhibit or enhance these local- and meso-scale mechanisms. The synoptic-scale 105
121 environment is also embedded within a larger (continental-scale) climatic context and this also modulates the synoptic-, meso-, and local-scale feedbacks. For example, our study was conducted in a semi-arid environment frequently identified as a hot-spot of land-atmosphere interactions (Koster et al. 2004). If this study were conducted in a more humid or arid environment, the results would be considerably different. 106
122 CHAPTER V SOIL MOISTURE PATTERNS AND GRADIENTS RELATED TO UNORGANIZED CONVECTION 5.1 Introduction Land-Surface Heterogeneity and Atmospheric Modification The work presented in the preceding chapters focuses on convection and convective processes over relatively dry or relatively wet soils. Atmospheric modification takes place over homogeneously dry or homogeneously wet soils, as shown in Chapter III, as well as in previous studies (Santanello et al. 2009; Kang and Bryan, 2011). However, land surface heterogeneity, and the resultant moisture gradients, can also dramatically influence atmospheric conditions (Pielke, 2001). Land surface heterogeneity can refer to patterns and gradients in land cover (McPherson et al. 2004; Carleton et al. 2008b) as well as gradients in soil moisture (Frye and Mote, 2010b; Taylor et al. 2011). Land use land cover boundaries have been shown to significantly alter atmospheric moisture content and air temperature in Oklahoma (McPherson et al. 2004) due to contrasting partitioning of latent and sensible heat flux between dormant wheat fields and actively productive grasslands. The contrast in surface heat flux, with increased latent heating over healthy grassland, can force mesoscale flows and systems similar to sea-breezes (Avissar and Pielke, 1989), and ultimately initiate convective processes. Soil moisture gradients can induce similar contrasts in surface heat flux through variations in moisture availability. Taylor et al. (2012) document a significant global 107
123 preference for afternoon precipitation to fall over relatively dry soils adjacent to relatively wet soils. This supports the findings of Taylor et al. (2011), who describe a significant increase in the probability of convection over dry soils with increased adjacent heterogeneity in the Sahel region of Africa. Mechanistically, wet soils permit moisture flux to the atmosphere through increased latent heating, which increases humidity and potential energy for convection. When the relatively moist air mass moves from wet to dry soils, the increased sensible heating over the dry soils can create a localized thermal low, providing convergence and uplift of the moist air mass. Deep convection initiates when the air mass is lifted beyond the LFC, and precipitation falls over the relatively dry soils (Taylor et al. 2011) Previous Studies The scale at which soil moisture gradients can modify atmospheric conditions and potentially force convection are on the order of 10s of kilometers (Taylor et al. 2013). Therefore, previous studies examining the impact of soil moisture heterogeneity on the atmosphere are confined to high resolution regional climate models (Courault et al. 2007; Wolters et al. 2010; Garcia-Carreras et al. 2011; Huang and Margulis, 2013) or indirect soil moisture measurements such as those from satellite remote sensing (Taylor and Ellis, 2006; Frye and Mote, 2010). The few studies which do employ in situ observations of soil moisture require field experiments (Fabry, 2006; LeMone et al. 2007) and these experiments are too short to determine whether convection is forced by certain soil moisture patterns. The relatively high spatial density of soil moisture stations in Oklahoma, combined with convective events identified using the NEXRAD Stage IV 108
124 product gives us the unique opportunity to assess the potential impact of soil moisture patterns and gradients on convective precipitation initiation. The purpose of the analysis in this chapter is to determine if unorganized convective precipitation events in Oklahoma initiate preferentially over certain soil moisture gradients, or directional patterns. This objective is accomplished through two sets of analyses, namely: 1) quantifying soil moisture gradients underlying unorganized convective precipitation events in Oklahoma, and 2) assessing the strength of the relationship between soil moisture gradients and the likelihood of convective precipitation initiation using a logistic regression method Data and Methods Soil Moisture and Precipitation Events Daily 0900 LST soil moisture observations used in Chapters II, III, and IV are also used for this objective. However, our analysis here focuses on patterns of absolute soil moisture and not standardized soil moisture values (i.e. percentiles). Therefore, the volumetric water content (cm 3 cm -3 ) measurements from the Oklahoma Mesonet are retained, allowing us to identify actual gradients in moisture availability. Dry soils and wet soils are delineated by the 25 th and 75 th percentiles, respectively. Similar to Chapter IV, dry soil events refer to those in which precipitation initiates over soils with moisture content less than the 25 th percentile, while wet soil events refer to those in which precipitation initiates over soils with moisture content greater than the 75 th percentile. The 477 unorganized convective events from Chapters III and IV are used in this 109
125 chapter. The manual identification procedure, described in Chapter III, uses a decision tree process (Figure 3.1) to separate unorganized events from organized systems Soil Moisture Directional Differences Patterns of soil moisture are difficult to quantify because spatial scale has a strong impact (Jones and Brunsell, 2009b). Meso-scale soil moisture monitoring networks with the station density of the Oklahoma Mesonet are quite rare, therefore very few studies have attempted to characterize soil moisture gradients across a meso-scale region using in situ observations. We examine point-based soil moisture patterns across Oklahoma related to our unorganized convective events. However, relating the patterns of soil moisture to precipitation initiation is not sufficient, as the rarity of the pattern with regard to the typical or climatological soil moisture gradient must be determined. For example, if convection initiates preferentially over soil moisture patterns that most typically occur in Oklahoma, an argument cannot be made that the soil moisture gradients are actually influencing the atmosphere to generate precipitation. Instead if we quantify the anomaly of soil moisture gradients, we can detect the signal of soil moisture feedback separate from background atmospheric persistence (i.e. Taylor et al. 2012). We exclude all events and stations in the panhandle of Oklahoma for these tests, as the region is not geographically expansive enough to determine gradients or spatial variability at the spatial scales we examine. We calculate soil moisture directional differences to investigate the anomalousness of soil moisture patterns or gradients underlying convective precipitation initiation. The directional difference refers to the difference between soil moisture 110
126 conditions averaged across all stations within 100 km of a particular precipitation initiation point. The 100 km buffer is chosen based on the work of Ford and Quiring (2014) who show soil moisture spatial autocorrelation coefficients exceeding 0.8 from stations within 100 km of each other. We also test buffer sizes of 50, 75, 125, and 150 km. The resulting directional differences calculated from 75, 125, and 150 km buffers were not noticeably different from those with the 100 km buffer (not shown); however, the directional differences were much more highly variable using the 50 km buffer. Oklahoma Mesonet stations are, on average, spaced at approximately every km, and therefore using a 50 km buffer only allows one or two stations to factor into the directional average. For these reasons, the 100 km buffer was chosen. Directional differences are determined as the difference between average volumetric water content values over all stations within a certain cardinal direction of the initiation point and all stations within the opposite direction. For a given precipitation event, if the average soil moisture value west of the initiation point is 0.24 (cm 3 cm -3 ), and east of the initiation point is 0.30, the east west directional difference is Four directional differences are calculated: north south, east west, northeast southwest and northwest southeast. Maps showing an example of directional differences are shown in Appendix A (A-13). Of course, convective precipitation initiation points which fall less than 100 km from the edge of the state would preclude a large number of stations in the directional difference calculation. To account for this edge effect, we mandated that if the initiation point occurred within 100 km of an edge, there had to be 111
127 at least 3 stations in each directional quadrant for the directional difference to be calculated. Numerous spatial statistics exist to calculate the anomalousness of gradients, mostly using gridded variable fields. However, there is no precedent for quantifying soil moisture gradient anomalies from point-based soil moisture observations. Therefore, we use daily soil moisture directional differences to derive two standardized directional difference indices: the standardized directional difference index (SDDI) and the directional difference ratio (DDR). Neither the SDDI nor the DDR have been previously used in soil moisture applications. The SDDI represents the change in sign and strength of directional soil moisture differences. The north south SDDI, for example is calculated as the difference between the north average soil moisture (θ N ) and the south average soil moisture (θ S ) for a given event, minus the average north south soil moisture difference at that exact location from all other days in that particular month over the entire study period (θ ), NS divided by the same average north south soil moisture difference (θ ), NS as: SDDI = [(θ N θ S ) θ ] NS θ NS 1 An SDDI value at or near 0 represents the typical, climatological soil moisture directional difference. A positive SDDI value represents a strengthening or enhancement of typical directional differences, and a negative SDDI value represents a reversal of typical direction differences. Once the SDDI is calculated for each event, the Wilcoxon Rank-Sum test is used to determine if the median SDDI value is significantly different 112
128 from 0. If the result is a statistically significant (ρ < 0.05) deviation from 0, then we can conclude that a particular directional difference (i.e. east west) during convective events is significantly different from the typical directional pattern. This conclusion helps inform whether certain directional differences are not only related to unorganized convective precipitation, but are also anomalous or not anomalous with respect to typical soil moisture gradient conditions. The SDDI evaluates the sign of the deviation from typical soil moisture directional differences associated with convective events. However, a small (< 1) SDDI value can either represent a reversal of typical soil moisture patterns, or a weakening of the typical pattern with no reversal (e.g. more homogeneous soils). Therefore, we also created and derived the DDR, which represents the absolute ratio of the event directional difference and the typical or climatological directional difference. The DDR for northsouth differences, for example, is calculated as the absolute difference between the north average soil moisture (θ N ) and the south average soil moisture (θ S ) for a given event, divided by the average north south soil moisture difference at that exact location from all other days during that particular months over the entire study period (θ ), NS as: DDR = (θ N θ S ) θ NS 2 A DDR value of 1 represents the typical directional difference. DDR values less than 1 represent a weakening of the typical directional difference, indicating more homogeneous soils, while a DDR value of greater than 1 represents a strengthening of directional difference, indicating more heterogeneous soils. The combination of the 113
129 SDDI and DDR characterizes the sign, strength and anomalousness of soil moisture patterns associated with convective events Logistic Regression and the Probability of Convection The directional differences and corresponding indices give us an indication of the direction and anomalousness, with respect to time, of soil moisture gradients underlying unorganized convective events. However, analysis of directional differences does not help determine if soil moisture gradients can be used in a predictive capability for forecasting the occurrence (and possible location) of unorganized convective events. This task is completed using a logistic regression model, which quantifies the statistical relationship between soil moisture gradients and the probability of unorganized convective precipitation initiation. If the dependent variable, in this case the occurrence (1) or absence (0) of a convective event, varies as a significant function of the independent variable, in this case the soil moisture gradient, then this would suggest a potential predictive capability. The logistic regression analysis begins with first determining the state-wide directional difference for every day in the study period. The state-wide directional difference is calculated in a similar fashion as explained in section 5.2.3; however, we use the geographic center of the state (35.42 N, W) as the pivot point separating north from south, east from west, northeast from southwest, and northwest from southeast. It would be more physically meaningful to use a point in the center of a consistently large soil moisture gradient as our center point for directional difference calculation. However, the analysis of daily soil moisture gradients shows that there is no 114
130 area of the state that exhibits a consistently strong gradient. This is not very surprising, as gradients in soil moisture are first and foremost generated by spatial variations in precipitation, and then maintained or dissipated based both on the drying rate of the soil and potential evapotranspiration. Because we could not find a region with a consistent soil moisture gradient, we opted to use the geographic center of the state. Once the state-wide directional differences (cm 3 cm -3 ) are calculated, they are then binned into 10 classes or deciles, within which the probability of convective precipitation initiation is calculated. Initiation probabilities are then compared between the deciles to determine if certain soil moisture directional differences increase or decrease the probability of convective precipitation. We use logistic regression to test if the probability of convective precipitation is significantly related to changes in the statewide directional difference. Logistic regression, as described by Peng et al. (2002), is used to explore the relationship between a binary dependent variable and one or more independent variables. Logistic regression is the appropriate method when dealing with a binary dependent variable (precipitation or no precipitation). Ordinary least squares regression with a binary dependent variable can lead to issues of non-normally distributed errors and predicted values which do not range from 0 to 1 (Kutner et al. 2004). Logistic regression uses the independent variable(s) to predict the logit transformation of the dependent variable. The output is the odds ratio of the dependent variable. In this case, a logistic regression model gives the probability of convective precipitation as a function of the state-wide soil moisture directional difference (independent variable). The logistic regression model takes the form of: 115
131 ln ρ = α + βx 3 1 ρ The value ρ is the odds ratio of the occurrence of convective precipitation, α is 1 ρ the intercept and β is the regression coefficient. Logistic regression models do not require normally distributed residuals, but instead assume that the distribution of errors between the actual and predicted dependent variables is binomial. Because our soil moisture gradients are independent, the binomial assumption is met (Peng et al. 2002). We employ the logistic regression model in which the binary dependent variable is the occurrence of convective precipitation (1 = precipitation event, 0 = no event) and the independent variable is the soil moisture directional difference that day. The model outcome is the log odds ratio of convective precipitation occurrence on that day and the slope (β) of the regression represents the relationship between the variables. From the β of the regression, we can calculate the estimate change in the probability of convective precipitation, given a one-unit increase (0.01 cm 3 cm -3 ) in soil moisture directional difference. The 1% volumetric water content gradient increase was chosen as the logistic regression step because the gradient range was approximately -12% to +15% volumetric water content, meaning that a 1% step allows the logistic regression to represent realistic changes in soil moisture gradients. The significance of the regression fit is assessed using the Wald s Chi-square test and the Hosmer-Lemeshow test Results Soil Moisture Directional Differences Soil moisture variance can be used to characterize spatial variability, but it is a strong function of overall soil moisture conditions. Therefore we use directional 116
132 differences in soil moisture to distinguish patterns or gradients associated with convective precipitation events. The north south direction difference, for example, represents the difference between average soil moisture from all stations within 100 km north of the point of precipitation initiation and average soil moisture from all stations within 100 km south of the point of precipitation initiation. The SDDI and DDR are calculated according to equations 1 and 2, for all four directional differences and represent the gradient deviation from normal and the sign of the gradient, respectively. The Wilcoxon Rank-Sum test is used to determine if the median SSDI value is significantly different from zero, demonstrating a significant deviation from the typical soil moisture gradient. We first compute SDDI and DDR for all events, and separately for all dry and wet events. Boxplots of SDDI are shown for all events in Figure 5.1a, and for dry soil and wet soil events in Figs. 5.1b and 5.1c, respectively. For all events together, no directional difference had a median significantly different from 0, and the same result occurred for all wet soil events. However, the east-west difference for dry soil events (Figure 5.2a) was significantly different from 0, in the negative direction. This represents either a significant reversal of the typical east west, wet dry gradient, or a general weakening of such a gradient (more homogenous soils). Soil moisture directional differences at 5 cm are correlated with coincident 25 cm directional differences (Figure 5.2) to determine the representativeness of 5 cm soil moisture for the deeper soil column. 117
133 a. b. c. Figure 5.1. Boxplots of SSDI from each directional difference over (a) all events, (b) dry soil events, and (c) wet soil events. The black, dashed line represents the 0 value, by which the median of each group is tested. 118
134 The scatter plots show a weak to moderate relationship between SDDI values at 5 and 25 cm, with the strongest correspondence for the northwest southeast directional difference. Despite the generally weak relationship between directional differences at 5 and 25 cm, composites of SDDI and DDR at 25 cm exhibit the same patterns as those in Figure 5.1. That is, the only significant SDDI deviation from 0 at 25 cm was the east west gradient. Figure 5.2. Daily SDDI values calculated from (x-axes) 5 cm soil moisture and (y-axes) 25 cm soil moisture. The black line represents the 1-to-1 fit, while the dashed line represents the least squares fit. The distribution of east west SDDI values is the only that has a median significantly different from 0, suggesting that convective precipitation events initiate over either reversed east west gradients or weakened gradients. The corresponding DDR values for dry soil events (Fig. 5.3) shows that the median east west DDR is significantly less than 1, suggesting that east west gradients underlying convective 119
135 events are significantly weaker than normal. This is not surprising, given strong soil moisture heterogeneity underlying events initiating over dry soils (Fig. 4.12). Figure 5.3. Boxplots of DDR from each directional difference over dry soil events. The black, dashed line represents the 0 value, by which the median of each group is tested Probability of Convection East west directional differences show a significant weakening associated with the initiation of unorganized convective precipitation. To assess the potential predictive capabilities of soil moisture gradients for unorganized convective precipitation occurrence, we employ a logistic regression model. State-wide soil moisture directional differences are calculated for all events, and then separately for wet soil and dry soil events. The distribution of directional differences are then divided into deciles and the probability of convective precipitation occurrence is calculated in each decile. The change in the probability of convection between the deciles of soil moisture directional differences represents the influence of soil moisture gradients on convective 120
136 precipitation. The significance of this influence is evaluated using a logistic regression model. Table 5.1 displays the soil moisture directional differences in the lower (0 10), middle (40 50) and upper (90 100) deciles, as well as the probability of convection associated with each of these deciles. This information is presented for all events and each of the four directional differences. The largest changes in the probability of convection between the first and last decile occur in the east west (-12%) and northeast southwest (-11%) directions. More specifically, the probability of convection when east-west gradients range from to is 29%, compared to 17% when gradients range from to It is important to note that these directional difference ranges represent the extent of each decile or approximately 10% of all gradient occurrence. This means that gradients in the lowest decile have the exact same probability of occurrence as those in the middle and highest deciles. Table 5.1. Probability of convection separated by soil moisture directional difference decile for all four directions. All convective events were used when calculating probabilities. Direction/Probability of Convection Lower Decile Middle Decile Upper Decile North South 26.79% 24.41% 25.75% East West 29.17% 25.00% 17.37% Northeast Southwest 30.95% 21.43% 19.16% Northwest Southeast 22.62% 25.00% 26.35% In general, these results suggest that convective precipitation is more likely when the normal east-west and northeast-southwest soil moisture gradients are over reversed or weakened, corroborating the results from the SDDI analysis. The logistic regression 121
137 from these two directions, for all events, is statistically significant. Every 0.01 cm cm -3 increase in the east-west and northeast-southwest soil moisture gradient corresponds with a -1.4% and -1.8% decrease in the probability of convection, respectively. These relationships are shown in Figure 5.4. Figure 5.4. Probability of convection as a function of soil moisture gradients in the (blue line) east-west and (black line) northeast - southwest directions for all events. There is a statistically significant negative relationship between the change in the east west gradient and the probability of convection. The relationship becomes stronger when we separate dry soil from wet soil events. No statistically significant relationships are evident between soil moisture directional differences and the probability of convection for wet soil events. However, there are strong, statistically significant relationships for dry soil events. Figure 5.5 shows this negative relationship, in which the probability of convective precipitation ranges from 21% for east west soil moisture gradients less than -0.05, to less than 10% for soil moisture gradients greater 122
138 than This significant relationship results in a decrease in the probability of convective precipitation of -2.6% and -2.9% for every 0.01 increase in east-west and northeast-southwest soil moisture directional differences, respectively. Figure 5.5. Probability of convection as a function of soil moisture gradients in the eastwest direction for all events over drier than normal soils. The logistic regression results combined with those from SDDI and DDR analysis suggest that an unorganized convective precipitation initiates preferentially over weakened east west soil moisture gradients in Oklahoma. It is not surprising that this relationship is stronger for events initiating over dry soil, as the processes that go to decrease soil moisture content typically effect a meso-scale area homogenously (i.e., Figure 4.10). Although the statistical relationship between east-west soil moisture gradients and the probability of convective precipitation initiation was statistically significant, it remains unclear whether the 1% volumetric water content change in the soil moisture 123
139 gradient (model independent variable) results in a significant and meaningful change in atmospheric conditions potentially leading to convective initiation. We therefore compare daily, state-wide gradients in volumetric water content to coincident gradients in maximum temperature, maximum and average dew point temperature, relatively humidity and 2-m wind velocity. We regress each meteorological variable, separately on volumetric water content gradients, then use the resultant beta coefficient to infer the change in the meteorological variable s gradient resulting from a 0.01 (cm 3 cm -3 ) soil moisture gradient increase. Figure 5.6 shows scatter plots of daily volumetric water content gradients and corresponding maximum temperature ( F) gradients from the (a) north south, (b) east west, (c) northeast southwest, and (d) northwest southeast directions. The regression equations are displayed and are denoted with an asterisk if the fit is statistically significant at the 95% confidence level. Even the strongest soil moisture gradient maximum temperature gradient (east west, Figure 5.6d) corresponds with a 0.33 F increase in temperature differences with a 0.01 (cm 3 cm -3 ) increase in soil moisture gradient. Despite the statistical significance of the fits, the change in maximum temperature for each soil moisture gradient change is diminutive, and certainly not physically substantial enough to initiate convection. Results from dew point temperature, relative humidity and wind velocity (not shown) are similar to those from maximum temperature. Although there is a significant relationship between changes in soil moisture gradients and the probability of unorganized convective precipitation, the soil moisture gradient variations are not physically meaningful. 124
140 Figure 5.6. Daily soil moisture gradients (cm 3 cm -3 ) versus daily maximum temperature gradients ( F) in the (a) north - south, (b) east - west, (c) northeast - southwest, and (d) northwest - southeast directions. The regression equation for each plot is shown and denoted by an asterisk if significant at the 95% confidence level Discussion and Conclusions Discussion Adjacent regions of wet and dry soils can potentially force gradients in surface energy and evern surface convergence over relatively dry soils along these moisture boundaries (Courault et al. 2007; Garcia-Carreras et al. 2011). This convergence can cause uplift for relatively moist air masses moving from wet to dry soils (Taylor et al. 2011) and it can potentially initiate moist convection. The global preference for afternoon convective precipitation to fall over relatively dry soils adjacent to relatively wet soils (Taylor et al. 2012) is attributed to these physical mechanisms. However these relationships are convoluted when attempting to extract a signal from disparate 125
141 observations. These complexities are made even more difficult by the strong relationship between soil moisture content and spatial variability of soil moisture documented in this study. Analysis of directional differences in soil moisture show that unorganized convective precipitation initiates preferentially over weakened east west soil moisture gradients across Oklahoma. Correspondingly, we see a general negative relationship between the strength of the east-west, wet-dry gradient in soil moisture in Oklahoma and the occurrence of unorganized convection. This relationship is evident when evaluating the change in the probability of convection, which decreases with increased east west soil moisture gradients. This relationship is much stronger when only considering events initiating over drier than normal soils. For these events, the probability of convection decreases by nearly 3% for every 0.01 increase in the east-west soil moisture gradient over Oklahoma. If this signal was representing physical modifications to the atmosphere imposed by soil moisture gradients, our results would corroborate those from Taylor et al. (2011) and Garcia-Carreras et al. (2011). However, the small change in east-west soil moisture gradients significantly related to convective precipitation initiation does not coincide with substantial changes to atmospheric conditions leading to convection. Even if we were able to extract a physically meaningful signal from the east-west soil moisture gradients, it would be nearly impossible to separate the impacts of gradients in surface moisture convergence from the predominant westerly to southwesterly low-level flow in this region of the United States. Based on the results shown here, we cannot corroborate the findings of Taylor et al. (2011), and therefore 126
142 suggest that future studies examining the impact of soil moisture gradients on convective precipitation initiation quantify the changes in atmospheric conditions attributable to the actual soil moisture gradient Conclusions East west soil moisture gradients are significantly related to convective precipitation initiation in the Southern Great Plains. In general, the strength of the typical east west, wet dry soil moisture gradient across Oklahoma is inversely related to the probability of convective precipitation. However, we were unable to demonstrate a physical connection from this statistical relationship. The ability of soil moisture gradients to impact the occurrence and location of convective precipitation initiation resides in their ability to modify the atmosphere accordingly to force convection. Our findings suggest that soil moisture gradients do not result in physically meaningful changes in atmospheric conditions leading to convective initiation. We therefore must conclude that we could not establish a physical relationship between soil moisture gradients and unorganized convective precipitation in Oklahoma. 127
143 CHAPTER VI CONCLUSIONS 6.1 Soil Moisture Precipitation Coupling Soil moisture precipitation coupling has been a major avenue of hydroclimatology for the past two decades. Due to a significant lack of high quality, dense in situ soil moisture monitoring stations, most studies have used modeling or remote sensing platforms for diagnosing soil moisture feedback to precipitation (Findell and Eltahir, 2003; Taylor and Ellis, 2006). Those studies using soil moisture observations have focused on local-scale interactions over relatively short periods of time such as one month or one season (Santanello et al. 2009; Phillips and Klein, 2014). The utility of these studies is that they can help to identify the physical mechanisms that link anomalously dry or wet soils with atmospheric modification leading to convection. However, the lack of longer-term studies precludes conclusions on the preferred state of the climate system with regard to soil moisture feedback to precipitation through anomalously dry/wet soils or strong/weak soil moisture gradients. The primary purpose and contribution of this dissertation is to provide a longterm examination of soil moisture precipitation coupling, using observations of both soil moisture and precipitation over a moisture-limited region of the United States. Availability of high quality soil moisture and precipitation observations over this region allowed us to highlight the same physical mechanisms linking soil moisture to precipitation, as presented in previous modeling and observation studies. Concurrently, availability of these data for more than a decade give us the opportunity to examine how 128
144 these feedbacks operate under various synoptic-scale atmospheric conditions and soil moisture gradients. 6.2 Dry or Wet Soil Preferences Two distinct precipitation datasets and event detection methodologies were adopted/developed to determine if convective precipitation in Oklahoma falls preferentially over dry or wet soils. The CMORPH precipitation product was combined with an event identification procedure adopted from Taylor et al. (2012) and a synopticdynamic classification adopted from Frye and Mote (2010) in Chapter II. The findings from this chapter suggest that afternoon precipitation in Oklahoma falls preferentially over dry (wet) soils when the Great Plains LLJ is present (absent). Post-hoc test of the synoptic-dynamic classification suggested that the procedure could not properly separate unorganized convective events from large-scale organized and stratiform systems (Wang et al. submitted to JAMC), and the results were therefore less robust. We employed a higher spatial and temporal resolution precipitation dataset, based on NEXRAD radar, in Chapter III. We also retooled our unorganized convective event classification procedure to improve its ability to discern unorganized from organized precipitation systems. Based on the improved methods, we demonstrate a statistically significant preference for unorganized convective precipitation to initiate over relatively dry soils. More than 70% of all unorganized convective events initiated over soils drier than the median. The significant preference for afternoon convective precipitation over drier than normal soils corroborates the results of Taylor et al. (2011) and Taylor et al. (2012). In light of these results, we are confident that the convective 129
145 event identification procedure designed and implemented in Chapter III more effectively isolates unorganized convective events from those associated with larger-scale systems. Therefore, the significant preference for convective precipitation initiation over drier than normal soils is robust. However, it is noted in Chapter III that the 477 convective events contributed, at most, 15%, and on average 5% of the total monthly precipitation. This is noteworthy, as the precipitation potentially initiated via soil moisture feedbacks does not account for nearly the majority of total warm season precipitation in Oklahoma Soil Moisture Precipitation Coupling and Atmospheric Modification Events initiating within 50 km of Lamont, Oklahoma were composited and clustered based on their atmospheric pre-conditioning and morning humidity conditions (Findell and Eltahir, 2003). The 17 events grouped perfectly into those initiating over wetter and drier than normal soils, respectively. Strong, statistically significant relationships were demonstrated between morning (0900 LST) soil moisture percentiles and changes in atmospheric conditions between 0600 and 1200 LST. Of these, the strongest relationships were those between soil moisture and CIN and CAPE. The 0600 to 1200 LST change in CIN was strongly, negatively related to the soil moisture percentile, such that 0600 CIN was much larger and decreased much more over drier than normal soils. The 0600 to 1200 LST change in CAPE was strongly, positively related to soil moisture, such that 0600 CAPE was much larger and increased more over wetter than normal soils. Along with CIN and CAPE, morning soil moisture was significantly related to changes in near-surface air temperature, PBL and LFC height, and the 0600 LST convective temperature. 130
146 Mechanistically, drier than normal soils increase (decrease) atmospheric temperature (humidity) through decreased moisture flux. These changes are typically associated with high CIN values and a relatively high LFC height. However, the preferentially partitioning of incoming energy as sensible heat flux increases near surface air temperature and PBL height. The first of these changes can erode the strong CIN values. Once CIN is eroded and the PBL reaches the LFC, deep convection can be initiated. In contrast, wetter than normal soils decrease air temperature and increase atmospheric humidity through more latent heating. This is associated with decreased CIN, increased CAPE and generally lower LFC and PBL heights. CAPE values continue to increase throughout the morning over wet soils and the LFC is forced lower. Once an air mass reaches the LFC, deep convection is initiated, typically more strongly than that over drier than normal soils, because of the large CAPE values. Both CAPE and the change in PBL height were significantly correlated with the duration, size, and intensity of unorganized convective precipitation events. Conditions with higher CAPE values and smaller changes in PBL height were associated with events with larger spatial extent, more rainfall accumulation, and longer event duration. Interestingly, there was not a statistically significant relationship between the characteristics of the precipitation events and the morning soil moisture conditions. The relationships demonstrated in Chapter III are consistent with strong soil moisture feedback to precipitation, and corroborate similar findings in previous studies focusing on local-scale soil moisture precipitation coupling (Santanello et al. 2009; Phillips and Klein, 2014; Guillod et al. 2014). Overall Chapter III results show that both 131
147 positive and negative soil moisture feedbacks to precipitation are present in the Southern Great Plains of the United States, through which both wet and dry soils can force conditions conducive to unorganized convection Soil Moisture Precipitation Coupling and the Synoptic-Scale Environment Convective precipitation events identified in Chapter IV are composited by the synoptic-scale atmospheric conditions during which they occur. Mid-level (500 mb) atmospheric geopotential heights are implemented in a self-organizing maps algorithm to obtain 12 synoptic-scale atmospheric circulation patterns. Each of these patterns is related to convective events, particularly how anomalous the frequency of each of the patterns occurs during a convective event. Patterns which occur at a statistically significantly lower frequency during convective events than expected are mostly associated with a mid-level trough to the north and northeast, and strong, northerly lowlevel (850 mb) flow. These mid-level conditions combined with northerly 850 mb flow resulted in significantly lower CAPE values over the entire state of Oklahoma than the same mid-level conditions combined with southerly flow. We conclude that the lack of unorganized convective events during these synoptic patterns are attributable to the advection of cool, dry air masses which impede unorganized convection over both wet and dry soils. Patterns which occur statistically significantly more frequently than expected during convective events are associated with mid-level ridges and dominant high pressure at the surface. The patterns correspond with generally weak southerly to southwesterly low-level flow. Under these conditions, cloud cover is limited, 132
148 evaporative demand (vapor pressure deficit) is maximized, and soil moisture is relatively homogeneous. Surface temperature change from 0600 to 1200 LST during these conditions are strongly related to soil moisture anomalies, suggesting that soil moisture feedback to precipitation underlying these synoptic patterns are particularly strong. Not surprisingly, these patterns occur more frequently during convective events than any other. The primary conclusion of Chapter IV is that the synoptic-scale environment strongly influences the occurrence of unorganized convective precipitation in the Southern Great Plains. Primarily this influence is through the modulation of atmospheric conditions that enhance or suppress surface-induced convective processes. Soil moisture precipitation interactions are strongly scale-dependent (Jones and Brunsell, 2009), and factors which influence the strength of these interactions can vary depending on the scale of examination. Many observation-based studies focus on local-scale feedbacks and atmospheric modification by soil moisture, similar to the analysis in Chapter III. Concurrently many modeling studies focus on either mesoscale interactions with soil moisture and land cover gradients forcing convective processes (Courault et al. 2007; Huang and Margulis, 2013), or on continental-scale feedbacks (Dirmeyer et al. 2009; Findell et al. 2011). The larger-scale interactions are typically determined by the moisture regime of the region and this is one of the reasons why the Southern Great Plains is a widely-studied region for land-atmosphere interactions (Koster et al. 2004). The results presented in Chapter IV show that synoptic-scale factors can have a strong impact on soil moisture precipitation coupling. Based on these results, it is suggested 133
149 that studies examining soil moisture feedbacks to precipitation should take the synopticscale environment into account Soil Moisture Precipitation Coupling and Soil Moisture Gradients Adjacent areas of dry and wet soils have been shown to modify atmospheric conditions, making it more conducive for convective processes. We examine the impact of soil moisture gradients on the occurrence of unorganized convection in Oklahoma in Chapter V. Soil moisture gradients are represented as directional differences in volumetric water content. Two directional indices are derived to represent significant deviations in soil moisture patterns, related to convective events. In addition, the probability of an unorganized convective event occurring is calculated based on the predominant soil moisture gradient. Convective events with precipitation initiating over wetter than normal soils do not exhibit a statistically significant relationship with soil moisture gradients. Events with precipitation initiating over drier than normal soils, in contrast, exhibit a strong, statistically significant relationship with soil moisture gradients. Overall for events over dry soils, the east west, wet dry gradient is negatively related with the probability of convective events. Specifically, an increase in the typical east west, wet dry gradient of 0.01 cm 3 cm -3 corresponds with a decrease in the probability of convection of nearly 3%. The study by Taylor et al. (2011) was a benchmark demonstrating the impact mesoscale (10s of kilometers) soil moisture gradients had on the location and occurrence of convective precipitation. Their results showed a clear preference for convective precipitation to fall over dry soils that were adjacent, and downwind of wet soils. 134
150 Contrasting dry and wet soil patches resulted in areas of strong sensible and latent heat flux, respectively. Air masses moving over the upwind wet soils experienced strong moisture flux from the surface, increasing humidity and decreasing temperature. These moist air masses then moved over the boundary with dry soils, over which strong sensible heating occurred. The partitioning of incoming energy into sensible heating by dry soils went to increase air temperature, creating a localized thermal low. This created an uplift mechanism, through which the moist air mass was pushed upward. The wet dry soil moisture boundary forced deep convection, with precipitation occurring preferentially over the downwind dry regions. Although we found that reversed or weakened east west soil moisture gradients in Oklahoma were significantly related in increases in the probability of convective precipitation, these soil moisture gradients did not result in physically meaningful changes in atmospheric conditions leading to convection. Taylor et al. (2011) also show a statistically significant relationship between soil moisture gradients and afternoon preciptiation, but do not demonstrate these gradients result in similar gradients in air temperature, humidity, or wind velocity. The primary conclusion of Chapter V is that we were unable to provide a physical connection between soil moisture gradients and the occurrence and location of convective precipitation. Our findings do not corroborate those of previous studies, suggesting that it is paramount to not only quantify the statistical relationship between soil moisture gradients and precipitation, but to demonstrate a physical modification of atmospheric conditiosn corresponding with such soil moisture gradients. 135
151 6.6. The State of Soil Moisture Precipitation Coupling and Future Work The novelty of this dissertation research is the use of observed soil moisture and precipitation datasets to examine soil moisture feedback to precipitation on a mesoscale. The dominance of modeling land-atmosphere interaction studies exemplifies the dire need for: (1) more in situ soil moisture monitoring stations and (2) higher quality satellite remote sensing soil moisture and precipitation data. Oklahoma is arguably the most meteorologically monitored region in the world, and still there were analyses that could not completed as part of this dissertation because data at the necessary resolutions were not available. A national initiative for a nation-wide soil moisture monitoring network is under development in the United States, and hopefully other nations follow. With that being said, the future of land-atmosphere interactions and climate change projections of these interactions is dependent on improvements in satellite remote sensing technology. Near-real time monitoring capabilities over nearly the entire globe are coming to fruition (i.e. TRMM, SMAP, etc.), but more and better validation of these datasets is necessary. A serious challenge to understanding land-atmosphere interactions is the ability of global climate models to accurately simulate these interactions and feedbacks. The most impactful conclusion drawn from Taylor et al. (2012) is that state-of-the-art global climate models consistently exaggerate wet-positive soil moisture feedbacks for precipitation. The physics of these models is such that increased air temperatures in a changing climate lead to stronger evaporative demand and depleted soil moisture. With a strong positive soil moisture precipitation feedback parameterized in these models, 136
152 drier soils leads to warmer temperatures, less precipitation and even drier soils. This feedback increases the frequency, magnitude and duration of droughts in the future, simulated by global climate models (Sheffield et al. 2008; Roundy et al. 2014). This research, and previous studies, clearly demonstrate that soil moisture precipitation interactions are not prevalent in all regions of the globe, and even in regions where they do occur, they are not the strongest climate forcing. The highest contribution of total (May September) precipitation by unorganized convective precipitation events was 25%, and to assume that all of these events initiated via soil moisture precipitation feedback would be incorrect. Therefore, the ability of global climate models to accurately resolve and scale soil moisture impacts on precipitation and temperature is vital to properly assessing future climate change, particularly in semi-arid regions of the world such as the Southern Great Plains. 137
153 REFERENCES Alfieri, L., Claps, P., D Odorico, P., Laio, F., and Over, T. M.: An analysis of the soil moisture feedback on convective and stratiform precipitation. J. Hydrometeor., 9, , Allard, J., and Carleton, A. M.: Mesoscale associations between Midwest land surface properties and convective cloud development in the warm season. Phys. Geog., 31, , Allen, T.R., and Walsh, S.J.: Spatial and compositional pattern of alpine treeline, Glacier National Park, Montana. Photo. Engin. Rem. Sens., 62, , Ashley, W. S., and Gilson, C. W.: A reassessment of U.S. lightning mortality, Bull. Amer. Meteor. Soc., 90, , Avissar, R., and Pielke, R.A.: A parameterization of heterogeneous land surfaces for atmospheric numerical models and its impact on regional meteorology. Mon. Wea. Rev., 117, , Basara, J. B. and Crawford, K. C.: Linear relationships between root-zone soil moisture and atmospheric processes in the PBL. J. Geophys. Res., 107, Brimelow, J. C., Hanesiak, J. M., and Burrows, W. R.: Impacts of land-atmosphere feedbacks on deep, moist convection on the Canadian Prairies. Earth Interact., 15, 1-29, Carleton, A. M., Arnold, D. L., Travis, D. J., Curran, S., and Adegoke, J. O.: Synoptic circulation and land surface influences on convection in the Midwest US Corn Belt during the summers of 1999 and Part I: Composite synoptic environments. J. Clim., 21, , 2008a. Carleton, A. M., Travis, D. J., Adegoke, J. O., Arnold, D. L., and Curran, S.: Synoptic circulation and land surface influences on convection in the Midwest U.S. Corn Belt during the summers of 1999 and Part II: Role of vegetation boundaries. J. Clim., 21, , 2008b. Courault, D., Drobinski, P., Brunet, Y., Lacarrere, P., and Talbot, C.: Impact of surface heterogeneity on a buoyancy-driven convective boundary layer in light winds. Bound. Lay. Meteor., 124, , Couvreux, F., Rio, C., Guichard, F., Lothon, M., Canut, G., Bouniol, D., and Gounou, A.: Initiation of daytime local convection in a semi-arid region analysed with high- 138
154 resolution simulations and AMMA observations. Q. J. R. Meteorol. Soc., 138, 56-71, Dayan, U., Tubi, A., and Levy, I.: On the importance of synoptic classification methods with respect to environmental phenomena. Int. J. Clim., 32, , Diggle, P. J., Ribeiro, P. J., and Christensen, O.: An introduction to model-based geostatistics. In Spatial statistics and computational methods. Lecture Notes in Statistics 173 (ed. J. Møller), Springer, New York, Dirmeyer, P. A., Zeng, F. J., Ducharne, A., Morrill, J. C., and Koster, R. D.: The sensitivity of surface fluxes to soil water content in three land surface schemes. J. Hydrometeorol., 1, , Dirmeyer, P. A., Schlosser, C. A., and Brubaker, K. A.: Precipitation, recycling, and land memory: An integrated analysis. J. Hydrometeorol., 10, , Dixon, P. G., and Mote, T. L: Patterns and causes of Atlanta s urban heat island-initiated precipitation. J. App. Met. Clim., 42, , Douville, H., and Chauvin, F.: Relevance of soil moisture for seasonal climate predictions: a preliminary study. Clim. Dynam., 16, , Ek, M. B., and Holtslag, A. A. M.: Influenec of soil moisture on boundary layer cloud development. J. Hydrometeor., 5, 86-99, Fabry, F.: The spatial variability of moisture in the boundary layer and its effect on convective initiation: Project-long characterization. Mon. Wea. Rev., 134, 79-91, Ferguson, C. R., and Wood, E. F.: Observed land-atmosphere coupling from satellite remote sensing and reanalysis. J. Hydrometeorol., 12, , Findell, K. L. and Eltahir, E. A. B.: Atmospheric controls on soil moisture-boundary layer interactions. Part I: Framework development. J. Hydrometeorol., 4, , Findell, K. L., Gentine, P., Lintner, B. R., and Kerr, C.: Probability of afternoon precipitation in eastern United States and Mexico enhanced by high evaporation. Nature, 4, , Ford, T. W., Rapp, A. D., and Quiring, S. M.: Does afternoon precipitation occur preferentially over dry or wet soils in Oklahoma?, J. Hydrometeorol., in press. Ford, T. W., and Quiring, S. M.: Comparison and application of multiple methods for temporal interpolation of daily soil moisture. Int. J. Clim., 34, , 2014a. 139
155 Ford, T. W., and Quiring, S. M.: In situ soil moisture coupled with extreme temperatures: A study based on the Oklahoma Mesonet. Geophys. Res. Lett., 41, , 2014b. Ford, T.W., Harris, E., and Quiring, S.M.: Estimating root zone soil moisture using nearsurface observations from SMOS. Hydrol. Earth. Sys. Sci., 18, , 2014c. Frakes, B., and Yarnal, B.: A procedure for blending manual and correlation-based synoptic classifications. Int. J. Clim., 13, , Fritsch, J.M., Kane, R.J., and Chelius, C.R.: The contribution of mesoscale convective weather systems to the warm-season precipitation in the United States. J. Climate Appl. Meteor., 25, , Frye, J. D. and Mote, T. L.: Convection initiation along soil moisture boundaries in the southern Great Plains. Mon. Weather Rev., 138, , 2010a. Frye, J. D., and Mote, T. L.: The synergistic relationship between soil moisture and the low-level jet and its role on the prestorm environment in the Southern Great Plaisn. J. Appl. Meteor. Climat., 49, , 2010b. Gallus, W. A. Jr., Snook, N. A., and Johnson, E. V.: Spring and summer severe weather reports over the Midwest as a function of convective mode: A preliminary study, Wea. Forecasting, 23, , Garica-Carreras, L., Parker, D.J., and Marsham, J.H.: What is the mechanism for the modification of convective cloud distributions by land surface-induced flows?, J. Atmos. Sci., 68, , Gentine, P., Holtslag, A. A. M., D Andrea, F., and Ek, M.: Surface and atmospheric controls on the onset of moist convection over land. J. Hydrometeor., 14, , Gong, X., and Richman, M.B.: On the application of cluster analysis to growing season precipitation data in North America East of the Rockies. J. Clim., 8, , Guillod, B. P., Orlowsky, B., Miralles, D., Teuling, A. J., Blanken, P. D., Buchmann, N., Ciais, P., Ek, M., Findell, K. L., Gentine, P., Lintner, B. R., Scott, R. L., Van den Hurk, B., and Seneviratne, S. I.: Land-surface controls on afternoon precipitation diagnosed from observational data: uncertainties and confounding factors. Atmos. Chem. Phys., 14, ,
156 Hanna, A. F., Yeatts, K. B., Xiu, A., Zhu, Z., Smith, R. L., Davis, N. N., Talgo, K. D., Arora, G., Robinson, P. J., Meng, Q., and Pinto, J. P.: Associations between ozone and morbidity using the Spatial Synoptic Classification system. Env. Health, 10, Hewiston, B. C., and Crane, R. G.: Self-organizing maps: applications to synoptic climatology. Clim. Res., 22, 13-26, Huang, H., and Margulis, S.A.: Impact of soil moisture heterogeneity length scale and gradients on daytime coupled land-cloudy boundary layer interactions. Hydrol. Process., 27, , Illston, B. G., Basara, J. B., Fiebrich, C. A., Crawford, K. C., Hunt, E., Fisher, D. K., Elliott, R., and Humes, K.: Mesoscale monitoring of soil moisture across a statewide network. J. Atmos. Ocean. Technol., 25, , Jackson, T.J., Cosh, M.H., Bindlish, R., Du, J.: Validation of AMSR-E soil moisture algorithms with ground based networks. IEEE Trans. Geo. Rem. Sens., , Jackson, T. J., Cosh, M.H., Bindlish, R., Starks, P.J., Bosch, D.D., Seyfried, M., Goodrich, D.C., Moran, M.S., and Du, J.: Validation of Advanced Microwave Scanning Radiometer soil moisture products. IEEE Trans. Geo. Rem. Sens., 48, , Jones, A.R., and Brunsell, N.A.: Energy balance partitioning and net radiation controls on soil moisture precipitation feedbacks. Earth Interact., 13, 1-25, 2009a. Jones, A. R., and Brunsell, N. A.: A scaling analysis of soil moisture-precipitation interactions in a regional climate model. Theor. Appl. Climatol., 98, , 2009b. Joyce, R. J., Janowiak, J. E., Arkin, P. A., and Xie, P.: CMORPH: A method that produces global precipitation estimates from passive microwave and infrared data at high spatial and temporal resolution. J. Hydrometeorol., 5, , Kalkstein, L. S., Barthel, C. D., Greene, J. S., and Nichols, M. C.: A new spatial synoptic classification: Application to air mass analysis. Int. J. Clim., 16, , Kang, S., and Bryan, G.H.: A large-eddy simulation study of moist convection initiation over heterogeneous surface fluxes. Mon. Wea. Rev., 139, , Khong, A., Wang, J. K., Quiring, S. M., and Ford, T. W.: Soil moisture variability in Iowa, Int. J. Clim., Klimowski, B. A., Bunkers, M. J., Hjelmfelt, M. R., and Covert, J. N.: Severe convective windstorms over the Northern High Plains of the United States, Wea. Forecasting, 18, ,
157 Kohonen, T.: The Self-Organizing Map, Proceedings of IEEE, 78, , Koster, R. D., Dirmeyer, P. A., Guo, Z., Bonan, G., Chan, E., Cox, P., Gordon, C. T., Kanae, S., Kowlczyk, E., Lawrence, D., Liu, P., Lu, C., Malyshev, S., McAvaney, B., Mitchell, K., Mocko, D., Oki, T., Oleson, K., Pitman, A., Sud, Y. C., Taylor, C. M., Verseghy, D., Vasic, R., Xue, Y. and Yamada, T.: Regions of strong coupling between soil moisture and precipitation, Science, 305, , Koster, R. D., Mahanama, S. P. P., Yamada, T. J., Balsamo, G., Berg, A. A., Boisserie, M., Dirmeyer, P. A., Doblas-Reyes, F. J., Drewitt, G., Gordon, C. T., Guo, Z., Jeong, J. H., Lee, W. S., Li, Z., Luo, L., Malyshev, S., Merrfield, W. J., Senevirantne, S. I., Stanelle, T., van den Hurk, B. J. J. M., Vitart, F., and Wood, E. F.: The second phase of the Global Land-Atmosphere Coupling Experiment: soil moisture contributions to subseasonal forecast skill. J. Hydrometeor., 12, , Kutner, M.H.C., Nachtsheim, C.J., Neter, J., and Li, W.: Applied Linear Statistical Models. McGraw-Hill: New York, NY, LeMone, M.A., Chen, F., Alfieri, J.G., Tewari, M., Geerts, B., Miao, Q., Grossman, R.L., and Coulter, R.L: Influence of land cover and soil moisture on the horizontal distribution of sensible and latent heat fluxes in southeast Kansas during IHOP_2002 and CASES-97. J. Hydrometerol., 8, 68-87, Matyas, C. J. and Carleton, A. M.: Surface radar-derived convective rainfall associations with Midwest US land surface conditions in summer seasons 1999 and Theor. Appl. Clim., 99, , McPherson, R. A., Stensrud, D. J., and Crawford, K. C.: The impact of Oklahoma s winter wheat belt on the mesoscale environment. Mon. Wea. Rev., 132, , McPherson, R. A.: A review of vegetation atmosphere interactions and their influences on mesoscale phenomena. Prog. Phys. Geogr., 31, , Meng, L. and Quiring, S. M.: Examining the influence of spring soil moisture anomalies on summer precipitation in the US Great Plains using the Community Atmosphere Model version 3. J. Geophys. Res., 115, Mesinger, F., DiMego, G., Kalnay, E., Mitchell, K., Shafran, P. C., Ebisuzaki, W., Jovic, D., Woollen, J., Rogers, E., and Berbery, E. H.: North American Regional Reanalysis. Bull. Amer. Meteorol. Soc., 87, , Michaelides, S., Tymvios, F., and Charalambous, D.: Investigation of trends in synoptic patterns over Europe with artificial neural networks. Adv. Geosci., 23, ,
158 Mihalakakou, G., Flocas, H. A., Santamouris, M., and Helmis, C. G.: Application of neural networks to the simulation of the heat island over Athens, Greece, using synoptic types as a predictor. J. Appl. Meteor., 41, , Myoung, B. and Nielsen-Gammon, J. W.: The convective instability pathway to warm season drought in Texas. Part I: The role of convective inhibition and its modulation by soil moisture. J. Clim., 23, , Pal, J. S. and Eltahir, E. A. B.: Pathways relating soil moisture conditions to future summer rainfall within a model of the land-atmosphere system. J. Clim., 14, , Parker, M. D., and Johnson, R. H.: Organizational models of midlatitude mesoscale convective systems, Mon. Wea. Rev., 128, , Peng, C.J., Lee, K.L., and Ingersoll, G.M.: An introduction to logistic regression analysis and reporting. J. Education. Res., 96, 3-14, Perry, G. L. W., Miller, B. P., and Enright, N. J.: A comparison of methods for the statistical analysis of spatial point patterns in plant ecology, Plant. Ecol., 187, 59-82, Phillips, T. J., and Klein, S. A.: Land-atmosphere coupling manifested in warm-season observations on the U.S. southern great plains. J. Geophys. Res., 119, , 2014 Pielke, R. A.: Influence of the spatial distribution of vegetation and soils on the prediction of cumulus convective rainfall. Rev. Geophys., 39, , Potvin, C.K., Elmore, K.L., and Weiss, S.J.: Assessing the impacts of proximity sounding criteria on the climatology of significant tornado environments. Wea. Forecasting, 25, , Raddatz, R. L., and Hanesiak, J. M.: Significant summer rainfall in the Canadian Prairie Provinces: modes and mechanisms Int. J. Clim., 28, , Ramos, M.C.: Divisive and hierarchical clustering techniques to analyze variability of rainfall distribution patterns in a Mediterranean region. Atmos. Res., 57, , Roundy, J. K., Ferguson, C. R., Wood, E.F.: Temporal variability of land atmosphere coupling and its implications for drought over the Southeast United States. J. Hydrometeorol., 14, , Roundy, J.K., Ferguson, C.R., and Wood, E.F.: Impact of land-atmosphere coupling in CFSv2 on drought prediction. Clim. Dynam., 43, ,
159 Santanello, J. A., Peters-Lidard, C. D., Kumar, S. V., Alonge, C., and Tao, W.: A modeling and observational framework for diagnosing local land-atmosphere coupling on diurnal time scales. J. Hydrometeor., 10, , Santanello, J. A., Peters-Lidard, C. D., and Kumar, S. V.: Diagnosing the sensitivity of local land-atmosphere coupling via the soil moisture-boundary layer interaction. J. Hydrometeorol., 12, , Santanello, J. A., and Peters-Lidard, C. D.: Diagnosing the nature of land-atmosphere coupling: A case study of dry/wet extremes in the U.S. Southern Great Plains. J. Hydrometeorol., 14, 3-24, Schoen, J. M., and Ashley, W. S.: A climatology of fatal convective wind events by storm type. Wea. Forecasting, 26, , Scott, B. L., Ochsner, T. E., Illston, B. G., Fiebrich, C. A., Basara, J. B., and Sutherland, A. J.: New soil property database improves Oklahoma Mesonet soil moisture estimates. J. Atmo. Ocean. Tech., 30, , Seneviratne, S. I., Corti, T., Davin, E. L., Hirschi, M., Jaeger, E. B., Lehner, I., Orlowsky, B., and Teuling, A. J.: Investigating soil moisture climate interactions in a changing climate: A review. Earth-Sci. Rev., 99, , Sheffield, J., and Wood, E.F.: Projected changes in drought occurrence under future global warming from multi-model, multi-scenario, IPCC AR4 simulations. Clim. Dynam., 31, , Sheridan, S. C.: The redevelopment of a weather-type classification scheme for North America. Int. J. Clim., 22, 51-68, Sheridan, S. C., and Lee, C. C.: The self-organizing map in synoptic climatological research. Prog. Phys. Geog., 35, , Tawfik, A. B., and Dirmeyer, P. A.: A process-based framework for quantifying the atmospheric preconditioning of surface-triggered convection. Geophys. Res. Lett., 41, 1-6, Taylor, C. M. and Lebel, T.: Observational evidence of persistent convective-scale rainfall patterns, Mon. Weather Rev., 126, , Taylor, C. M., and Ellis, R. J.: Satellite detection of soil moisture impacts on convection at the mesoscale. Geophys. Res. Lett., 33,
160 Taylor, C. M., Parker, D. J., and Harris, P. P.: An observational case study of mesoscale atmospheric circulations induced by soil moisture. Geophys. Res. Lett., 34, Taylor, C. M., Gounou, A., Guichard, F., Harris, P. P., Ellis, R. J., Couvreux, F., and De Kauwe, M.: Frequency of Sahelian storm initiation enhanced over mesoscale soilmoisture patterns. Nature Geoscience, 4, , Taylor, C. M., de Jeu, R. A., Guichard, F., Harris, P. P., and Dorigo, W. A.: Afternoon rain more likely over drier soils, Nature, 489, , Taylor, C. M., Birch, C. E., Parker, D. J., Dixon, N., Guichard, F., Nikulin, G., and Lister, G. M. S.: Modeling soil moisture-precipitation feedback in the Sahel: Importance of spatial scale versus convective parameterization. Geophys. Res. Lett., 40, , Teuling, A. J., Seneviratne, S. I., Williams, C., and Troch, P. A.: Observed timescales of evapotranspiration response to soil moisture. Hydrol. Land Surf. Stud., 33, Vanos, J. K., Hebbern, C., and Cakmak, S.: Risk assessment for cardiovascular and respiratory mortality due to air pollution and synoptic meteorology in 10 Canadian cities. Env. Poll., 185, , Wang, J.K., Ford, T.W., and Quiring, S.M.: Distinguishing between unorganized and organized convection when examining soil moisture precipitation relationships. Wea. For., in review. Weaver, C. P., and Avissar, R.: Atmospheric disturbances caused by human modification of the landscape. Bull. Amer. Meteor. Soc., 82, , Weaver, C. P.: Coupling between large-scale atmospheric processes and mesoscale landatmosphere interactions in the U.S. Southern Great Plaisn during Summer. Part I: Case Studies. J. Hydrometeor., 5, , Wei, J., and Dirmeyer, P. A.: Dissecting soil moisture-precipitation coupling. Geophys. Res. Lett., 39, Wolters, D., van Heerwaarden, C.C., Vilà-Guerau de Arellano, J., Cappelaere, B., and Ramier, D.: Effects of soil moisture gradients on the path and the intensity of a West African squall line. Q. J. R. Meteorol. Soc., 136, , Wu, W. and Dickinson, R. E.: Time scales of layered soil moisture memory in the context of land-atmosphere interaction. J. Clim., 17, ,
161 Xia, Y., Sheffield, J., Ek, M. B., Dong, J., Chaney, N., Wei, H., Meng, J., and Wood, E.F.: Evaluation of multi-model simulated soil moisture in NLDAS-2. J. Hydrol., 512, ,

162 APPENDIX A FIGURES Figure A-1. Distribution of 25 cm soil moisture percentiles underlying convective precipitation events, analogous to the 5 cm soil moisture distribution in Figure 3.3. The frequency by which convective events initiate over relatively dry soils (< 50) is statistically significant. 147
163 Figure A-2. Histograms show distribution of frequency of randomly selected points which fall into each land cover category. The black lines represent the frequency of unorganized convective events to occur over each land cover category. 148
164 Figure A-3. Convective preciptiation event duration (hours) related with the change in PBL height from 0600 to 1200 LST. Events plotted here are from within 50 km of Lamont, OK. 149
")
165 Figure A-4. Average total precipitation accumulation (mm) associated with each of the 12 SOM patterns. 150

166 Figure A-5. Composites of soil moisture percentiles for all SOM patterns. Composites show average soil moisture percentiles for all days classified into each SOM pattern. 151
167 a. b. c. d. Figure A-6. Maps show the location of unorganized convective events (black circles) with respect to the dominant land cover types in Oklahoma. Events during SOM types 1, 2, 3, and 4 are shown here. 152
 with respect to the dominant land")
168 a. b. c. d. Figure A-7. Maps show the location of unorganized convective events (black circles) with respect to the dominant land cover types in Oklahoma. Events during SOM types 5, 6, 7, and 8 are shown here. 153
169 a. b. c. Figure A-8. Maps show the location of unorganized convective events (black circles) with respect to the dominant land cover types in Oklahoma. Events during SOM types 9, 10, and 11 are shown here. 154
170 Figure A-9. HYSPLIT back trajectories from all days throughout the study period, separated by SOM pattern. Roses show the predominant direction of the point of origin. 155
171 Figure A-10. HYSPLIT back trajectories from all event days, separated by SOM pattern. Roses show the predominant direction of the point of origin. 156


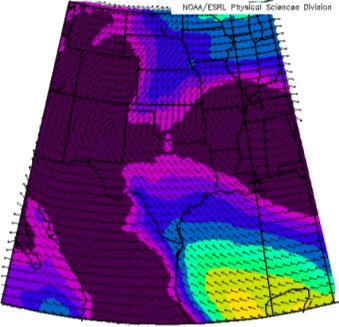
172 kg m -2 Figure A-11. Composites of total integrated moisture flux from all events in each SOM pattern. 157


173 kg m -2 Figure A-12. Composites of total integrated moisture flux from all events in each SOM pattern. 158


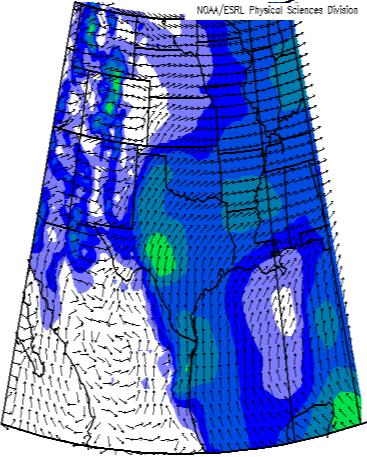


174 ms -1 Figure A-13. Composites of 850 mb wind vectors from all events in each SOM pattern. 159
 total solar radiation")
 maximum temperature anomalies during")
175 a. b. c. Figure A-14. Panels show daily (a) total solar radiation anomalies, (b) vapor pressure deficit anomalies, and (c) maximum temperature anomalies during pattern 8 dry soil event days. 160
 total solar radiation anomalies, (b) vapor pressure deficit anomalies, and")
176 a. b. c. Figure A-15. Panels show daily (a) total solar radiation anomalies, (b) vapor pressure deficit anomalies, and (c) maximum temperature anomalies during pattern 12 dry soil event days. 161
Soil Moisture Precipitation Coupling: Observations from the Oklahoma Mesonet and Underlying Physical Mechanisms
 1 2 3 4 5 6 7 8 9 10 11 12 13 14 15 16 17 18 19 20 21 22 23 24 25 26 27 28 29 30 Soil Moisture Precipitation Coupling: Observations from the Oklahoma Mesonet and Underlying Physical Mechanisms Trent W.
Diagnosing the Climatology and Interannual Variability of North American Summer Climate with the Regional Atmospheric Modeling System (RAMS)
") Diagnosing the Climatology and Interannual Variability of North American Summer Climate with the Regional Atmospheric Modeling System (RAMS) Christopher L. Castro and Roger A. Pielke, Sr. Department of
Diagnosing the Climatology and Interannual Variability of North American Summer Climate with the Regional Atmospheric Modeling System (RAMS) Christopher L. Castro and Roger A. Pielke, Sr. Department of
Daniel J. Cecil 1 Mariana O. Felix 1 Clay B. Blankenship 2. University of Alabama - Huntsville. University Space Research Alliance
 12A.4 SEVERE STORM ENVIRONMENTS ON DIFFERENT CONTINENTS Daniel J. Cecil 1 Mariana O. Felix 1 Clay B. Blankenship 2 1 University of Alabama - Huntsville 2 University Space Research Alliance 1. INTRODUCTION
Supplemental Material
 Supplemental Material Journal of Climate Interannual Variation of the Summer Rainfall Center in the South China Sea https://doi.org/10.1175/jcli-d-16-0889.s1. Copyright 2017 American Meteorological Society
CHAPTER 2 - ATMOSPHERIC CIRCULATION & AIR/SEA INTERACTION
 Chapter 2 - pg. 1 CHAPTER 2 - ATMOSPHERIC CIRCULATION & AIR/SEA INTERACTION The atmosphere is driven by the variations of solar heating with latitude. The heat is transferred to the air by direct absorption
Influence of variations in low-level moisture and soil moisture on the organization of summer convective systems in the US Midwest
 Influence of variations in low-level moisture and soil moisture on the organization of summer convective systems in the US Midwest Jimmy O. Adegoke 1, Sajith Vezhapparambu 1, Christopher L. Castro 2, Roger
Atmospheric Moisture, Precipitation, and Weather Systems
 Atmospheric Moisture, Precipitation, and Weather Systems 6 Chapter Overview The atmosphere is a complex system, sometimes described as chaotic in nature. In this chapter we examine one of the principal
Supplementary Figure 1. Summer mesoscale convective systems rainfall climatology and trends. Mesoscale convective system (MCS) (a) mean total
 (a) mean total") Supplementary Figure 1. Summer mesoscale convective systems rainfall climatology and trends. Mesoscale convective system (MCS) (a) mean total rainfall and (b) total rainfall trend from 1979-2014. Total
Supplementary Figure 1. Summer mesoscale convective systems rainfall climatology and trends. Mesoscale convective system (MCS) (a) mean total rainfall and (b) total rainfall trend from 1979-2014. Total
General Circulation. Nili Harnik DEES, Lamont-Doherty Earth Observatory
 General Circulation Nili Harnik DEES, Lamont-Doherty Earth Observatory nili@ldeo.columbia.edu Latitudinal Radiation Imbalance The annual mean, averaged around latitude circles, of the balance between the
NIDIS Intermountain West Drought Early Warning System April 18, 2017
 1 of 11 4/18/2017 3:42 PM Precipitation NIDIS Intermountain West Drought Early Warning System April 18, 2017 The images above use daily precipitation statistics from NWS COOP, CoCoRaHS, and CoAgMet stations.
A CLIMATE MODEL INVESTIGATION OF LOWER ATMOSPHERIC WIND SPEED BIASES OVER WIND FARM DEVELOPMENT REGIONS OF THE CONTINENTAL UNITED STATES
 A CLIMATE MODEL INVESTIGATION OF LOWER ATMOSPHERIC WIND SPEED BIASES OVER WIND FARM DEVELOPMENT REGIONS OF THE CONTINENTAL UNITED STATES 5.2 J. Craig Collier* Garrad Hassan Amercia, Inc. San Diego, CA
The relative impact of local connections vs distant teleconnections on a regions climate (or on hydrologic predictability) Jason Evans
 Jason Evans") The relative impact of local connections vs distant teleconnections on a regions climate (or on hydrologic predictability) Jason Evans Outline What do we need for hydrologic predictability Large scale
The relative impact of local connections vs distant teleconnections on a regions climate (or on hydrologic predictability) Jason Evans Outline What do we need for hydrologic predictability Large scale
Studying 2006 dry and 2007 wet events using surface observations and NCEP Reanalysis
 Studying 2006 dry and 2007 wet events using surface observations and NCEP Reanalysis Xiquan Dong, Baike Xi, and Aaron Kennedy University of North Dakota 1 Objectives 1. How do seasonal cycles of observed
Charles A. Doswell III, Harold E. Brooks, and Robert A. Maddox
 Charles A. Doswell III, Harold E. Brooks, and Robert A. Maddox Flash floods account for the greatest number of fatalities among convective storm-related events but it still remains difficult to forecast
Type of storm viewed by Spotter A Ordinary, multi-cell thunderstorm. Type of storm viewed by Spotter B Supecell thunderstorm
 ANSWER KEY Part I: Locating Geographical Features 1. The National Weather Service s Storm Prediction Center (www.spc.noaa.gov) has issued a tornado watch on a warm spring day. The watch covers a large
MPACT OF EL-NINO ON SUMMER MONSOON RAINFALL OF PAKISTAN
 MPACT OF EL-NINO ON SUMMER MONSOON RAINFALL OF PAKISTAN Abdul Rashid 1 Abstract: El-Nino is the dominant mod of inter- annual climate variability on a planetary scale. Its impact is associated worldwide
Why the Atlantic was surprisingly quiet in 2013
 1 Why the Atlantic was surprisingly quiet in 2013 by William Gray and Phil Klotzbach Preliminary Draft - March 2014 (Final draft by early June) ABSTRACT This paper discusses the causes of the unusual dearth
GE G Climate Science Lab
 GE G Climate Science Lab North American Soil Moisture Database: Development and Applications Steven M. Quiring Texas A&M University Trenton Ford Texas A&M University http://climatology.tamu.edu http://facebook.com/geogcsl
ANSWER KEY. Part I: Synoptic Scale Composite Map. Lab 12 Answer Key. Explorations in Meteorology 54
 ANSWER KEY Part I: Synoptic Scale Composite Map 1. Using Figure 2, locate and highlight, with a black dashed line, the 500-mb trough axis. Also, locate and highlight, with a black zigzag line, the 500-mb
The Texas drought. Kingtse Mo Climate Prediction Center NWS/NCEP/NOAA
 The 2011-2012 Texas drought Kingtse Mo Climate Prediction Center NWS/NCEP/NOAA 1 outline Evolution of the 2011-2012 Texas drought Climatology and historical perspective The 2011 drought Onset Feedback
The Boundary Layer and Related Phenomena
 The Boundary Layer and Related Phenomena Jeremy A. Gibbs University of Oklahoma gibbz@ou.edu February 19, 2015 1 / 49 Overview Nocturnal Low-Level Jets Introduction Climatology of LLJs Meteorological Importance
Precipitation. Standardized Precipitation Index. NIDIS Intermountain West Drought Early Warning System September 5, 2017
 9/6/2017 NIDIS Drought and Water Assessment NIDIS Intermountain West Drought Early Warning System September 5, 2017 Precipitation The images above use daily precipitation statistics from NWS COOP, CoCoRaHS,
Weather and Climate Summary and Forecast August 2018 Report
 Weather and Climate Summary and Forecast August 2018 Report Gregory V. Jones Linfield College August 5, 2018 Summary: July 2018 will likely go down as one of the top five warmest July s on record for many
Did we see the 2011 summer heat wave coming?
 GEOPHYSICAL RESEARCH LETTERS, VOL. 39,, doi:10.1029/2012gl051383, 2012 Did we see the 2011 summer heat wave coming? Lifeng Luo 1 and Yan Zhang 2 Received 16 February 2012; revised 15 March 2012; accepted
Weather and Climate Summary and Forecast Summer 2017
 Weather and Climate Summary and Forecast Summer 2017 Gregory V. Jones Southern Oregon University August 4, 2017 July largely held true to forecast, although it ended with the start of one of the most extreme
NIDIS Intermountain West Drought Early Warning System October 17, 2017
 NIDIS Drought and Water Assessment NIDIS Intermountain West Drought Early Warning System October 17, 2017 Precipitation The images above use daily precipitation statistics from NWS COOP, CoCoRaHS, and
Assimilation of satellite derived soil moisture for weather forecasting
 Assimilation of satellite derived soil moisture for weather forecasting www.cawcr.gov.au Imtiaz Dharssi and Peter Steinle February 2011 SMOS/SMAP workshop, Monash University Summary In preparation of the
Page 1. Name:
 Name: 1) As the difference between the dewpoint temperature and the air temperature decreases, the probability of precipitation increases remains the same decreases 2) Which statement best explains why
Seasonal Climate Watch January to May 2016
 Seasonal Climate Watch January to May 2016 Date: Dec 17, 2015 1. Advisory Most models are showing the continuation of a strong El-Niño episode towards the latesummer season with the expectation to start
Kirsten Findell (GFDL/NOAA) and Joe Santanello (NASA) Alpine Summer School on Land-Atmosphere Interactions Valsavarenche, Italy June 30, 2015
 and Joe Santanello (NASA) Alpine Summer School on Land-Atmosphere Interactions Valsavarenche, Italy June 30, 2015") Kirsten Findell (GFDL/NOAA) and Joe Santanello (NASA) Alpine Summer School on Land-Atmosphere Interactions Valsavarenche, Italy June 30, 2015 1 Outline Diurnal Land-Atmosphere (L-A) Processes Local Coupling
Kirsten Findell (GFDL/NOAA) and Joe Santanello (NASA) Alpine Summer School on Land-Atmosphere Interactions Valsavarenche, Italy June 30, 2015 1 Outline Diurnal Land-Atmosphere (L-A) Processes Local Coupling
Weather Outlook: 2015 Growing Season
 Weather Outlook: 2015 Growing Season Leon F. Osborne Chester Fritz Distinguished Professor Regional Weather Information Center University of North Dakota Grand Forks, North Dakota Why Should We Be Concerned?
A SATELLITE LAND DATA ASSIMILATION SYTEM COUPLED WITH A MESOSCALE MODEL: TOWARDS IMPROVING NUMERICAL WEATHER PREDICTION
 A SATELLITE LAND DATA ASSIMILATION SYTEM COUPLED WITH A MESOSCALE MODEL: TOWARDS IMPROVING NUMERICAL WEATHER PREDICTION Mohamed Rasmy*, Toshio Koike*, Souhail Bousseta**, Xin Li*** Dept. of Civil Engineering,
An ENSO-Neutral Winter
 An ENSO-Neutral Winter This issue of the Blue Water Outlook newsletter is devoted towards my thoughts on the long range outlook for winter. You will see that I take a comprehensive approach to this outlook
Foundations of Earth Science, 6e Lutgens, Tarbuck, & Tasa
 Foundations of Earth Science, 6e Lutgens, Tarbuck, & Tasa Weather Patterns and Severe Weather Foundations, 6e - Chapter 14 Stan Hatfield Southwestern Illinois College Air masses Characteristics Large body
2015: A YEAR IN REVIEW F.S. ANSLOW
 2015: A YEAR IN REVIEW F.S. ANSLOW 1 INTRODUCTION Recently, three of the major centres for global climate monitoring determined with high confidence that 2015 was the warmest year on record, globally.
1. Which weather map symbol is associated with extremely low air pressure? A) B) C) D) 2. The diagram below represents a weather instrument.
 B) C) D) 2. The diagram below represents a weather instrument.") 1. Which weather map symbol is associated with extremely low air pressure? 2. The diagram below represents a weather instrument. Which weather variable was this instrument designed to measure? A) air pressure
1. Which weather map symbol is associated with extremely low air pressure? 2. The diagram below represents a weather instrument. Which weather variable was this instrument designed to measure? A) air pressure
Neural Network Based Sensitivity Analysis of Summertime Convection over the Continental United States
 1958 J O U R N A L O F C L I M A T E VOLUME 27 Neural Network Based Sensitivity Analysis of Summertime Convection over the Continental United States FILIPE AIRES Estellus, and Laboratoire de l Etude du
P4.4 THE COMBINATION OF A PASSIVE MICROWAVE BASED SATELLITE RAINFALL ESTIMATION ALGORITHM WITH AN IR BASED ALGORITHM
 P4.4 THE COMBINATION OF A PASSIVE MICROWAVE BASED SATELLITE RAINFALL ESTIMATION ALGORITHM WITH AN IR BASED ALGORITHM Robert Joyce 1), John E. Janowiak 2), and Phillip A. Arkin 3, Pingping Xie 2) 1) RS
NIDIS Intermountain West Drought Early Warning System July 18, 2017
 NIDIS Drought and Water Assessment NIDIS Intermountain West Drought Early Warning System July 18, 2017 Precipitation The images above use daily precipitation statistics from NWS COOP, CoCoRaHS, and CoAgMet
NIDIS Intermountain West Drought Early Warning System September 4, 2018
 NIDIS Drought and Water Assessment NIDIS Intermountain West Drought Early Warning System September 4, 2018 Precipitation The images above use daily precipitation statistics from NWS COOP, CoCoRaHS, and
National Wildland Significant Fire Potential Outlook
 National Wildland Significant Fire Potential Outlook National Interagency Fire Center Predictive Services Issued: September, 2007 Wildland Fire Outlook September through December 2007 Significant fire
4.4 EVALUATION OF AN IMPROVED CONVECTION TRIGGERING MECHANISM IN THE NCAR COMMUNITY ATMOSPHERE MODEL CAM2 UNDER CAPT FRAMEWORK
 . EVALUATION OF AN IMPROVED CONVECTION TRIGGERING MECHANISM IN THE NCAR COMMUNITY ATMOSPHERE MODEL CAM UNDER CAPT FRAMEWORK Shaocheng Xie, James S. Boyle, Richard T. Cederwall, and Gerald L. Potter Atmospheric
ENSO and April SAT in MSA. This link is critical for our regression analysis where ENSO and
 Supplementary Discussion The Link between El Niño and MSA April SATs: Our study finds a robust relationship between ENSO and April SAT in MSA. This link is critical for our regression analysis where ENSO
Precipitation processes in the Middle East
 Precipitation processes in the Middle East J. Evans a, R. Smith a and R.Oglesby b a Dept. Geology & Geophysics, Yale University, Connecticut, USA. b Global Hydrology and Climate Center, NASA, Alabama,
J1.7 SOIL MOISTURE ATMOSPHERE INTERACTIONS DURING THE 2003 EUROPEAN SUMMER HEATWAVE
 J1.7 SOIL MOISTURE ATMOSPHERE INTERACTIONS DURING THE 2003 EUROPEAN SUMMER HEATWAVE E Fischer* (1), SI Seneviratne (1), D Lüthi (1), PL Vidale (2), and C Schär (1) 1 Institute for Atmospheric and Climate
Christopher L. Castro Department of Atmospheric Sciences University of Arizona
 Spatiotemporal Variability and Covariability of Temperature, Precipitation, Soil Moisture, and Vegetation in North America for Regional Climate Model Applications Christopher L. Castro Department of Atmospheric
APPENDIX B PHYSICAL BASELINE STUDY: NORTHEAST BAFFIN BAY 1
 APPENDIX B PHYSICAL BASELINE STUDY: NORTHEAST BAFFIN BAY 1 1 By David B. Fissel, Mar Martínez de Saavedra Álvarez, and Randy C. Kerr, ASL Environmental Sciences Inc. (Feb. 2012) West Greenland Seismic
Multi-day severe event of May 2013
 Abstract: Multi-day severe event of 18-22 May 2013 By Richard H. Grumm and Charles Ross National Weather Service State College, PA A relatively slow moving Trough over the western United States and a ridge
Francina Dominguez*, Praveen Kumar Department of Civil and Environmental Engineering University of Illinois at Urbana-Champaign
 P1.8 MODES OF INTER-ANNUAL VARIABILITY OF ATMOSPHERIC MOISTURE FLUX TRANSPORT Francina Dominguez*, Praveen Kumar Department of Civil and Environmental Engineering University of Illinois at Urbana-Champaign
16 Global Climate. Learning Goals. Summary. After studying this chapter, students should be able to:
 16 Global Climate Learning Goals After studying this chapter, students should be able to: 1. associate the world s six major vegetation biomes to climate (pp. 406 408); 2. describe methods for classifying
By: J Malherbe, R Kuschke
 2015-10-27 By: J Malherbe, R Kuschke Contents Summary...2 Overview of expected conditions over South Africa during the next few days...3 Significant weather events (27 October 2 November)...3 Conditions
5D.6 EASTERLY WAVE STRUCTURAL EVOLUTION OVER WEST AFRICA AND THE EAST ATLANTIC 1. INTRODUCTION 2. COMPOSITE GENERATION
 5D.6 EASTERLY WAVE STRUCTURAL EVOLUTION OVER WEST AFRICA AND THE EAST ATLANTIC Matthew A. Janiga* University at Albany, Albany, NY 1. INTRODUCTION African easterly waves (AEWs) are synoptic-scale disturbances
NIDIS Intermountain West Drought Early Warning System November 21, 2017
 NIDIS Drought and Water Assessment NIDIS Intermountain West Drought Early Warning System November 21, 2017 Precipitation The images above use daily precipitation statistics from NWS COOP, CoCoRaHS, and
Weather and Climate Summary and Forecast October 2018 Report
 Weather and Climate Summary and Forecast October 2018 Report Gregory V. Jones Linfield College October 4, 2018 Summary: Much of Washington, Oregon, coastal California and the Bay Area and delta region
P1.34 MULTISEASONALVALIDATION OF GOES-BASED INSOLATION ESTIMATES. Jason A. Otkin*, Martha C. Anderson*, and John R. Mecikalski #
 P1.34 MULTISEASONALVALIDATION OF GOES-BASED INSOLATION ESTIMATES Jason A. Otkin*, Martha C. Anderson*, and John R. Mecikalski # *Cooperative Institute for Meteorological Satellite Studies, University of
Seasonal and Spatial Patterns of Rainfall Trends on the Canadian Prairie
 Seasonal and Spatial Patterns of Rainfall Trends on the Canadian Prairie H.W. Cutforth 1, O.O. Akinremi 2 and S.M. McGinn 3 1 SPARC, Box 1030, Swift Current, SK S9H 3X2 2 Department of Soil Science, University
Characteristics of extreme convection over equatorial America and Africa
 Characteristics of extreme convection over equatorial America and Africa Manuel D. Zuluaga, K. Rasmussen and R. A. Houze Jr. Atmospheric & Climate Dynamics Seminar Department of Atmospheric Sciences, University
NIDIS Intermountain West Drought Early Warning System February 6, 2018
 NIDIS Intermountain West Drought Early Warning System February 6, 2018 Precipitation The images above use daily precipitation statistics from NWS COOP, CoCoRaHS, and CoAgMet stations. From top to bottom,
NOTES AND CORRESPONDENCE. Seasonal Variation of the Diurnal Cycle of Rainfall in Southern Contiguous China
 6036 J O U R N A L O F C L I M A T E VOLUME 21 NOTES AND CORRESPONDENCE Seasonal Variation of the Diurnal Cycle of Rainfall in Southern Contiguous China JIAN LI LaSW, Chinese Academy of Meteorological
Weather and Climate Summary and Forecast March 2018 Report
 Weather and Climate Summary and Forecast March 2018 Report Gregory V. Jones Linfield College March 7, 2018 Summary: The ridge pattern that brought drier and warmer conditions from December through most
5. General Circulation Models
 5. General Circulation Models I. 3-D Climate Models (General Circulation Models) To include the full three-dimensional aspect of climate, including the calculation of the dynamical transports, requires
Weather and Climate Summary and Forecast Winter
 Weather and Climate Summary and Forecast Winter 2016-17 Gregory V. Jones Southern Oregon University February 7, 2017 What a difference from last year at this time. Temperatures in January and February
NIDIS Intermountain West Drought Early Warning System February 12, 2019
 NIDIS Intermountain West Drought Early Warning System February 12, 2019 Precipitation The images above use daily precipitation statistics from NWS COOP, CoCoRaHS, and CoAgMet stations. From top to bottom,
Modeling rainfall diurnal variation of the North American monsoon core using different spatial resolutions
 Modeling rainfall diurnal variation of the North American monsoon core using different spatial resolutions Jialun Li, X. Gao, K.-L. Hsu, B. Imam, and S. Sorooshian Department of Civil and Environmental
2009 Progress Report To The National Aeronautics and Space Administration NASA Energy and Water Cycle Study (NEWS) Program
 Program") 2009 Progress Report To The National Aeronautics and Space Administration NASA Energy and Water Cycle Study (NEWS) Program Proposal Title: Grant Number: PI: The Challenges of Utilizing Satellite Precipitation
2009 Progress Report To The National Aeronautics and Space Administration NASA Energy and Water Cycle Study (NEWS) Program Proposal Title: Grant Number: PI: The Challenges of Utilizing Satellite Precipitation
How Patterns Far Away Can Influence Our Weather. Mark Shafer University of Oklahoma Norman, OK
 Teleconnections How Patterns Far Away Can Influence Our Weather Mark Shafer University of Oklahoma Norman, OK Teleconnections Connectedness of large-scale weather patterns across the world If you poke
Analysis of Severe Storm Initiation Along Drylines in the Southern Plains
 Analysis of Severe Storm Initiation Along Drylines in the Southern Plains NICOLE L. BARBEE Meteorology Program, Iowa State University, Ames Mentor: Dr. William Gallus 1 1 Department of Geological and Atmospheric
Impacts of the April 2013 Mean trough over central North America
 Impacts of the April 2013 Mean trough over central North America By Richard H. Grumm National Weather Service State College, PA Abstract: The mean 500 hpa flow over North America featured a trough over
Weather and Climate Summary and Forecast Fall/Winter 2016
 Weather and Climate Summary and Forecast Fall/Winter 2016 Gregory V. Jones Southern Oregon University November 5, 2016 After a year where we were seemingly off by a month in terms of temperatures (March
Land Surface Processes and Their Impact in Weather Forecasting
 Land Surface Processes and Their Impact in Weather Forecasting Andrea Hahmann NCAR/RAL with thanks to P. Dirmeyer (COLA) and R. Koster (NASA/GSFC) Forecasters Conference Summer 2005 Andrea Hahmann ATEC
A COMPARISON OF THE MM5 AND THE RAMS SIMULATIONS FOR LAND-ATMOSPHERE INTERACTIONS UNDER VARYING SOIL MOISTURE. (Submitted to: Tellus A)
") A COMPARISON OF THE MM5 AND THE RAMS SIMULATIONS FOR LAND-ATMOSPHERE INTERACTIONS UNDER VARYING SOIL MOISTURE (Submitted to: Tellus A) Astrid Suarez 1, Rezaul Mahmood*, and Arturo I. Quintanar 2 Meteorology
A COMPARISON OF THE MM5 AND THE RAMS SIMULATIONS FOR LAND-ATMOSPHERE INTERACTIONS UNDER VARYING SOIL MOISTURE (Submitted to: Tellus A) Astrid Suarez 1, Rezaul Mahmood*, and Arturo I. Quintanar 2 Meteorology
Climate and the Atmosphere
 Climate and Biomes Climate Objectives: Understand how weather is affected by: 1. Variations in the amount of incoming solar radiation 2. The earth s annual path around the sun 3. The earth s daily rotation
Mozambique. General Climate. UNDP Climate Change Country Profiles. C. McSweeney 1, M. New 1,2 and G. Lizcano 1
 UNDP Climate Change Country Profiles Mozambique C. McSweeney 1, M. New 1,2 and G. Lizcano 1 1. School of Geography and Environment, University of Oxford. 2.Tyndall Centre for Climate Change Research http://country-profiles.geog.ox.ac.uk
Lecture #14 March 29, 2010, Monday. Air Masses & Fronts
 Lecture #14 March 29, 2010, Monday Air Masses & Fronts General definitions air masses source regions fronts Air masses formation types Fronts formation types Air Masses General Definitions a large body
Extreme Weather Events and Climate Change
 Extreme Weather Events and Climate Change Robert M Rabin NOAA/National Severe Storms Lab Norman, Oklahoma Most material presented is from: Climate Change 2013: The Physical Science Basis. Intergovernmental
Climate Dynamics (PCC 587): Hydrologic Cycle and Global Warming
: Hydrologic Cycle and Global Warming") Climate Dynamics (PCC 587): Hydrologic Cycle and Global Warming D A R G A N M. W. F R I E R S O N U N I V E R S I T Y O F W A S H I N G T O N, D E P A R T M E N T O F A T M O S P H E R I C S C I E N C
Climate Dynamics (PCC 587): Hydrologic Cycle and Global Warming D A R G A N M. W. F R I E R S O N U N I V E R S I T Y O F W A S H I N G T O N, D E P A R T M E N T O F A T M O S P H E R I C S C I E N C
WaVaCS summerschool Autumn 2009 Cargese, Corsica
 Introduction Part I WaVaCS summerschool Autumn 2009 Cargese, Corsica Holger Tost Max Planck Institute for Chemistry, Mainz, Germany Introduction Overview What is a parameterisation and why using it? Fundamentals
PRMS WHITE PAPER 2014 NORTH ATLANTIC HURRICANE SEASON OUTLOOK. June RMS Event Response
 PRMS WHITE PAPER 2014 NORTH ATLANTIC HURRICANE SEASON OUTLOOK June 2014 - RMS Event Response 2014 SEASON OUTLOOK The 2013 North Atlantic hurricane season saw the fewest hurricanes in the Atlantic Basin
RR#4 - Multiple Choice
 1. The map below shows the amount of snowfall, in inches, produced by a lake-effect snowstorm in central New York State. The wind that produced this snowfall pattern most likely came from the 1) northeast
Practical Use of the Skew-T, log-p diagram for weather forecasting. Primer on organized convection
 Practical Use of the Skew-T, log-p diagram for weather forecasting Primer on organized convection Outline Rationale and format of the skew-t, log-p diagram Some basic derived diagnostic measures Characterizing
Mesoscale and High Impact Weather in the South American Monsoon Leila M. V. Carvalho 1 and Maria A. F. Silva Dias 2 1
 Mesoscale and High Impact Weather in the South American Monsoon Leila M. V. Carvalho 1 and Maria A. F. Silva Dias 2 1 University of California, Santa Barbara 2 University of Sao Paulo, Brazil Objectives
Weather and Climate Summary and Forecast February 2018 Report
 Weather and Climate Summary and Forecast February 2018 Report Gregory V. Jones Linfield College February 5, 2018 Summary: For the majority of the month of January the persistent ridge of high pressure
Name the surface winds that blow between 0 and 30. GEO 101, February 25, 2014 Monsoon Global circulation aloft El Niño Atmospheric water
 GEO 101, February 25, 2014 Monsoon Global circulation aloft El Niño Atmospheric water Name the surface winds that blow between 0 and 30 What is the atmospheric pressure at 0? What is the atmospheric pressure
and 24 mm, hPa lapse rates between 3 and 4 K km 1, lifted index values
 3.2 Composite analysis 3.2.1 Pure gradient composites The composite initial NE report in the pure gradient northwest composite (N = 32) occurs where the mean sea level pressure (MSLP) gradient is strongest
152 STATISTICAL PREDICTION OF WATERSPOUT PROBABILITY FOR THE FLORIDA KEYS
 152 STATISTICAL PREDICTION OF WATERSPOUT PROBABILITY FOR THE FLORIDA KEYS Andrew Devanas 1, Lydia Stefanova 2, Kennard Kasper 1, Sean Daida 1 1 NOAA/National Wear Service, Key West, Florida, 2 COAPS/Florida
p = ρrt p = ρr d = T( q v ) dp dz = ρg
 dp dz = ρg") Chapter 1: Properties of the Atmosphere What are the major chemical components of the atmosphere? Atmospheric Layers and their major characteristics: Troposphere, Stratosphere Mesosphere, Thermosphere
Chapter 1: Properties of the Atmosphere What are the major chemical components of the atmosphere? Atmospheric Layers and their major characteristics: Troposphere, Stratosphere Mesosphere, Thermosphere
Chapter 12 Fronts & Air Masses
 Chapter overview: Anticyclones or highs Air Masses o Classification o Source regions o Air masses of North America Fronts o Stationary fronts o Cold fronts o Warm fronts o Fronts and the jet stream o Frontogenesis
Monthly Long Range Weather Commentary Issued: July 18, 2014 Steven A. Root, CCM, President/CEO
 Monthly Long Range Weather Commentary Issued: July 18, 2014 Steven A. Root, CCM, President/CEO sroot@weatherbank.com JUNE 2014 REVIEW Climate Highlights The Month in Review The average temperature for
NIDIS Intermountain West Drought Early Warning System October 30, 2018
 10/30/2018 NIDIS Drought and Water Assessment NIDIS Intermountain West Drought Early Warning System October 30, 2018 Precipitation The images above use daily precipitation statistics from NWS COOP, CoCoRaHS,
Characteristics of Global Precipitable Water Revealed by COSMIC Measurements
 Characteristics of Global Precipitable Water Revealed by COSMIC Measurements Ching-Yuang Huang 1,2, Wen-Hsin Teng 1, Shu-Peng Ho 3, Ying-Hwa Kuo 3, and Xin-Jia Zhou 3 1 Department of Atmospheric Sciences,
Use of the Combined Pacific Variability Mode for Climate Prediction in North America
 Use of the Combined Pacific Variability Mode for Climate Prediction in North America Christopher L. Castro,, Stephen Bieda III, and Francina Dominguez University of Arizona Regional Climate Forum for Northwest
Weather and Climate Summary and Forecast April 2018 Report
 Weather and Climate Summary and Forecast April 2018 Report Gregory V. Jones Linfield College April 4, 2018 Summary: A near Miracle March played out bringing cooler and wetter conditions to the majority
The Climate of Payne County
 The Climate of Payne County Payne County is part of the Central Great Plains in the west, encompassing some of the best agricultural land in Oklahoma. Payne County is also part of the Crosstimbers in the
1. Header Land-Atmosphere Predictability Using a Multi-Model Strategy Paul A. Dirmeyer (PI) Zhichang Guo (Co-I) Final Report
 Zhichang Guo (Co-I) Final Report") 1. Header Land-Atmosphere Predictability Using a Multi-Model Strategy Paul A. Dirmeyer (PI) Zhichang Guo (Co-I) Final Report 2. Results and Accomplishments Output from multiple land surface schemes (LSS)
1. Header Land-Atmosphere Predictability Using a Multi-Model Strategy Paul A. Dirmeyer (PI) Zhichang Guo (Co-I) Final Report 2. Results and Accomplishments Output from multiple land surface schemes (LSS)
Evidence for Weakening of Indian Summer Monsoon and SA CORDEX Results from RegCM
 Evidence for Weakening of Indian Summer Monsoon and SA CORDEX Results from RegCM S K Dash Centre for Atmospheric Sciences Indian Institute of Technology Delhi Based on a paper entitled Projected Seasonal
Application and verification of ECMWF products 2011
 Application and verification of ECMWF products 2011 National Meteorological Administration 1. Summary of major highlights Medium range weather forecasts are primarily based on the results of ECMWF and
Summer 2018 Southern Company Temperature/Precipitation Forecast
 Scott A. Yuknis High impact weather forecasts, climate assessment and prediction. 14 Boatwright s Loop Plymouth, MA 02360 Phone/Fax 508.927.4610 Cell: 508.813.3499 ClimateImpact@comcast.net Climate Impact
The Climate of Kiowa County
 The Climate of Kiowa County Kiowa County is part of the Central Great Plains, encompassing some of the best agricultural land in Oklahoma. Average annual precipitation ranges from about 24 inches in northwestern
Zambia. General Climate. Recent Climate Trends. UNDP Climate Change Country Profiles. Temperature. C. McSweeney 1, M. New 1,2 and G.
 UNDP Climate Change Country Profiles Zambia C. McSweeney 1, M. New 1,2 and G. Lizcano 1 1. School of Geography and Environment, University of Oxford. 2. Tyndall Centre for Climate Change Research http://country-profiles.geog.ox.ac.uk
Analysis of meteorological measurements made over three rainy seasons in Sinazongwe District, Zambia.
 Analysis of meteorological measurements made over three rainy seasons in Sinazongwe District, Zambia. 1 Hiromitsu Kanno, 2 Hiroyuki Shimono, 3 Takeshi Sakurai, and 4 Taro Yamauchi 1 National Agricultural