Cloud parameterization and cloud prediction scheme in Eta numerical weather model
|
|
|
- Irma Simpson
- 5 years ago
- Views:
Transcription


1 Cloud parameterization and cloud prediction scheme in Eta numerical weather model Belgrade, 10th September, 2018 Ivan Ristić, CEO at Weather2 Ivana Kordić, meteorologist at Weather2
2 Introduction Models that have radiation effect included describe condensation with diagnostic formulations give little regard to consistency with model-produced condensation fields. Sundqvist, et al. (1988) had proposed parameterization scheme for convective and stratiform condensation that is using cloud water and cloud fraction as prognostic variables: Good results when it comes to cloud water and precipitation forecasts. Formulation of fractional cloud cover depended only on the relative humidity, due to that, amount of low fraction cloud cover were unpredicted. The amount of model cloud water had magnitude that possibly was unrealistically large. Because of this inconsistency, formula for fractional cloud cover did not produce good results when used in radiation scheme. This was the reason why the diagnostic formulation started to be used again.
3 Introduction New scheme implemented in the Eta model is based on using three prognostic equations: fractional cloud cover, cloud mixing ratio and snow per cloud fraction. New fractional cloud cover formula, in addition to relative humidity, has cloud mixing ratio included. Adding new prognostic variable into the equation gives much more realistic description of cloud cover. Clouds predicted like this can be used in the model radiation calculations.
4 Thermodynamic wet bulb concept Thermodynamic wet bulb temperature as cloud temperature. Energy balance: c p T s + L q s T s = c p T + L q Moist static energy of model grid box and cloudy part inside the grid box stays the same. Principle of energy conservation is satisfied. p=const. Figure 1. Grid box and cloud part inside the grid box
5 Description of the cloud prediction scheme Simplified prognostic equations for specific humidity, q temperature, T and cloud water/ice (both cloud liquid water and cloud ice) mixing ratio m are: q t = A q Q T t = A T + L C p Q m t = A m + Q
6 Description of the cloud prediction scheme Saturated specific humidity in cloud scheme is expressed as function of wet bulb temperature, q s = q s T s The advantage of this approach is that saturated specific humidity is constant during water phase changes and can be written with advection tendencies part only: q s t = A q s Relative humidity that is used in the scheme is presented with: U = q q s
7 Description of the cloud prediction scheme Change of specific humidity can be expressed as: q t = (U q s t ) = U q s t + q s U t Using prognostic equation for specific humidity and combining it with previous equation, we can obtain: Q = A q U q t = A q U q s t q s U t Q = M q s U t
8 Description of the cloud prediction scheme M represents the convergence of available latent heat (s -1 ) into the grid box, given as: M = A q U q s t = A q U A qs The quantity M in a grid box is divided into two parts: one part goes into the cloudy portion and condenses and another part goes to into the cloud-free portion and increase the relative humidity. These parts will be (respectively): Q = bm q s U t = 1 b M
9 Cloud formula Cloud fraction b at grid point can be estimate using relative humidity and cloud humidity: b = b U, U m, U 00, U s = 1 (U s U )/(U s + U m U 00 ) U 00 is critical relative humidity in function of wet bulb temperature. Cloud fraction b can be written also as: b = 1 (U s U )/(U s U + U + U m U 00 ) U U s» b = 1 U s + U m U 00 = const. Ø» b = Ø U < U 00 evaporation, U > U 00 and M > 0 condensation
10 Relation between U 00 and U 00 During water phase changes, temperature and specific humidity are changed to values T 00 and q 00 : c p T + L q = c p T 00 + L q 00 q 00 = U 00 q s T 00 = U 00 q s Finally, the relation between relative humidity and relative humidity as function of wet bulb temperature is: U 00 = U 00 q s(t 00 ) q s Value of critical relative humidity changes with height. Near surface value of U 00 is 0.95 and decreases with a height of up to a value of 0.80 over ocean, to avoid excessive condensation and 0.75 over land.
11 Cloud parameterization Stratiform clouds in this scheme consist of either liquid water or ice particles, depending on the thermodynamic ice bulb temperature (Ts). Parts of the cloud where Ts 0ºC consists only of liquid water, while in parts where Ts < -15ºC, the cloud consists of only ice particles (Figure 2). In the regions where -15ºC < Ts < 0ºC the phase of hydrometeors is determined by the cloud-top ice bulb temperature (Tp). If Tp 15 ºC cloud consist of supercooled water if Tp < 15 ºC cloud consist of ice particles. Figure 2. Distribution of cloud water and cloud ice inside the cloud
 Melting of the snow Psm = Psm 1 + Psm 2 Psm 1 = evps Cp (T si 273.16)/eliw Psm 2 = Cws Cr m Ps Figure 3.")
12 Precipitation Autoconversion Praut = a r (m m i0 ) Psaut = a s (m m i0 ) Accretion and coalescence Pracw = m Cr ( Pr + Ps) Psaci = m Cs Ps Evaporation and sublimation Err = evpr (q sw q) Ers = evps (q si q) Melting of the snow Psm = Psm 1 + Psm 2 Psm 1 = evps Cp (T si )/eliw Psm 2 = Cws Cr m Ps Figure 3. Schematic illustration of microphysical processes in the cloud prediction scheme
13 Sedimentation of ice and snow Ice sedimentation is the main sink of ice particles. Process of aggregation can increase ice sedimentation rate, (larger particles fall faster). Sedimentation is expressed as a function of variables that can affect the rates of ice growth and velocity, such as: density of air, temperature and thickness of layer in which certain cloud content mixing ratio is present. Specific temperature coefficient is used to account the temperature effects on these rates and it is defined by expression for terminal velocity of ice and snow respectively: p V ice = 0.15 ( ) ( T s 233 ) V snow = 1.0 e (T s ) Sedimentation rate is calculated level by level from top to bottom using implicit solution method, which prevents sudden changes in values for ice parameters and further oscillations during calculation.
14 Results 17. November Eta model with ECMWF as boundary data. Model run for 72 hours in horizontal resolution of about 22 km and vertical resolution of 38 layers for the Europe domain. First test situation: fog. Satellite image and Eta model predicted cloud cover over Europe. Eta model predicted temperature inversion in the observed region. Sounding for main station in Belgrade, Serbia. Temperature inversion is measured. Reduced surface visibility. Significant weather map from SYNOP reports shows fog is observed in the specified area.

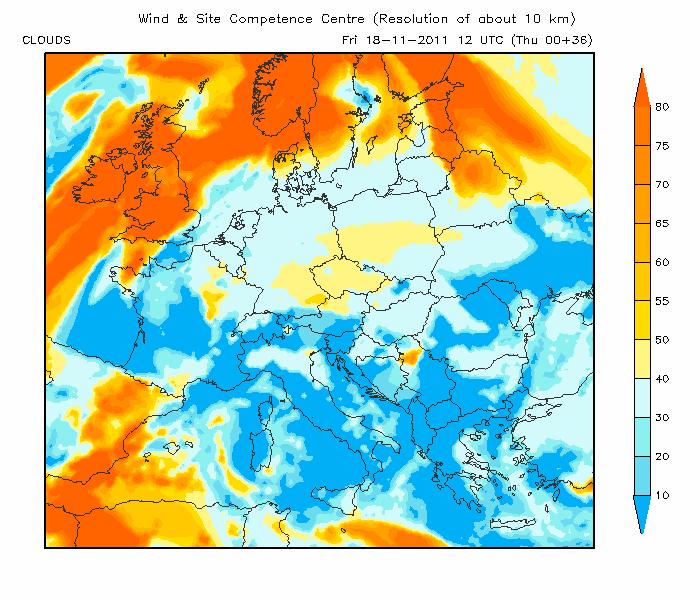
15 Results 17. November Figure 4. Satellite cloud picture at at 11 UTC Figure 5. Predicted cloud cover from Eta model at at 12 am UTC
 from Eta model at 18.")
16 Results 17. November Figure 6. Predicted surface visibility (m) from Eta model at at 9 am UTC
 from Eta model at")
 from Eta model")
17 Results 17. November Figure 7a. Predicted 2m temperature ( C) from Eta model at at 12 am UTC Figure 7b. Predicted 850mb temperature ( C) from Eta model at at 12 am UTC


18 Results 17. November Figure 8. Sounding Skew-T for main weather station Belgrade, Serbia at at 12 am UTC ( Figure 9. Significant weather map from SYNOP reports at at 12 am UTC (
19 Results 24. June Eta model with ECMWF as boundary data. Model was run for 24 hours in horizontal resolution of about 22 km and a vertical resolution of 38 layers for the Europe domain. Second test situation: mid-morning precipitation over northern Serbia. Satellite cloud picture and Eta model predicted cloud cover. GSOD 24h accumulated precipitation data (mm) from WMO and predicted 6h accumulated precipitation (mm) from Eta model for observed area.

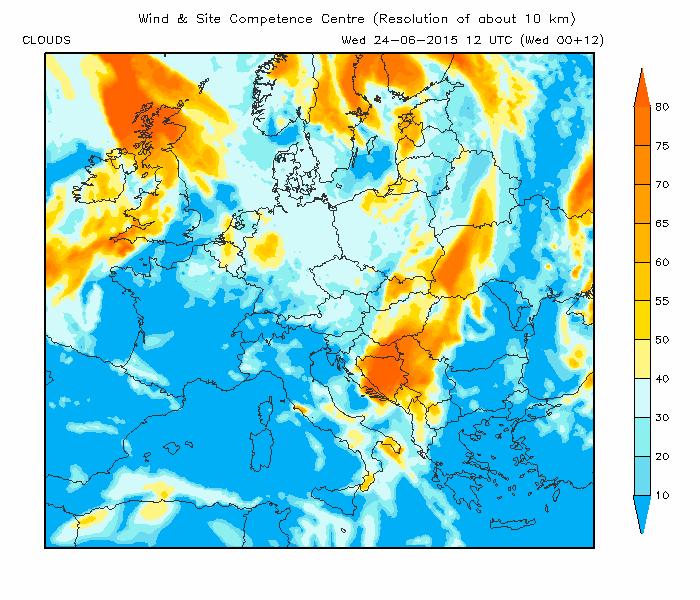
20 Results 24. June Figure 10. Satellite cloud picture at at 12 UTC Figure 11. Predicted cloud cover from Eta model at at 12 UTC
 from GSOD data at 25.6.")

21 Results 24. June Figure h accumulated precipitation (mm) from GSOD data at at 00 UTC Figure 13. Predicted 6h accumulated precipitation (mm) from Eta model (mm/6h) at at 12 UTC
22 Mountain blocking and Eta model During the years of research, it was noticed that during the winter, Eta model in some situations does not forecast snow in the areas of Croatia, Slovenia and northern Italy. For a long time this was thought to be caused by the η coordinate, however using Eta model with σ and WRF model with hybrid coordinate gave similar results. In 2009 mountain blocking and gravity wave drag were implemented in the WRF model and that solved problems. After almost 10 years we now know that it is impossible to run σ or hybrid model in correct way without this option. We added mountain blocking and gravity wave drag in the Eta model by using same principle as in the WRF model. In that way Eta model with σ coordinate gave good results in same weather situations.
23 Mountain blocking and Eta model Next challenge was to achieve the effects of the mountain blocking and gravity wave drag, without their insertion, but using η coordinate. After long period of researching and testing the problem was solved by using a differently defined orography. After creating silhouette-mean step Eta topography, we are finding peaks which have more than 2000 m altitude. For those points instead standard Eta topography we will use silhouette-mean+stddev step Eta topography, which was made by adding standard deviation to mean altitude. With this definition of new orography of the model good sides of silhouettemean step Eta topography were preserved.
24 Mountain blocking and Eta model Some weather situation regarding these changes in the Eta model will be represented using model with 0.15 resolution on weather situation from: 17 th December,2011. (snow in Croatia) 9 th December, (snow in Croatia and Slovenia) and, 13 th January, (snow in Venice)
 from Eta model (mm/6h) with standard orography at 17.12.2011. at 00 UTC Figure 15.")
25 Eta model with standard orography vs. Eta model with new orography Figure 14. Predicted 6h accumulated precipitation (mm) from Eta model (mm/6h) with standard orography at at 00 UTC Figure 15. Predicted 6h accumulated precipitation (mm) from Eta model (mm/6h) with new orography at at 00 UTC
 Figure 17. Predicted 6h accumulated precipitation (mm) from Eta model (mm/6h) with new orography at 17.12.2011.")
26 Eta model with standard orography vs. Eta model with new orography Figure 16. Predicted 6h accumulated precipitation (mm) from Eta model (mm/6h) with standard orography at at 00 UTC (zoomed region of Italy and Balkan) Figure 17. Predicted 6h accumulated precipitation (mm) from Eta model (mm/6h) with new orography at at 00 UTC (zoomed region of Italy and Balkan)
 Figure 19. Predicted 6h accumulated snow (mm) from Eta model (mm/6h) with new orography at 17.12.2011.")
27 Eta model with standard orography vs. Eta model with new orography snow in Croatia Figure 18. Predicted 6h accumulated snow (mm) from Eta model (mm/6h) with standard orography at at 06 UTC (zoomed region of Italy and Balkan) Figure 19. Predicted 6h accumulated snow (mm) from Eta model (mm/6h) with new orography at at 06 UTC (zoomed region of Italy and Balkan)
 Figure 21. Predicted mean sea level pressure and wind speed at 10m from Eta model (m/s) with new orography at 9.12.2010.")
28 Eta model with standard orography vs. Eta model with new orography Figure 20. Predicted mean sea level pressure and wind speed at 10m from Eta model (m/s) with standard orography at at 15 UTC (zoomed region of Italy and Balkan) Figure 21. Predicted mean sea level pressure and wind speed at 10m from Eta model (m/s) with new orography at at 15 UTC (zoomed region of Italy and Balkan)
")
29 Eta model with standard orography vs. Eta model with new orography-snow in Croatia and Slovenia Figure 22. Predicted 6h accumulated snow (mm) from Eta model (mm/6h) with standard orography at at 18 UTC (zoomed region of Italy and Balkan) Figure 23. Predicted 6h accumulated snow (mm) from Eta model (mm/6h) with new orography at at 18 UTC (zoomed region of Italy and Balkan)
 Figure 25. Predicted 6h accumulated snow (mm) from Eta model (mm/6h) with new orography at 13.1.2017. at 18 UTC (zoomed region of Italy and Balkan)")
30 Eta model with standard orography vs. Eta model with new orography-snow in Venice (Italy) Figure 24. Predicted 6h accumulated snow (mm) from Eta model (mm/6h) with standard orography at at 18 UTC (zoomed region of Italy and Balkan) Figure 25. Predicted 6h accumulated snow (mm) from Eta model (mm/6h) with new orography at at 18 UTC (zoomed region of Italy and Balkan)
 Figure 27. Predicted 6h accumulated precipitation (mm) from Eta model (mm/6h) with new orography at 13.1.2017.")
31 Eta model with standard orography vs. Eta model with new orography Figure 26. Predicted 6h accumulated precipitation (mm) from Eta model (mm/6h) with standard orography at at 18 UTC (zoomed region of Italy and Balkan) Figure 27. Predicted 6h accumulated precipitation (mm) from Eta model (mm/6h) with new orography at at 18 UTC (zoomed region of Italy and Balkan)
 Figure 29. Predicted 6h accumulated precipitation (mm) from Eta model (mm/6h) with new orography at 13.1.2017.")
32 Eta model with standard orography vs. Eta model with new orography Figure 28. Predicted 6h accumulated precipitation (mm) from Eta model (mm/6h) with standard orography at at 12 UTC (zoomed region of Italy and Balkan) Figure 29. Predicted 6h accumulated precipitation (mm) from Eta model (mm/6h) with new orography at at 12 UTC (zoomed region of Italy and Balkan)
33 Thank you for your attention.
ECMWF Workshop on "Parametrization of clouds and precipitation across model resolutions
 ECMWF Workshop on "Parametrization of clouds and precipitation across model resolutions Themes: 1. Parametrization of microphysics 2. Representing sub-grid cloud variability 3. Constraining cloud and precipitation
Towards predicting high-impact freezing rain events
 ECMWF Newsletter No. 141 Autumn 214 Towards predicting high-impact freezing rain events Richard Forbes, Ivan Tsonevsky, Tim Hewson, Martin Leutbecher The term freezing rain usually refers to the occurrence
Water in the Atmosphere
 Water in the Atmosphere Characteristics of Water solid state at 0 o C or below (appearing as ice, snow, hail and ice crystals) liquid state between 0 o C and 100 o C (appearing as rain and cloud droplets)
Chapter 4 Water Vapor
 Chapter 4 Water Vapor Chapter overview: Phases of water Vapor pressure at saturation Moisture variables o Mixing ratio, specific humidity, relative humidity, dew point temperature o Absolute vs. relative
Page 1. Name:
 Name: 1) As the difference between the dewpoint temperature and the air temperature decreases, the probability of precipitation increases remains the same decreases 2) Which statement best explains why
The skill of ECMWF cloudiness forecasts
 from Newsletter Number 143 Spring 215 METEOROLOGY The skill of ECMWF cloudiness forecasts tounka25/istock/thinkstock doi:1.21957/lee5bz2g This article appeared in the Meteorology section of ECMWF Newsletter
Chapter The transition from water vapor to liquid water is called. a. condensation b. evaporation c. sublimation d.
 Chapter-6 Multiple Choice Questions 1. The transition from water vapor to liquid water is called. a. condensation b. evaporation c. sublimation d. deposition 2. The movement of water among the great global
A brief overview of the scheme is given below, taken from the whole description available in Lopez (2002).
.") Towards an operational implementation of Lopez s prognostic large scale cloud and precipitation scheme in ARPEGE/ALADIN NWP models F.Bouyssel, Y.Bouteloup, P. Marquet Météo-France, CNRM/GMAP, 42 av. G.
Towards an operational implementation of Lopez s prognostic large scale cloud and precipitation scheme in ARPEGE/ALADIN NWP models F.Bouyssel, Y.Bouteloup, P. Marquet Météo-France, CNRM/GMAP, 42 av. G.
Parametrizing Cloud Cover in Large-scale Models
 Parametrizing Cloud Cover in Large-scale Models Stephen A. Klein Lawrence Livermore National Laboratory Ming Zhao Princeton University Robert Pincus Earth System Research Laboratory November 14, 006 European
WRF Model Simulated Proxy Datasets Used for GOES-R Research Activities
 WRF Model Simulated Proxy Datasets Used for GOES-R Research Activities Jason Otkin Cooperative Institute for Meteorological Satellite Studies Space Science and Engineering Center University of Wisconsin
New applications using real-time observations and ECMWF model data
 New applications using real-time observations and ECMWF model data 12 th Workshop on Meteorological Operational Systems Wim van den Berg [senior meteorological researcher, project coordinator] Overview
A new theory for moist convection in statistical equilibrium
 A new theory for moist convection in statistical equilibrium A. Parodi(1), K. Emanuel(2) (2) CIMA Research Foundation,Savona, Italy (3) EAPS, MIT, Boston, USA True dynamics: turbulent, moist, non-boussinesq,
Chapter 7. Water and Atmospheric Moisture. Water on Earth Unique Properties of Water Humidity Atmospheric Stability Clouds and Fog
 Chapter 7 Water and Atmospheric Moisture Robert W. Christopherson Charlie Thomsen Water kept both the terrestrial and marine ecosystems closely linked with the atmosphere. (1) Air carries water vapor and
Science Chapter 13,14,15
 Science 1206 Chapter 13,14,15 1 Weather dynamics is the study of how the motion of water and air causes weather patterns. Energy from the Sun drives the motion of clouds, air, and water. Earth s tilt at
Precipitation Structure and Processes of Typhoon Nari (2001): A Modeling Propsective
: A Modeling Propsective") Precipitation Structure and Processes of Typhoon Nari (2001): A Modeling Propsective Ming-Jen Yang Institute of Hydrological Sciences, National Central University 1. Introduction Typhoon Nari (2001) struck
Precipitation Structure and Processes of Typhoon Nari (2001): A Modeling Propsective Ming-Jen Yang Institute of Hydrological Sciences, National Central University 1. Introduction Typhoon Nari (2001) struck
Chapter 6 Clouds. Cloud Development
 Chapter 6 Clouds Chapter overview Processes causing saturation o Cooling, moisturizing, mixing Cloud identification and classification Cloud Observations Fog Why do we care about clouds in the atmosphere?
Claus Petersen* and Bent H. Sass* Danish Meteorological Institute Copenhagen, Denmark
 6.8 Improving of road weather forecasting by using high resolution satellite data Claus Petersen* and Bent H. Sass* Danish Meteorological Institute Copenhagen, Denmark. INTRODUCTION Observations of high
The performance of the operational 4km resolution HIRLAM and UM runs at met.no. met.no R&D Dept.
 The performance of the operational 4km resolution HIRLAM and UM runs at met.no Thor Erik Nordeng met.no R&D Dept. Outline - Hirlam and UM set-up - Long term performance verification of surface temp, wind
Atmospheric Processes
 Atmospheric Processes Atmospheric prognostic variables Wind Temperature Humidity Cloud Water/Ice Atmospheric processes Mixing Radiation Condensation/ Evaporation Precipitation Surface exchanges Friction
WEATHER. Review Note Cards
 WEATHER Review Note Cards Thermometer Weather instrument that measures air temperature Units include F, C, and K ESRT 13 Sling Psychrometer Weather instrument that measures relative humidity and dewpoint
ECMWF Overview. The European Centre for Medium-Range Weather Forecasts is an international. organisation supported by 23 European States.
 ECMWF Overview The European Centre for Medium-Range Weather Forecasts is an international organisation supported by 3 European States. The center was established in 1973 by a Convention and the real-time
5. General Circulation Models
 5. General Circulation Models I. 3-D Climate Models (General Circulation Models) To include the full three-dimensional aspect of climate, including the calculation of the dynamical transports, requires
INTRODUCTION TO METEOROLOGY PART ONE SC 213 MAY 21, 2014 JOHN BUSH
 INTRODUCTION TO METEOROLOGY PART ONE SC 213 MAY 21, 2014 JOHN BUSH WEATHER PATTERNS Extratropical cyclones (low pressure core) and anticyclones (high pressure core) Cold fronts and warm fronts Jet stream
1., annual precipitation is greater than annual evapotranspiration. a. On the ocean *b. On the continents
 CHAPTER 6 HUMIDITY, SATURATION, AND STABILITY MULTIPLE CHOICE QUESTIONS 1., annual precipitation is greater than annual evapotranspiration. a. On the ocean *b. On the continents 2., annual precipitation
Improvements in IFS forecasts of heavy precipitation
 from Newsletter Number 144 Suer 215 METEOROLOGY Improvements in IFS forecasts of heavy precipitation cosmin4/istock/thinkstock doi:1.21957/jxtonky This article appeared in the Meteorology section of ECMWF
1. describe the two methods by which cloud droplets can grow to produce precipitation (pp );
;") 10 Precipitation Learning Goals After studying this chapter, students should be able to: 1. describe the two methods by which cloud droplets can grow to produce precipitation (pp. 232 236); 2. distinguish
10 Precipitation Learning Goals After studying this chapter, students should be able to: 1. describe the two methods by which cloud droplets can grow to produce precipitation (pp. 232 236); 2. distinguish
Forecasting Local Weather
 Forecasting Local Weather Sea/Land Breeze Temperature Dew Fog Frost Snow Thunderstorms Tropical Cyclones Temperatures: Radiation Balance Typical Diurnal Variation of Temperature Min soon after dawn Temp
Mr. P s Science Test!
 WEATHER- 2017 Mr. P s Science Test! # Name Date 1. Draw and label a weather station model. (10 pts) 2. The is the layer of the atmosphere with our weather. 3. Meteorologists classify clouds in about different
Precipitations. Terminal Velocity. Chapter 7: Precipitation Processes. Growth of Cloud Droplet Forms of Precipitations Cloud Seeding
 Chapter 7: Precipitation Processes Precipitations Water Vapor Saturated Need cloud nuclei Cloud Droplet formed around Cloud Nuclei Growth of Cloud Droplet Forms of Precipitations Cloud Seeding Precipitation
Convection-Resolving Model Simulations: Process-Based Comparison of LM Results with Observations
 Convection-Resolving Model Simulations: Process-Based Comparison of LM Results with Observations Jörg Trentmann, Britta Wecker, Marcus Paulat, Heini Wernli, Ulrich Corsmeier, Jan Handwerker Goal Improve
Analysis of Cloud-Radiation Interactions Using ARM Observations and a Single-Column Model
 Analysis of Cloud-Radiation Interactions Using ARM Observations and a Single-Column Model S. F. Iacobellis, R. C. J. Somerville, D. E. Lane, and J. Berque Scripps Institution of Oceanography University
7. The weather instrument below can be used to determine relative humidity.
 1. What is the dewpoint temperature when the dry-bulb temperature is 12 C and the wet-bulb temperature is 7 C? A) 1 C B) -2 C C) -5 C D) 4 C 2. A parcel of air has a dry-bulb temperature reading of 16
PALM - Cloud Physics. Contents. PALM group. last update: Monday 21 st September, 2015
 PALM - Cloud Physics PALM group Institute of Meteorology and Climatology, Leibniz Universität Hannover last update: Monday 21 st September, 2015 PALM group PALM Seminar 1 / 16 Contents Motivation Approach
EARTH SCIENCE. Prentice Hall Water in the Atmosphere Water in the Atmosphere Water in the Atmosphere.
 Prentice Hall EARTH SCIENCE Tarbuck Lutgens Water s Changes of State 1. Precipitation is any form of water that falls from a cloud. a. Examples: Snow, rain, hail, sleet 3 States of matter of water: 1.
282 Journal of the Meteorological Society of Japan Vol. 60, No. 1. A Theory and Method of Long-Range Numerical
 282 Journal of the Meteorological Society of Japan Vol. 60, No. 1 A Theory and Method of Long-Range Numerical Weather Forecasts By Chao Jih-Ping, Guo Yu-Fu and Xin Ru-Nan Institute of Atmospheric Physics,
Precipitation AOSC 200 Tim Canty. Cloud Development: Orographic Lifting
 Precipitation AOSC 200 Tim Canty Class Web Site: http://www.atmos.umd.edu/~tcanty/aosc200 Topics for today: Precipitation formation Rain Ice Lecture 14 Oct 11 2018 1 Cloud Development: Orographic Lifting
Science Olympiad Meteorology Quiz #1 Page 1 of 7
 1) What is generally true about the stratosphere: a) Has turbulent updrafts and downdrafts. b) Has either a stable or increasing temperature profile with altitude. c) Where the auroras occur. d) Both a)
1. Base your answer to the following question on the weather map below, which shows a weather system that is affecting part of the United States.
 1. Base your answer to the following question on the weather map below, which shows a weather system that is affecting part of the United States. Which sequence of events forms the clouds associated with
METEOROLOGY. 1 The average height of the tropopause at 50 N is about A 14 km B 16 km C 11 km D 8 km
 1 The average height of the tropopause at 50 N is about A 14 km B 16 km C 11 km D 8 km 2 In the lower part of the stratosphere the temperature A is almost constant B decreases with altitude C increases
Chapter 7 Precipitation Processes
 Chapter 7 Precipitation Processes Chapter overview: Supersaturation and water availability Nucleation of liquid droplets and ice crystals Liquid droplet and ice growth by diffusion Collision and collection
Swedish Meteorological and Hydrological Institute
 Swedish Meteorological and Hydrological Institute Norrköping, Sweden 1. Summary of highlights HIRLAM at SMHI is run on a CRAY T3E with 272 PEs at the National Supercomputer Centre (NSC) organised together
Name Class Date. 3. In what part of the water cycle do clouds form? a. precipitation b. evaporation c. condensation d. runoff
 Skills Worksheet Directed Reading B Section: Water in the Air 1. What do we call the condition of the atmosphere at a certain time and place? a. the water cycle b. weather c. climate d. precipitation THE
25.1 Air Masses. Section 25.1 Objectives
 Section 25.1 Objectives Explain how an air mass forms. List the four main types of air masses. Describe how air masses affect the weather of North America. Air Masses 25.1 Air Masses Differences in air
Collision and Coalescence 3/3/2010. ATS 351 Lab 7 Precipitation. Droplet Growth by Collision and Coalescence. March 7, 2006
 ATS 351 Lab 7 Precipitation March 7, 2006 Droplet Growth by Collision and Coalescence Growth by condensation alone takes too long ( 15 C -) Occurs in clouds with tops warmer than 5 F Greater the speed
Condensation: Dew, Fog, & Clouds. Chapter 5
 Condensation: Dew, Fog, & Clouds Chapter 5 The Formation of Dew & Frost Dew forms on objects near the ground surface when they cool below the dew point temperature. More likely on clear nights due to increased
A Revised Version of the Cloud Microphysical Parameterization of COSMO-LME
 A Revised Version of the Cloud Microphysical Parameterization of COSMO-LME Axel Seifert DWD, Offenbach -1- Motivation: Well known problems of COSMO-LME regards wintertime precipitation: Overestimation
Name 28-MAY-08. FA RP 1 Mr. Chase. 1. Which weather-station model shows an air pressure of millibars?
 FA RP 1 Mr. Chase Name 28-MAY-08 1. Which weather-station model shows an air pressure of 993.4 millibars? 2. Which station model shows the correct form for indicating a northwest wind at 25 knots and an
Microphysics Schemes in EMC s Operational Hurricane Models
 Microphysics Schemes in EMC s Operational Hurricane Models Brad Ferrier, Weiguo Wang, Eric Aligo 1,2 1 Environment Modeling Center (EMC)/NCEP/NWS 2 I.M. Systems Group, Inc. HFIP Physics Workshop 9 11 August
An improvement of the SBU-YLIN microphysics scheme in squall line simulation
 1 An improvement of the SBU-YLIN microphysics scheme in squall line simulation Qifeng QIAN* 1, and Yanluan Lin 1 ABSTRACT The default SBU-YLIN scheme in Weather Research and Forecasting Model (WRF) is
3. As warm, moist air moves into a region, barometric pressure readings in the region will generally 1. decrease 2. increase 3.
 Teacher: Mr. Prizzi Castle Learning Review 1 1. Which process most directly results in cloud formation? 1. condensation 3. precipitation 2. transpiration 4. radiation 2. An air mass originating over north
M.Sc. in Meteorology. Physical Meteorology Prof Peter Lynch. Mathematical Computation Laboratory Dept. of Maths. Physics, UCD, Belfield.
 M.Sc. in Meteorology Physical Meteorology Prof Peter Lynch Mathematical Computation Laboratory Dept. of Maths. Physics, UCD, Belfield. Climate Change???????????????? Tourists run through a swarm of pink
Synoptic Meteorology I: Skew-T Diagrams and Thermodynamic Properties
 Synoptic Meteorology I: Skew-T Diagrams and Thermodynamic Properties For Further Reading Most information contained within these lecture notes is drawn from Chapters 1, 2, 4, and 6 of The Use of the Skew
1 What Is Climate? TAKE A LOOK 2. Explain Why do areas near the equator tend to have high temperatures?
 CHAPTER 17 1 What Is Climate? SECTION Climate BEFORE YOU READ After you read this section, you should be able to answer these questions: What is climate? What factors affect climate? How do climates differ
ATM S 111, Global Warming Climate Models
 ATM S 111, Global Warming Climate Models Jennifer Fletcher Day 27: July 29, 2010 Using Climate Models to Build Understanding Often climate models are thought of as forecast tools (what s the climate going
Temperature (T) degrees Celsius ( o C) arbitrary scale from 0 o C at melting point of ice to 100 o C at boiling point of water Also (Kelvin, K) = o C
 degrees Celsius ( o C) arbitrary scale from 0 o C at melting point of ice to 100 o C at boiling point of water Also (Kelvin, K) = o C") 1 2 3 4 Temperature (T) degrees Celsius ( o C) arbitrary scale from 0 o C at melting point of ice to 100 o C at boiling point of water Also (Kelvin, K) = o C plus 273.15 0 K is absolute zero, the minimum
1 2 3 4 Temperature (T) degrees Celsius ( o C) arbitrary scale from 0 o C at melting point of ice to 100 o C at boiling point of water Also (Kelvin, K) = o C plus 273.15 0 K is absolute zero, the minimum
11 days (00, 12 UTC) 132 hours (06, 18 UTC) One unperturbed control forecast and 26 perturbed ensemble members. --
 132 hours (06, 18 UTC) One unperturbed control forecast and 26 perturbed ensemble members. --") APPENDIX 2.2.6. CHARACTERISTICS OF GLOBAL EPS 1. Ensemble system Ensemble (version) Global EPS (GEPS1701) Date of implementation 19 January 2017 2. EPS configuration Model (version) Global Spectral Model
APPENDIX 2.2.6. CHARACTERISTICS OF GLOBAL EPS 1. Ensemble system Ensemble (version) Global EPS (GEPS1701) Date of implementation 19 January 2017 2. EPS configuration Model (version) Global Spectral Model
Stochastic methods for representing atmospheric model uncertainties in ECMWF's IFS model
 Stochastic methods for representing atmospheric model uncertainties in ECMWF's IFS model Sarah-Jane Lock Model Uncertainty, Research Department, ECMWF With thanks to Martin Leutbecher, Simon Lang, Pirkka
Weather, Atmosphere and Meteorology
 S c i e n c e s Weather, Atmosphere and Meteorology Key words: Atmosphere, Ozone, Water vapor, solar radiation, Condensation, Evaporation, Humidity, Dew-Point Temperature, Cirrus Clouds, Stratus Clouds,
5) The amount of heat needed to raise the temperature of 1 gram of a substance by 1 C is called: Page Ref: 69
 The amount of heat needed to raise the temperature of 1 gram of a substance by 1 C is called: Page Ref: 69") Homework #2 Due 9/19/14 1) If the maximum temperature for a particular day is 26 C and the minimum temperature is 14 C, what would the daily mean temperature be? (Page Ref: 66) 2) How is the annual mean
Homework #2 Due 9/19/14 1) If the maximum temperature for a particular day is 26 C and the minimum temperature is 14 C, what would the daily mean temperature be? (Page Ref: 66) 2) How is the annual mean
Chapter 7: Precipitation Processes. ESS5 Prof. Jin-Yi Yu
 Chapter 7: Precipitation Processes From: Introduction to Tropical Meteorology, 1st Edition, Version 1.1.2, Produced by the COMET Program Copyright 2007-2008, 2008, University Corporation for Atmospheric
Nathan Hosannah. Advisor Professor J. E. Gonzalez
 Nathan Hosannah nhosannah@gmail.com Advisor Professor J. E. Gonzalez Department of Mechanical Engineering, NOAA CREST Center CCNY / Graduate-Center, CUNY This study was supported and monitored National
Weather. Describing Weather
 Weather Describing Weather What is weather? Weather is the atmospheric conditions, along with short-term changes, of a certain place at a certain time. Have you ever been caught in a rainstorm on what
Impact of horizontal diffusion, radiation and cloudiness parametrization on fog forecasting in valleys (Meteorol Atmos Phys, 2010, 108:57-70)
") Impact of horizontal diffusion, radiation and cloudiness parametrization on fog forecasting in valleys (Meteorol Atmos Phys, 2010, 108:57-70) Martina Tudor Research Department Croatian Meteorological and
Impact of horizontal diffusion, radiation and cloudiness parametrization on fog forecasting in valleys (Meteorol Atmos Phys, 2010, 108:57-70) Martina Tudor Research Department Croatian Meteorological and
Application and verification of ECMWF products 2016
 Application and verification of ECMWF products 2016 RHMS of Serbia 1 Summary of major highlights ECMWF forecast products became the backbone in operational work during last several years. Starting from
A New Numerical Weather Prediction Approach to the NDFD's Sky Cover Grid
 A New Numerical Weather Prediction Approach to the NDFD's Sky Cover Grid Jordan Gerth Graduate Research Assistant Cooperative Institute for Meteorological Satellite Studies (CIMSS) and Department of Atmospheric
Robert Houze University of Washington (with contributions from B. Smull)
") Robert Houze University of Washington (with contributions from B. Smull) Winter MONEX Summer MONEX Presented at: International Conference on MONEX and its Legacy, 3-7 Feb 2005, New Delhi Johnson & Houze
Robert Houze University of Washington (with contributions from B. Smull) Winter MONEX Summer MONEX Presented at: International Conference on MONEX and its Legacy, 3-7 Feb 2005, New Delhi Johnson & Houze
Boundary layer equilibrium [2005] over tropical oceans
![Boundary layer equilibrium [2005] over tropical oceans](/thumbs/96/128963638.jpg "Boundary layer equilibrium [2005] over tropical oceans") Boundary layer equilibrium [2005] over tropical oceans Alan K. Betts [akbetts@aol.com] Based on: Betts, A.K., 1997: Trade Cumulus: Observations and Modeling. Chapter 4 (pp 99-126) in The Physics and Parameterization
Boundary layer equilibrium [2005] over tropical oceans Alan K. Betts [akbetts@aol.com] Based on: Betts, A.K., 1997: Trade Cumulus: Observations and Modeling. Chapter 4 (pp 99-126) in The Physics and Parameterization
ALADIN forecast experience in Croatia
 ALADIN forecast experience in Croatia Lidija Fustar and Tomislav Kozaric Meteorological and Hydrological Service ALADIN at DHMZ main source for the operational forecast at National Service of Croatia (along
10.1 TEMPERATURE, THERMAL ENERGY AND HEAT Name: Date: Block: (Reference: pp of BC Science 10)
") 10.1 TEMPERATURE, THERMAL ENERGY AND HEAT Name: Date: Block: (Reference: pp. 424-435 of BC Science 10) kinetic molecular theory: explains that matter is made up of tiny that are constantly. These atoms
10.1 TEMPERATURE, THERMAL ENERGY AND HEAT Name: Date: Block: (Reference: pp. 424-435 of BC Science 10) kinetic molecular theory: explains that matter is made up of tiny that are constantly. These atoms
2. What are the four most common gasses in the atmosphere and their percentages?
 Meteorology Review Directions: Answer the following open ended review questions. Utilize a diagram where appropriate and do make sure that you label and describe the drawing. Atmospheric Composition 1.
Weather & Atmospheric Variables Review
 Weather & Atmospheric Variables Review Words that are bold, italicized and/or underlined are vocabulary you must KNOW! A) Atmospheric variables: a) Temperature as it relates to: 1) duration of insolation...longer
Microphysical heating rates and PV modification in a warm conveyor belt: Comparison of a COSMO and IFS simulation
 Microphysical heating rates and PV modification in a warm conveyor belt: Comparison of a COSMO and IFS simulation Montreal, August 18th 2014 H. Joos1, M. Böttcher1, R. Forbes2 and H. Wernli1 1) IAC, ETH
Page 1. Name: 1) The graph below shows air temperature for an area near the Earth's surface during a 12-hour period.
 The graph below shows air temperature for an area near the Earth's surface during a 12-hour period.") Name: 1) The graph below shows air temperature for an area near the Earth's surface during a 12-hour period. Which graph best illustrates the probable change in air pressure during the same time period?
Name: 1) The graph below shows air temperature for an area near the Earth's surface during a 12-hour period. Which graph best illustrates the probable change in air pressure during the same time period?
24.2 Cloud Formation 2/3/2014. Orographic Lifting. Processes That Lift Air Frontal Wedging. Convergence and Localized Convective Lifting
 2/3/2014 Orographic Lifting Processes That Lift Air Frontal Wedging A front is the boundary between two adjoining air masses having contrasting characteristics. Convergence and Localized Convective Lifting
Copyright 2015 Edmentum All rights reserved.
 Copyright 2015 Edmentum All rights reserved. weather 1 1. Sharon woke up on a sunny morning and ate breakfast. Then she looked outside and saw tall, quickly forming clouds. The clouds looked ready to rain.
PHYSICAL GEOGRAPHY. By Brett Lucas
 PHYSICAL GEOGRAPHY By Brett Lucas INTRODUCTION TO ATMOSPHERIC MOISTURE Atmospheric Moisture The Nature of Water The Hydrologic Cycle Evaporation Measures of Humidity Condensation The Buoyancy of Air Precipitation
Moisture, Clouds, and Precipitation Earth Science, 13e Chapter 17
 Moisture, Clouds, and Precipitation Earth Science, 13e Chapter 17 Stanley C. Hatfield Southwestern Illinois College Changes of state of water, H 2 O Water is the only substance in atmosphere that exists
Development and Validation of Polar WRF
 Polar Meteorology Group, Byrd Polar Research Center, The Ohio State University, Columbus, Ohio Development and Validation of Polar WRF David H. Bromwich 1,2, Keith M. Hines 1, and Le-Sheng Bai 1 1 Polar
DEPARTMENT OF GEOSCIENCES SAN FRANCISCO STATE UNIVERSITY. Metr Fall 2012 Test #1 200 pts. Part I. Surface Chart Interpretation.
 DEPARTMENT OF GEOSCIENCES SAN FRANCISCO STATE UNIVERSITY NAME Metr 356.01 Fall 2012 Test #1 200 pts Part I. Surface Chart Interpretation. Figure 1. Surface Chart for 1500Z 7 September 2007 1 1. Pressure
Ch22&23 Test. Multiple Choice Identify the choice that best completes the statement or answers the question.
 Ch22&23 Test Multiple Choice Identify the choice that best completes the statement or answers the question. 1. The two most abundant compounds in the atmosphere are carbon dioxide and a. particulates.
Meteorology. I. The Atmosphere - the thin envelope of gas that surrounds the earth.
 Meteorology I. The Atmosphere - the thin envelope of gas that surrounds the earth. A. Atmospheric Structure - the atmosphere is divided into five distinct layers that are based on their unique characteristics.
All objects emit radiation. Radiation Energy that travels in the form of waves Waves release energy when absorbed by an object. Earth s energy budget
 Radiation Energy that travels in the form of waves Waves release energy when absorbed by an object Example: Sunlight warms your face without necessarily heating the air Shorter waves carry more energy
Lecture 07 February 10, 2010 Water in the Atmosphere: Part 1
 Lecture 07 February 10, 2010 Water in the Atmosphere: Part 1 About Water on the Earth: The Hydrological Cycle Review 3-states of water, phase change and Latent Heat Indices of Water Vapor Content in the
Weather Research and Forecasting Model. Melissa Goering Glen Sampson ATMO 595E November 18, 2004
 Weather Research and Forecasting Model Melissa Goering Glen Sampson ATMO 595E November 18, 2004 Outline What does WRF model do? WRF Standard Initialization WRF Dynamics Conservation Equations Grid staggering
Module 11: Meteorology Topic 3 Content: Weather Instruments Notes
 Introduction In order for meteorologists to accurately predict the weather, they take thousands of different weather measurements each day. Meteorologists need to use many tools in order to draw an accurate
Prediction of cirrus clouds in GCMs
 Prediction of cirrus clouds in GCMs Bernd Kärcher, Ulrike Burkhardt, Klaus Gierens, and Johannes Hendricks DLR Institut für Physik der Atmosphäre Oberpfaffenhofen, 82234 Wessling, Germany bernd.kaercher@dlr.de
Clouds in GEM and calculation of cloud cover variables. Author of french version: Paul Vaillancourt. Translated to english by Gary Toth
 Clouds in GEM and calculation of cloud cover variables Author of french version: Paul Vaillancourt Translated to english by Gary Toth Date: v1:octobre 2008 ; v2: January 2009; translated April 2009 1.
A new prognostic bulk microphysics scheme for the IFS
 649 A new prognostic bulk microphysics scheme for the IFS Richard M. Forbes 1, Adrian M. Tompkins and Agathe Untch 1 Research Department 1 ECMWF ICTP, Italy September 011 Series: ECMWF Technical Memoranda
Exploring stochastic model uncertainty representations
 Exploring stochastic model uncertainty representations with relevance to the greyzone Sarah-Jane Lock, Martin Leutbecher, Peter Bechtold, Richard Forbes Research Department, ECMWF ECMWF November 15, 2017
The Water Cycle. Water in the Atmosphere AOSC 200 Tim Canty. Class Web Site:
 Water in the Atmosphere AOSC 200 Tim Canty Class Web Site: http://www.atmos.umd.edu/~tcanty/aosc200 Topics for today: Latent Heat Evaporation & Saturation Relative Humidity Dew Point Lecture 11 Oct 2 2018
latent heat/humidity
 1. Base your answer(s) to the following question(s) on the Earth Science Reference Tables, the graph below, and your knowledge of Earth science. The graph shows variations in air temperature and relative
Weather. Describing Weather
 CHAPTER 13 Weather LESSON 1 Describing Weather What do you think? Read the two statements below and decide whether you agree or disagree with them. Place an A in the Before column if you agree with the
A hierarchy of one- and two-moment microphysical parameterizations in the COSMO model
 Deutscher Wetterdienst GB Forschung und Entwicklung A hierarchy of one- and two-moment microphysical parameterizations in the COSMO model Axel Seifert German Weather Service Offenbach, Germany Ulrich Blahak
3D-Transport of Precipitation
 3D-Transport of Precipitation Almut Gassmann DWD/FE 13 October 17, 2000 1 Current diagnostic scheme for gridscale precipitation The current scheme for gridscale precipitation assumes column equilibrium
NWP Equations (Adapted from UCAR/COMET Online Modules)
") NWP Equations (Adapted from UCAR/COMET Online Modules) Certain physical laws of motion and conservation of energy (for example, Newton's Second Law of Motion and the First Law of Thermodynamics) govern
NWP Equations (Adapted from UCAR/COMET Online Modules) Certain physical laws of motion and conservation of energy (for example, Newton's Second Law of Motion and the First Law of Thermodynamics) govern
Science 1206 Chapter 1 - Inquiring about Weather
 Science 1206 Chapter 1 - Inquiring about Weather 1.1 - The Atmosphere: Energy Transfer and Properties (pp. 10-25) Weather and the Atmosphere weather the physical conditions of the atmosphere at a specific
WaVaCS summerschool Autumn 2009 Cargese, Corsica
 Introduction Part I WaVaCS summerschool Autumn 2009 Cargese, Corsica Holger Tost Max Planck Institute for Chemistry, Mainz, Germany Introduction Overview What is a parameterisation and why using it? Fundamentals
Weather - is the state of the atmosphere at a specific time & place
 Weather Section 1 Weather - is the state of the atmosphere at a specific time & place Includes such conditions as air pressure, wind, temperature, and moisture in the air The Sun s heat evaporates water
Ensemble Trajectories and Moisture Quantification for the Hurricane Joaquin (2015) Event
 Event") Ensemble Trajectories and Moisture Quantification for the Hurricane Joaquin (2015) Event Chasity Henson and Patrick Market Atmospheric Sciences, School of Natural Resources University of Missouri 19 September
Ensemble Trajectories and Moisture Quantification for the Hurricane Joaquin (2015) Event Chasity Henson and Patrick Market Atmospheric Sciences, School of Natural Resources University of Missouri 19 September