Engineering Hydrology
|
|
|
- Victoria Ilene Hudson
- 5 years ago
- Views:
Transcription
1 Engineering Hydrology Prof. Rajesh Bhagat Asst. Professor Civil Engineering Department Yeshwantrao Chavan College Of Engineering Nagpur B. E. (Civil Engg.) M. Tech. (Enviro. Engg.) GCOE, Amravati VNIT, Nagpur Experience: 1) Lecturer, KDKCOE, Nagpur 2) Lecturer, PRPCOE, Amravati 3) Assistant Professor, PCE, Nagpur Achievements: 1) Selected Scientist, NEERI-CSIR, Govt. of India. 2) GATE Qualified Three Times 3) Selected Junior Engineer, ZP Washim. 4) Assistant Professor, Cummins College of Engg. For Women (MKSSS, Nagpur) Mobile No.: / ID :- rajeysh7bhagat@gmail.com Website:-

2 12/21/15
3 Preface Water is vital to life and development in all parts of the world. Water resources plays a key role in economic growth, the management of water resources is an item of high priority in developmental activities. The basic inputs in the evaluation of water resources are from hydrological parameters and the subject of hydrology forms the core in the evaluation and development of water resources. In the civil engineering curriculum, this subject occupies an important position. 1
4 UNIT-I 1) Introduction: Engineering hydrology, hydrological cycle, hydrological equation, Importance of temperature, wind and humidity in hydrological studies. 2) Precipitation: Definition, types and forms of precipitation, factors affecting precipitation, measurement of precipitation (using rainguages & analytical methods), optimum number of rain gauge stations, radar measurement of rainfall, mass curves, data missing records. Intensity-Duration-Frequency and Depth-Area-Duration analysis. 4
5 UNIT-II 1) Infiltration: Definition, mechanism, factors affecting Infiltration & Infiltration indices. 2) Evaporation: Definition, mechanism, factors affecting evaporation, estimation of evaporation (instrumental & analytical) & evaporation control. 3) Transpiration: Definition, mechanism, factors affecting transpiration, its measurement and control. 4) Evapotranspiration & Its measurement. 5) Interception and its measurement. 5
6 Text Books & Reference Books 1) Ojha, C.S.P., Berndtsson, R., & Bhunya, P., Engineering Hydrology, Oxford University Press. 2) Raghunath H.M., Hydrology, New Age International Publishers. 3) Reddy R., Hydrology, Tata McGraw-Hill New Delhi. 4) Linsley, R.K.,Kohler, M.A. and Paulhas, Hydrology for Engineers, Tata McGraw- Hill Publishing Company Limited. 5) Todd, D.K., GroundWater Hydrology, John Wiley & Sons. 6) Subramnaya, K., Engineering Hydrology, Tata McGraw-Hill Publishing Company Limited. 7) Sharma R.K. & Sharma T.K., Hydrology & Water Resources Engineering, Dhanpat Rai Publications. 6
7 Hydrology means the science of water. It is the science that deals with the occurrence, movement or circulation and distribution of water of the earth and earth s atmosphere. Allied Sciences:- Physics, Chemistry, Biology, Mathematics, Statistics, Probability & Geology. Hydraulics & Fluid Mechanics Soil Engineering Meteorology & Climatology Agronomy & Forestry Potamology (streams), Limnology (lake), & Cryology (snow) Oceanology 1. Estimation of water resources 2. The study of process such as precipitation, runoff, evapotranspiration and their interaction 3. The study of problems such as floods and droughts, and the strategies to combat them. 7
8 Applications or Importance of Hydrology:- Design of hydraulic structures Irrigation & hydropower development Flood control Water supply scheme Navigation Erosion & sediment control Stream flow & flood forecasting Pollution control 8 8
9 9
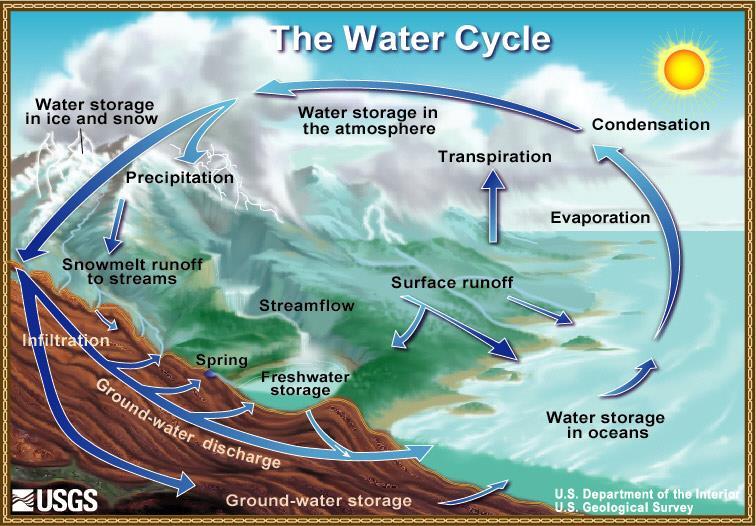
10 The Hydrological Cycle:- 1) The entire process of circulation & redistribution of water by the atmosphere & the earth surfaces which has no beginning on end is called hydrological cycle. 2) Precipitation takes place from the vapour storage of atmosphere in the form of rain, hail, snow, dew, frost, etc. 3) Part of it intercepted by trees & vegetation & remaining reaches to ground. 4) Some part evaporates, while other part is available for infiltration & excess water becomes surface & subsurface runoff, which ultimately reaches to the streams. 5) Part of infiltrated water is used for soil moisture storage, the maximum of which is utilized by plants & reaches to the atmosphere through leaves by transpiration. 6) Other part of infiltrated water slowly percolates in deeper zone & known as ground water flow or base flow
11 The Hydrological Cycle:- 7) Thus the total stream flow is sum of surface runoff and ground water runoff. 8) A small portion of flow or storage evaporates & the remaining portion joins the ocean where from it ultimately evaporates into atmosphere. 9) Thus the hydrological cycle is formed with its various phases like precipitation, interception, surface runoff, infiltration, percolation, storage, stream flow, transpiration & evaporation
12 Terms in Water Cycle: 1) Precipitation 2) Evaporation 3) Transpiration 4) Interception 5) Surface runoff 6) Groundwater 7) Percolation 12 12
13 1) Precipitation :- It is the deposition of water on the earth s surface in the form of rain, snow, hail, frost and so on. 2) Evaporation:- It is the transfer of water from a liquid state to gaseous state, i.e. it is the conversion of liquid to the vapor phase. 3) Transpiration:- It is the soil moisture taken up through the roots of plant and discharged into the atmosphere through the foliage by evaporation. 4) Interception:- It is the short term retention of rainfall by the foliage of vegetation. 5) Storage:- It is the volume of water which gets stored in natural depression of a basin. 6) Runoff:- It is the volume of water drained by a river at the outlet of a catchment. 7) Infiltration:- It is the movement of water into the soil of the earth s surface. 8) Percolation:- It is the movement of water from one soil zone to a lower soil zone
14 Temperature, Humidity & Wind in Hydrological Cycle:- 1) Hydrological cycle depends on meteorological factor such as wind, temperature & humidity. 2) To form precipitation, humidity should be in atmosphere. 3) Weather condition must be good for condensation of water vapour.. 4) Wind speed facilitates the movement of cloud while its turbulence retains the water droplet in suspension. 5) The velocity of the air in contact with the water surface is more, the saturated film of air containing the water vapour will move easily and diffusion & dispersion of vapour will be easier causing more evaporation. 6) Proper temperature increases the saturation vapour pressure & evaporation increase
15 Water Budget Equation: 1) The quantities of water going through various individual paths of the hydrological cycle can be described by the continuity principle known as water budget equation or hydrologic equation. 2) The equation which represents this balance of the moisture quantity is known as hydrological equation. ( law of conservation) 3) It is important to note that the total water resources of the earth are constant and the sun is the source of energy for the hydrologic cycle. Mass Inflow Mass Outflow = Change in Mass Storage V i V o = S P R G E T = S P: precipitation, R: surface runoff, G: net groundwater flow out of the catchment, E: evaporation, T: transpiration, S: change in storage 15 15
16 Catchment Area or Watershed:- 1) The area of land (soil ground) draining into a stream or a water course at a given location is known as catchment area. 2) Drainage area, drainage basin, drainage area, catchment basin, river basin, water basin, watershed, etc. 3) The catchment act as funnel by collecting all the water within the area covered by catchment & channeling to single point. 4) It is normal to assume the groundwater divide to coincide with the surface divide


17 Topographic Water Divide or Watershed Divide:- 1) Each catchment area is separated topographically from adjacent catchment area by a geographical barrier such as ridge, hill or mountain. 2) The line which divides the surface runoff between two adjacent river basins is called the topographic water divide or the watershed divide. 3) If a permeable soil covers an impermeable substrate, the topographical division of watershed will not always correspond to the line that is effectively delimiting the groundwater
18 Precipitation: Water falling from the atmosphere to the earth. 1) Rain 2) Snowfall 3) Sleet 4) Hail 5) Drizzle 6) Glaze or Freezing Rain Requires lifting of air mass so that it cools and condenses
19 Mechanism for Air Lifting:- (Types of Precipitation) 1. Frontal lifting 2. Orographic lifting 3. Convective lifting Air mass : A large body of air with similar temperature and moisture characteristics over its horizontal extent. Front: Boundary between contrasting air masses. Cold front: Leading edge of the cold air when it is advancing towards warm air. Warm front: leading edge of the warm air when advancing towards cold air

 Cold front (produces cumulus cloud) 20 Warm front (produces stratus")
20 Frontal Mechanism (Cyclonic):- Boundary between air masses with different properties is called a front Cold front occurs when cold air advances towards warm air & warm air get lifted upward (gives Rain) Warm front occurs when warm air overrides cold air (Summer Cloud) Cold front (produces cumulus cloud) 20 Warm front (produces stratus cloud) 20

21 Atmospheric Layers:- Atmosphere is divided into four sphere:- 1. Troposphere 2. Stratosphere 3. Mesosphere 4. Thermosphere or Ionosphere 21

22 Orographic Lifting:- Orographic uplift occurs when air is forced to rise because of the physical presence of elevated land
23 Convective Lifting:- Convective precipitation occurs when the air near the ground is heated by the earth s warm surface. This warm air rises, cools and creates precipitation. Hot earth surface 23 23
24
25 Forms of Precipitation: 1) Rain 2) Snowfall 3) Sleet 4) Hail 5) Drizzle 6) Glaze or Freezing Rain 25 25
 Precipitation in form of water drops of size greater than 0.5mm & less than 6mm. 3) Rain can also begin as ice crystals that collect each other to form large snowflakes.")
26 Rain: (Avg. rainfall for entire country (India) is 119cm) 1) Rain develops when growing cloud droplets become too heavy to remain in the cloud and as a result, fall toward the surface as rain. 2) Precipitation in form of water drops of size greater than 0.5mm & less than 6mm. 3) Rain can also begin as ice crystals that collect each other to form large snowflakes. As the falling snow passes through the freezing level into warmer air, the flakes melt
 The fall of larger snowflakes from the clouds on the ground surface is called snowfall.")
27 Snowfall: 1) Snow is formed when ice crystals form from water vapor that is in the clouds. 2) The fall of larger snowflakes from the clouds on the ground surface is called snowfall. 3) It occurs when the freezing level is so close to the ground surface(<300m) 4) Snowfall is measured by equivalent depth of water
 It is frozen raindrops & it begins as rain or snow and falls through a deep layer of cold air that contains temperatures below freezing that exist near the surface.")
28 Sleet:- 1) Sleet refers to mixture of rain & snow. 2) It is frozen raindrops & it begins as rain or snow and falls through a deep layer of cold air that contains temperatures below freezing that exist near the surface. 3) Rain that falls through this extremely cold layer has time to freeze into small pieces of ice. 4) It is transparent or semitransparent ice having diameter 5mm or less
 It is formed when updrafts carry raindrops upwards into extremely cold areas of the")
.")
29 Hail:- 1) Its solid precipitation consist of large pellets or sphere of ice. 2) It is formed when updrafts carry raindrops upwards into extremely cold areas of the atmosphere 3) It can vary in size, from the size of a small stone to that of a baseball (5 to 50mm). 4) Hailstorm are very destructive(destroy agricultural crop, & claim animal & human life)

 Intensity is usually less than 0.")
30 Drizzle:- (Drops float in air) 1) The fall of numerous uniform minute droplets of water having diameter of less than 0.5 mm is called drizzle. 2) Drizzles fall continuously but the total amount of water received on ground surface significantly low. 3) Intensity is usually less than 0.1 mm/hr
 Water drops freeze to form an ice coating but not a ice is also called as freezing rain. 3) The water is super cooled.")
31 Glaze or Freezing Rain:- 1) It s a form of precipitation which fall as rain and freezes when come in contact with cold ground at around 0 0 c. 2) Water drops freeze to form an ice coating but not a ice is also called as freezing rain. 3) The water is super cooled
32 Measurement of Precipitation:- 1) Total amount of precipitation on a given area expressed as the depth of water (if accumulated over horizontal projection of area). 2) Any form of precipitation, if falling as snow or ice is to be accounted for in its melted form. 3) Since it is not physical possible to catch all the rainfall over a drainage basin, it is only sampled by rainguages. 4) Rainguages catch in a perfect exposure & represents the precipitation falling on their respective surrounding areas. 5) Pluviometer, Ombrometer, Hyetometer & Udometer are also sometimes used to designate a rainguage
33 Types of Rain Guages:- A. Non-recording Gauges:- (Symon s Rainguage) B. Recording Gauges:- 1) Tipping Bucket Type, 2) Weighing Bucket Type 3) Float Gauge 33 33
34 For sitting a rain gauge the following considerations are important: 1) Site should be true representation of the area for which station is to give the rainfall. 2) The ground must be level (open) and the instrument must kept on a horizontal surface. ( not on sloping ground, terrace, etc) 3) The gauge must be set as near the ground to reduce wind effects but it must be sufficiently high to prevent splashing, flooding, etc. 4) The instrument must be surrounded by an open fenced area of at least 5.5m * 5.5m. 5) No object should be nearer to the instrument than 30m or twice the height of obstruction. 6) Site should be easily accessible at all times
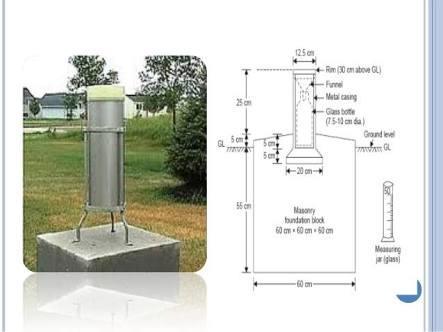
35 Non- Recording Gauges:- 1) It gives total depth of precipitation. 2) Commonly used non-recording gauge in India is Symon s rain gauge. 3) It is installed in open area on a concrete foundation. 4) It should never be on terrace or under a tree. 5) The gauge may be fenced with a gate, to prevent animals & unauthorized person from entering the premises. 6) Measurement are made at fixed time, every day normally at 8:30AM. 7) In case of heavy rainfall measurements are made as often as possible. 8) Last reading must be taken at 8:30AM & that will b rainfall of the day. 9) If the rainfall in a day is greater than 2.5cm then day is called rainy day
36 36 36
37 37
38 RECORDING TYPE 1) Recording gauges measure both the amount of rainfall and the intensity i.e. rainfall depth w.r.t. time. 2) It produces a continuouss plot of rainfall against time & valuable short duration data on intensity & duration of rainfall for hydrological analysis of storm. 3) Commonly used recording raingauges are: 1. Tipping Bucket Type 2. Weighing Bucket Type 3. Float Type or Natural Syphon Type
39 Tipping Bucket Gauge: 1) The catch from the funnel falls onto one of pair of small buckets. 2) These buckets are so balanced that when 0.25mm of rainfall collects in one bucket, it tips & brings the other one in position. 3) When rain that enters the equipment from the receiver reaches 0.25 mm, it tips and empties its contents to the reservoir below. 4) The tipping actuates an electrically driven pen to trace a record on clock work driven chart. (paper wrapped round a rotating cylinder) 5) The record from tipping bucket gives data on the rainfall intensity. 6) Main advantage is it gives electronic pulse output that can be recorded at remote distance from the rain gauge


40 TIPPING BUCKET TYPE:
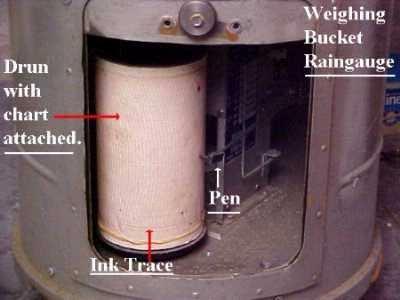
41 WEIGHING BUCKET TYPE:- 1) The weighing type is suitable for measuring all types of precipitation (snow, sleet, rain, etc.) 2) The catch from the funnel empties into a bucket mounted on a weighing scale. 3) The weight of rainfall is recorded on the weighing scale. 4) Recorded data transmitted & plotted on a clockwork driven chart. 5) This instrument gives a plot of the accumulated rainfall against the elapsed time. 6) Mass curve of rainfall (accumulated precipitation against time) 7) Slope of mass curve at any time is equal to intensity of rainfall at that time

42 WEIGHING BUCKET TYPE 42 42
43 WEIGHING BUCKET TYPE 43
44 44
45 Natural Syphon Type:- 1) This type of recording rainguage is also known as Float Type Gauge. 2) Rainfall collected by a funnel shaped collector is led into a float chamber causing a float to rise. 3) As the float rises, a pen attached to the float through a lever system records the elevation of the float on a rotating drum driven by a clockwork mechanism. 4) A syphon arrangement empties the float chamber when the float has reached a pre-set maximum level which resets the pen to its zero level. 5) This type of rainguage is adopted as the standard recording type rainguage in India. 6) This type of rainguage gives a plot of the mass curve of rainfall
46 46
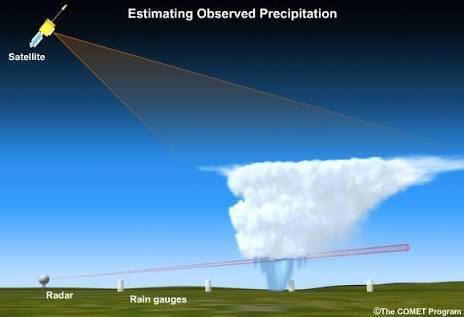
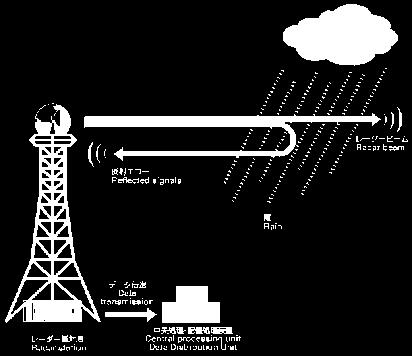
47 Other Precipitation Measurement Methods:- 1) Radar Measurement of Rainfall:- Rainfall over large area can be determined through radar with good degree of accuracy. Radar emits a regular succession of pulse of electromagnetic radiation in a narrow beam. Doppler type radar measures the velocity & raindrops distribution. 2) Observation by Satellites:- Global Precipitation Measurement (GPM) is a joint mission between JAXA and NASA as well as other international space agencies to make frequent (every 2 3 hours) observations of Earth s precipitation
48 48
49 49
50 Rain Gauge Network:- 1) For proper assessment of water resources, a good network of rain gauges is a must. 2) Rain gauge density is expressed as area covered per gauge. 3) The ratio of total area of the catchment to the total number of gauges in the catchment is rainguage density. 4) For better accuracy, catchment area per gauge should be small. 5) As per IS: , the recommended rain gauge density is as: 1) In plains: 1 station per 520 km2 ( 2 per 1000 km2 ) 2) Moderately elevated area: 1 station in 260 to 390 km2 ( 4 per 1000 km2 ) 3) Hilly areas: 1 station in 130 km2 ( 8 per 1000 km2 ) 6) At least 10% of the rain gauge stations should be equipped with automatic 50 rain gauges. 50
51 Adequacy of Rain Gauge Station:- 1) Quantity of being sufficient or minimum number of station required to represent a reliable picture of the intensity & duration of rainfall in the area is called adequate number of station 2) Number of rain gauge station in a given catchment must be sufficient so that the error in precipitation measurement is not more than acceptable value. Optimum number of stations: N C v 2 Coefficient of variation of the rainfall values at the existing m stations Optimum number of stations Allowable degree of error in the estimate of the mean rainfall 51 51
52 If there are m stations in the catchment each recording rainfall values P1,P2, Pm in a known time, the coefficient of variation Cv is calculated as: C v 100 m P 1 Coefficient of variation m 1 m P 2 i P 1 m 1 Standard deviation 1 m P P i m 1 Mean precipitation 52 52
53 53 53
54 Que. 2 There are four rain gauge stations existing in the catchment area of a river. The average annual rainfall values at these stations are 750, 600, 420 & 500 mm respectively. Determine the optimum number of a rain gauges in the catchment if it is desired to limit the error in the mean value of a rainfall in the catchment to 10%. How many more gauges are required to be installed? Sol:- m = 4 Pˉ = ( ) / 4 = mm σ m-1 = ((( ) 2 + ( ) 2 +( ) 2 + ( ) 2 ) / (m-1)) σ m-1 = = standard deviation Coefficient of variation, Cv = (100 x σ m-1 ) / Pˉ = (100 x ) / = Optimum Number, N = (Cv / ɛ) 2 = (25.06 / 10) 2 = 6.28 say
55 Que. 3 The annual rainfall depths recorded at existing 5 rain gauge stations (A, B, C, D & E) in a drainage area are 88, 104, 138, 78 & 56 cm respectively. What is the percentage accuracy of the existing rain gauge network in estimation of the rainfall over the basin? If it is desired to estimate the rainfall over the basin with not less than 90 % accuracy, is there a need to install additional rain gauges? If so how many? Sol:- m = 5 Pˉ = ( ) / 5 = 92.8 mm σ m-1 = ((( ) 2 + ( ) 2 +( ) 2 + ( ) 2 + ( ) 2 ) / (m-1)) σ m-1 = = standard deviation Coefficient of variation, Cv = (100 x σ m-1 ) / Pˉ = Limiting Percentage error = (Cv / m) = / 5 = % Percentage of accuracy = = % Optimum Number, N = (Cv / ɛ) 2 = ( / 10) 2 = say
56 Que. 4 The annual rainfall depths recorded at existing 5 rain gauge stations (A, B, C, D & E) in a drainage area are 87, 102, 106, 72 & 68 cm respectively. What is the percentage accuracy of the existing rain gauge network in estimation of the rainfall over the basin? If it is desired to estimate the rainfall over the basin with not less than 93 % accuracy, is there a need to install additional rain gauges? If so how many? Sol:- m = 5 Pˉ = ( ) / 5 = 87 mm σ m-1 = (((87-87) 2 + (102-87) 2 +(106-87) 2 + (72-87) 2 + (68-87) 2 ) / (m-1)) σ m-1 = = standard deviation Coefficient of variation, Cv = (100 x σ m-1 ) / Pˉ = Limiting Percentage error = (Cv / m) = / 5 = % Percentage of accuracy = = % Need of additional rain gauges with accuracy greater than 93 % ( = 7%) Optimum Number, N = (Cv / ɛ) 2 = (8.799 / 7) 2 = 7.9 say
57 Normal Precipitation:- 1) The normal rainfall is the average value of rainfall at a particular date, month or year over a specified 30-year period. 2) Like normal rainfall of 5 th March or normal rainfall of January or yearly rainfall. 3) 30 year normal rainfall are recomputed every decade to account for change in environment and land use, because these factors may affect amount of rainfall on that area. 4) Normal rainfall is used to find out the missing data of rain gauges
58 Preparation of Data:- 1) Before use of rainfall data for hydrological analysis of storm, water resources, floods, etc. It is necessary to check the data for continuity and consistency. 2) Continuity: means availability of continuous record of previous rainfall. 3) Consistency: means that rainfall data of previous year should be consistent with the present environmental condition. (like if there is forest in a particular area which did not exist 15 years ago then previous records will not be consistent with current record) 4) Continuity: missing data can be calculated by Arithmetic Mean Method & Normal Ratio Method. 5) Consistency: consistency can be achieved & verified by Double mass curve method or technique
59 Estimation of Missing Data:- 1) Sometimes a station has break in record due to absence of observer or failure of the instrument. 2) It is necessary to estimate that missing data. 3) To estimate the data, three or more stations close to this station are selected. 4) Following are the different methods to calculate the missing data: 1) Arithmetic Mean Method. 2) Normal Ratio Method
60 Arithmetic Mean Method:- 1) If the normal precipitation at each of these station is within 10% of that for the station with missing data, then simple arithmetical mean of the precipitation of those stations will give the value of missing station. 1 P x P1 P2 P3... P m m Where, Px, P 1, P 2,,Pn = Rainfall at different station. m = number of known rainfall station
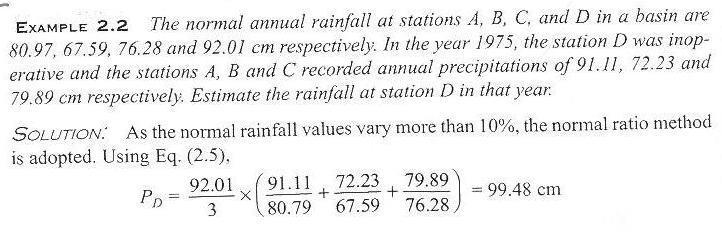
61 Normal Ratio Method:- If the normal precipitation at any of these selected stations is above 10% of that for station with missing data then normal ratio method is used. P x N P P P P m N1 N2 N3 N x m m Where, Px, P 1, P 2,,Pn = Rainfall at different station. Nx, N 1, N 2, Nn = normal rainfall m = number of known rainfall station
62 Que. 5 the normal annual rainfall at station P, Q, R, S & T are 79.98, 68.59, 72.34, & cm respectively. In the year 1989 the station T was inoperative & station P, Q, R, & S recorded annual precipitation of 89.89, 73.73, & 84.63cm respectively. Estimates the rainfall at station T in that year. Name the method which is to be used. Sol: x 1.1 = & x 0.9 = Normal annual rainfall at missing station is not within 10% of the normal rainfall at adjoining station. Hence, Normal ratio method is to be used to find out missing data. Stations P Q R S T Normal annual Average rainfall, cm Annual Rainfall in 1989, cm P T P T = (N T /m) ((P P /N P ) + (P Q /N Q ) + (P R /N R ) + (P S /N S )) P T = (93.09/4) x ((89.89/79.98) + (73.73/68.59) + (79.29/72.34) + (84.63/82.87)) P T = cm 62 62
63 63 63
64 Inconsistency of Records:- 1) Some of the common causes of inconsistency of the records are: 1) Shifting of station at new location. 2) Neighborhood of the station undergoing a marked changes. 3) Replacement of old station by new one. 4) Change of observer or change of observation method. 5) Change in the ecosystem. 6) Occurrence of observational error from certain date. 2) Inconsistency of record is corrected by using double mass curve. 3) Thus on correction previous records becomes consistent with present condition
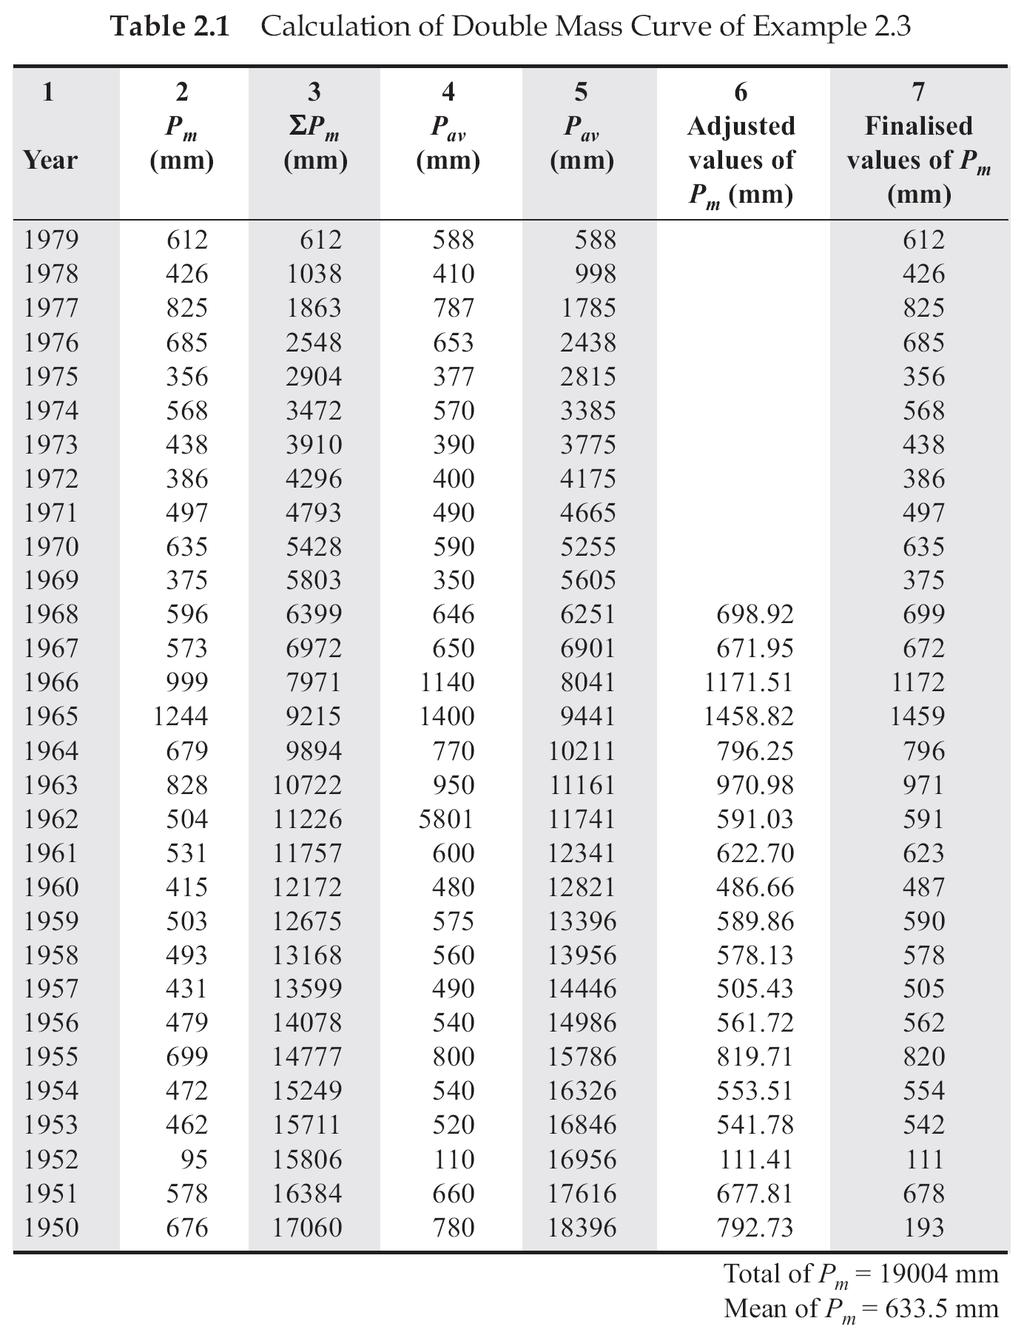
65 Consistency Verification by Double Mass Curve Method:- 1) To draw this curve, a group of station (say 10) is taken as a base station in the neighborhood of the problematic station X. 2) The accumulated rainfall of station X ( Px ) & accumulated values of average of group of base station ( P AV ) are calculated starting from the latest record. 3) Px on Y-axis & P AV on X-axis. 4) In the plot, if a break in the slope is observed, it indicates a change in precipitation of station X. 5) The values of precipitation at X beyond the break point are corrected based on the slope of both the lines. 6) A change in a slope is normally taken as significantly only where it persists for more than 5 years. 7) Correction factor = corrected slope / original slope = c / s 65 65
66 66 66
67 67 67
68 DOUBLE MASS CURVE 68 68
69 Presentation of Rainfall Data:- 1) Rainfall data is presented in the form of: 1) Mass Curve 2) Hyetograph 3) Moving Average 69 69
70 1) A graph showing the cumulative depth of rainfall against time is known as mass curve. 2) Hyetograph can be obtained from mass curve. 3) Time plotted in chronological order. 4) Mass curve of rainfall are very useful in extracting the information on the duration and magnitude of a storm
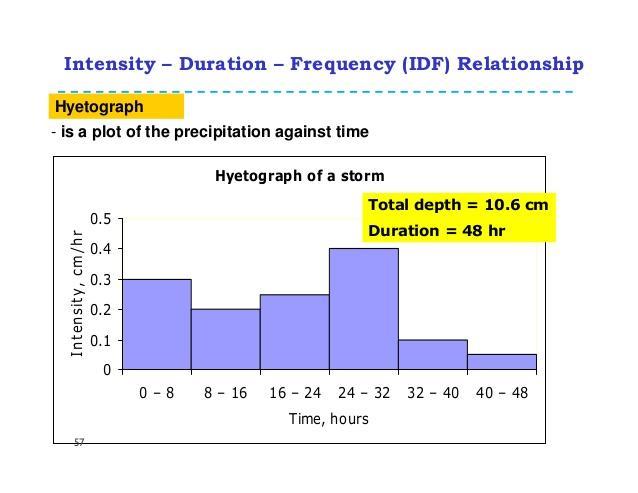
71 Hyetograph:- 1) A graph showing the variation of rainfall intensity with time is called a hyetograph
72 Hyetograph:- 1) A hyetograph is a plot of the average intensity of rainfall against time interval. 2) The hyetograph is derived from the mass curve and usually represented as a bar chart. 3) The area under a hyetograph represents the total precipitation received in the period. 4) Hyetograph is more preferred than mass curve since it is convenient to determine the area of hyetograph
73 73
74 Moving Average:- 1) If we plot point rainfall with the time in chronological order the fluctuations will be large in the time series of rainfall. 2) From this it will be difficult to determine the trend of the rainfall. 3) Thus a moving plot is made which smoothen out the fluctuation in time series & help in determining trend of rainfall. 4) To find out moving average for say 3 years, average of rainfall of 1 st, 2 nd & 3 rd years is plotted against 2 nd year. Average of 2 nd, 3 rd & 4 th years is plotted against 3 rd year & so on. 5) Similarly, for say 5 years moving average, average of rainfall of 1 st, 2 nd, 3 rd, 4 th & 5 th years is plotted against 3 rd year. Average of 2 nd, 3 rd, 4 th, 5 th & 6 th years is plotted against 4 th year & so on
75 75
76 76
77 Calculation of Average Depth of Precipitation Over A Catchment:- 1) The precipitation over a catchment is actually measured as point values at a finite number of precipitation stations. (Raingauge Station) 2) However hydrological analysis requires knowledge of rainfall over catchment area and not of point rainfall. 3) Convert the point rainfall values at various stations into an average value over catchment, several methods are available: A. Arithmetic Mean Method B. Thiessen Polygon Method C. Isohyetal Method 77 77
78 Arithmetic Mean Method:- 1) Gives equal weight or importance to all the rain gauges. 2) Quick, easy & yields fair result if rain gauges are distributed uniformly. 3) Rarely used bcoz least accurate method in normal condition. 4) Doesn t account the rain gauges outside the catchment. P P P P... P... P 1 N i n N N i 1 P i P 1, P 2,.,Pn = rainfall recorded at rain gauges. P = Average rainfall in the catchment area. N = number of raingauges in the catchment (n)
79 Thiessen Polygon Method:- (Weighted Mean Method) 1) Rainfall varies in intensity & duration from place to place, hence rainfall recorded by each raingauge station should be weighted according to area. 2) Consider the representative area for each rain gauge. 3) Also consider the rain gauge outside catchment area. 4) Take care of non-uniform distribution of raingauges. 5) Suitable for plain area & elevation difference is not taken in consideration. 6) More accurate than arithmetic mean method
80 Steps for Thiessen Polygon Method:- 1) The basin area is plotted & location of the rain gauge stations are indicated. 2) Joining the adjacent rainguage station by straight lines to form triangle. 3) Bisecting the edges of the triangle to form Polygon. 4) Calculate area enclosed around each rain gauge station bounded by the polygons edges to find out the area of influence corresponding to the rain gauge. 5) Polygon needs to calculated only once for a given distribution of rainguages 80 80
81 P P A P A P A P A P A P A A A A A A A
 The area between two adjacent isohyets is determined by a planimeter. 3) This is most accurate method.")
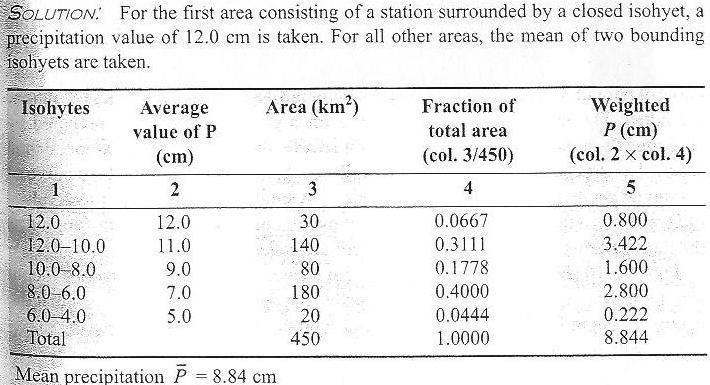
82 Isohyetal Method:- 1) Isohyetal is a line joining points of equal rainfall magnitude. 2) The area between two adjacent isohyets is determined by a planimeter. 3) This is most accurate method. 4) Topographic influence are taken into account. 5) New isohyets have to be made for each rainfall
83 Steps for Isohyetal Method:- 1) Prepare isohyetal map of the area from the rainfall values recorded at different stations. 2) Measure the areas enclosed between successive isohyets by using planimeter or graph paper. 3) Multiply each of these areas by average rainfall intensity between two successive isohyets. 4) Compute average rainfall. P P1 P2 P2 P3 Pn 1 Pn a1 a2... an A Where, P 1, P 2,., Pn = the rainfalls recorded at rain gauge station a 1, a 2, a n = area between successive isohyets
84 1) Greater than 5000 sq.km = Isohyetal method. 2) Hilly area = Isohyetal Method. 3) sq.km= Thiessen Polygon. 4) Plain Area = Thiessen Polygon. 5) Limited number of rain gauge station as compare to basin = Thiessen polygon otherwise Isohyetal. 6) Less than 500 sq. Km = Arithmetic Mean
85 Que. 6. The influence area and the average annual rainfall observed of 5 rain guage stations in a catchment of 30 km 2 is as follows: Stations A B C D E Influence area in % Annual average rainfall in cm Find out the average annual rainfall of the catchment. Sol:-Total Area = 30 km 2 Stations Influence area, % Influence area, km2 Annual average rainfall A B C D E Using Thiessen Polygon Method, P AV = ((P 1 A 1 ) + (P 2 A 2 ) + (P 3 A 3 ) + (P 4 A 4 ) + (P 5 A 5 )) / (A 1 +A 2 +A 3 +A 4 +A 5 ) P AV = ((100 x 7.5) + (110 x 9 ) + (120 x 3) + (95 x 6) + (90 x 4.5)) / (30) P AV = cm 85 85
86 Que. 7. Find the mean precipitation for a rectangular area ABCD having AB = 10 km and BC = 5 km. The precipitation recorded at four corner are A (10cm), B (12cm), C(15cm) & D(11cm) by arithmetic mean method & Thiessen polygon method. Sol:- Arithmetic Mean Method, P m = (P1 + P2 + P3 + P4) /4 P m = ( ) /4 P m = 12 cm Using Thiessen Polygon Method, Stations Rainfall, cm Figure Area, km2 A B C D AEOG GOFB FCHO OHDE P AV = ((P 1 A) + (P 2 B) + (P 3 C) + (P 4 D)) / (A 1 +A 2 +A 3 +A 4 ) P AV = ((10 x 12.5) + (12 x 12.5) + (15 x 12.5) + (11 x 12.5)) / (50) P AV = 12 cm 86 86
87 87 87
88 88
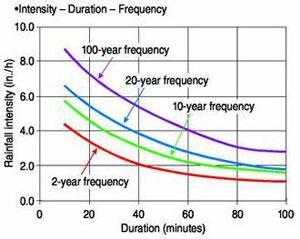
89 INTENSITY-DURATION-FREQUENCY 89 89
90 TYPICAL QUESTIONS 1) Explain in brief the importance of temperature, humidity and wind in hydrological studies. 2) What are various factors affecting precipitation? 3) Explain hydrological cycle with the help of neat sketch. 4) Enlist the various forms of precipitation and explain any one of it. 5) What is hydrological equation? Describe briefly the components of this equation. 6) Explain in brief the different types of precipitation according to the factors responsible for lifting of air mass. 7) Define rain gauge. what are the different types of rain gauges? describe with neat sketch the principle of working of Tipping Bucket Type recording rain gauge. 8) How do you measure rainfall using radar? 9) Explain Intensity-Duration-Frequency and Depth-Area-Duration analysis. 10) Explain data missing records, with the help of an example. 11) The annual rainfall measured over a catchments having an existing rain gauge network of six rain gauge stations are as follows:- Compute the % accuracy of the following rain gauge network Station A 826 B 1029 C 1803 D 1103 E 988 F 1367 Annual rainfall in (mm). 12) The isohyetal weights of the stations in and around a river basin are 0.30,0.04,0.12,0.08,0.25,0.05,0.10,0.06 respectively. Station 3,5,7 lieoutside the basin while the remaining are inside. The rainfalls recorded at these stationsare 123,234,321,195,252,274,281,246 respectively. Determine the average depth of rainfall over the catchment by arithmetic and isohyetal mean methods. 90
Module 1. Lecture 2: Weather and hydrologic cycle (contd.)
") Lecture 2: Weather and hydrologic cycle (contd.) Hydrology Hydor + logos (Both are Greek words) Hydor means water and logos means study. Hydrology is a science which deals with the occurrence, circulation
Lecture 2: Weather and hydrologic cycle (contd.) Hydrology Hydor + logos (Both are Greek words) Hydor means water and logos means study. Hydrology is a science which deals with the occurrence, circulation
H Y D R O L O G Y I R R I G A T I O N C E
 H Y D R O L O G Y & I R R I G A T I O N C E Chapter 1: HYDROLOGICAL CYCLE AND PRECIPITATION 7 HYDROLOGIC CYCLE... 7 PRECIPITATION... 8 MEASUREMENT OF PRECIPITATION... 9 ESTIMATION OF MISSING DATA... 15
ENGINEERING HYDROLOGY
 ENGINEERING HYDROLOGY Prof. Rajesh Bhagat Asst. Professor Civil Engineering Department Yeshwantrao Chavan College Of Engineering Nagpur B. E. (Civil Engg.) M. Tech. (Enviro. Engg.) GCOE, Amravati VNIT,
Precipitation. Prof. M.M.M. Najim
 Precipitation Prof. M.M.M. Najim Learning Outcome At the end of this section students will be able to Explain different forms of precipitation Identify different types of rain gauges Measure rainfall using
Engineering Hydrology
 Engineering Hydrology Prof. Rajesh Bhagat Asst. Professor Civil Engineering Department Yeshwantrao Chavan College Of Engineering Nagpur B. E. (Civil Engg.) M. Tech. (Enviro. Engg.) GCOE, Amravati VNIT,
1. Base your answer to the following question on the weather map below, which shows a weather system that is affecting part of the United States.
 1. Base your answer to the following question on the weather map below, which shows a weather system that is affecting part of the United States. Which sequence of events forms the clouds associated with
Evaporation - Water evaporates (changes from a liquid to a gas) into water vapor due to heat from the Sun.
 into water vapor due to heat from the Sun.") Erin Kathryn 2016 Weather is the conditions of Earth s atmosphere at a certain time and place. For example, sunshine, rain, hurricanes, and storms are all examples of weather. Weather is different at different
Erin Kathryn 2016 Weather is the conditions of Earth s atmosphere at a certain time and place. For example, sunshine, rain, hurricanes, and storms are all examples of weather. Weather is different at different
CHAPTER TWO: PRECIPITATION
 CHAPTER TWO: PRECIPITATION The term precipitation denotes all forms of water that reach the earth from the atmosphere. The usual forms are rainfall, snowfall, hail, frost and dew. Of all these, only the
Thermal / Solar. When air is warmed it... Rises. Solar Energy. Evaporation. Condensation Forms Clouds
 Thermal / Solar Light from the Sun is transformed into what type of energy when it hits Earth's surface? Rises When air is warmed it... Solar Energy Water moves through the water cycle using what type
Temp 54 Dew Point 41 Relative Humidity 63%
 Temp 54 Dew Point 41 Relative Humidity 63% Water in the Atmosphere Evaporation Water molecules change from the liquid to gas phase Molecules in liquids move slowly Heat energy makes them move faster When
Hydrologic Overview & Quantities
 Hydrologic Overview & Quantities It is important to understand the big picture when attempting to forecast. This includes the interactive components and hydrologic quantities. Hydrologic Cycle The complexity
UNIT 12: THE HYDROLOGIC CYCLE
 UNIT 12: THE HYDROLOGIC CYCLE After Unit 12 you should be able to: o Effectively use the charts Average Chemical Composition of Earth s Crust, Hydrosphere and Troposphere, Selected Properties of Earth
anemometer a weather instrument that measures wind speed with wind-catching cups (SRB, IG)
") FOSS Weather on Earth Module Glossary 3 rd Edition 2012 absorb to soak in air the mixture of gases surrounding Earth air pressure the force exerted on a surface by the mass of the air above it anemometer
FOSS Weather on Earth Module Glossary 3 rd Edition 2012 absorb to soak in air the mixture of gases surrounding Earth air pressure the force exerted on a surface by the mass of the air above it anemometer
Precipitation Processes. Precipitation Processes 2/24/11. Two Mechanisms that produce raindrops:
 Precipitation is any form of water that falls from a cloud and reaches the ground. How do cloud drops grow? Chapter 7 When air is saturated with respect to a flat surface it is unsaturated with respect
Advanced Hydrology Prof. Dr. Ashu Jain Department of Civil Engineering Indian Institute of Technology, Kanpur. Lecture 14
 Advanced Hydrology Prof. Dr. Ashu Jain Department of Civil Engineering Indian Institute of Technology, Kanpur Lecture 14 Good morning and welcome to this video course on advanced hydrology. In the last
Meteorology. I. The Atmosphere - the thin envelope of gas that surrounds the earth.
 Meteorology I. The Atmosphere - the thin envelope of gas that surrounds the earth. A. Atmospheric Structure - the atmosphere is divided into five distinct layers that are based on their unique characteristics.
ISSUED BY KENDRIYA VIDYALAYA - DOWNLOADED FROM
 CHAPTER -11 WATER IN THE ATMOSPHERE This chapter deals with Humidity, types of humidity, relative humidity, absolute humidity, specific humidity, dew point, condensation, saturated air, types of precipitation
9/22/14. Chapter 5: Forms of Condensation and Precipitation. The Atmosphere: An Introduction to Meteorology, 12 th.
 Chapter 5: Forms of Condensation and Precipitation The Atmosphere: An Introduction to Meteorology, 12 th Lutgens Tarbuck Lectures by: Heather Gallacher, Cleveland State University! A cloud is a visible
Lecture 5: Precipitation
 Lecture 5: Precipitation Key Questions 1. What physical concepts control the formation of precipitation (air pressure, expanding gases and cooling, and vapor pressure)? 2. What are some air mass lifting
Section 1: The Water Cycle. Q1. How many times has the water on Earth been through a complete turn of the water cycle?
 Water EARTH SCIENCE WEATHER WATER Section 1: The Water Cycle What is the water cycle? The water cycle means that any droplet of water will circulate in a nonstop cycle between the ocean, the atmosphere
CLOUDS, PRECIPITATION, AND WEATHER RADAR
 CHAPTER 7 CLOUDS, PRECIPITATION, AND WEATHER RADAR MULTIPLE CHOICE QUESTIONS 1. The activation temperature of most ice-forming nuclei is 0 C. a. above b. about c. well below 2. Hygroscopic nuclei water
Final Weather Unit Study Guide
 Name: Atmospheric Composition and Layers Altitude Atmosphere Composition Troposphere Air Pressure Stratosphere Mesosphere Thermosphere Exosphere Ionosphere Sample Questions: Final Weather Unit Study Guide
Air stability. About. Precipitation. air in unstable equilibrium will move--up/down Fig. 5-1, p.112. Adiabatic = w/ no exchange of heat from outside!
 Air stability About clouds Precipitation A mass of moist, stable air gliding up and over these mountains condenses into lenticular clouds. Fig. 5-CO, p.110 air in unstable equilibrium will move--up/down
The most abundant gas in the atmosphere by volume is. This gas comprises 78% of the Earth atmosphere by volume.
 The most abundant gas in the atmosphere by volume is. This gas comprises 78% of the Earth atmosphere by volume. A. Oxygen B. Water Vapor C. Carbon Dioxide D. Nitrogen An isobar is a line of constant. A.
WATER IN THE ATMOSPHERE
 CHAPTER Y ou have already learnt that the air contains water vapour. It varies from zero to four per cent by volume of the atmosphere and plays an important role in the weather phenomena. Water is present
NATS 1750 Lecture. Wednesday 28 th November Pearson Education, Inc.
 NATS 1750 Lecture Wednesday 28 th November 2012 Processes that lift air Orographic lifting Elevated terrains act as barriers Result can be a rainshadow desert Frontal wedging Cool air acts as a barrier
1. describe the two methods by which cloud droplets can grow to produce precipitation (pp );
;") 10 Precipitation Learning Goals After studying this chapter, students should be able to: 1. describe the two methods by which cloud droplets can grow to produce precipitation (pp. 232 236); 2. distinguish
10 Precipitation Learning Goals After studying this chapter, students should be able to: 1. describe the two methods by which cloud droplets can grow to produce precipitation (pp. 232 236); 2. distinguish
Weather. Describing Weather
 Weather Describing Weather What is weather? Weather is the atmospheric conditions, along with short-term changes, of a certain place at a certain time. Have you ever been caught in a rainstorm on what
Weather and Climate. Weather the condition of the Earth s atmosphere at a particular time and place
 Weather and Climate Weather the condition of the Earth s atmosphere at a particular time and place Climate the average year-after-year conditions of temperature, precipitation, winds and clouds in an area
Land and Water Study Guide
 Land and Water Study Guide Answer Key Part 1 States of Matter 1. What are the three states of matter for water? Give several examples for each. Solid Ice cube (non water examples = candy bar and a log).
Final Review Meteorology
 Final Review Meteorology Multiple Choice Identify the choice that best completes the statement or answers the question. 1. Which of the following is an example of climate? a. A sudden snowstorm resulted
Water in the Air. Pages 38-45
 Water in the Air Pages 38-45 Quick Write What is the water cycle? Draw and label a diagram of the water cycle. Chapter 2, Section 1 Does this look familiar? Please open your text to page 38 and copy and
Goal 2.5. The Atmosphere
 Goal 2.5 The Atmosphere Lesson 1 Atmospheric Basics Think About It Why would it be a bad thing if the atmosphere was mostly oxygen? Focus Question What is the structure and function of the atmosphere?
Atmosphere and Weather Revision Notes
 Atmosphere and Weather Revision Notes Atmosphere The blanket of gases that surrounds the Earth is called the atmosphere. The main gases are nitrogen (78 %), oxygen (21 %), water vapour, ozone and carbon
12 SWAT USER S MANUAL, VERSION 98.1
 12 SWAT USER S MANUAL, VERSION 98.1 CANOPY STORAGE. Canopy storage is the water intercepted by vegetative surfaces (the canopy) where it is held and made available for evaporation. When using the curve
Freshwater. 1. The diagram below is a cross-sectional view of rain falling on a farm field and then moving to the water table.
 Name: ate: 1. The diagram below is a cross-sectional view of rain falling on a farm field and then moving to the water table. 3. Which conditions produce the most surface water runoff? A. steep slope,
Type of Precipitation
 Precipitation Type of Precipitation Measurement of rainfall Location of rain gauges Categorisation Climate Estimation of basin rainfall Finding Average rainfall, Standard deviation, and Coefficient of
Name Date Hour Table. Chapter 12-AP Lesson One
 Name Date Hour Table 1. Chapter 12-AP Lesson One 2. 3. 4. 5. 6. 7. 8. 9. 10. 11. 12. 13. 14. 15. 16. 17. 18. 19. 20. 21. 22. Name Date Hour Table Directions: Answer each question to create your word bank.
Lecture 07 February 10, 2010 Water in the Atmosphere: Part 1
 Lecture 07 February 10, 2010 Water in the Atmosphere: Part 1 About Water on the Earth: The Hydrological Cycle Review 3-states of water, phase change and Latent Heat Indices of Water Vapor Content in the
Chapter 8 - Precipitation. Rain Drops, Cloud Droplets, and CCN
 Chapter 8 - Precipitation Rain Drops, Cloud Droplets, and CCN Recall the relative sizes of rain drops, cloud drops, and CCN: raindrops - 2000 μ m = 2 mm fall at a speed of 4-5 ms -1 cloud drops - 20 μ
Moisture, Clouds, and Precipitation Earth Science, 13e Chapter 17
 Moisture, Clouds, and Precipitation Earth Science, 13e Chapter 17 Stanley C. Hatfield Southwestern Illinois College Changes of state of water, H 2 O Water is the only substance in atmosphere that exists
Land and Water Summative Assessment. Name Date
 Land and Water Summative Assessment Name Date Read each question carefully and select the best answer. 1. Abby built a model to study how rain changes the land. She shaped the land into single, smooth
Name: Period : Jaguar Review #10
 Name: Period : Earth & Space Sciences Benchmark B & C Jaguar Review #10 1. The most common element in living organisms is carbon. As new plants and animals grow, a great deal of carbon is required. Where
Name Class Date STUDY GUIDE FOR CONTENT MASTERY
 Atmosphere SECTION 11.1 Atmospheric Basics In your textbook, read about the composition of the atmosphere. Circle the letter of the choice that best completes the statement. 1. Most of Earth s atmosphere
Precipitation Rabi H. Mohtar
 Precipitation Rabi H. Mohtar The objectives of this module are to present and analyze: 1) Precipitation forms, characteristics, and measurements 2) Intensity, Duration, Frequency (IDF) curves and rainfall
Weather - is the state of the atmosphere at a specific time & place
 Weather Section 1 Weather - is the state of the atmosphere at a specific time & place Includes such conditions as air pressure, wind, temperature, and moisture in the air The Sun s heat evaporates water
1. CLIMATOLOGY: 2. ATMOSPHERIC CHEMISTRY:
 What is meteorology? A. METEOROLOGY: an atmospheric science that studies the day to day changes in the atmosphere 1. ATMOSPHERE: the blanket of gas that surrounds the surface of Earth; the air 2. WEATHER:
Weather, Atmosphere and Meteorology
 S c i e n c e s Weather, Atmosphere and Meteorology Key words: Atmosphere, Ozone, Water vapor, solar radiation, Condensation, Evaporation, Humidity, Dew-Point Temperature, Cirrus Clouds, Stratus Clouds,
Precipitation AOSC 200 Tim Canty. Cloud Development: Orographic Lifting
 Precipitation AOSC 200 Tim Canty Class Web Site: http://www.atmos.umd.edu/~tcanty/aosc200 Topics for today: Precipitation formation Rain Ice Lecture 14 Oct 11 2018 1 Cloud Development: Orographic Lifting
Chapter 5: Weather. Only Section 1: What is Weather?
 Chapter 5: Weather Only Section 1: What is Weather? Find the definitions of: Meteorology, meteorologist, weather, climate Not in book? Use the dictionaries **Meteorology - Meteorology is the study of the
Unit: Weather Study Guide
 Name: Period: Unit: Weather Study Guide Define each vocabulary word on a separate piece of paper or index card. Weather Climate Temperature Wind chill Heat index Sky conditions UV index Visibility Wind
The Atmosphere Made up of mainly two gases: Nitrogen 78% Oxygen 21% Trace Gases 1%
 The Atmosphere 18.1 The Atmosphere Made up of mainly two gases: Nitrogen 78% Oxygen 21% Trace Gases 1% Layers of the Atmosphere made made up of 5 layers: Troposphere Stratosphere Mesosphere Ionosphere
Unit 4 Review Guide: Weather
 Unit 4 Review Guide: Weather Weather: The condition of the atmosphere at a specific time and place. Freezing: To become hardened into ice or into a solid body Deposition: The change in state of matter
Our Planet Earth. I nteractions of Earth Systems
 CHAPTER 3 LESSON 2 Our Planet Earth I nteractions of Earth Systems Key Concepts How does the water cycle show interactions of Earth systems? How does weather show interactions of Earth systems? How does
 12 10 8 6 4 2 0 40-50 50-60 60-70 70-80 80-90 90-100 Fresh Water What we will cover The Hydrologic Cycle River systems Floods Groundwater Caves and Karst Topography Hot springs Distribution of water in
Moisture, Clouds, and Precipitation: Clouds and Precipitation. Dr. Michael J Passow
 Moisture, Clouds, and Precipitation: Clouds and Precipitation Dr. Michael J Passow What Processes Lift Air? Clouds require three things: water vapor, a condensation nucleus, and cooling Cooling usually
student pretest Stewardship Project middle school (Grades 7-8)
") student pretest Stewardship Project middle school (Grades 7-8) 1. True or False. Solar energy is radiant energy carried through the sun s heat and light. 2. Yes or No. Does solar energy dissipate as it
student pretest Stewardship Project middle school (Grades 7-8) 1. True or False. Solar energy is radiant energy carried through the sun s heat and light. 2. Yes or No. Does solar energy dissipate as it
Science Chapter 13,14,15
 Science 1206 Chapter 13,14,15 1 Weather dynamics is the study of how the motion of water and air causes weather patterns. Energy from the Sun drives the motion of clouds, air, and water. Earth s tilt at
Thursday, June 5, Chapter 5: Condensation & Precipitation
 Thursday, June 5, 2014 Chapter 5: Condensation & Precipitation Chapter 5: Condensation and Precipitation Formation of Condensation Saturated Air Condensation Nuclei Results of Condensation Clouds Fog Dew
3. The map below shows an eastern portion of North America. Points A and B represent locations on the eastern shoreline.
 1. Most tornadoes in the Northern Hemisphere are best described as violently rotating columns of air surrounded by A) clockwise surface winds moving toward the columns B) clockwise surface winds moving
6.2 Meteorology. A meteorologist is a person who uses scientific principles to explain, understand, observe, or forecast Earth s weather.
 Water and Weather 6.2 Meteorology A meteorologist is a person who uses scientific principles to explain, understand, observe, or forecast Earth s weather. 6.2 Water in the Atmosphere Dew point is the temperature
PHYSICAL GEOGRAPHY. By Brett Lucas
 PHYSICAL GEOGRAPHY By Brett Lucas INTRODUCTION TO ATMOSPHERIC MOISTURE Atmospheric Moisture The Nature of Water The Hydrologic Cycle Evaporation Measures of Humidity Condensation The Buoyancy of Air Precipitation
WATER ON AND UNDER GROUND. Objectives. The Hydrologic Cycle
 WATER ON AND UNDER GROUND Objectives Define and describe the hydrologic cycle. Identify the basic characteristics of streams. Define drainage basin. Describe how floods occur and what factors may make
24.2 Cloud Formation 2/3/2014. Orographic Lifting. Processes That Lift Air Frontal Wedging. Convergence and Localized Convective Lifting
 2/3/2014 Orographic Lifting Processes That Lift Air Frontal Wedging A front is the boundary between two adjoining air masses having contrasting characteristics. Convergence and Localized Convective Lifting
Study of Hydrometeorology in a Hard Rock Terrain, Kadirischist Belt Area, Anantapur District, Andhra Pradesh
 Open Journal of Geology, 2012, 2, 294-300 http://dx.doi.org/10.4236/ojg.2012.24028 Published Online October 2012 (http://www.scirp.org/journal/ojg) Study of Hydrometeorology in a Hard Rock Terrain, Kadirischist
Weather. Describing Weather
 CHAPTER 13 Weather LESSON 1 Describing Weather What do you think? Read the two statements below and decide whether you agree or disagree with them. Place an A in the Before column if you agree with the
Multiple Choice Identify the choice that best completes the statement or answers the question.
 CH.15 practice TEST Multiple Choice Identify the choice that best completes the statement or answers the question. 1) The short-term state of the atmosphere is called a) climate. c) water cycle. b) weather.
78% : component of atmosphere! 21% : 1% : Changes depending on origin of air: - originated over - originated over Ozone = O 3 Definition:
 Unit 6 Part 1 Meteorology Name: Composition and Structure of the Atmosphere SWBAT: Describe the composition of the atmosphere. Diagram/describe the layers of the earth s atmosphere. Weather Climate Atmospheric
Three things necessary for weather are Heat, Air, Moisture (HAM) Weather takes place in the Troposphere (The lower part of the atmosphere).
 Weather takes place in the Troposphere (The lower part of the atmosphere).") Grade 5 SCIENCE WEATHER WATCH Name: STUDY NOTES Weather - The condition of the atmosphere with respect to heat/cold, wetness/dryness, clearness/ cloudiness for a period of time. Weather changes over time
Grade 5 SCIENCE WEATHER WATCH Name: STUDY NOTES Weather - The condition of the atmosphere with respect to heat/cold, wetness/dryness, clearness/ cloudiness for a period of time. Weather changes over time
WATER IN THE ATMOSPHERE
 WATER IN THE ATMOSPHERE I. Humidity A. Defined as water vapor or moisture in the air (from evaporation and condensation). B. The atmosphere gains moisture from the evaporation of water from oceans, lakes,
Water Cycle and Weather Study Guide
 Name: Date: Water Cycle and Weather Study Guide 1. Which symbol would be used to represent this front on a weather map? a. b. c. d. 1 of 14 2. The table shows the relative humidity for a location during
Condensation is the process by which water vapor changes from a gas to a liquid. Clouds form by this process.
 CHAPTER 16 1 Water in the Air SECTION Understanding Weather BEFORE YOU READ After you read this section, you should be able to answer these questions: What is weather? How does water in the air affect
GEOG415 Mid-term Exam 110 minute February 27, 2003
 GEOG415 Mid-term Exam 110 minute February 27, 2003 1 Name: ID: 1. The graph shows the relationship between air temperature and saturation vapor pressure. (a) Estimate the relative humidity of an air parcel
EARTH SCIENCE. Prentice Hall Water in the Atmosphere Water in the Atmosphere Water in the Atmosphere.
 Prentice Hall EARTH SCIENCE Tarbuck Lutgens Water s Changes of State 1. Precipitation is any form of water that falls from a cloud. a. Examples: Snow, rain, hail, sleet 3 States of matter of water: 1.
Atmosphere L AY E RS O F T H E AT MOSPHERE
 Atmosphere L AY E RS O F T H E AT MOSPHERE Why is the atmosphere divided into 5 different layers? The atmosphere is divided into five different layers because the atmosphere is not uniform, its properties
Weather Maps. Name:& & &&&&&Advisory:& & 1.! A&weather&map&is:& & & & 2.! Weather&fronts&are:& & & & & &
 Name: Advisory: Weather Maps 1. Aweathermapis: 2. Weatherfrontsare: a. Labelthefrontsbelow: 1. 2. 3. 4. 3. Clovercoversymbols 4. Precipitationsymbols 5. 6. 7. 8. 5. RadarEchoIntensityshows 6. Isobarsare
CTB3300WCx Introduction to Water and Climate
 CTB3300WCx Introduction to Water and Climate GWC 3 Precipitation Hubert Savenije Welcome! My name is Hubert Savenije and I am a hydrologist. There are many different types of precipitation, besides rainfall.
Lecture Outlines PowerPoint. Chapter 17 Earth Science 11e Tarbuck/Lutgens
 Lecture Outlines PowerPoint Chapter 17 Earth Science 11e Tarbuck/Lutgens 2006 Pearson Prentice Hall This work is protected by United States copyright laws and is provided solely for the use of instructors
Chapter Introduction. Chapter Wrap-Up. Earth Systems
 Chapter Introduction Lesson 1 Lesson 2 Chapter Wrap-Up Earth Systems Interactions of Earth Systems How can you describe Earth? What do you think? Before you begin, decide if you agree or disagree with
Water in the Atmosphere
 Water in the Atmosphere Characteristics of Water solid state at 0 o C or below (appearing as ice, snow, hail and ice crystals) liquid state between 0 o C and 100 o C (appearing as rain and cloud droplets)
WEATHER. rain. thunder. The explosive sound of air as it is heated by lightning.
 WEATHER rain thunder The explosive sound of air as it is heated by lightning. rainbow lightning hurricane They are intense storms with swirling winds up to 150 miles per hour. tornado cold front warm front
WATER IN THE ATMOSPHERE
 WATER IN THE ATMOSPHERE During a rainstorm, the air feels moist On a clear, cloudless day, the air may feel dry As the sun heats the land and oceans, the amount of water in the atmosphere changes Water
Chapter 2 Planet Earth
 Chapter 2 Planet Earth Section Notes Earth and the Sun s Energy Water on Earth The Land Close-up The Water Cycle World Almanac Major Eruptions in the Ring of Fire Quick Facts Chapter 2 Visual Summary Video
Which map shows the stream drainage pattern that most likely formed on the surface of this volcano? A) B)
 B)") 1. When snow cover on the land melts, the water will most likely become surface runoff if the land surface is A) frozen B) porous C) grass covered D) unconsolidated gravel Base your answers to questions
1. When snow cover on the land melts, the water will most likely become surface runoff if the land surface is A) frozen B) porous C) grass covered D) unconsolidated gravel Base your answers to questions
Mr. P s Science Test!
 WEATHER- 2017 Mr. P s Science Test! # Name Date 1. Draw and label a weather station model. (10 pts) 2. The is the layer of the atmosphere with our weather. 3. Meteorologists classify clouds in about different
III. Section 3.3 Vertical air motion can cause severe storms
 III. Section 3.3 Vertical air motion can cause severe storms http://www.youtube.com/watch?v=nxwbr60tflg&feature=relmfu A. Thunderstorms form from rising moist air Electrical charges build up near the tops
SENSOR PLACEMENT FOR SNOW & ICE MELT APPLICATIONS
 networketi.com SENSOR PLACEMENT FOR SNOW & ICE MELT APPLICATIONS By: Dave Mays A great number of service calls come in with the common problem of the heaters not coming on even though it is snowing outside
COMPOSITION OF THE ATMOSPHERE
 Name Air COMPOSITION OF THE ATMOSPHERE 1. What are the two most abundant gases in the atmospherere? 2. Why do you think the percentage of water vapor in the air varies? 3. Would you classify carbon dioxide
Chapter Introduction. Weather. Patterns. Forecasts Chapter Wrap-Up
 Chapter Introduction Lesson 1 Lesson 2 Lesson 3 Describing Weather Weather Patterns Weather Forecasts Chapter Wrap-Up How do scientists describe and predict weather? What do you think? Before you begin,
UGRC 144 Science and Technology in Our Lives/Geohazards
 UGRC 144 Science and Technology in Our Lives/Geohazards Flood and Flood Hazards Dr. Patrick Asamoah Sakyi Department of Earth Science, UG, Legon College of Education School of Continuing and Distance Education
1., annual precipitation is greater than annual evapotranspiration. a. On the ocean *b. On the continents
 CHAPTER 6 HUMIDITY, SATURATION, AND STABILITY MULTIPLE CHOICE QUESTIONS 1., annual precipitation is greater than annual evapotranspiration. a. On the ocean *b. On the continents 2., annual precipitation
Atmospheric Basics Atmospheric Composition
 Atmospheric Basics Atmospheric Composition Air is a combination of many gases, each with its own unique characteristics. About 99 percent of the atmosphere is composed of nitrogen and oxygen, with the
A. Weather - the conditions of the variables of the atmosphere for any short period of time
 WEATHER & THE ATMOSPHERE A. Weather - the conditions of the variables of the atmosphere for any short period of time Meteorology - the study of weather and weather related variables - the variables: Topic
Climate Change or Climate Variability?
 Climate Change or Climate Variability? Key Concepts: Greenhouse Gas Climate Climate change Climate variability Climate zones Precipitation Temperature Water cycle Weather WHAT YOU WILL LEARN 1. You will
a. Air is more dense b. Associated with cold air (more dense than warm air) c. Associated with sinking air
 c. Associated with sinking air") Meteorology 1. Air pressure the weight of air pressing down on Earth 2. Temperature and altitude determine air pressure 3. The more air particles are present, the more air density or pressure exists 4.
Meteorology 1. Air pressure the weight of air pressing down on Earth 2. Temperature and altitude determine air pressure 3. The more air particles are present, the more air density or pressure exists 4.
according to and water. High atmospheric pressure - Cold dry air is other air so it remains close to the earth, giving weather.
 EARTH'S ATMOSPHERE Composition of the atmosphere - Earth's atmosphere consists of nitrogen ( %), oxygen ( %), small amounts of carbon dioxide, methane, argon, krypton, ozone, neon and other gases such
Solar Energy. Convection Zones. Weather Observations and Measurements
 Atmospheric Layers Atmospheric Gases Atmospheric Temperatures Atmospheric Pressure Water Cycle Precipitation Clouds Air Masses Fronts High & Low Pressure Solar Energy Convection Zones Weather Observations
RR#5 - Free Response
 Base your answers to questions 1 through 3 on the data table below and on your knowledge of Earth Science. The table shows the area, in million square kilometers, of the Arctic Ocean covered by ice from
Chapter 7 Precipitation Processes
 Chapter 7 Precipitation Processes Chapter overview: Supersaturation and water availability Nucleation of liquid droplets and ice crystals Liquid droplet and ice growth by diffusion Collision and collection
Lecture 6: Precipitation Averages and Interception
 Lecture 6: Precipitation Averages and Interception Key Questions 1. How much and when does Whatcom County receive rain? 2. Where online can you find rainfall data for the state? 3. How is rainfall averaged