An Examination of the Dynamics of a Rear-inflow Jet Associated with an Idealized Mesoscale Convective System
|
|
|
- Lily Hancock
- 5 years ago
- Views:
Transcription

1 University of Wisconsin Milwaukee UWM Digital Commons Theses and Dissertations May 2017 An Examination of the Dynamics of a Rear-inflow Jet Associated with an Idealized Mesoscale Convective System Caitlin Crossett University of Wisconsin-Milwaukee Follow this and additional works at: Part of the Atmospheric Sciences Commons Recommended Citation Crossett, Caitlin, "An Examination of the Dynamics of a Rear-inflow Jet Associated with an Idealized Mesoscale Convective System" (2017). Theses and Dissertations This Thesis is brought to you for free and open access by UWM Digital Commons. It has been accepted for inclusion in Theses and Dissertations by an authorized administrator of UWM Digital Commons. For more information, please contact kristinw@uwm.edu.
2 AN EXAMINATION OF THE DYNAMICS OF A REAR-INFLOW JET ASSOCIATED WITH AN IDEALIZED MESOSCALE CONVECTIVE SYSTEM by Caitlin Crossett A Thesis Submitted in Partial Fulfillment of the Requirements for the Degree of Master of Science in Mathematics at The University of Wisconsin-Milwaukee May 2017
3 ABSTRACT AN EXAMINATION OF THE DYNAMICS OF A REAR-INFLOW JET ASSOCIATED WITH AN IDEALIZED MESOSCALE CONVECTIVE SYSTEM by Caitlin Crossett The University of Wisconsin-Milwaukee, 2017 Under the Supervision of Professor Clark Evans This study evaluates the main controls on the descent of the rear-inflow jet (RIJ), associated with a mesoscale convective system (MCS), toward the surface. This study employs the Cloud Model 1 (CM1), release 18.3, to simulate idealized MCSs. The model has a horizontal grid spacing of 1 km with 100 vertical levels, and utilizes doubly periodic lateral boundary conditions. The Morrison double-moment explicit moisture scheme is used and Coriolis accelerations are ignored. To initiate convection, a 2 K warm bubble is applied over a limited subset of the domain. Simulations in which the magnitude of vertical wind shear is perturbed, using base-state substitution, are then considered to examine how the descent of the RIJ is impacted. It was found that for greater magnitudes of 2.5 km vertical wind shear, the RIJ associated with the simulated MCS is more elevated and stronger than with weaker wind shear over the same layer. This can be attributed to better balance between the cold pool, line-normal vertical wind shear, and RIJ. Future work includes extending the wind shear-rij phase space to include other magnitudes, depths, and directions of wind shear as well as comparing this implementation of base-state substitution to other applications. ii
4 TABLE OF CONTENTS List of Figures... iv Acknowledgements... vi 1. Introduction Data and Methods Results Discussion and Future Work Figures References iii
5 LIST OF FIGURES Figure 1: Conceptual model of a squall line with a trailing stratiform area viewed in a vertical cross section oriented perpendicular to the convective line (i.e., parallel to its motion). From Houze et al. (1989; their Fig. 1) Figure 2: Conceptual model of RIJ formation. Both arguments described within the text are shown here: pressure perturbation and circulation arguments Figure 3: A conceptual model of the mature structure of a long-lived squall-line-type convective system for (a) a system with an initially descending rear-inflow jet and (b) a system with an initially elevated rear-inflow jet. The updraft current is denoted by the thick, double-lined flow vector, while the rear-inflow current is denoted by the thick, dashed flow vector. The shading denotes the surface cold pool. The thin, circular arrows depict the most significant sources of horizontal vorticity, which are either associated with the ambient shear or which are generated within the convective system, as described in the text. Regions of lighter or heavier rainfall are indicated by the more sparsely or densely packed vertical lines, respectively. The scalloped line denotes the outline of the cloud. From Weisman (1992; their Fig. 23) Figure 4: Skew T diagram depicting temperature and moisture profile used in model experiments (heavy solid lines). Heavy dashed line represents a parcel ascent from the surface based on a surface mixing ratio q vo = 14 g kg -1 (used in the current study as initial condition). Heavy dotted lines represent similar parcel ascents for q vo = 11 g kg -1 and q vo = 16 g kg -1. Tilted solid lines are isotherms, short dashed lines are dry adiabats, and long dashed lines are moist adiabats. From Weisman and Klemp (1982; their Fig. 1) Figure 5: Composite reflectivity (dbz; shaded) for the simulated MCS at (a) 30 min, (b) 1 h 30 min, and (c) 3 h into the simulation. (d) The u-component of the wind (m s -1 ; shaded), and the u and w-components of the wind (kt; barbs; w-component scaled by *10) at 3 h into the simulation Figure 6: Composite reflectivity and the 2.5 km wind (kt; barbs) for the CTL simulation (left), and the INC simulation (right) at (a, b) 3 h 30 min, (c, d) 4 h, and (e, f) 4 h 30 min Figure 7: t = 4 h. Cross-section of the u-component of the wind (m/s, shaded), and storm-relative u and w-components of the wind (kt; barbs; w-component scaled by *10), for (a) CTL, (b) INC, and (c) Difference between INC and CTL. In (c), the grid of CTL was shifted so that the simulated leading lines were in the same location and differences are exclusively due to system structure and not position Figure 8: As in Fig. 7 except, pressure perturbation from the initial state (Pa, shaded) Figure 9: As in Fig. 7 except, potential temperature perturbation from the initial state (K, shaded) iv
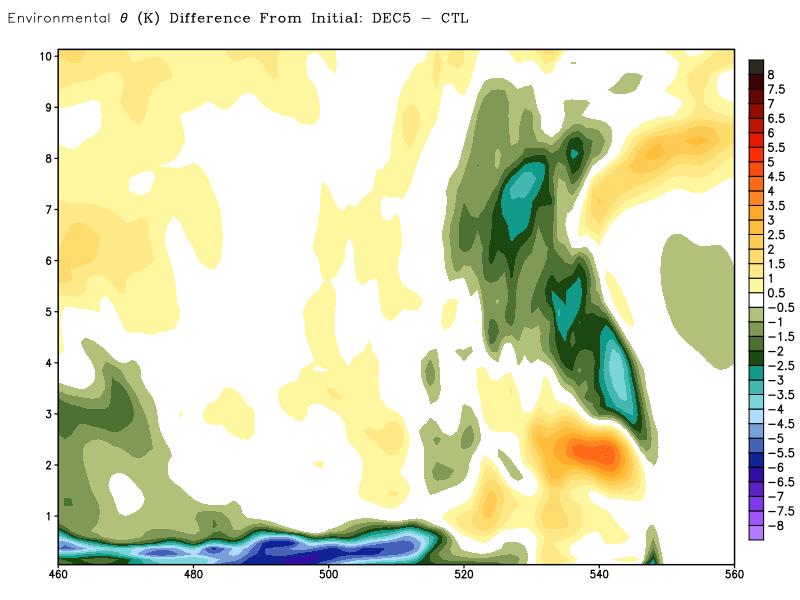
6 Figure 10: Composite reflectivity (shaded, dbz) and 2.5 km winds (barbs, kt) at t = 5h for (a) CTL, (b) INC, and (c) DEC5, (d-f) as in (a-c), except at t = 5h 30 min Figure 11: As in Fig. 7 except at t = 5 h Figure 12: As in Fig. 9, except at t = 5 h Figure 13: As in Fig. 8 except at t = 5 h Figure 14: t = 5.5 h. Cross-section of the u-component of the wind (m/s, shaded), and stormrelative u and w-components of the wind (kt, barbs). (a) CTL, (b) INC and (c) DEC5. (d) Difference between INC and CTL, (e) Difference between DEC5 and CTL, and (f) Difference between INC and DEC5. For difference plots the grid of one simulation was shifted in the difference plot so that the leading lines were in the same location Figure 15: As in Fig. 14 except, potential temperature perturbation from the initial state (K, shaded) Figure 16: As in Fig. 14 except, pressure perturbation from the initial state (Pa, shaded) Figure 17: Composite reflectivity (shaded, dbz) and 2.5 km winds (barbs, kt) at t = 6h for (a) CTL, (b) INC, and (c) DEC5, (d-f) as in (a-c), except at t = 6h 30 min Figure 18: As in Fig. 14, except at t = 6 h Figure 19: As in Fig. 15, except at t = 6 h Figure 20: As in Fig. 16, except at t = 6 h v
7 ACKNOWLEDGMENTS I would first like to thank my adviser, Clark Evans, for all of his help, knowledge, and wisdom sharing throughout the course of my time at UWM. I have learned more about the research process, and CM1 than I ever hoped or thought that I would. Secondly, I would like to thank Bryan Burlingame for all of his help with GrADS, WRF, and really any/all computer problems that I dealt with on a daily basis. To Amanda, Austin, Bridgette, Kaitlyn, Kyle, Lily, Martin, and Russell, thank you for the laughs, food, encouragement, basketball/volleyball/tennis, and company for countless hours at all of Milwaukee s coffee shops. You have all contributed to my life in positive ways and I am truly grateful for the opportunity to be able to call myself one of your friends. Thank you to Drs. Sergey Kravtsov, Jon Kahl, and Paul Roebber for their input and willingness to be on my committee. And last but not least, to my family for their support, without which I would not be where or who I am today, I dedicate this thesis to them. vi
8 1. Introduction The structure and maintenance of squall lines and mesoscale convective systems (MCSs) have been extensively studied in the literature, and multiple theories exist for how they are formed and maintained. Previous studies have identified common characteristics that are typically associated with squall lines and MCSs. One such study, Houze et al. (1989), described squall lines as being characterized by a region of intense convection at the leading edge of the system, ascending front-to-rear flow over the gust front and leading line, a region of stratiform rain which extends behind the leading convection, and descending rear inflow, indicative of the rear-inflow jet (RIJ; Fig. 1). Based on its precipitation structure, the archetypal MCS shown in Fig. 1 would be typified as a trailing stratiform MCS, following the classification scheme of Parker and Johnson (2000). Parker and Johnson (2000) identified two other leading MCS modes as leading stratiform and parallel stratiform MCSs. These two modes occur much less frequently, each comprising only 19% of the total cases as compared to the 58% of cases that were classified as the trailing stratiform type, and have also been less-studied. In addition to these three MCS types, Schumacher and Johnson (2005) identified two other MCS modes: training line/adjoining stratiform and backbuilding/quasi-stationary. The main differences between these five types of MCSs are in their precipitation structures and/or propagation characteristics. Although multiple MCS archetypes exist, this study focuses on the trailing-stratiform type of MCS, as it is the most frequently occurring archetype. To describe the maintenance of strong, long- lived squall lines, one of the most widelyaccepted theories was proposed by Rotunno et al. (1988, hereafter RKW; see also Weisman and Rotunno 2004 and Bryan and Rotunno 2014). They showed that the sustenance of an organized multicellular convective line was dependent on the extent to which the environmental low-level 1
9 shear balanced the vertical circulation created by buoyancy gradients along the cold pool's leading edge. An optimal state was said to be reached when the vertical circulation from the environmental low-level shear exactly balanced that produced by the cold pool. This resulted in a narrow line of intense convection associated with upright updrafts. As the system was maintained, the strength of the cold pool produced by falling precipitation increased, in turn strengthening its vertical circulation. As the cold pool circulation overwhelmed that produced by the nominally spatially- and temporally-invariant environmental low-level wind shear, the updrafts associated with the system began to tilt upshear and weaken. As the system began to lean upshear, an area of negative perturbation pressure (relative to the background environment) 2 5 km above ground level along the MCSs leading line formed due to the vertical buoyancy gradient between the negatively-buoyant cold pool and positivelybuoyant, rearward-tilted updraft (Fig. 2). The horizontal perturbation pressure gradient force that resulted from near-zero perturbation pressure behind the MCS to low perturbation pressure along the MCSs leading line accelerated the flow from rear to front, effectively forming the RIJ. A second, complementary explanation for RIJ formation follows from horizontal vorticity arguments. Due to the continued outward spreading of the cold pool, positive horizontal vorticity was created along its back edge. This positive horizontal vorticity was countered by negative horizontal vorticity produced beneath the ascending front-to-rear current. The combination of these two regions of horizontal vorticity led to rear-to-front flow behind the MCSs leading line (Fig. 2). More recently, Bryan and Rotunno (2014) examined two-dimensional numerical simulations of gravity currents in shear and successfully reproduced many aspects of the RKW conceptual model. Most notably, they identified a simplified relationship between the depth of the shear layer relative to the depth of the cold pool of 3/4. If this relationship is achieved, the 2
10 updraft associated with the simulated system is upright as in the optimal state described by RKW. This then showed that the optimal state as described by RKW is physically-possible within the context of the Bryan and Rotunno (2014) highly idealized simulations. Although RKW theory is one of the most widely accepted theories for MCS maintenance, it does not come without criticism. Coniglio et al. (2012) argued that RKW theory failed to account for the complexity of processes that maintain observed MCSs. By using a case study of the 8 May 2009 derecho, they illustrated that the interaction between the lowest 3 km of vertical wind shear and the cold pool may not be the primary factor that controls MCS structure and maintenance, but rather the vertical wind shear over deeper layers that may have a more significant impact, especially for more complex MCS environments (Coniglio et al. 2012). Due to the dependence of MCS longevity on the low-level vertical wind shear, it is no surprise that this low-level shear also impacts MCS organization. In idealized numerical simulations, Weisman et al. (1988) found that the component of shear perpendicular to the squall line with magnitudes of 17.5 to 25 m s -1, confined to the lowest 2.5 km AGL, resulted in the simulated squall lines reaching the optimal condition (for the specific thermodynamic profile considered) as described by RKW. Using the same thermodynamic profile for the simulations allowed for the maximum amount of buoyancy that could be realized by updrafts along the leading line to be controlled. RIJ strength in these simulations increased with an increase in the magnitude and depth of the shear. In a similar study, Fovell and Ogura (1989) varied the linear, unidirectional, low-level vertical wind shear (below 2.5 km AGL) from 5 to 30 m s -1 in numerically-simulated multicell storms. They found that storm organization increased as the low-level vertical wind shear increased. The increase in low-level shear was also accompanied 3
11 by an increase in RIJ strength. Fovell and Ogura (1989) hypothesized that this may have been due to the RIJ helping to prop-up the leading line updraft, leading to system intensification. In addition to the effects of vertical wind shear on RIJ strength, different thermodynamic profiles can also have substantial effects. Weisman (1992) found that as the amount of surfacebased convective available potential energy (CAPE) increased, so did the strength of the resulting RIJ. The thermodynamic profile controlled the maximum amount of buoyancy that could be realized by a parcel in terms of lifting at the leading edge within the updraft and the amount of cooling within the downdraft (Weisman 1992). The subsequent interaction between the circulations produced by the vertical wind shear and thermodynamic profiles influenced the balance, or lack thereof, between the two competing circulations which, in turn, impacted the structure and maintenance of a given MCS (Weisman 1992). Therefore, while the thermodynamic profile constrained the available buoyancy, the balance between the ambient vertical wind shear and the cold-pool-generated circulation controlled how much of that available buoyancy was realized. Weisman (1992) explained the mechanisms of RIJ location relative to the surface using horizontal vorticity arguments. In weaker vertical wind shear simulations, the buoyancy-driven circulation within the cold pool overwhelmed that produced by the low-level shear. As the circulation along the front edge of the cold pool became stronger, due to the increasing strength of the cold pool and the addition of the horizontal circulation produced by the RIJ, the system was tilted further upshear and resulted in weaker lifting along the leading edge. This allowed rear-to-front flow to accelerate across the cold pool toward the surface (Fig. 3a). In stronger shear simulations, the RIJ remained elevated over the cold pool due to the addition of horizontal vorticity from the RIJ, which in turn counteracted what would have been an overwhelming 4
12 circulation along the cold pool s leading edge (Weisman 1992; Fig. 3b). The relative strength of these circulations determined whether the RIJ would remain elevated or descend towards the surface. The importance of whether the RIJ descended or remained elevated not only had to do with the potential for near-surface damaging winds, but also on the longevity and strength of the system as a whole. The formation of an elevated RIJ typically allowed for a longer-lived system (Weisman 1992; Weisman 1993). The elevated RIJ produced a circulation of the same sign as that produced by the low-level wind shear along the system s leading edge. This new circulation promoted the upright orientation of the updraft, or the optimal state as discussed by RKW and hypothesized by Fovell and Ogura (1989), thereby allowing the system to persist (Fig. 3b). While the role of elevated RIJs on the longevity and strength of a system has been wellestablished, the corresponding role of a descending RIJ are less well-understood. Weisman (1992) shows that a descending RIJ produced a circulation of the same sign as the cold pool. The addition of these two circulations act to tilt the system further upshear, resulting in verticallytilted updrafts and weaker lifting along the leading edge of the outward-spreading cold pool (Fig. 3a). Lafore and Moncrief (1989) make two arguments for and against the Weisman (1992) point of view. If RIJ subsidence was too strong, there could be a reduction or lowering of the RIJinduced circulation, which in turn could decrease the ability of the system to release convective instability. In the Weisman (1992, 1993) perspective, the lowering of this RIJ-induced circulation would strengthen the circulation counter to that of the sign associated with the environmental vertical wind shear, therefore reducing the strength of this updraft and its ability to realize buoyancy. On the other hand, the air current produced by a descending RIJ could follow the cold pool as it intersected the surface, enhancing convergence along the gust front and 5
13 thus potentially triggering new convection along the cold pool s leading edge. Observational studies have also noted this variability in the impact of RIJs on convective system evolution (Chong et al. 1987; Smull and Houze 1987; Ogura and Liou 1980; Rutledge et al. 1988; Houze et al. 1989). More recently, Xu et al. (2015) have proposed another mechanism that may be responsible for RIJ descent. In a bow echo simulation, using real data from the 8 May 2009 derecho event, they showed that RIJ descent was due to a localized pressure gradient force that developed between pressure perturbations associated with both decelerating rear-to-front flow and a mesovortex present near the surface along the bow echo s leading edge. The mesovortex was associated with a negative pressure perturbation near the surface, whereas at ~3.5 km AGL immediately to the west of this mesovortex, decelerating rear-to-front flow was associated with a positive pressure perturbation as the RIJ intersected the updrafts along the leading line. The resulting localized perturbation pressure gradient lead to a primarily downward-directed perturbation pressure gradient force, which forced the RIJ locally downward to the surface (Xu et al. 2015). It is the focus of this study to determine the main controls on when a RIJ associated with an idealized trailing-stratiform MCS will descend toward the surface. These controls will be analyzed by altering vertical wind profiles within idealized MCS simulations. From these sensitivity studies, it is our hope that new information can be gained on the main controls on RIJ descent and more generally the latter stages of MCS evolution. We hypothesize that for simulations with increased values of low-level shear, the RIJ will stay elevated longer. This is because the stronger low-level shear in addition to the RIJ, in theory, would be countered by a stronger cold pool and associated buoyancy-gradient-induced circulation at the leading edge, 6
14 acting to oppose the circulation induced by the cold pool, increasing the amount of buoyancy that can be realized (Weisman 1992). As the low-level shear is decreased, such as may be observed with the nocturnal veering and weakening of the low-level jet in the central United States (Bonner 1968; Coniglio et al. 2010), we hypothesize that the RIJ will be forced to descend towards the surface. Without the stronger shear acting along with the RIJ to counter the circulation along the leading edge of the cold pool, the cold pool buoyancy-induced circulation dominates and the RIJ descends towards the surface, further throwing the system out of balance (e.g., the optimal state). The rest of this paper is organized as follows. Section 2 describes the data and methods used to evaluate the research question and test the hypothesis stated above. Section 3 describes results and puts them into the context of previous work. Finally, section 4 synthesizes the results and provides ideas for future work. 2. Data and Methods All simulations in this study were run using the Cloud Model, version 1 (CM1; Bryan and Fritsch 2002). The domain size was 800 x 680 with 1 km horizontal grid spacing with doubly periodic lateral boundary conditions. There were 100 vertical levels, with vertical grid spacing ranging from 100 m near the surface to 400 m near the model top at 25 km and a Rayleigh damping zone within the top 5 km of the model. A free slip condition was applied to the surface and the Coriolis force was turned off. The Morrison double-moment scheme was used to parameterize microphysical processes. Convection was initialized using a 2 K warm bubble, added to the initial conditions, that had a 10 km radius in the x-y direction and a 1.4 km radius in the z-direction. The bubble was placed 150 km from the left edge of the domain in the x- direction, was centered in the y-direction, and was centered at an altitude of 2 km. The initial 7
15 base state thermodynamic sounding used was derived from Weisman and Klemp (1982) with a constant planetary boundary layer mixing ratio of 14 g kg -1 (Fig. 4). The vertical wind shear in the profile included 15 m s -1 of westerly shear over the lowest 2.5 km, increasing linearly from 0 m s -1 at the surface to 15 m s -1 from the west at 2.5 km above ground level, with constant 15 m s - 1 westerly winds above 2.5 km. Similar wind shear profiles were used in RKW, Weisman (1992), and Bryan and Rotunno (2014). To examine how vertical wind shear magnitude impacts RIJ descent, three simulations were run with varying amounts of wind shear. The first 3 h of all simulations are identical, as environmental modifications are only made beyond this time. Convection initiates 20 min into the simulation and grows upscale into a linear convective system through 1 h 30 min into the simulation (Figs. 5a,b). From 1 h 30 min through 3 h of the simulation, the linear convective system begins to resemble an archetypical trailing-stratiform MCS structure (Parker and Johnson 2000), with a leading line of convection and weaker convection behind the leading line, as its cold pool intensifies and interacts with the environmental shear (Figs. 5b,c). Weisman (1992) quantified the balance, or lack thereof, between the low-level line-normal environmental vertical wind shear (Δu), cold pool intensity (C or C j ), and the RIJ (Δu j ), as shown in the following equation. Other variables include: u % ",$, the magnitude of the u-wind at the height of the cold pool within the cold pool; and u % ",&, the magnitude of the u-wind at the surface within the cold pool. Δu % = C % u % %, C, where u % % %, u ",$ u ",& This equation relates the magnitude of the line-normal vertical wind shear and strength of the RIJ (if it has formed) to a metric for cold pool strength. A ratio is then formed by the following: Define: C, = C % u, % 8
16 The ratio becomes: C, u A ratio of one describes the optimal state presented in RKW. If the system is in an optimal state, then the horizontal vorticity associated with the cold pool exactly balances that of the RIJ and environmental vertical wind shear. A ratio greater than one is associated with a system that has upshear-tilted updrafts. In this case, the circulation produced by the cold pool dominates that produced by the environmental vertical wind shear and RIJ, tilting the updrafts along the leading line upshear over the cold pool. A ratio less than one is associated with a system with downshear-tilted updrafts. In this case, the circulations produced by the environmental vertical wind shear and RIJ overwhelms that produced by the cold pool, tilting the leading-line updrafts downshear. Attendant with this MCS at 3 h is a RIJ atop the system s cold pool, indicated by the faster westerly zonal wind below 4 km behind the leading line, and front-to-rear flow at even higher elevations as indicated by the white shading (Fig. 5d). The front-to-rear flow can be viewed as a prerequisite for the development of the rear-to-front flow of the RIJ beneath it, in the manner as described by RKW and summarized in Section 1 above. Both features illustrate that this idealized MCS is entering its mature state as rear-to-front flow is accelerated atop the cold pool. The resulting environment after 3 h was then altered to examine how temporally-varying low-level wind shear impacts RIJ development and evolution. This was done using a technique called base-state substitution (BSS; Letkewicz et al. 2013). BSS is a technique that allows a model to run for a specified duration with a homogeneous base-state environment before stopping execution, modifying the background environment, and restarting the simulation. BSS attempts to mimic a storm moving into a new environment without modifying storm- 9
17 environment gradient magnitudes and/or their associated circulations. This technique also allows a user to test how an identical storm will respond to, rather than develop in, different environments (Letkewicz et al. 2013). In implementing BSS within a model, Letkewicz et al. (2013) describe two ways that the environmental changes can be made: instantly or gradually. Instant BSS allows a storm to be immediately subjected to a new environment, meaning that in theory the evolving storm is a result of the environmental variation that was just made. It does this without slowly accumulating differences when a storm is gradually subjected to a new environment. The second option for employing BSS is gradual. Gradual BSS incorporates the new environmental profile over multiple frequent model restarts where only fractional environmental changes are added at each step. This type of BSS is most accurately used when simulating an observed environment where the actual near-storm tendencies are known (Letkewicz et al. 2013). Previous studies that have used BSS have primarily applied it to study supercell thunderstorms (Coffer and Parker 2015; Davenport and Parker 2015). Coffer and Parker (2015) studied the response in low-level supercell thunderstorm structures to changes in the 0 1 km, 0 3 km, and 0 6 km wind shear over time. This study employed gradual BSS, in which the model was stopped every 6 min over the course of an hour as shear changes were made at each restart. The shear changes in their study were drawn from ten vertical profiles that were linearly interpolated in time between three observed vertical profiles. Through this linear interpolation the magnitude of the vertical wind shear gradually increased over the simulation time (no changes to the vertical wind shear direction were made), with the precise magnitude increase depending on the case study and the associated inflow vertical profile. The supercell with larger environmental low-level shear was more organized and exhibited stronger vertical vorticity at 10
18 low levels as compared to its lower-shear counterpart. The results from this study imply that the low-level vertical wind shear magnitude is a useful tornado forecasting tool due to the strengthening of the associated mesocyclone as low-level shear magnitude increases (Coffer and Parker 2015). Davenport and Parker (2015) examined the effects that different thermodynamic and shear profiles have on the evolution of a supercell thunderstorm. In their study, gradual BSS was used to introduce soundings from two observed environments: one in which a supercell weakened and one in which a supercell dissipated. The environment was altered every 5 min over either a 35 min period to introduce the weakening environment sounding or 95 min period to introduce the dissipation environment sounding. To quantify the effects on the simulated supercell of how changing the wind profile, thermodynamic profile, or both in tandem, multiple experiments were conducted. Experiments included only changing the wind profile, only changing the thermodynamic profile, or changing both at the same time. By altering these environmental profiles, it was found that not only was storm evolution altered, but the mechanisms by which the storm was maintained also changed. For example, altering the environmental wind profile changed the buoyancy realized within the supercell s updraft and, therefore, the simulated supercell s lifecycle. Additionally, introducing low-level cooling resulted in quick supercell dissipation (Davenport and Parker 2015). However, generalizations from these two studies are difficult considering the high sensitivity of a supercell thunderstorm s response to changes in the environmental vertical wind shear and/or thermodynamic profiles. In addition to the instant versus gradual BSS applications, two different approaches can be used when applying BSS: selective and non-selective. Selective BSS excludes some part of the model domain, typically based on an environmental threshold, and does not alter the 11
19 environmental variables at those points. Instead, only the points that do not meet the specified environmental condition are changed. The chosen environmental condition is typically one that indicates the modification of the environment by the storm. Non-selective BSS changes the chosen environmental variables at all model grid points independent of any environmental conditions. Both Coffer and Parker (2015) and Davenport and Parker (2015) used the nonselective BSS application. The value in using two different BSS implementations is two-fold: it not only allows one to see how gradients between the system and the environment around it impact development, but it also allows for examination of how the results vary as a function of what the system itself directly feels, or experiences, as environmental modifications are made. One study that utilized both selective and non-selective BSS changes to the domain was Parker (2008). The main goal of this study was to determine the dynamics of the transition of a squall line from being surface-based to elevated as the environment becomes more stable due to the addition of low-level cooling. To do this, Parker (2008) utilized two techniques to artificially introduce low-level cooling: set the temperature at all grid points below 1 km AGL to the minimum between a defined reference temperature or the temperature of that grid point, akin to selective BSS, or decrease the temperature of all grid points below 1 km AGL regardless of their current temperature, akin to non-selective BSS. Low-level cooling was applied to one of three different soundings: a convection sounding (Weisman and Klemp 1982), the mean mid-latitude MCS sounding of Parker and Johnson (2004; PJ04), or an MCS sounding with a deeper moist layer from Parker and Johnson (2004; DEEP). When compared to selective BSS simulations, the non-selective BSS simulations, using the DEEP sounding, resulted in weaker updrafts and the system becoming elevated much more quickly. The PJ04 non-selective sounding simulations dissipated before the full simulation was complete, which was two full hours before the 12
20 corresponding selective BSS simulation (Parker 2008). Generally, the squall lines in the selective BSS simulations stronger and longer-lived than their non-selective counterparts. As stated previously, the main goal of this work was to determine the effects of changing low-level vertical wind shear on RIJ development and evolution with an idealized MCS. Gradual and selective BSS was used to make the wind shear modifications, where incremental modifications to the domain or environment were made every 1 min over the course of an hour. This gradual/select implementation was employed to mimic the strengthening and subsequent weakening and veering of the nocturnal low-level jet (LLJ), frequently associated with MCSs and their formation (Bonner 1968; Coniglio et al. 2010). In this study, three simulations were conducted to explore a portion of the vertical wind shear-related phase space of RIJ development and, in particular, subsequent evolution. This phase space explores the variations in the magnitude of low-level line-normal wind shear typically associated with variations in nocturnal LLJ intensity. The first simulation was termed the control simulation (CTL). In CTL, no environmental modifications to the shear profile were made, and the model was run for 8 h using the base-state sounding with no perturbations. In the remaining simulations, the low-level vertical wind shear magnitude within the vicinity of the idealized MCSs was altered by first (for all simulations) increasing the shear, to mimic the strengthening LLJ during the overnight hours, and then (in selected simulations) by decreasing the shear, to mimic the weakening LLJ toward the local morning hours. In one simulation, the km vertical wind shear magnitude was increased from 15 to 20 m s -1 over an hour starting 3 h into the simulation (hereafter INC). Environmental changes were made starting 3 h into the simulation to allow for the initial MCS and accompanying RIJ to develop and mature. In the other simulation, the vertical wind shear magnitude was increased from 15 to 20 m s -1 over an 13
21 hour starting 3 h into the simulation, as in INC, and then decreased to 5 m s -1 over an hour starting 5 h into the simulation (hereafter DEC5). The vertical wind shear magnitude was altered beginning 5 h into the simulation to allow for the simulated MCS to adjust to the vertical wind shear magnitude alterations made at earlier forecast times. For all simulations, environmental modifications were made using the selective BSS implementation. The selective BSS approach determined all points that had a non-negative perturbation potential temperature at the lowest model level, ultimately selecting the environment around the MCS, and applied the environmental shear alterations to the full vertical wind profiles at only those points. By not altering points with a negative perturbation potential temperature, convectively-overturned air associated with the simulated MCS s cold pool is effectively not changed. This approach left system-scale structures in place and therefore only altered the environment around the system, including gradients between the storm and its surrounding environment. As the simulations in this study only address a small subset of the shear phase-space, and only utilize selective BSS, future work incudes expanding the range of vertical wind shear magnitudes and directions considered as well as evaluating comparison simulations conducted using non-selective BSS. 3. Results As described above, a mature MCS with associated RIJ formed and intensified in all three simulations within the first 3 h. As environmental vertical wind shear changes were made to two of the simulations, the evolution of the system as a whole and, more specifically, the RIJ was altered. These sensitivities of the simulated MCS and associated RIJ to the environmental wind shear are explored in the following. a. Initial response to increased low-level line-normal vertical wind shear magnitude 14
22 Between hours 3 and 5, both INC and DEC5 simulations were identical since the same magnitude of vertical wind shear was added to each simulation between 3 4 h. Thus, for the rest of this section, only results from INC are presented. The vertical wind shear magnitude in INC and DEC5 were increased by m s -1 (over the km layer) every 1 min from 3 to 4 h. Therefore, by 4 h the vertical wind shear magnitude over the lowest 2.5 km in these simulations was 20 m s -1. The INC simulation was compared to the CTL simulation because the CTL simulation provided a benchmark to which the sensitivity simulations could be compared. The CTL simulation maintained 15 m s -1 of environmental shear over the entire simulation time. Fig. 6 shows the simulated composite reflectivity for both CTL and INC from 3 h 30 min to 4 h 30 min. For all times considered, the MCS in INC was more organized than its CTL counterpart. For example, at 4 h 30 min the leading line in CTL was marked by individual convective cells which extended symmetrically from the MCS s central axis, whereas in INC a contiguous leading line existed, resembling a stronger linear system (Figs. 6e,f). When comparing vertical cross sections of the u-component of the wind at 4 h, both the CTL and INC simulations were qualitatively similar (Fig. 7a,b). Subtle quantitative differences in the u and w-components of the wind between the CTL and INC simulations are evident in Fig. 7c. First, the environmental wind profile modifications ahead of the simulated MCS are evident, as illustrated by the area of positive u-wind shading indicative of the larger vertical wind shear magnitudes in INC. Secondly, the RIJ in INC was generally stronger and at higher altitudes than in CTL. Both simulated RIJs were elevated above the surface, as the environmental vertical wind shear could effectively balance the strength of the cold pool (Fig. 7). The stronger, more elevated RIJ in INC can be explained by three mechanisms. First, the region of negative perturbation pressure in INC was deeper, and of a greater magnitude than that in CTL (Fig. 8). This deeper 15
23 negative pressure perturbation, and the implied perturbation pressure gradient force produced between it and the near zero pressure perturbation behind it in INC would result in larger frontto-rear acceleration atop the cold pool over a deeper layer than in CTL, meaning that the stronger RIJ would be more elevated over the surface in INC (Figs. 7 9). Secondly, the cold pool depth is greater in INC than CTL, particularly behind the cold pool s leading edge (Fig. 9). This results in a greater vertical extent to the horizontal vorticity circulation on the back edge of the cold pool, elevating the height at which it acts in concert with the front-to-rear ascending flow to result in a more elevated RIJ. Thirdly, the deeper cold pool in INC leads to an increased altitude at which the horizontal vorticity circulations with the cold pool and front-to-rear flow are located, also promoting a more elevated RIJ. At 4 h, the perturbation potential temperature fields in both simulations were very similar in overall structure but slightly differed in intensity (Fig. 9a,b). As noted above, the cold pool in the INC simulations was not only stronger at the back edge of the cold pool, but also immediately behind the leading edge of the system, as illustrated by the negative differences within 10 km rearward of the leading edge (Fig. 9c). A filament of positive potential temperature difference between the simulations extending from km AGL through 10 km AGL was colocated with the leading line (Fig. 9c). Higher potential temperature in this region in the INC simulations may indicate a stronger, more upright updraft. This may be because the deeper cold pool in the increased shear simulations could in effect allow for deeper lifting right along the leading edge, due to the better balance between cold pool lifting and environmental shear/rij lifting, and in effect could realize more buoyancy within the environment (e.g., less negatively affected by entrainment). The higher perturbation potential temperatures within the updraft and 16
24 stronger cold pool in INC implies that as more buoyancy is realized, greater hydrometeor production occurs and strengthens and deepens the cold pool relative to CTL. b. Continued response to increased vertical wind shear magnitude (t = 4 5 h) Through 5 h, both the INC and DEC5 simulations remain identical. Thus, for simplicity, only the results from INC are compared to CTL. The increased shear simulations are stronger than the CTL simulation at 5 h (Fig. 10). The stronger line-normal component of the vertical wind shear along the quasi-zonally-oriented ends of the bowing leading-line in INC lead to a more expansive system through enhanced lifting promoting convective redevelopment in those regions as compared to in CTL (Fig. 10). Fig. 11a,b shows the magnitude of the u-component of the wind at 5 h for CTL and INC. The stronger shear within INC could help to explain why the RIJ in the increased shear simulations was stronger and more elevated above ground-level as compared to the CTL simulation (Fig. 11). Looking at the stronger shear in conjunction with perturbation potential temperatures, yields the same result as one-hour prior, where there is deeper lifting right along the leading edge of the cold pool in the increased shear simulations as compared to the weaker shear and shallower cold pool dichotomy in the CTL simulation (Figs. 11, 12). Quantifying the balance of each system shows that the increased shear simulations have a balance criteria equal to 1.15, and the CTL simulations balance is equal to Although the CTL is closer to optimal balance than is the increased shear simulation, the deeper cold pool in INC could help to result in a more upright leading edge given a vertical wind shear depth of 2.5 km (i.e., approximately ¾ of the cold pool depth; see also Bryan and Rotunno 2014), rather than the wave break-like structure in CTL. 17
25 The more elevated nature of the RIJ associated with the increased shear simulations can also be explained by examining perturbation pressure fields (Fig. 13). Both simulations have similar depths of negative perturbation pressure above the positive cold pool perturbation pressure, but the increased shear simulation has larger positive pressure perturbation within the cold pool (Fig. 13). The stronger positive pressure perturbation could result from a stronger cold pool as the perturbation pressure is proportional to -db/dz (with buoyancy, B, used as a measure of cold pool strength), given that this gradient is stronger in the stronger cold pool. An implied stronger upward-directed perturbation pressure gradient force from the positive pressure perturbation within the cold pool to the negative pressure perturbation directly above it, can more effectively elevate the RIJ in the increased shear simulations as compared to CTL (Fig. 13). The other causes for the elevation of the RIJ are the same as described in subsection (a). The expectation of more upright updrafts in the increased shear simulations are supported by the higher perturbation potential temperature in those simulations in the updraft region, in addition to within a region of secondary lift ~15 km rearward of the leading line (Fig. 12). More upright updrafts allow parcels to realize more buoyancy throughout the profile as compared to updrafts that have tilted over the cold pool. This is illustrated within the stronger updrafts in the increased shear simulations as well as in addition to the much warmer perturbation potential temperatures in the front-to-rear flow aloft behind the leading edge in the increased shear simulations as compared to CTL, both of which imply that the increased shear simulations have greater realized buoyancy (Fig. 12). c. Initial response to reduced vertical wind shear magnitude (t = h) Beyond 5 h, the INC and DEC5 simulations no longer have identical environmental lowlevel vertical wind shear profiles. The km vertical wind shear magnitudes at 5.5 h for the 18
26 INC, CTL, and DEC5 simulations are 20, 15, and m s -1 respectively, as the vertical wind shear magnitude in DEC5 was decreased by 0.25 m s -1 every 1 min. At this time, differences between the INC and DEC5 simulation are difficult to identify within the composite reflectivity field (Fig. 10e,f), and each are still considerably stronger and of greater spatial extent than the CTL simulation. The RIJs in both INC and DEC5 are more elevated, and are associated with faster wind speeds, as compared to the simulated RIJ in CTL (Fig. 14a-c). The rear-to-front flow within the cold pool is stronger in CTL than in INC or DEC5 right near to the surface, as indicated by the region of negative shading below 1 km AGL (Fig. 14d,e). The descent of the CTL RIJ toward the surface more than the INC RIJ can be explained using the balance condition, which is closest to one for INC (1.26 compared to 1.53 for CTL). The balance condition in DEC5 was 1.92 meaning that the MCS in DEC5 is starting to become unbalanced. The fact that the CTL simulation is in better balance than DEC5, but has a more descended RIJ may be because the cold pool associated with the CTL system is shallower and weaker in magnitude along the surface than DEC5 (Fig. 15a-e). The weaker cold pool in addition to the weaker positive pressure perturbations within that cold pool do not allow for as high of an elevation of the RIJ above the surface in CTL (Figs. 14,15). Finally, as was seen 30 min prior, there is warmer perturbation potential temperature along the leading edge in INC and DEC5 relative to CTL, possibly associated with stronger leading-line lifting and therefore more positively-buoyant parcels in the updraft region (Fig. 15d,e). Comparing INC and DEC5 clearly shows the stronger environmental shear within the INC simulation by the large region of positive wind differences ahead of the leading line (Fig. 14f). INC has a much stronger updraft around km AGL as compared to DEC5. As the 19
27 DEC5 system becomes more unbalanced, the updrafts associated with the MCS begin to tilt upshear, weaken, and become located increasingly rearward of the cold pool s leading edge, whereas the updrafts associated with the INC system are more upright (Figs. 14f, 15f). The INC simulation also has warmer perturbation potential temperatures in this same region when compared to DEC5 (Fig. 15f). As discussed in the previous paragraph, the DEC5 simulation is quickly becoming unbalanced and therefore its updrafts begin to tilt upshear, and in theory are not able to release as much buoyancy as a more upright updraft could. The better balance between the cold pool, RIJ, and environment in INC, in addition to the deeper cold pool at the leading edge of the system that better balances the environmental vertical wind shear depth, allow for more upright lifting along the leading edge (Fig. 15f). The overall weakening and unbalance of the DEC5 MCS can be attributed to a weakening of the perturbation pressure gradient associated with the system (Fig. 16c). The weakening of the perturbation pressure gradient is presumably due to weakened lifting which leads to reduced realized buoyancy, weakened rear inflow and in turn furthered weakened lifting. This positive feedback cycle reduces forcing for rear-to-front accelerations (characterizing the RIJ), over time, which acts to throw the whole system out of balance. d. Continued response to reduced line-normal vertical wind shear magnitude (t 6 h) At 6 h, the last environmental wind profile modifications are made. Once the changes are integrated forward in time, the environmental km vertical wind shear magnitude in all simulations ranges from 5 m s -1 in DEC5 to 15 m s -1 in CTL and 20 m s -1 in INC. At this time, the DEC5 MCS is clearly outflow-dominant, as illustrated by the numerous isolated but comparatively weak convective cells that have formed along the leading line (Fig. 17c). The CTL MCS (Fig. 17a) still exhibits a reasonable balance between the shear, cold pool, and jet to 20
28 keep the system from being outflow dominant and for the cold pool to spread outward, with a balance condition value of By contrast, that for DEC5 is 4.79 at this time. As with 30 min prior, the INC system (Fig. 17b) has the best balance with a value of The simulations with greater shear still have appreciable ground-level ambient flow opposing the cold pool s motion to keep it from spreading out and leading to an outflow-dominant system with weak lifting along its leading edge. The effect on the RIJ of the decreased environmental vertical wind shear can be seen in Fig. 18. Relative RIJ strength ranged from 39 m s -1 in INC to 31 m s -1 in DEC5 (Fig. 18b,c). The RIJ associated with DEC5 has also descended to where it is intersecting the surface along and behind the leading line (Fig. 18c), as associated with a significant reduction in cold pool depth (but not intensity; Fig. 19c) and weakening of the perturbation pressure gradient (Fig. 20c). The INC simulation had a stronger horizontal perturbation pressure gradient than CTL atop the cold pool (Fig. 20a,b), promoting a faster RIJ. The DEC5 simulation had faster zonal velocity right along the leading edge of the system, when compared to both INC and CTL, possibly indicative of the rush of air associated with the gust front with DEC5 (Fig. 18e,f). The weaker environmental vertical wind shear in DEC5 could not balance the circulation produced by the cold pool as easily and therefore updrafts tilt upshear, the RIJ descends towards the surface, and the system itself becomes weaker (Fig. 18). At this time, the CTL simulation exhibited the deepest region of negative perturbation potential temperature (indicative of the cold pool) as compared to both INC and DEC5, which had more expansive but shallower cold pools (Fig. 19a-c). The larger lateral extent of the cold pools in INC and DEC5 can be seen in the large region of negative perturbation potential temperatures extending behind grid-point ~540 (Fig. 19d,e). Finally, the comparison between 21
29 INC and DEC5 shows that the INC system has a stronger, more upright updraft than the DEC5 system, as the latter was becoming unbalanced and outflow-dominant very quickly (Fig. 19f). 4. Discussion and Future Work This study showed that the magnitude of the environmental wind shear has a significant effect on the lifecycle of simulated MCSs and their RIJs. Simulations in which the wind shear was increased exhibited a stronger, more elevated RIJ. The more elevated RIJ results from three main mechanisms posed in the results. First, the better balance between the environmental vertical wind shear, cold pool strength, and RIJ lead to stronger perturbation pressure gradients. The stronger perturbation pressure gradients lead to a stronger RIJ, associated with stronger realized buoyancy by leading-line updrafts, or equivalently, stronger horizontal vorticity circulations associated with stronger ascending front-to-rear flow and a stronger cold pool. As the environmental vertical wind shear was decreased, the initially-elevated RIJ weakened substantially and descended towards the surface. Without the stronger environmental vertical wind shear to maintain system balance, the MCS quickly started to become outflow-dominant as the buoyancy-driven circulation along the cold pool s leading edge of the cold pool dominated and resulted in its downstream acceleration. The unbalanced system resulted in upshear-tilted updrafts that could no longer realize as much buoyancy as their upright counterparts, resulting in an overall weakening of new convective development along the leading line. The juxtaposition of the increased shear case and the decreased shear case matches that within the idealized schematics presented in Weisman (1992; his Fig. 15) for the elevated and descending rear inflow jet cases, respectively. The relative lack of significant differences between CTL and INC as compared to those seen in DEC5 is possibly due to the fact that the CTL and INC simulations are very close in 22
30 structure and environmental characteristics. The CTL and INC simulations at t > 5 h fall either within or just below the optimal shear range as described in Weisman et al. (1988), resulting in quasi-balanced systems, whereas the DEC5 simulation falls well outside of this range, resulting in an entirely different structure. For example, both CTL and INC exhibit a deeper cold pool (beyond 5 h), more elevated RIJ, and more balanced system overall when compared to DEC5. The relative magnitude of the vertical wind shear in comparison to the strength of each systems cold pool in CTL and INC is sufficient to keep the system in balance. Although the cold pool in CTL is weaker than INC, the shear is also weaker which allows for comparable system balance. As the shear in the DEC5 simulation was increased, as in INC, the stronger shear allowed for better balance and therefore possibly more hydrometeor fallout into the cold pool. The larger number of hydrometeors in turn aid to strengthen the cold pool. As the environmental shear is later decreased in the DEC5 simulation, the still-intense cold pool quickly overwhelms the environment, throwing the system out of balance, leading to a weakening and descent of the RIJ. The present study represents only a portion of the environmental variability that must be considered to fully understand environmental controls on RIJ descent. Many simplifications have been made within the numerical model to help elucidate the salient dynamics of RIJ descent. Future work should seek to extend the results by considering a non-zero Coriolis force, non-zero friction, and horizontally-heterogeneous base state (e.g., either with small random perturbations to the initial conditions or using real-data case studies) to see how including more complexity into the model implementation would impact the results. The perturbation pressure analyses shown in this study are computed from the base state. To more fully diagnose system-level responses to the changing environmental wind shear this perturbation pressure field should be decomposed into its buoyant and dynamical components. Only a limited range of vertical wind 23
31 shear magnitudes, and only unidirectional vertical wind shear over the km layer, have been tested in this study. Future work should include testing a wider range of vertical wind shear magnitudes, depths, and directions. This will ensure the realistic simulation of the wide range of possible variations of the LLJ and related attributes of the ambient environments in which observed MCSs form and evolve. Further, thermodynamic profile variations were not addressed in this study, including those associated with using different base-state soundings and, in a BSS context, those associated with the transition to nighttime and accompanied increasing boundary layer stability. Completing simulations where low-level cooling is added (as in Parker 2008), for example, and/or conducting simulations in which both thermodynamic and vertical wind shear profiles are changed could allow for greater generalization of the results. Finally, future work should include altering how BSS is implemented, including select versus non-select BSS. Both implementations have been used in previous literature, but only Parker (2008) has compared the structure and morphology differences of squall lines when using each implementation. Preliminary tests using non-select BSS for the cases considered herein indicate similar, but more rapid, MCS evolution in the face of both increased and decreased vertical wind shear magnitude. Additional simulations and more comprehensive analysis should be undertaken to better understand how BSS impacts simulated MCS evolution and, potentially, what exactly a storm system feels as the environment around and/or within it changes. 24
. From Houze et al. (1989; their Fig.")
32 5. Figures Figure 1: Conceptual model of a squall line with a trailing stratiform area viewed in a vertical cross section oriented perpendicular to the convective line (i.e., parallel to its motion). From Houze et al. (1989; their Fig. 1). 25
33 P > 0 P < 0 Figure 2: Conceptual model of RIJ formation. Both arguments described within the text are shown here: pressure perturbation and circulation arguments. 26

34 Figure 3: A conceptual model of the mature structure of a long-lived squall-line-type convective system for (a) a system with an initially descending rear-inflow jet and (b) a system with an initially elevated rear-inflow jet. The updraft current is denoted by the thick, double-lined flow vector, while the rear-inflow current is denoted by the thick, dashed flow vector. The shading denotes the surface cold pool. The thin, circular arrows depict the most significant sources of horizontal vorticity, which are either associated with the ambient shear or which are generated within the convective system, as described in the text. Regions of lighter or heavier rainfall are indicated by the more sparsely or densely packed vertical lines, respectively. The scalloped line denotes the outline of the cloud. From Weisman (1992; their Fig. 23). 27
.")
35 Figure 4: Skew T diagram depicting temperature and moisture profile used in model experiments (heavy solid lines). Heavy dashed line represents a parcel ascent from the surface based on a surface mixing ratio q vo = 14 g kg -1 (used in the current study as initial condition). Heavy dotted lines represent similar parcel ascents for q vo = 11 g kg -1 and q vo = 16 g kg -1. Tilted solid lines are isotherms, short dashed lines are dry adiabats, and long dashed lines are moist adiabats. From Weisman and Klemp (1982; their Fig. 1). 28
 for the simulated MCS at (a) 30 min, (b) 1 h 30 min, and (c) 3 h into the simulation.")
36 a. 30 min b. 1 h 30 min c. 3 h d. 3 h Figure 5: Composite reflectivity (dbz; shaded) for the simulated MCS at (a) 30 min, (b) 1 h 30 min, and (c) 3 h into the simulation. (d) The u-component of the wind (m s -1 ; shaded), and the u and w-components of the wind (kt; barbs; w-component scaled by *10) at 3 h into the simulation. 29
 for the CTL simulation (left), and the INC simulation (right) at (a, b) 3 h 30 min, (c, d) 4 h, and (e,")
37 a. 3 h 30 min d. 3 h 30 min b. 4 h e. 4 h c. 4 h 30 min f. 4 h 30 min Figure 6: Composite reflectivity and the 2.5 km wind (kt; barbs) for the CTL simulation (left), and the INC simulation (right) at (a, b) 3 h 30 min, (c, d) 4 h, and (e, f) 4 h 30 min. 30
, and")
, for (a) CTL, (b) INC, and (c)")

38 a. b. c. Figure 7: t = 4 h. Cross-section of the u-component of the wind (m/s, shaded), and stormrelative u and w-components of the wind (kt; barbs; w-component scaled by *10), for (a) CTL, (b) INC, and (c) Difference between INC and CTL. The grid of CTL was shifted so that the simulated leading lines were in the same location and differences are exclusively due to system structure and not position. 31

39 a. b. c. Figure 8: As in Fig. 7, except pressure perturbation from the initial state (Pa, shaded). 32


40 a. b. c. Figure 9: As in Fig. 7, except potential temperature perturbation from the initial state (K, shaded). 33
")
 at t = 5 h for (a) CTL, (b) INC,")
41 a. 5 h d. 5 h 30 min b. 5 h e. 5 h 30 min c. 5 h f. 5 h 30 min Figure 10: Composite reflectivity (shaded, dbz) and 2.5 km winds (barbs, kt) at t = 5 h for (a) CTL, (b) INC, and (c) DEC5, (d-f) as in (a-c), except at t = 5 h 30 min. 34


42 a. b. c. Figure 11: As in Fig. 7, except at t = 5 h. 35


43 a. b. c. Figure 12: As in Fig. 9, except at t = 5 h. 36


44 a. b. c. Figure 13: As in Fig. 8, except at t = 5 h. 37

, and")
.")
 Difference between INC and")
 Difference")

45 a. d. b. e. c. f. Figure 14: t = 5.5 h. Cross-section of the u-component of the wind (m/s, shaded), and stormrelative u and w-components of the wind (kt, barbs). (a) CTL, (b) INC and (c) DEC5. (d) Difference between INC and CTL, (e) Difference between DEC5 and CTL, and (f) Difference between INC and DEC5. For all plots, the grids were shifted so that the leading lines were in the same location. 38


46 a. d. b. e. c. f. Figure 15: As in Fig. 14, except potential temperature perturbation from the initial state (K, shaded). 39


47 a. d. b. e. c. f. Figure 16: As in Fig. 14, except pressure perturbation from the initial state (Pa, shaded). 40


 at t =")
 DEC5, (d-f) as in (a-c),")
48 a. 6 h d. 6 h 30 min b. 6 h e. 6 h 30 min c. 6 h f. 6 h 30 min Figure 17: Composite reflectivity (shaded, dbz) and 2.5 km winds (barbs, kt) at t = 6 h for (a) CTL, (b) INC, and (c) DEC5, (d-f) as in (a-c), except at t = 6 h 30 min. 41


49 a. d. b. e. c. f. Figure 18: As in Fig. 14, except at t = 6 h. 42


50 a. d. b. e. c. f. Figure 19: As in Fig. 15, except at t = 6 h. 43


51 a. d. b. e. c. f. Figure 20: As in Fig. 16, except at t = 6 h. 44
Chapter 3 Convective Dynamics 3.4. Bright Bands, Bow Echoes and Mesoscale Convective Complexes
 Chapter 3 Convective Dynamics 3.4. Bright Bands, Bow Echoes and Mesoscale Convective Complexes Photographs Todd Lindley Bright band associated with stratiform precipitation in a squall line system 1 Bright
Meteorology Lecture 18
 Meteorology Lecture 18 Robert Fovell rfovell@albany.edu 1 Important notes These slides show some figures and videos prepared by Robert G. Fovell (RGF) for his Meteorology course, published by The Great
A more detailed and quantitative consideration of organized convection: Part I Cold pool dynamics and the formation of squall lines
 A more detailed and quantitative consideration of organized convection: Part I Cold pool dynamics and the formation of squall lines Note: Lecture notes presented here based on course Daily Weather Laboratory
Chapter 14 Thunderstorm Fundamentals
 Chapter overview: Thunderstorm appearance Thunderstorm cells and evolution Thunderstorm types and organization o Single cell thunderstorms o Multicell thunderstorms o Orographic thunderstorms o Severe
Evolution and Maintenance of the June 2003 Nocturnal Convection
 Evolution and Maintenance of the 22-23 June 2003 Nocturnal Convection Jerilyn Billings NOAA/NWS Wichita, KS August 6 th, 2011 Work Completed at North Carolina State University for MS Thesis During the
Shear-Parallel Mesoscale Convective Systems in a Moist Low- Inhibition Mei-Yu Front Environment. Liu and Moncrieff (2017 JAS)
") Shear-Parallel Mesoscale Convective Systems in a Moist Low- Inhibition Mei-Yu Front Environment Liu and Moncrieff (2017 JAS) Introduction Balance of lower-tropospheric wind shear and strength of evaporation-generated
Shear-Parallel Mesoscale Convective Systems in a Moist Low- Inhibition Mei-Yu Front Environment Liu and Moncrieff (2017 JAS) Introduction Balance of lower-tropospheric wind shear and strength of evaporation-generated
SIMULATED EFFECTS OF AN ISOLATED SUPERCELL ON THE EVOLUTION OF A NEARBY SQUALL LINE
 5.55 SIMULATED EFFECTS OF AN ISOLATED SUPERCELL ON THE EVOLUTION OF A NEARBY SQUALL LINE Jacey Wipf* and Adam French South Dakota School of Mines and Technology 1. INTRODUCTION 2. METHODOLOGY Operational
Chapter 3 Convective Dynamics Part V ñ Bright Bands, Bow Echoes and MCCs. Bright band associated with stratiform precipitation in a squall line system
 Chapter 3 Convective Dynamics Part V ñ Bright Bands, Bow Echoes and MCCs Photographs Todd Lindley (This part contains materials taken from UCAR MCS training module) Bright band associated with stratiform
P1.16 ADIABATIC LAPSE RATES IN TORNADIC ENVIRONMENTS
 P1.16 ADIABATIC LAPSE RATES IN TORNADIC ENVIRONMENTS Matthew D. Parker Convective Storms Group, The Mesoscale Nexus in Atmospheric Sciences North Carolina State University, Raleigh, North Carolina 1. INTRODUCTION
1 of 7 Thunderstorm Notes by Paul Sirvatka College of DuPage Meteorology. Thunderstorms
 1 of 7 Thunderstorm Notes by Paul Sirvatka College of DuPage Meteorology Thunderstorms There are three types of thunderstorms: single-cell (or air mass) multicell (cluster or squall line) supercell Although
9D.3 THE INFLUENCE OF VERTICAL WIND SHEAR ON DEEP CONVECTION IN THE TROPICS
 9D.3 THE INFLUENCE OF VERTICAL WIND SHEAR ON DEEP CONVECTION IN THE TROPICS Ulrike Wissmeier, Robert Goler University of Munich, Germany 1 Introduction One does not associate severe storms with the tropics
Charles A. Doswell III, Harold E. Brooks, and Robert A. Maddox
 Charles A. Doswell III, Harold E. Brooks, and Robert A. Maddox Flash floods account for the greatest number of fatalities among convective storm-related events but it still remains difficult to forecast
Convective Dynamics. Jeremy A. Gibbs. March 10, University of Oklahoma
 Convective Dynamics Jeremy A. Gibbs University of Oklahoma gibbz@ou.edu March 10, 2015 1 / 66 Overview Multicellular Storms Intro Lifecycle Thunderstorm Outflow as a Density Current Cell Regeneration 2
Mesoscale Convective Systems. The COMET Program March 2002
 Mesoscale Convective Systems The COMET Program March 2002 Overview! Introduction to MCSs! Squall Lines! Bow Echoes! Mesoscale Convective Complexes Introduction Definition! Mesoscale convective systems
Numerical Simulations of Bow Echo Formation Following a Squall Line Supercell Merger
 DECEMBER 2014 F R E N C H A N D P A R K E R 4791 Numerical Simulations of Bow Echo Formation Following a Squall Line Supercell Merger ADAM J. FRENCH Atmospheric and Environmental Sciences, South Dakota
2.2 Sounding composite construction. 2.3 Vertical velocity retrieval
 7.1 DROPSONDE DERIVED STRUCTURE OF MESOSCALE CONVECTIVE SYSTEMS OBSERVED DURING BAMEX James Correia Jr and R. W. Arritt ; Dept. of Agronomy, Iowa State University, Ames, IA 1. Introduction The Bow echo
12.2 MESOVORTICES FORMED WITHIN BOW ECHOES: THEIR GENESIS AND SENSITIVITY TO THE ENVIRONMENT AND SYSTEM COLD POOL
 12.2 MESOVORTICES FORMED WITHIN BOW ECHOES: THEIR GENESIS AND SENSITIVITY TO THE ENVIRONMENT AND SYSTEM COLD POOL Nolan T. Atkins and Mike St. Laurent Lyndon State College, Lyndonville, Vermont 1. INTRODUCTION
Effects of Upper-Level Shear on the Structure and Maintenance of Strong Quasi-Linear Mesoscale Convective Systems
 APRIL 2006 C O N I G L I O E T A L. 1231 Effects of Upper-Level Shear on the Structure and Maintenance of Strong Quasi-Linear Mesoscale Convective Systems MICHAEL C. CONIGLIO, DAVID J. STENSRUD, AND LOUIS
1 August 2006 An Investigation of a Bow Echo along the Wasatch Front. Randy Graham and Chris Gibson 6 April 2007
 1 August 2006 An Investigation of a Bow Echo along the Wasatch Front Randy Graham and Chris Gibson 6 April 2007 Overview Environment review Review of terrain-induced discrete propagation Bow Echo interactions
10/21/2012. Chapter 10 Thunderstorms. Part II. Growth and Development of ordinary Cell Thunderstorms Thunderstorm Electrification.
 Chapter 10 Thunderstorms Part I Growth and Development of ordinary Cell Thunderstorms Thunderstorm Electrification Tornadoes Part II Simplified model depicting the life cycle of an ordinary thunderstorm
The Influence of Convective Thermal Forcing on the Three-Dimensional Circulation around Squall Lines
 29 The Influence of Convective Thermal Forcing on the Three-Dimensional Circulation around Squall Lines RAJUL E. PANDYA* National Center for Atmospheric Research, Boulder, Colorado DALE R. DURRAN Department
Chapter 8 cont. Clouds and Storms. Spring 2018
 Chapter 8 cont. Clouds and Storms Spring 2018 Clouds and Storms Clouds cover ~ 50% of earth at any time. Clouds are linked to a number of condensation processes. Cloud morphology, cloud types, associated
Chapter 3 Convective Dynamics Part VI. Supercell Storms. Supercell Photos
 Chapter 3 Convective Dynamics Part VI. Supercell Storms Photographs Todd Lindley (This part contains materials taken from UCAR MCS training module) Supercell Photos 1 Introduction A supercel storm is defined
11A.2 Forecasting Short Term Convective Mode And Evolution For Severe Storms Initiated Along Synoptic Boundaries
 11A.2 Forecasting Short Term Convective Mode And Evolution For Severe Storms Initiated Along Synoptic Boundaries Greg L. Dial and Jonathan P. Racy Storm Prediction Center, Norman, Oklahoma 1. Introduction
Adam J. French and Matthew D. Parker North Carolina State University, Raleigh, North Carolina
 3.3 THE RESPONSE OF SIMULATED NOCTURNAL CONVECTIVE SYSTEMS TO A LOW-LEVEL JET Adam J. French and Matthew D. Parker North Carolina State University, Raleigh, North Carolina 1. INTRODUCTION Warm season precipitation
Weather Systems III: Thunderstorms and Twisters
 Weather Systems III: Thunderstorms and Twisters Review 1. Definition of airmasses? Bergeron classification of air masses 2. Surface weather analysis: Station model, wind speed code, present weather 3.
Tornadogenesis in Supercells: The Three Main Ingredients. Ted Funk
 Tornadogenesis in Supercells: The Three Main Ingredients Ted Funk NWS Louisville, KY Spring 2002 Environmental Parameters Supercells occur within environments exhibiting several wellknown characteristics
Impact of Graupel Parameterization Schemes on Idealized Bow Echo Simulations
 APRIL 2013 A D A M S-S E L I N E T A L. 1241 Impact of Graupel Parameterization Schemes on Idealized Bow Echo Simulations REBECCA D. ADAMS-SELIN Atmospheric and Environmental Research, Inc., Lexington,
Thunderstorm: a cumulonimbus cloud or collection of cumulonimbus clouds featuring vigorous updrafts, precipitation and lightning
 Thunderstorm: a cumulonimbus cloud or collection of cumulonimbus clouds featuring vigorous updrafts, precipitation and lightning Thunderstorm: a cumulonimbus cloud or collection of cumulonimbus clouds
A Numerical Investigation of the Effects of Dry Air Aloft on Deep Convection
 140 M O N T H L Y W E A T H E R R E V I E W VOLUME 138 A Numerical Investigation of the Effects of Dry Air Aloft on Deep Convection RICHARD P. JAMES AND PAUL M. MARKOWSKI Department of Meteorology, The
OBSERVATIONS OF COLD POOL PROPERTIES IN MESOSCALE CONVECTIVE SYSTEMS DURING BAMEX
 JP5J.12 OBSERVATIONS OF COLD POOL PROPERTIES IN MESOSCALE CONVECTIVE SYSTEMS DURING BAMEX George Bryan, David Ahijevych, Christopher Davis, Stanley Trier, and Morris Weisman National Center for Atmospheric
Some heavy precipitation issues. AOS C115/C228 Fall 2014
 Some heavy precipitation issues AOS C115/C228 Fall 2014 1 Heavy precipitation at a location = intensity x longevity 2 Common sources of heavy precipitation in U.S. Mesoscale convective systems and vortices
Thunderstorm: a cumulonimbus cloud or collection of cumulonimbus clouds featuring vigorous updrafts, precipitation and lightning
 Thunderstorm: a cumulonimbus cloud or collection of cumulonimbus clouds featuring vigorous updrafts, precipitation and lightning Thunderstorms are responsible for most of what we refer to as severe weather,
Part. I Introduction. Part II Scale Characteristics and Climatology of MCSs
 Talking points for MCS teletraining session Part. I Introduction Slide 1 Slides 2-3 Title Objectives Part II Scale Characteristics and Climatology of MCSs Slides 4-5 Climatology of mesoscale convective
Investigating the Environment of the Indiana and Ohio Tornado Outbreak of 24 August 2016 Using a WRF Model Simulation 1.
 Investigating the Environment of the Indiana and Ohio Tornado Outbreak of 24 August 2016 Using a WRF Model Simulation Kevin Gray and Jeffrey Frame Department of Atmospheric Sciences, University of Illinois
Chapter 8 cont. Clouds and Storms
 Chapter 8 cont. Clouds and Storms Spring 2007 Clouds and Storms Clouds cover ~ 50% of earth at any time. Clouds are linked to a number of condensation processes. Cloud morphology, cloud types, associated
Hurricanes are intense vortical (rotational) storms that develop over the tropical oceans in regions of very warm surface water.
 storms that develop over the tropical oceans in regions of very warm surface water.") Hurricanes: Observations and Dynamics Houze Section 10.1. Holton Section 9.7. Emanuel, K. A., 1988: Toward a general theory of hurricanes. American Scientist, 76, 371-379 (web link). http://ww2010.atmos.uiuc.edu/(gh)/guides/mtr/hurr/home.rxml
Hurricanes: Observations and Dynamics Houze Section 10.1. Holton Section 9.7. Emanuel, K. A., 1988: Toward a general theory of hurricanes. American Scientist, 76, 371-379 (web link). http://ww2010.atmos.uiuc.edu/(gh)/guides/mtr/hurr/home.rxml
Advanced Spotter Training Lesson 4: The Nature of Thunderstorms
 Advanced Spotter Training 2009 Lesson 4: The Nature of Thunderstorms From Last Time We discussed the different ways to make air rise. We discussed convection, convergence, and the different kinds of fronts.
Observations of a squall line and its near environment using high-frequency. rawinsonde launches during VORTEX2. George H. Bryan
 Observations of a squall line and its near environment using high-frequency rawinsonde launches during VORTEX2 George H. Bryan National Center for Atmospheric Research, 1 Boulder, Colorado and Matthew
MET Lecture 26 Tornadoes I
 MET 4300 Lecture 26 Tornadoes I A Large Tornado approaches Lyndon, Kansas, on May 8, 2003 Outline Definition, life cycle Tornado formation within supercells Tornado formation within nonsupercell thunderstorms
Large-Eddy Simulations of Tropical Convective Systems, the Boundary Layer, and Upper Ocean Coupling
 DISTRIBUTION STATEMENT A. Approved for public release; distribution is unlimited. Large-Eddy Simulations of Tropical Convective Systems, the Boundary Layer, and Upper Ocean Coupling Eric D. Skyllingstad
Mesoscale Convective Complexes (or Systems)
") Mesoscale Convective Complexes (or Systems) What is an MCC Mesoscale Convectiv Complexes (MCCs) are organized clusters of storms that have to meet some size and shape criteria: * -32C IR temp > 100,000
Mesoscale Convective Complexes (or Systems) What is an MCC Mesoscale Convectiv Complexes (MCCs) are organized clusters of storms that have to meet some size and shape criteria: * -32C IR temp > 100,000
Convective Structures in a Simulated Torrential-Rain-Producing Mesoscale Convective System in East China. Jordan Foley
 Convective Structures in a Simulated Torrential-Rain-Producing Mesoscale Convective System in East China Jordan Foley A scholarly paper in partial fulfillment of the requirements for the degree of Master
Sensitivity of a Cloud-Resolving Model to Bulk and Explicit Bin Microphysical Schemes. Part II: Cloud Microphysics and Storm Dynamics Interactions
 22 J O U R N A L O F T H E A T M O S P H E R I C S C I E N C E S VOLUME 66 Sensitivity of a Cloud-Resolving Model to Bulk and Explicit Bin Microphysical Schemes. Part II: Cloud Microphysics and Storm Dynamics
TOPICS: What are Thunderstorms? Ingredients Stages Types Lightning Downburst and Microburst
 THUNDERSTORMS TOPICS: What are Thunderstorms? Ingredients Stages Types Lightning Downburst and Microburst What are Thunderstorms? A storm produced by a cumulonimbus cloud that contains lightning and thunder
Practical Use of the Skew-T, log-p diagram for weather forecasting. Primer on organized convection
 Practical Use of the Skew-T, log-p diagram for weather forecasting Primer on organized convection Outline Rationale and format of the skew-t, log-p diagram Some basic derived diagnostic measures Characterizing
ESCI 344 Tropical Meteorology Lesson 11 Tropical Cyclones: Formation, Maintenance, and Intensification
 ESCI 344 Tropical Meteorology Lesson 11 Tropical Cyclones: Formation, Maintenance, and Intensification References: A Global View of Tropical Cyclones, Elsberry (ed.) Global Perspectives on Tropical Cylones:
Tornadoes forecasting, dynamics and genesis. Mteor 417 Iowa State University Week 12 Bill Gallus
 Tornadoes forecasting, dynamics and genesis Mteor 417 Iowa State University Week 12 Bill Gallus Tools to diagnose severe weather risks Definition of tornado: A vortex (rapidly rotating column of air) associated
Annual Report for Blue Waters Allocation: Sonia Lasher-Trapp, Oct 2017
 Annual Report for Blue Waters Allocation: Sonia Lasher-Trapp, Oct 2017 Project Information: Untangling Entrainment Effects on Hail and Rain in Deep Convective Clouds o Sonia Lasher-Trapp, UIUC, slasher@illinois.edu
Theories on the Optimal Conditions of Long-Lived Squall Lines
 Theories on the Optimal Conditions of Long-Lived Squall Lines References: Thorpe, A. J., M. J. Miller, and M. W. Moncrieff, 1982: Two-dimensional convection in nonconstant shear: A model of midlatitude
Theories on the Optimal Conditions of Long-Lived Squall Lines
 Theories on the Optimal Conditions of Long-Lived Squall Lines References: Thorpe, A. J., M. J. Miller, and M. W. Moncrieff, 1982: Two -dimensional convection in nonconstant shear: A model of midlatitude
Synoptic Meteorology II: Self-Development in the IPV Framework. 5-7 May 2015
 Synoptic Meteorology II: Self-Development in the IPV Framework 5-7 May 2015 Readings: Section 5.3.6 of Midlatitude Synoptic Meteorology. Introduction In this and other recent lectures, we have developed
Mid-Latitude Cyclones and Fronts. Lecture 12 AOS 101
 Mid-Latitude Cyclones and Fronts Lecture 12 AOS 101 Homework 4 COLDEST TEMPS GEOSTROPHIC BALANCE Homework 4 FASTEST WINDS L Consider an air parcel rising through the atmosphere The parcel expands as it
Tornadoes forecasting, dynamics and genesis. Mteor 417 Iowa State University Week 12 Bill Gallus
 Tornadoes forecasting, dynamics and genesis Mteor 417 Iowa State University Week 12 Bill Gallus Tools to diagnose severe weather risks Definition of tornado: A vortex (rapidly rotating column of air) associated
Lightning AOSC 200 Tim Canty. Multicell Thunderstorms
 Lightning AOSC 200 Tim Canty Class Web Site: http://www.atmos.umd.edu/~tcanty/aosc200 Topics for today: Thunderstorms Lightning Initiation Lightning Detection Upward lightning Lecture 22 Nov 14, 2017 1
Solutions to Comprehensive Final Examination Given on Thursday, 13 December 2001
 Name & Signature Dr. Droegemeier Student ID Meteorology 1004 Introduction to Meteorology Fall, 2001 Solutions to Comprehensive Final Examination Given on Thursday, 13 December 2001 BEFORE YOU BEGIN!! Please
Chapter 3 Convective Dynamics
 Chapter 3 Convective Dynamics Photographs Todd Lindley 3.2 Ordinary or "air-mass storm 3.2.1. Main Characteristics Consists of a single cell (updraft/downdraft pair) Forms in environment characterized
MASTER. Hung-Neng S. Chin
 A Sensitivity Study of the Mesoscale Characteristics of Squall-Line Systems to Environmental Conditions: Implication of Anvil Cirrus Parameterization Hung-Neng S. Chin This paper was prepared for submittal
Environmental stability control of the intensity of squall lines under low-level shear conditions
 JOURNAL OF GEOPHYSICAL RESEARCH, VOL. 112,, doi:10.1029/2007jd008793, 2007 Environmental stability control of the intensity of squall lines under low-level shear conditions Tetsuya Takemi 1 Received 12
P4.9 THE SEVERE THUNDERSTORM OUTBREAK IN FINLAND ON 5 JULY 2002
 P4.9 THE SEVERE THUNDERSTORM OUTBREAK IN FINLAND ON 5 JULY 2002 Ari-Juhani Punkka* and Jenni Teittinen Finnish Meteorological Institute, Helsinki, Finland 1. INTRODUCTION On 5 July 2002 a fast propagating
Genesis mechanism and structure of a supercell tornado in a fine-resolution numerical simulation
 Genesis mechanism and structure of a supercell tornado in a fine-resolution numerical simulation Akira T. Noda a, Hiroshi Niino b a Ocean Research Institute, The University of Tokyo, 1-15-1 Minamidai,
April 13, 2006: Analysis of the Severe Thunderstorms that produced Hail in Southern Wisconsin
 April 13, 2006: Analysis of the Severe Thunderstorms that produced Hail in Southern Wisconsin Danielle Triolo UW Madison Undergraduate 453 Case Study May 5, 2009 ABSTRACT On April 13, 2006 the states of
CLOUDS & THUNDERSTORMS
 Funding provided by NOAA Sectoral Applications Research Project CLOUDS & THUNDERSTORMS Basic Climatology Oklahoma Climatological Survey How are clouds made? Clouds form when air is cooled to its dewpoint
Anthony A. Rockwood Robert A. Maddox
 Anthony A. Rockwood Robert A. Maddox An unusually intense MCS produced large hail and wind damage in northeast Kansas and northern Missouri during the predawn hours of June 7 th, 1982. Takes a look at
Severe Weather Event of 13 July 2014
 Severe Weather Event of 13 July 2014 By Richard H. Grumm and Elyse M. Colbert National Weather Service State College, PA 1. Overview Severe weather affected the eastern United States (Fig. 1) from northwestern
Christopher A. Davis and Stanley B. Trier. National Center for Atmospheric Research 1 Boulder, Colorado
 1.10 Convection Initiation Near Mesoscale Vortices Christopher A. Davis and Stanley B. Trier National Center for Atmospheric Research 1 Boulder, Colorado 1. Background While the focusing of deep, moist
Reading. What meteorological conditions precede a thunderstorm? Thunderstorms: ordinary or single cell storms, multicell storms, supercell storms
 Thunderstorms: ordinary or single cell storms, multicell storms, supercell storms Reading Ahrens, Chapter 14: Thunderstorms and Tornadoes This lecture + next (Lightning, tornadoes) will cover the topic.
Effects of microphysical drop size distribution on tornadogenesis in supercell thunderstorms
 GEOPHYSICAL RESEARCH LETTERS, VOL. 35,, doi:10.1029/2008gl035866, 2008 Effects of microphysical drop size distribution on tornadogenesis in supercell thunderstorms Nathan Snook 1 and Ming Xue 1 Received
15B.7 RESPONSE OF CONVECTION TO HURRICANE-LIKE HORIZONTAL AND VERTICAL SHEARS
 15B.7 RESPONSE OF CONVECTION TO HURRICANE-LIKE HORIZONTAL AND VERTICAL SHEARS Christopher M. Rozoff *, W. D. Terwey, M. T. Montgomery, and W. H. Schubert Dept. of Atmospheric Science, Colorado State Univ.,
Examination #3 Wednesday, 28 November 2001
 Name & Signature Dr. Droegemeier Student ID Meteorology 1004 Introduction to Meteorology Fall, 2001 Examination #3 Wednesday, 28 November 2001 BEFORE YOU BEGIN!! Please be sure to read each question CAREFULLY
THE EFFECTS OF LOW-LEVEL WIND SHEAR ORIENTATION, DEPTH, AND MAGNITUDE ON LOW-LEVEL ROTATION IN SIMULATED SUPERCELL THUNDERSTORMS
 THE EFFECTS OF LOW-LEVEL WIND SHEAR ORIENTATION, DEPTH, AND MAGNITUDE ON LOW-LEVEL ROTATION IN SIMULATED SUPERCELL THUNDERSTORMS A Thesis by FELICIA ROSE GUARRIELLO Submitted to the Office of Graduate
Divergence, Spin, and Tilt. Convergence and Divergence. Midlatitude Cyclones. Large-Scale Setting
 Midlatitude Cyclones Equator-to-pole temperature gradient tilts pressure surfaces and produces westerly jets in midlatitudes Waves in the jet induce divergence and convergence aloft, leading to surface
MESOSCALE CONVECTIVE SYSTEMS
 MESOSCALE CONVECTIVE SYSTEMS Robert A. Houze Jr. Department of Atmospheric Sciences University of Washington Seattle, Washington, USA Received 19 January 2004; revised 5 August 2004; accepted 8 November
STRUCTURES AND DYNAMICS OF QUASI-2D MESOSCALE CONVECTIVE SYSTEMS
 STRUCTURES AND DYNAMICS OF QUASI-2D MESOSCALE CONVECTIVE SYSTEMS MATTHEW D. PARKER Department of Geosciences, University of Nebraska Lincoln, Lincoln, Nebraska RICHARD H. JOHNSON Department of Atmospheric
Warm season forecasting! Some material adapted from Material Produced at COMET for their Residence Course in Hydrometeorology
 Warm season forecasting! Some material adapted from Material Produced at COMET for their Residence Course in Hydrometeorology 1 Outline! Types of stability and application to forecasting! Dry and moist
AMERICAN METEOROLOGICAL SOCIETY
 AMERICAN METEOROLOGICAL SOCIETY Monthly Weather Review EARLY ONLINE RELEASE This is a preliminary PDF of the author-produced manuscript that has been peer-reviewed and accepted for publication. Since it
Tornado Dynamics. Readings:
 Tornado Dynamics Readings: Klemp (1987) Dynamics of Tornadic Thunderstorms (handout) Bluestein Vol II. Section 3.4.8. Rotunno, R., 1986: Tornadoes and tornadogenesis. In: P. Ray (Editor), Mesoscale Meteorology
Final Report. We will discuss the project accomplishments in two sub sections, reflecting the two major efforts given in Section 1.
 Final Report to Cooperative Program for Operational Meteorology, Education and Training (COMET) University: University of Illinois in Urbana Champaign Name of University Researcher Preparing Report: David
and 24 mm, hPa lapse rates between 3 and 4 K km 1, lifted index values
 3.2 Composite analysis 3.2.1 Pure gradient composites The composite initial NE report in the pure gradient northwest composite (N = 32) occurs where the mean sea level pressure (MSLP) gradient is strongest
Base-State Substitution: An Idealized Modeling Technique for Approximating Environmental Variability
 3062 M O N T H L Y W E A T H E R R E V I E W VOLUME 141 Base-State Substitution: An Idealized Modeling Technique for Approximating Environmental Variability CASEY E. LETKEWICZ* North Carolina State University,
16.4 SENSITIVITY OF TORNADOGENESIS IN VERY-HIGH RESOLUTION NUMERICAL SIMULATIONS TO VARIATIONS IN MODEL MICROPHYSICAL PARAMETERS
 1. SENSITIVITY OF TORNADOGENESIS IN VERY-HIGH RESOLUTION NUMERICAL SIMULATIONS TO VARIATIONS IN MODEL MICROPHYSICAL PARAMETERS Nathan A. Snook* and Ming Xue University of Oklahoma, Norman, Oklahoma 1.
Proximity sounding analysis for derechos and supercells: an assessment of similarities and differences
 Atmospheric Research 67 68 (2003) 117 133 www.elsevier.com/locate/atmos Proximity sounding analysis for derechos and supercells: an assessment of similarities and differences Charles A. Doswell III a,
Idealized Nonhydrostatic Supercell Simulations in the Global MPAS
 Idealized Nonhydrostatic Supercell Simulations in the Global Joe Klemp, Bill Skamarock, and Sang-Hun Park National Center for Atmospheric Research Boulder, Colorado Typical characteristics: Supercell Thunderstorms
Kenneth L. Pryor* and Gary P. Ellrod Center for Satellite Applications and Research (NOAA/NESDIS) Camp Springs, MD
 Camp Springs, MD") P1.57 GOES WMSI PROGRESS AND DEVELOPMENTS Kenneth L. Pryor* and Gary P. Ellrod Center for Satellite Applications and Research (NOAA/NESDIS) Camp Springs, MD 1. INTRODUCTION A multi-parameter index has
P1.57 GOES WMSI PROGRESS AND DEVELOPMENTS Kenneth L. Pryor* and Gary P. Ellrod Center for Satellite Applications and Research (NOAA/NESDIS) Camp Springs, MD 1. INTRODUCTION A multi-parameter index has
Science Olympiad Meteorology Quiz #2 Page 1 of 8
 1) The prevailing general direction of the jet stream is from west to east in the northern hemisphere: 2) Advection is the vertical movement of an air mass from one location to another: 3) Thunderstorms
ATS 351, Spring 2010 Lab #11 Severe Weather 54 points
 ATS 351, Spring 2010 Lab #11 Severe Weather 54 points Question 1 (10 points): Thunderstorm development a) Sketch and describe the stages of development of a single cell thunderstorm. About how long does
A Numerical Study of the Along-Line Variability of a Frontal Squall Line during PRE-STORM
 2544 MONTHLY WEATHER REVIEW VOLUME 125 A Numerical Study of the Along-Line Variability of a Frontal Squall Line during PRE-STORM STÉPHANE BÉLAIR Recherche en Prévision Numérique, Environment Canada, Dorval,
QUASI-STATIONARY CONVECTIVE SYSTEMS FORMING PERPENDICULAR TO, AND ABOVE THE COLD POOLS OF, STRONG BOW ECHOES. A Thesis KELLY M.
 QUASI-STATIONARY CONVECTIVE SYSTEMS FORMING PERPENDICULAR TO, AND ABOVE THE COLD POOLS OF, STRONG BOW ECHOES A Thesis by KELLY M. KEENE Submitted to the Office of Graduate Studies of Texas A&M University
ture and evolution of the squall line developed over the China Continent. We made data analysis of the three Doppler radar observation during the IFO
 Simulation Experiment of Squall Line Observed in the Huaihe River Basin, China Kazuhisa Tusboki 1 and Atsushi Sakakibara 2 1 Hydrospheric Atmospheric Research Center, Nagoya University 2 Research Organization
Mid Atlantic Severe Event of 1 May 2017 Central Pennsylvania QLCS event By Richard H. Grumm National Weather Service, State College, PA 16803
 1. Overview Mid Atlantic Severe Event of 1 May 2017 Central Pennsylvania QLCS event By Richard H. Grumm National Weather Service, State College, PA 16803 A strong upper-level wave (Fig.1) moving into a
contact with ground for 1 hour plus, starting 1500 MDT moved N., covered about 37 km width varied m
 Goal for today: Finish Ch. 11 Lightning, Thunder & Tornadoes 16 Nov., 2011 Edmonton tornado 31 July 1987 contact with ground for 1 hour plus, starting 1500 MDT moved N., covered about 37 km width varied
11.B4 The influence of horizontal convective rolls on the morphology of low-level rotation in idealized simulations of supercell thunderstorms
 11.B4 The influence of horizontal convective rolls on the morphology of low-level rotation in idealized simulations of supercell thunderstorms CHRISTOPHER J. NOWOTARSKI, PAUL M. MARKOWSKI, AND YVETTE P.
Large-Eddy Simulations of Tropical Convective Systems, the Boundary Layer, and Upper Ocean Coupling
 DISTRIBUTION STATEMENT A. Approved for public release; distribution is unlimited. Large-Eddy Simulations of Tropical Convective Systems, the Boundary Layer, and Upper Ocean Coupling Eric D. Skyllingstad
Meteorology Lecture 19
 Meteorology Lecture 19 Robert Fovell rfovell@albany.edu 1 Important notes These slides show some figures and videos prepared by Robert G. Fovell (RGF) for his Meteorology course, published by The Great
8A.6 MESOCYCLONE AND RFD EVOLUTION IN SIMULATED SUPERCELL STORMS WITH VARYING WIND PROFILES
 8A.6 MESOCYCLONE AND RFD EVOLUTION IN SIMULATED SUPERCELL STORMS WITH VARYING WIND PROFILES Matthew S. Van Den Broeke Jerry M. Straka University of Oklahoma, Norman, Oklahoma Erik Rasmussen Rasmussen Systems,
HAZARDOUS WEATHER 1. Dr. Julie Laity Geography 266
 HAZARDOUS WEATHER 1 Dr. Julie Laity Geography 266 Violent Weather Thunderstorms Atmospheric turbulence Lightning and thunder Hail Derechos Tornadoes Tornado measurement and science Tropical Cyclones Hurricanes
Clouds and turbulent moist convection
 Clouds and turbulent moist convection Lecture 2: Cloud formation and Physics Caroline Muller Les Houches summer school Lectures Outline : Cloud fundamentals - global distribution, types, visualization
NOAA S National Weather Service
 NOAA S National Weather Service Elite Concepts of Severe Storm Spotting 2011 Rusty Kapela Milwaukee/Sullivan www.weather.gov/mkx Elite Spotter Outline Review Types of T storms Tornadic Supercell Classic,
The Earth System - Atmosphere III Convection
 The Earth System - Atmosphere III Convection Thunderstorms 1. A thunderstorm is a storm that produces lightning (and therefore thunder) 2. Thunderstorms frequently produce gusty winds, heavy rain, and
BOUNDARY LAYER ENERGY POTENTIAL (BLEP): AN OPERATIONAL TOOL TO ESTIMATE MAXIMUM SURFACE WIND SPEEDS IN CONVECTIVE STORMS?
: AN OPERATIONAL TOOL TO ESTIMATE MAXIMUM SURFACE WIND SPEEDS IN CONVECTIVE STORMS?") BOUNDARY LAYER ENERGY POTENTIAL (BLEP): AN OPERATIONAL TOOL TO ESTIMATE MAXIMUM SURFACE WIND SPEEDS IN CONVECTIVE STORMS? Bill Nichols Lead Forecaster, WFO DVN Quad Cities OVERVIEW Purpose Of BLEP General
BOUNDARY LAYER ENERGY POTENTIAL (BLEP): AN OPERATIONAL TOOL TO ESTIMATE MAXIMUM SURFACE WIND SPEEDS IN CONVECTIVE STORMS? Bill Nichols Lead Forecaster, WFO DVN Quad Cities OVERVIEW Purpose Of BLEP General