(QALT): Data Analysis and Test Design
|
|
|
- Marvin Lindsey
- 5 years ago
- Views:
Transcription
1 (QALT): Data Analysis and Test Design Huairui(Harry) Guo, Ph.D, CRE, CQE Thanasis Gerokostopoulos, CRE, CQE ASTR 2013, Oct. 9-11, San Diego, CA
2 Qualitative vs. Quantitative ALT (Accelerated Life Tests) Understand Quantitative ALT Ø Data Modeling Ø Examples Design Quantitative ALT Ø Theory Ø Example Outlines
3 Section I: Qualitative vs. Quantitative ALT


4 Qualitative vs. Quantitative ALT Many different names are used for different accelerated life tests. In general, we can classify them into 2 categories.
.")

5 Qualitative Accelerated Tests An accelerated test that yields failure information (or failure modes) only is a qualitative test (commonly called shake & bake tests, HALT, MEOST, elephant tests, etc.). In such tests, stresses applied to the product are well beyond normal shipping, storage and in use levels for the purpose of finding and correcting design weaknesses. (Statistical properties of life distributions will not be measured.)
6 Qualitative Accelerated Tests Benefits Ø Increase reliability by revealing probable failure modes. Unanswered Questions Ø What is the reliability of the product? Ø Are the failure modes the same as the ones that will occur during the life of the product under normal use?


7 Quantitative accelerated life testing, unlike qualitative testing, is designed to provide reliability information on the product, component or system, through failure data obtained from the accelerated test.


8 Why Quantitative ALT? To be able to quantify the life characteristics, and/ or failure rate behavior, of an item in a shorter time. Ø If you are warranting a product for 5 years and it has a 12-month development cycle, you can t afford the time to do life tests under usual conditions.
9 Section II: Understand Quantitative ALT

10 Stress & Strength: Why Components Fails

11 Increasing Stress in an ALT to Generate Failures

12 Predict Life at Normal Usage Stress Level


13 Life Stress Relationship (LSR) Strictly Monotonic Function Ø It is a function that is increasing on its entire domain or decreasing on its entire domain. One-to-One Function Ø The function should be a oneto-one function (i.e., for each y value in the range of f, there exists exactly one value of x in its domain).
14 Overview of the Analysis Steps Accelerated life models usually consist of: Ø A life distribution (e.g., Weibull). Ø Life-stress relationship(s).
15 Weibull Lognormal Exponential Select the Failure Time Distribution A statistical distribution is used to describe the randomness of the failure times at a given stress level β η β η η β = t e t t f 1 ) ( 2 1 ln( ) 2 1 () 2 t f t e t µ σ σ π = = m t e m t f 1 ) (
16 Choose one Characteristic to Represent the Life In QALT, one of the most important assumptions is that the failure mode due to the test stress is the same at different stress levels. Failure mode is represented by the shape parameter such as β in Weibull distribution and σ in lognormal distribution. They are the same at different stress levels. The scale parameter is used as the life characteristic to represent the life at a given stress. They are different at different stress levels. Ø Weibull: η(s) Ø Lognormal: µ(s) Ø Exponential: m(s)
17 Select the Life-Stress Relation (LSR) functions will describe the life characteristic (L)/or its transformation as a function of stress (V). L ( V ) = f ( V ) Simple curves provide the best candidates. Ø General exponential curve: L( V ) = A BV e Ø General power curve: L( V ) = A V B
18 Using the Relationship in a Distribution In QALT, one must first choose the underlying life distribution. Once the distribution has been chosen, the distribution s scale parameter is usually modeled using the life-stress Reliability vs Stress Surface relationship. For the Weibull distribution then: f η( V ( t; β, η( V ) = L( V )) )
: Ø Arrhenius Ø Eyring Ø Inverse Power Law")
19 Common Life-Stress Relationships Found widely in literature and used in QALT application (for constant stresses): Ø Arrhenius Ø Eyring Ø Inverse Power Law Ø
20 Arrhenius Relationship Commonly used for analyzing data for which temperature is the accelerated stress. R( T ) = A e K T Ø where R is the speed of reaction, A is a nonthermal constant, EA is the activation energy (ev), K is Boltzman s constant ( E-5 ev/k) and T is the absolute temperature (kelvins). The activation energy is the energy that a molecule must have to participate in the reaction. In other words, the activation energy is a measure of the effect that temperature has on the reaction. E A
21 A More General Arrhenius Relationship Since the activation energy is a measure of the effect that temperature has on the reaction, when used in QALT, it would be the effect of temperature on life. This must then be determined from the data. Since K is a constant, a parameter B can be defined and solved for based on data, thus generalizing the model. e E A K 1 T = e where B B T = E K A
22 A More General Arrhenius Relationship(cont d) For a stress V, the life characteristic of interest as a function of the stress, L(V), is given by an exponential relationship which assumes that life is proportional to the inverse reaction rate of the process: L( V ) C e The term acceleration factor is used to describe the ratio of the life characteristic at the use and accelerated test conditions, or: A F = = Ø Thus, if the life characteristic (i.e., MTTF) is half of what it is at use conditions, then the acceleration factor is 2. B V L( Use) L( Accelerated )
23 Common Formulations with Arrhenius Relationship Exponential- Arrhenius f(t;v)= 1/C e B/V e 1/C e B/V t Weibull- Arrhenius f(t;v)= β/c e B/V ( t/c e B/V ) β 1 e ( t/c e B/V ) β Lognormal- Arrhenius f(t;v)= 1/t σ 2π e 1/2 ( ln(t) ln(c) B/V / σ ) 2
24 Estimating the Parameters (MLE) D i ( t; V ) for i = 1 n f ( t; V ) = β C e B V C t e B V β 1 e t C e B V β Using the model and data, estimate the parameters. Maximum likelihood estimation (MLE) methods are utilized. β,c, B
25 Once the parameters are obtained, the model is fully defined for the current data set. As an example: Result of Interest β = 2.4; C = ; B = f ( t; V ) = e V t 9 e V e t e V 2.4

26
27 Other Life-Stress Relationships Inverse Power Law: L( V ) Eyring Relationship: L( V ) = = K 1 V 1 V All the models have the same analysis procedure as the Arrhenius relationship e n B A V
 for thermal")

28 Rule of Thumb Regarding LSRs Use exponential life-stress relationships (LSRs) for thermal stimuli. Temperature Humidity Use power LSRs for non-thermal stimuli. Voltage Mechanical Fatigue Other
29 Consider the Bulbs at 140V and 130V TTF (hr) at 140V Example 1 TTF (hr) at 130V
= β/ η 140 ( t/ η 140 ) β 1 e ( t/ η 140 ) β Voltage")
30 Power Relationship f 130 (t)= β/ η 130 ( t/ η 130 ) β 1 e ( t/ η 130 ) β Life Characteristic f 140 (t)= β/ η 140 ( t/ η 140 ) β 1 e ( t/ η 140 ) β Voltage (V)


31 f V (t)= 3.9/ 1/9.6E 31 V 13 ( t/ 1/9.6E 31 V 13 ) 2.9 e ( t/ 1/9.6E 31 V 13 ) 3.9

32
33 Temperature-Non-Thermal(T-NT) Temperature-Humidity(T-H) General Log-Linear(GLL) Relationships for Two or More Stresses V B n n V B e U C KU Ae V U L = = 1 ), ( + = U B V e A V U L φ ), ( ( ) + = = = + i i i X X Y L e V U L i i i α α α α 0 ln ), ( 0 Note: Arrhenius, Inverse Power Law, T-NT, T-H and many other models can be represented by GLL.
 0 Ø The stress combinations must be at least the number of stresses+1.")
34 Note on Data Requirements For one stress model ( X 1 is the stress) L( X = α + α X Ø We need at least two stress levels in order to solve for the two parameters α 0 and α 1. For multiple stress model 1 ) 0 Ø The stress combinations must be at least the number of stresses
35 Will These Test Plans Give Enough Data for Modeling? Case 1: Stresses are temperature and humidity, 2 test conditions. Temperature Humidity Case 2: Stresses are temperature and humidity, 3 test conditions Temperature Humidity
 to separate the effects of temperature and humidity, so the coefficients of the two stresses in")
36 Design Evaluation Both designs are bad since the effects of temperature and humidity are confounded (or aliased). We do not have enough data (stress levels) to separate the effects of temperature and humidity, so the coefficients of the two stresses in the model cannot be estimated.
37 Section III: Design a Quantitative ALT
38 Design a QALT for Reliability Prediction The purpose of a Quantitative Test is to predict the reliability of a product. Enough failures should be obtained from the test in order to have an accurate prediction model. To design a test plan, we usually need to determine Ø How many test units Ø How long to test Ø What are the stress levels Ø What are the combinations of stresses Ø How to allocate test units to the experiment.
39 Commonly Used Test Plan For a single stress, the most commonly used test plans are: Ø The 2 Level Statistically Optimum Plan. The plan will recommend two stress levels. One will be the maximum allowable stress and the second will be computed so that the variance of the B(X) life is minimized. Ø The 3 Level Best Standard Plan. The plan will recommend three equally spaced stress levels with equal allocations. One stress will be the maximum allowable stress and the other two stresses will be computed so that the variance of the B(X) life is minimized.
40 Commonly Used Test Plan (cont d) Ø The 3 Level Best Compromise Plan. The plan will recommend three equally spaced stress levels using the same approach as the 3 Level Best Standard Plan. The difference is that the proportion of the units to be allocated to the middle stress level is defined by the user. Ø The 3 Level Best Equal Expected Number Failing Plan. The plan will recommend three equally spaced stress levels using the same approach as the 3 Level Best Standard Plan. The difference is that the proportion of units allocated to each stress level is calculated such that the number of units expected to fail at each level is equal.
41 Theory: Reduce the Model Uncertainty In QALT In QALT, it usually is required to minimize the uncertainty of the estimated model parameters. Ø Variance-covariance matrix of parameter estimation Var 1 2 Λ = 2 θi where θ i Λ are the model parameters, and = F is the log-likelihood function. Minimizing the variance-covariance matrix is the same as to maximize the determinant of Fisher information matrix objective : max F st. constraints on stresses, constraints on sample,...
42 Example: One Stress Test Plan A reliability engineer wants to design an ALT for an electronic component. Use temperature is 300K while design limit is 380K. The engineer has: Ø 2 months or 1,440 hours available for testing and 2 available chambers. From historical data: Ø The beta parameter of the Weibull distribution is 3. Ø At 1,440 hours, the probability of failure at use temperature is At the design limit, it is The engineer wants to determine: Ø The appropriate temperature that should be set at each chamber. Ø The number of units that should be allocated at each chamber.

43 Example: One Stress Test Plan (cont d) The inputs for a 2 Level Statistically Optimum Test Plan are:

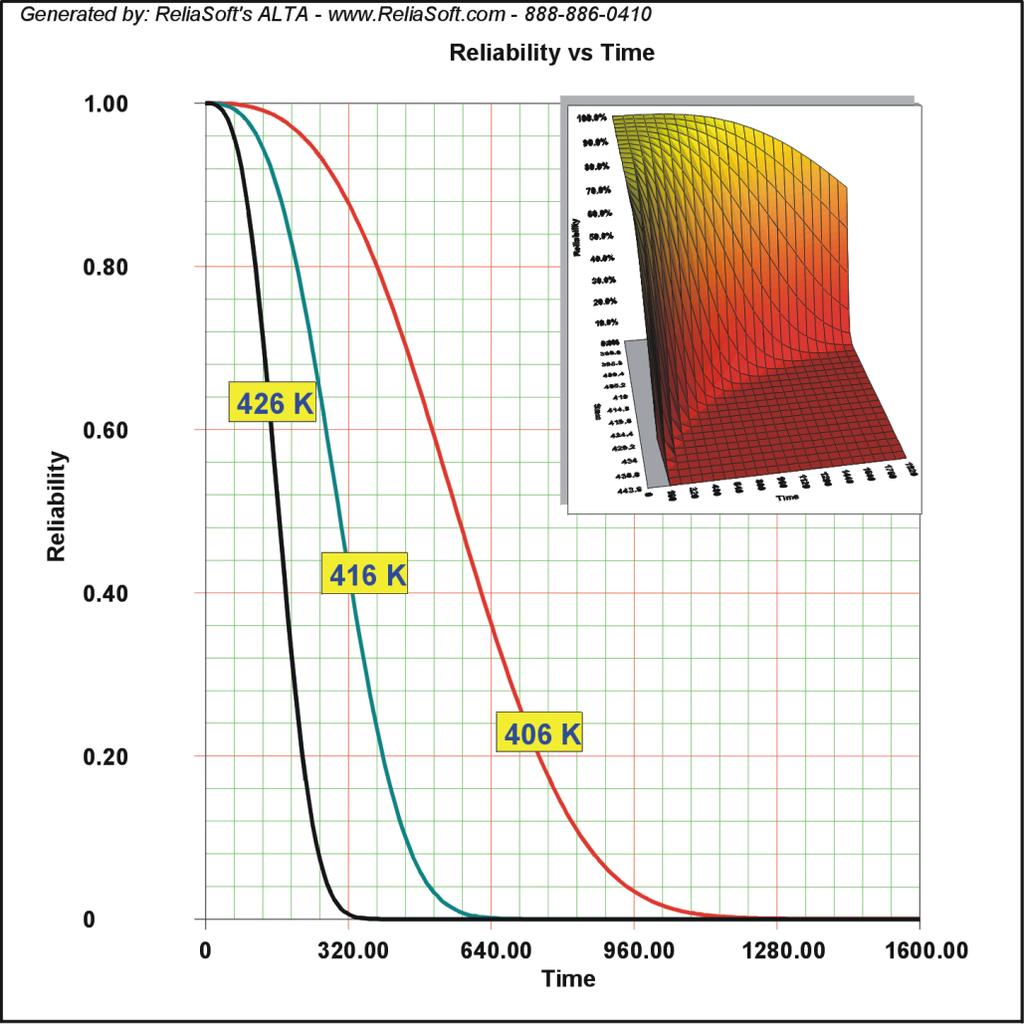
44 Results for the Test Plan The following figure shows the output of the test plan. The results show that: 68.2% of the units should be allocated at 355.8K and 31.8% at 380K. This test plan will give a minimal variance for the estimated B10 life.
45 Conclusions Discussed Qualitative vs. Quantitative Accelerated Life Tests. The theory and an example of modeling the failure data in Quantitative ALT. The theory and an example of design an efficient Quantitative ALT

46
Unit 20: Planning Accelerated Life Tests
 Unit 20: Planning Accelerated Life Tests Ramón V. León Notes largely based on Statistical Methods for Reliability Data by W.Q. Meeker and L. A. Escobar, Wiley, 1998 and on their class notes. 11/13/2004
Temperature and Humidity Acceleration Factors on MLV Lifetime
 Temperature and Humidity Acceleration Factors on MLV Lifetime With and Without DC Bias Greg Caswell Introduction This white paper assesses the temperature and humidity acceleration factors both with and
Constant Stress Partially Accelerated Life Test Design for Inverted Weibull Distribution with Type-I Censoring
 Algorithms Research 013, (): 43-49 DOI: 10.593/j.algorithms.01300.0 Constant Stress Partially Accelerated Life Test Design for Mustafa Kamal *, Shazia Zarrin, Arif-Ul-Islam Department of Statistics & Operations
Semiconductor Reliability
 Semiconductor Reliability. Semiconductor Device Failure Region Below figure shows the time-dependent change in the semiconductor device failure rate. Discussions on failure rate change in time often classify
Step-Stress Models and Associated Inference
 Department of Mathematics & Statistics Indian Institute of Technology Kanpur August 19, 2014 Outline Accelerated Life Test 1 Accelerated Life Test 2 3 4 5 6 7 Outline Accelerated Life Test 1 Accelerated
Experimental Designs for Planning Efficient Accelerated Life Tests
 Experimental Designs for Planning Efficient Accelerated Life Tests Kangwon Seo and Rong Pan School of Compu@ng, Informa@cs, and Decision Systems Engineering Arizona State University ASTR 2015, Sep 9-11,
STATISTICAL INFERENCE IN ACCELERATED LIFE TESTING WITH GEOMETRIC PROCESS MODEL. A Thesis. Presented to the. Faculty of. San Diego State University
 STATISTICAL INFERENCE IN ACCELERATED LIFE TESTING WITH GEOMETRIC PROCESS MODEL A Thesis Presented to the Faculty of San Diego State University In Partial Fulfillment of the Requirements for the Degree
A Tool for Evaluating Time-Varying-Stress Accelerated Life Test Plans with Log-Location- Scale Distributions
 Statistics Preprints Statistics 6-2010 A Tool for Evaluating Time-Varying-Stress Accelerated Life Test Plans with Log-Location- Scale Distributions Yili Hong Virginia Tech Haiming Ma Iowa State University,
Optimum Test Plan for 3-Step, Step-Stress Accelerated Life Tests
 International Journal of Performability Engineering, Vol., No., January 24, pp.3-4. RAMS Consultants Printed in India Optimum Test Plan for 3-Step, Step-Stress Accelerated Life Tests N. CHANDRA *, MASHROOR
Unit 10: Planning Life Tests
 Unit 10: Planning Life Tests Ramón V. León Notes largely based on Statistical Methods for Reliability Data by W.Q. Meeker and L. A. Escobar, Wiley, 1998 and on their class notes. 11/2/2004 Unit 10 - Stat
Reliability Engineering I
 Happiness is taking the reliability final exam. Reliability Engineering I ENM/MSC 565 Review for the Final Exam Vital Statistics What R&M concepts covered in the course When Monday April 29 from 4:30 6:00
JEDEC STANDARD. Early Life Failure Rate Calculation Procedure for Semiconductor Components. JESD74A (Revision of JESD74, April 2000) FEBRUARY 2007
 FEBRUARY 2007") JEDEC STANDARD Early Life Failure Rate Calculation Procedure for Semiconductor Components JESD74A (Revision of JESD74, April 2000) FEBRUARY 2007 JEDEC Solid State Technology Association NOTICE JEDEC standards
JEDEC STANDARD Early Life Failure Rate Calculation Procedure for Semiconductor Components JESD74A (Revision of JESD74, April 2000) FEBRUARY 2007 JEDEC Solid State Technology Association NOTICE JEDEC standards
Fundamentals of Reliability Engineering and Applications
 Fundamentals of Reliability Engineering and Applications E. A. Elsayed elsayed@rci.rutgers.edu Rutgers University Quality Control & Reliability Engineering (QCRE) IIE February 21, 2012 1 Outline Part 1.
Statistical Inference on Constant Stress Accelerated Life Tests Under Generalized Gamma Lifetime Distributions
 Int. Statistical Inst.: Proc. 58th World Statistical Congress, 2011, Dublin (Session CPS040) p.4828 Statistical Inference on Constant Stress Accelerated Life Tests Under Generalized Gamma Lifetime Distributions
Accelerated Life Test of Mechanical Components Under Corrosive Condition
 Accelerated Life Test of Mechanical Components Under Corrosive Condition Cheng Zhang, and Steven Y. Liang G. W. Woodruff School of Mechanical Engineering Georgia Institute of Technology Atlanta, GA 30332,
IE 303 Discrete-Event Simulation
 IE 303 Discrete-Event Simulation 1 L E C T U R E 5 : P R O B A B I L I T Y R E V I E W Review of the Last Lecture Random Variables Probability Density (Mass) Functions Cumulative Density Function Discrete
Inference on reliability in two-parameter exponential stress strength model
 Metrika DOI 10.1007/s00184-006-0074-7 Inference on reliability in two-parameter exponential stress strength model K. Krishnamoorthy Shubhabrata Mukherjee Huizhen Guo Received: 19 January 2005 Springer-Verlag
Accelerated Testing Obtaining Reliability Information Quickly
 Accelerated Testing Background Accelerated Testing Obtaining Reliability Information Quickly William Q. Meeker Department of Statistics and Center for Nondestructive Evaluation Iowa State University Ames,
Quiz #2 A Mighty Fine Review
 Quiz #2 A Mighty Fine Review February 27: A reliable adventure; a day like all days filled with those events that alter and change the course of history and you will be there! What is a Quiz #2? Three
Parametric Failures in COTS Capacitors
 NASA Electronic Parts and Packaging (NEPP) Program Parametric Failures in COTS Capacitors Alexander Teverovsky*, Michael Sampson ** *ASRC AS&D, Inc. work performed for NASA GSFC Code 562 ** NEPP program
A Profile Analysis about Two Group Thermal Life Data
 , pp.72-76 http://dx.doi.org/10.14257/astl.2015.86.15 A Profile Analysis about Two Group Thermal Life Data Kyubark Shim 1, Jaegeol Yim 2 1 Department of Applied Statistics, Dongguk University at Gyeongju,
Chapter 5 Reliability of Systems
 Chapter 5 Reliability of Systems Hey! Can you tell us how to analyze complex systems? Serial Configuration Parallel Configuration Combined Series-Parallel C. Ebeling, Intro to Reliability & Maintainability
Data: Singly right censored observations from a temperatureaccelerated
 Chapter 19 Analyzing Accelerated Life Test Data William Q Meeker and Luis A Escobar Iowa State University and Louisiana State University Copyright 1998-2008 W Q Meeker and L A Escobar Based on the authors
CHAPTER 10 RELIABILITY
 CHAPTER 10 RELIABILITY Failure rates Reliability Constant failure rate and exponential distribution System Reliability Components in series Components in parallel Combination system 1 Failure Rate Curve
OPTIMAL DESIGN AND EQUIVALENCY OF ACCELERATED LIFE TESTING PLANS
 OPTIMAL DESIGN AND EQUIVALENCY OF ACCELERATED LIFE TESTING PLANS by YADA ZHU A dissertation submitted to the Graduate School-New Brunswick Rutgers, The State University of New Jersey In partial fulfillment
Contents. Introduction Field Return Rate Estimation Process Used Parameters
 Contents Introduction Field Return Rate Estimation Process Used Parameters Parts Count Reliability Prediction Accelerated Stress Testing Maturity Level Field Return Rate Indicator Function Field Return
Abstract. 1. Introduction
 Abstract Repairable system reliability: recent developments in CBM optimization A.K.S. Jardine, D. Banjevic, N. Montgomery, A. Pak Department of Mechanical and Industrial Engineering, University of Toronto,
Reliability Datasheet
 HLMP-LG70/71,HLMP-LB71 HLMP-LM71 4 mm Oval Precision Optical Performance LED Reliability Datasheet Description The following cumulative test results have been ob tained from testing performed at Avago
Reliability Monitoring Using Log Gaussian Process Regression
 COPYRIGHT 013, M. Modarres Reliability Monitoring Using Log Gaussian Process Regression Martin Wayne Mohammad Modarres PSA 013 Center for Risk and Reliability University of Maryland Department of Mechanical
AN INTRODUCTION TO FULLY AND PARTIALLY ACCELERATED LIFE TESTING MODELS
 CHAPTER 1 AN INTRODUCTION TO FULLY AND PARTIALLY ACCELERATED LIFE TESTING MODELS 1.1 INTRODUCTION The term reliability refers to failure free or fault free performance of a unit during a given period of
Reliability analysis of power systems EI2452. Lifetime analysis 7 May 2015
 Reliability analysis of power systems EI2452 Lifetime analysis 7 May 2015 Agenda Summary of content: Introduction nonreparable/reparable General information about statistical surveys Lifetime data Nonparametric
Engineering Risk Benefit Analysis
 Engineering Risk Benefit Analysis 1.155, 2.943, 3.577, 6.938, 10.816, 13.621, 16.862, 22.82, ESD.72, ESD.721 RPRA 3. Probability Distributions in RPRA George E. Apostolakis Massachusetts Institute of Technology
Accelerated Life Test Principles and Applications in Power Solutions
 Accelerated Life Test Principles and Applications in Power Solutions Created by Michael Shover, Ph.D., Advanced Energy Industries, Inc. Abstract This paper discusses using an Accelerated Life Test (ALT)
Analog Devices Welcomes Hittite Microwave Corporation NO CONTENT ON THE ATTACHED DOCUMENT HAS CHANGED
 Analog Devices Welcomes Hittite Microwave Corporation NO CONTENT ON THE ATTACHED DOCUMENT HAS CHANGED www.analog.com www.hittite.com Report Title: Report Type: Date: Qualification Test Report See Attached
Time-varying failure rate for system reliability analysis in large-scale railway risk assessment simulation
 Time-varying failure rate for system reliability analysis in large-scale railway risk assessment simulation H. Zhang, E. Cutright & T. Giras Center of Rail Safety-Critical Excellence, University of Virginia,
Statistics for Engineers Lecture 4 Reliability and Lifetime Distributions
 Statistics for Engineers Lecture 4 Reliability and Lifetime Distributions Chong Ma Department of Statistics University of South Carolina chongm@email.sc.edu February 15, 2017 Chong Ma (Statistics, USC)
Small Crack Fatigue Growth and Detection Modeling with Uncertainty and Acoustic Emission Application
 Small Crack Fatigue Growth and Detection Modeling with Uncertainty and Acoustic Emission Application Presentation at the ITISE 2016 Conference, Granada, Spain June 26 th 29 th, 2016 Outline Overview of
MEAN residual lifetime (MRL) may be predicted according. Degradation models for reliability estimation and mean residual lifetime
 may be predicted according. Degradation models for reliability estimation and mean residual lifetime") Degradation models for reliability estimation and mean residual lifetime Christophe Letot 1, Pierre Dehombreux 1 1 Service de Génie Mécanique & Pôle Risques, Faculté Polytechnique de Mons 53 Rue du Joncquois,
Degradation models for reliability estimation and mean residual lifetime Christophe Letot 1, Pierre Dehombreux 1 1 Service de Génie Mécanique & Pôle Risques, Faculté Polytechnique de Mons 53 Rue du Joncquois,
Analysis of Time-to-Event Data: Chapter 4 - Parametric regression models
 Analysis of Time-to-Event Data: Chapter 4 - Parametric regression models Steffen Unkel Department of Medical Statistics University Medical Center Göttingen, Germany Winter term 2018/19 1/25 Right censored
By choosing to view this document, you agree to all provisions of the copyright laws protecting it.
 Copyright 2017 IEEE. Reprinted, with permission, from Sharon L. Honecker and Umur Yenal, Quantifying the Effect of a Potential Corrective Action on Product Life, 2017 Reliability and Maintainability Symposium,
Practical Applications of Reliability Theory
 Practical Applications of Reliability Theory George Dodson Spallation Neutron Source Managed by UT-Battelle Topics Reliability Terms and Definitions Reliability Modeling as a tool for evaluating system
A General Bayes Weibull Inference Model for Accelerated Life Testing
 A General Bayes Weibull Inference Model for Accelerated Life Testing J. René Van Dorp & Thomas A. Mazzuchi The George Washington University, Washington D.C., USA Submitted to: European Safety and Reliability
Chapter 17. Failure-Time Regression Analysis. William Q. Meeker and Luis A. Escobar Iowa State University and Louisiana State University
 Chapter 17 Failure-Time Regression Analysis William Q. Meeker and Luis A. Escobar Iowa State University and Louisiana State University Copyright 1998-2008 W. Q. Meeker and L. A. Escobar. Based on the authors
Example: Ground Motion Attenuation
 Example: Ground Motion Attenuation Problem: Predict the probability distribution for Peak Ground Acceleration (PGA), the level of ground shaking caused by an earthquake Earthquake records are used to update
General Regression Model
 Scott S. Emerson, M.D., Ph.D. Department of Biostatistics, University of Washington, Seattle, WA 98195, USA January 5, 2015 Abstract Regression analysis can be viewed as an extension of two sample statistical
10 Introduction to Reliability
 0 Introduction to Reliability 10 Introduction to Reliability The following notes are based on Volume 6: How to Analyze Reliability Data, by Wayne Nelson (1993), ASQC Press. When considering the reliability
Chapter 6. Estimation of Confidence Intervals for Nodal Maximum Power Consumption per Customer
 Chapter 6 Estimation of Confidence Intervals for Nodal Maximum Power Consumption per Customer The aim of this chapter is to calculate confidence intervals for the maximum power consumption per customer
Chapter 18. Accelerated Test Models. William Q. Meeker and Luis A. Escobar Iowa State University and Louisiana State University
 Chapter 18 Accelerated Test Models William Q. Meeker and Luis A. Escobar Iowa State University and Louisiana State University Copyright 1998-2008 W. Q. Meeker and L. A. Escobar. Based on the authors text
The Relationship Between Confidence Intervals for Failure Probabilities and Life Time Quantiles
 Statistics Preprints Statistics 2008 The Relationship Between Confidence Intervals for Failure Probabilities and Life Time Quantiles Yili Hong Iowa State University, yili_hong@hotmail.com William Q. Meeker
STAT 331. Accelerated Failure Time Models. Previously, we have focused on multiplicative intensity models, where
 STAT 331 Accelerated Failure Time Models Previously, we have focused on multiplicative intensity models, where h t z) = h 0 t) g z). These can also be expressed as H t z) = H 0 t) g z) or S t z) = e Ht
Statistical Methods for Reliability Data from Designed Experiments
 Statistical Methods for Reliability Data from Designed Experiments Laura J. Freeman Dissertation submitted to the Faculty of the Virginia Polytechnic Institute and State University in partial fulfillment
International Letters of Chemistry, Physics and Astronomy Vol
 International Letters of Chemistry, Physics and Astronomy Online: 2015-04-07 ISSN: 2299-3843, Vol. 49, pp 48-59 doi:10.18052/www.scipress.com/ilcpa.49.48 2015 SciPress Ltd., Switzerland Arrhenius Accelerated
Checking the Reliability of Reliability Models.
 Checking the Reliability of Reliability Models. Seminario de Estadística, CIMAT Abril 3, 007. Víctor Aguirre Torres Departmento de Estadística, ITAM Área de Probabilidad y Estadística, CIMAT Credits. Partially
AOS Semiconductor Product Reliability Report
 AOS Semiconductor Product Reliability Report AO4466/AO4466L, rev B Plastic Encapsulated Device ALPHA & OMEGA Semiconductor, Inc 49 Mercury Drive Sunnyvale, CA 948 U.S. Tel: (48) 83-9742 www.aosmd.com Jun
Reliability of Technical Systems
 Main Topics 1. Introduction, Key Terms, Framing the Problem 2. Reliability Parameters: Failure Rate, Failure Probability, etc. 3. Some Important Reliability Distributions 4. Component Reliability 5. Software
Modified Norris Landzberg Model and Optimum Design of Temperature Cycling ALT
 UDC 539.4 Modified Norris Landzberg Model and Optimum Design of Temperature Cycling ALT F. Q. Sun, a,b,1 J. C. Liu, a,b Z. Q. Cao, b X. Y. Li, a,b and T. M. Jiang b a Science and Technology on Reliability
ECMA st Edition / June Test Method for the Estimation of the Archival Lifetime of Optical Media
 ECMA-379 1 st Edition / June 2007 Test Method for the Estimation of the Archival Lifetime of Optical Media COPYRIGHT PROTECTED DOCUMENT Ecma International 2007 Standard ECMA-379 1 st Edition / June 2007
Introduction to Reliability Theory (part 2)
") Introduction to Reliability Theory (part 2) Frank Coolen UTOPIAE Training School II, Durham University 3 July 2018 (UTOPIAE) Introduction to Reliability Theory 1 / 21 Outline Statistical issues Software
Introduction to Reliability Theory (part 2) Frank Coolen UTOPIAE Training School II, Durham University 3 July 2018 (UTOPIAE) Introduction to Reliability Theory 1 / 21 Outline Statistical issues Software
Chapter 9 Part II Maintainability
 Chapter 9 Part II Maintainability 9.4 System Repair Time 9.5 Reliability Under Preventive Maintenance 9.6 State-Dependent Systems with Repair C. Ebeling, Intro to Reliability & Maintainability Chapter
PU Ph D Statistics. 4 of PU_2015_149. β = 1. β > 1. β < 1. β = per year per year per year. 0.
 PU Ph D Statistics 1 of 100 160 PU_2015_149 The pdf of the three-parameter Weibull reduces to that of the two parameter exponential distributon, when β takes the value:- β = 1 β > 1 β < 1 β = 0 2 of 100
AOS Semiconductor Product Reliability Report
 AOS Semiconductor Product Reliability Report AO64/AO64L, rev C Plastic Encapsulated Device ALPHA & OMEGA Semiconductor, Inc 49 Mercury Drive Sunnyvale, CA 948 U.S. Tel: (48) 83-9742 www.aosmd.com Mar 8,
Practice Problems Section Problems
 Practice Problems Section 4-4-3 4-4 4-5 4-6 4-7 4-8 4-10 Supplemental Problems 4-1 to 4-9 4-13, 14, 15, 17, 19, 0 4-3, 34, 36, 38 4-47, 49, 5, 54, 55 4-59, 60, 63 4-66, 68, 69, 70, 74 4-79, 81, 84 4-85,
Failure rate in the continuous sense. Figure. Exponential failure density functions [f(t)] 1
![Failure rate in the continuous sense. Figure. Exponential failure density functions [f(t)] 1](/thumbs/73/68618961.jpg "Failure rate in the continuous sense. Figure. Exponential failure density functions [f(t)] 1") Failure rate (Updated and Adapted from Notes by Dr. A.K. Nema) Part 1: Failure rate is the frequency with which an engineered system or component fails, expressed for example in failures per hour. It is
Failure rate (Updated and Adapted from Notes by Dr. A.K. Nema) Part 1: Failure rate is the frequency with which an engineered system or component fails, expressed for example in failures per hour. It is
Variations. ECE 6540, Lecture 10 Maximum Likelihood Estimation
 Variations ECE 6540, Lecture 10 Last Time BLUE (Best Linear Unbiased Estimator) Formulation Advantages Disadvantages 2 The BLUE A simplification Assume the estimator is a linear system For a single parameter
Chapter 5. Statistical Models in Simulations 5.1. Prof. Dr. Mesut Güneş Ch. 5 Statistical Models in Simulations
 Chapter 5 Statistical Models in Simulations 5.1 Contents Basic Probability Theory Concepts Discrete Distributions Continuous Distributions Poisson Process Empirical Distributions Useful Statistical Models
Rolling Contact Fatigue Life Test Design and Result Interpretation Methods Maintaining Compatibility of Efficiency and Reliability
 Rolling Contact Fatigue Life Test Design and Result Interpretation Methods Maintaining Compatibility of Efficiency and Reliability Takumi FUJITA L 1 L 5 L 1 L 5 L 1 L 5 L 1 L 1 L 1 L 5 In this report,
Probability Plots. Summary. Sample StatFolio: probplots.sgp
 STATGRAPHICS Rev. 9/6/3 Probability Plots Summary... Data Input... 2 Analysis Summary... 2 Analysis Options... 3 Uniform Plot... 3 Normal Plot... 4 Lognormal Plot... 4 Weibull Plot... Extreme Value Plot...
Hybrid Censoring; An Introduction 2
 Hybrid Censoring; An Introduction 2 Debasis Kundu Department of Mathematics & Statistics Indian Institute of Technology Kanpur 23-rd November, 2010 2 This is a joint work with N. Balakrishnan Debasis Kundu
DS1210, Rev C1. Dallas Semiconductor
 3/19/23 RELIABILITY REPORT FOR DS121, Rev C1 Dallas Semiconductor 441 South Beltwood Parkway Dallas, TX 75244-3292 Prepared by: Ken Wendel Reliability Engineering Manager Dallas Semiconductor 441 South
23.0 Introduction Review
 ECE 650R: Reliability Physics of Nanoelectronic Devices Lecture 22: TDDB Statistics Date: Nov. 0, 2006 Class Notes: Lutfe Siddiqui Review: Saakshi Gangwal 23.0 Introduction Time dependent dielectric breakdown
Frequentist-Bayesian Model Comparisons: A Simple Example
 Frequentist-Bayesian Model Comparisons: A Simple Example Consider data that consist of a signal y with additive noise: Data vector (N elements): D = y + n The additive noise n has zero mean and diagonal
Source Data Applicability Impacts On Epistemic Uncertainty For Launch Vehicle Fault Tree Models
 Source Data Applicability Impacts On Epistemic Uncertainty For Launch Vehicle Fault Tree Models Society Of Reliability Engineers Huntsville Chapter Redstone Arsenal May 11, 2016 Mohammad AL Hassan, Steven
Accelerated Destructive Degradation Test Planning
 Accelerated Destructive Degradation Test Planning Ying Shi Dept. of Statistics Iowa State University Ames, IA 50011 yshi@iastate.edu Luis A. Escobar Dept. of Experimental Statistics Louisiana State University
Forecasting Wind Ramps
 Forecasting Wind Ramps Erin Summers and Anand Subramanian Jan 5, 20 Introduction The recent increase in the number of wind power producers has necessitated changes in the methods power system operators
Semiparametric Regression
 Semiparametric Regression Patrick Breheny October 22 Patrick Breheny Survival Data Analysis (BIOS 7210) 1/23 Introduction Over the past few weeks, we ve introduced a variety of regression models under
EXAMINATIONS OF THE ROYAL STATISTICAL SOCIETY
 EXAMINATIONS OF THE ROYAL STATISTICAL SOCIETY GRADUATE DIPLOMA, 2016 MODULE 1 : Probability distributions Time allowed: Three hours Candidates should answer FIVE questions. All questions carry equal marks.
Design of Optimal Bayesian Reliability Test Plans for a Series System
 Volume 109 No 9 2016, 125 133 ISSN: 1311-8080 (printed version); ISSN: 1314-3395 (on-line version) url: http://wwwijpameu ijpameu Design of Optimal Bayesian Reliability Test Plans for a Series System P
Parameter Estimation and Fitting to Data
 Parameter Estimation and Fitting to Data Parameter estimation Maximum likelihood Least squares Goodness-of-fit Examples Elton S. Smith, Jefferson Lab 1 Parameter estimation Properties of estimators 3 An
Exponential Family and Maximum Likelihood, Gaussian Mixture Models and the EM Algorithm. by Korbinian Schwinger
 Exponential Family and Maximum Likelihood, Gaussian Mixture Models and the EM Algorithm by Korbinian Schwinger Overview Exponential Family Maximum Likelihood The EM Algorithm Gaussian Mixture Models Exponential
Bayesian Analysis of Simple Step-stress Model under Weibull Lifetimes
 Bayesian Analysis of Simple Step-stress Model under Weibull Lifetimes A. Ganguly 1, D. Kundu 2,3, S. Mitra 2 Abstract Step-stress model is becoming quite popular in recent times for analyzing lifetime
STAT 6350 Analysis of Lifetime Data. Failure-time Regression Analysis
 STAT 6350 Analysis of Lifetime Data Failure-time Regression Analysis Explanatory Variables for Failure Times Usually explanatory variables explain/predict why some units fail quickly and some units survive
Basis of the theory behind FIDES Methodology
 Basis of the theory behind FIDES Methodology ASTR Workshop, St. Paul 0 th to 2 th September 204 Franck Bayle Thales Avionics Chanthachith Souvanthong ON Semiconductor Assumptions of reliability prediction
MODIFIED MONTE CARLO WITH LATIN HYPERCUBE METHOD
 MODIFIED MONTE CARLO WITH LATIN HYPERCUBE METHOD Latin hypercube sampling (LHS) was introduced by McKay, Conover and Beckman as a solution to increase the efficiency of computer simulations. This technique
RELIABILITY OF FLEET OF AIRCRAFT
 Session 2. Reliability and Maintenance Proceedings of the 12 th International Conference Reliability and Statistics in Transportation and Communication (RelStat 12), 17 2 October 212, Riga, Latvia, p.
Point and Interval Estimation for Gaussian Distribution, Based on Progressively Type-II Censored Samples
 90 IEEE TRANSACTIONS ON RELIABILITY, VOL. 52, NO. 1, MARCH 2003 Point and Interval Estimation for Gaussian Distribution, Based on Progressively Type-II Censored Samples N. Balakrishnan, N. Kannan, C. T.
Confidence Intervals. Confidence interval for sample mean. Confidence interval for sample mean. Confidence interval for sample mean
 Confidence Intervals Confidence interval for sample mean The CLT tells us: as the sample size n increases, the sample mean is approximately Normal with mean and standard deviation Thus, we have a standard
Fall 2017 STAT 532 Homework Peter Hoff. 1. Let P be a probability measure on a collection of sets A.
 1. Let P be a probability measure on a collection of sets A. (a) For each n N, let H n be a set in A such that H n H n+1. Show that P (H n ) monotonically converges to P ( k=1 H k) as n. (b) For each n
Chapter 5. System Reliability and Reliability Prediction.
 Chapter 5. System Reliability and Reliability Prediction. Problems & Solutions. Problem 1. Estimate the individual part failure rate given a base failure rate of 0.0333 failure/hour, a quality factor of
Bayesian Methods for Accelerated Destructive Degradation Test Planning
 Statistics Preprints Statistics 11-2010 Bayesian Methods for Accelerated Destructive Degradation Test Planning Ying Shi Iowa State University William Q. Meeker Iowa State University, wqmeeker@iastate.edu
Applications of Reliability Demonstration Test
 Applications of Reliability Demonstration Test Winson Taam Applied Statistics, NST, BR&T Jun 3, 2009 BOEING is a trademark of Boeing Management Company. EOT_RT_Sub_Template.ppt 1/6/2009 1 Outline Concept
Quality Control Using Inferential Statistics In Weibull Based Reliability Analyses S. F. Duffy 1 and A. Parikh 2
 Quality Control Using Inferential Statistics In Weibull Based Reliability Analyses S. F. Duffy 1 and A. Parikh 2 1 Cleveland State University 2 N & R Engineering www.inl.gov ASTM Symposium on Graphite
Non-observable failure progression
 Non-observable failure progression 1 Age based maintenance policies We consider a situation where we are not able to observe failure progression, or where it is impractical to observe failure progression:
MagnePc pole oxidapon acpvapon energy evaluapon
 Biography Yuhang Cheng got his PhD degree from the department of Materials Science and Engineering, Huazhong University of Science and Technology, China, in 1997. AGer that, he worked in the fields of
Checking the Reliability of Reliability Models.
 Checking the Reliability of Reliability. INFORMS 007 Puerto Rico. July 8-11. Víctor Aguirre Torres Stat Department Instituto Tecnológico Autónomo de México ITAM Credits. Partially Sponsored by Asociación
Effects of Stresses in Highly Accelerated Limit Test (HALT)
") Technical Report Effects of Stresses in Highly Accelerated Limit Test (HALT) Takuya Hirata, Raphael Pihet and Yuichi Aoki, Development Headquarters, ESPEC CORP. Abstract The effects of vibration stress
Technical Report Effects of Stresses in Highly Accelerated Limit Test (HALT) Takuya Hirata, Raphael Pihet and Yuichi Aoki, Development Headquarters, ESPEC CORP. Abstract The effects of vibration stress
8. Parametric models in survival analysis General accelerated failure time models for parametric regression
 8. Parametric models in survival analysis 8.1. General accelerated failure time models for parametric regression The accelerated failure time model Let T be the time to event and x be a vector of covariates.
A general Bayes weibull inference model for accelerated life testing
 A general Bayes weibull inference model for accelerated life testing J. René Van Dorp, Thomas A. Mazzuchi* Depratmenty of Engineering Management and Systems Engineering The George Washington University,
Lab 8. Matched Case Control Studies
 Lab 8 Matched Case Control Studies Control of Confounding Technique for the control of confounding: At the design stage: Matching During the analysis of the results: Post-stratification analysis Advantage
p y (1 p) 1 y, y = 0, 1 p Y (y p) = 0, otherwise.
 1 y, y = 0, 1 p Y (y p) = 0, otherwise.") 1. Suppose Y 1, Y 2,..., Y n is an iid sample from a Bernoulli(p) population distribution, where 0 < p < 1 is unknown. The population pmf is p y (1 p) 1 y, y = 0, 1 p Y (y p) = (a) Prove that Y is the
1. Suppose Y 1, Y 2,..., Y n is an iid sample from a Bernoulli(p) population distribution, where 0 < p < 1 is unknown. The population pmf is p y (1 p) 1 y, y = 0, 1 p Y (y p) = (a) Prove that Y is the
Estimation of System Reliability for Dynamic Stress-Strength Modeling with Cumulative Stress and Strength Degradation
 Estimation of System Reliability for Dynamic Stress-Strength Modeling with Cumulative Stress and Strength Degradation Technical Report No. ASU/2015/3 Dated: 20 November, 2015 Prajamitra Bhuyan Applied