Practice Problems Section Problems
|
|
|
- Veronica Evans
- 5 years ago
- Views:
Transcription
1 Practice Problems Section Supplemental Problems 4-1 to , 14, 15, 17, 19, 0 4-3, 34, 36, , 49, 5, 54, , 60, , 68, 69, 70, , 81, , 86, 88, , 96
2 4-1 Statistical Inference The field of statistical inference consists of those methods used to make decisions or draw conclusions about a population. These methods utilize the information contained in a sample from the population in drawing conclusions.

3 4-1 Statistical Inference 4- Point Estimation
4 4- Point Estimation 4- Point Estimation
5 General Concepts of Point Estimation Point Estimator A point estimator of a parameter is a single number that can be regarded as a sensible value for. A point estimator can be obtained by selecting a suitable statistic and computing its value from the given sample data.
6 Unbiased Estimator ˆ A point estimator is said to be an unbiased estimator of if E( ˆ ) for every possible value of. If ˆ biased, the difference E( ˆ ) is called the bias of ˆ. is The pdf s of a biased estimator ˆ 1 and an unbiased estimator ˆ for a parameter. pdf of ˆ pdf of ˆ 1 Bias of 1

7 The pdf s of a biased estimator ˆ 1 and an unbiased estimator ˆ for a parameter. pdf of ˆ Bias of 1 pdf of ˆ 1 Unbiased Estimator When X is a binomial rv with parameters n and p, the sample proportion pˆ X / n is an unbiased estimator of p.
8 Principle of Unbiased Estimation When choosing among several different estimators of, select one that is unbiased. Unbiased Estimator Unbiased Estimates: A point estimate ˆ of a parameter is unbiased if E( ˆ) bias E( ˆ )
9 Unbiased Estimator Unbiased estimate of a success probability of a binomial rv X, X pˆ. n Unbiased estimate of population mean, ˆ Unbiased estimate of population variance, ˆ S 1 n 1 n i1 ( X i X ) Note: Capital letters = theoretical meanings X Principle of Minimum Variance Unbiased Estimation Among all estimators of that are unbiased, choose the one that has the minimum variance. The resulting ˆ is called the minimum variance unbiased estimator (MVUE) of.
10 Graphs of the pdf s of two different unbiased estimators pdf of ˆ 1 pdf of ˆ MVUE for a Normal Distribution Let X 1, X,,X n be a random sample from a normal distribution with parameters and. Then the estimator is the MVUE for. ˆ X
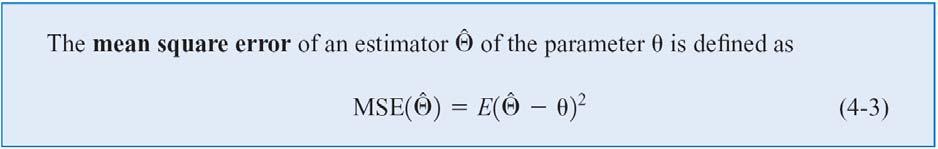
11 A biased estimator that is preferable to the MVUE pdf of ˆ (biased) 1 pdf of ˆ (the MVUE) Mean Square Error Mean square error: The expectation of the squared deviation of the point estimate about the value of the parameter of interest. ˆ Var( ˆ) MSE( ˆ) E bias In general the variance of good point estimates decrease as the sample size increases.
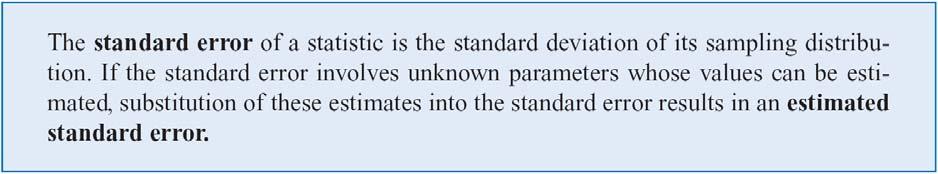
12 Relative Efficiency We can compare estimators by looking at MSE, where the one with smaller MSE being a better estimator. Another way is to compute relative efficiency MSE( ˆ 1) relative efficiency MSE( ˆ ) If rel.eff. > 1, ˆ is better. Standard Error ˆ = V ( ˆ ) The standard error of an estimator its standard deviation ˆ. If the standard error itself involves unknown parameters whose values can be estimated, substitution into ˆ yields the estimated standard error of the estimator, denoted ˆ or s. ˆ ˆ is
13 Methods of Point Estimation Method of Moments Let X 1, X,,X n be a random sample from a pmf or pdf f (x). For k = 1,, The k th population moment, or k th k moment of the distribution f (x) is E( X ). The k th sample moment is 1 n k X. i1 i n
14 Moment Estimators Let X 1, X,,X n be a random sample from a distribution with pmf or pdf f( x;,..., ), where,..., 1 m 1 are parameters whose values are unknown. Then the moment estimators,..., are obtained by equating the first 1 m m sample moments to the corresponding first m population moments and solving for,...,. 1 m m Practice Exponential Normal Gamma Other distributions on your own Note:Try them all, and one of them may be on the final exam
15 Parameter Estimation Using The Method of Maximum Likelihood The idea: Consider a set of data values x, that are 1 x,..., x n independent observations from a population that has probability density function f ( x, ). For only one observation, say x 1, the density probability function of observing this observation can be written as f ( x 1, ) Now for a sample containing a set of data values, the density probability function of observing these observations is a joint density function f x, x,..., ) f ( x 1, ) f ( x, ) f ( x, ) ( 1 x n n n Parameter Estimation Using MLE Let us call the joint density function the likelihood function, and the estimate from this function, the maximum likelihood estimate (MLE). L ( 1 x1, x,..., xn, ) f ( x, ) f ( xn, ) f ( xn, ) The goal is to find the most likely value of the parameter that maximizes the probability of observing this set of data in our sample.
16 Parameter Estimation Using MLE This is done by taking a derivative of the likelihood function with respect to the parameter value. It is often more convenient that the natural log of the likelihood function is taken before differentiating the function. This can be done because the natural log function is monotonic, thus, maximizing the log-likelihood is equivalent to maximizing the likelihood. The steps are as follows: Write f ( x, ). Write L f ( x 1, ) f ( xn, ) f ( xn, ). Rearrange the term using sum and product. Take the natural-log log L. Take the 1 st derivative with respect to the parameter and set it to zero d logl 0 d (or the Gradient for more than one parameter). Take the nd derivative and check whether it is a maximum, i.e. it should always be negative d logl 0 (or 0) d (or the Hessian must be ND or NSD, for more than one parameter).
17 An Example Poisson Distribution The steps are as follows: Write Write Rearrange the term Take the natural-log! ) ; ( x e x f x ) ; (... ) ; ( ) ; ( 1 n x f x f x f L!... 1!! 1 n x x x x e x e x e n n i i x n x e L n i i 1! 1 n i i n i x i x n L 1 1! log log log An Example Poisson Distribution (Cont.) Take the 1 st derivative with respect to the parameter and set it to zero Take the nd derivative and check whether it is a maximum, i.e. it should always be negative 0 log 1 n i x i n d L d x nx n 0 0 log x n d L d
18 The Invariance Principle ˆ,..., ˆ m,..., 1 m Let 1 parameters be the MLE s of the Then the MLE of any function h( 1,..., m ) of these parameters is the function of the MLE s or, ˆ ˆ (,..., ) h 1 m Desirable Property of the Maximum Likelihood Estimate Under very general conditions on the joint distribution of the sample, when the sample size n is large, the maximum likelihood estimator of any parameter is approx. unbiased [ E( ˆ ) ] and has variance that is nearly as small as can be achieved by any estimator. mle ˆ MVUE of
19 Practice Geometric Exponential Weibull Other distributions on your own Note:Try them all, and one of them may be on the final exam 4-3 Hypothesis Testing Statistical Hypotheses We like to think of statistical hypothesis testing as the data analysis stage of a comparative experiment, in which the engineer is interested, for example, in comparing the mean of a population to a specified value (e.g. mean pull strength).
20 4-3 Hypothesis Testing Statistical Hypotheses For example, suppose that we are interested in the burning rate of a solid propellant used to power aircrew escape systems. Now burning rate is a random variable that can be described by a probability distribution. Suppose that our interest focuses on the mean burning rate (a parameter of this distribution). Specifically, we are interested in deciding whether or not the mean burning rate is 50 centimeters per second. 4-3 Hypothesis Testing Statistical Hypotheses Two-sided Alternative Hypothesis One-sided Alternative Hypotheses
21 4-3 Hypothesis Testing Statistical Hypotheses Test of a Hypothesis A procedure leading to a decision about a particular hypothesis Hypothesis-testing procedures rely on using the information in a random sample from the population of interest. If this information is consistent with the hypothesis, then we will conclude that the hypothesis is true; if this information is inconsistent with the hypothesis, we will conclude that the hypothesis is false. 4-3 Hypothesis Testing 4-3. Testing Statistical Hypotheses

22 4-3 Hypothesis Testing 4-3. Testing Statistical Hypotheses 4-3 Hypothesis Testing 4-3. Testing Statistical Hypotheses Sometimes the type I error probability is called the significance level, or the -error, or the size of the test.
23 4-3 Hypothesis Testing 4-3. Testing Statistical Hypotheses 4-3 Hypothesis Testing 4-3. Testing Statistical Hypotheses
24 4-3 Hypothesis Testing 4-3. Testing Statistical Hypotheses 4-3 Hypothesis Testing 4-3. Testing Statistical Hypotheses

25 4-3 Hypothesis Testing 4-3. Testing Statistical Hypotheses 4-3 Hypothesis Testing 4-3. Testing Statistical Hypotheses The power is computed as 1 -, and power can be interpreted as the probability of correctly rejecting a false null hypothesis. We often compare statistical tests by comparing their power properties. For example, consider the propellant burning rate problem when we are testing H 0 : = 50 centimeters per second against H 1 : not equal 50 centimeters per second. Suppose that the true value of the mean is = 5. When n = 10, we found that = 0.643, so the power of this test is 1 - = = when = 5.
26 4-3 Hypothesis Testing One-Sided and Two-Sided Hypotheses Two-Sided Test: One-Sided Tests: How to write hypothesis statement For -sided hypothesis: Plain and simple Write hypotheses in terms of population parameters, NOT statistics Write specific statement in the null hypothesis Null hypothesis and alternative hypothesis should cover the space of the parameter values
27 How to write hypothesis statement For 1-sided hypothesis: Be careful, it could be confusing sometimes Look for words like Words like more than, greater than, at least all means > ; (in this context, at least is not ) Similarly, less than, no more than, not exceeding all means < (not ) Translate these words correctly: slower, faster, better, at least as low as, etc. How to write hypothesis statement For 1-sided hypothesis (continued): Translate the question of interest in the problem statement into mathematical/logical sign, then place the statement in the alternative hypothesis Then, put an opposite statement with equal sign ( or ) in the null hypothesis Remember, the alternative hypothesis should always contain: Statement we want to have sufficient evidence to support Statement we want to conclude with confidence Then, turn them into proper sign when writing the hypotheses
28 4-3 Hypothesis Testing P-Values in Hypothesis Testing 4-3 Hypothesis Testing General Procedure for Hypothesis Testing
 P-value is greater than 0.1 Do not reject P-value is less than 0.01 Reject P-value is between 0.01 and 0.")
 More conservative people/application may use a criteria less than 0.")
29 Preferred Procedure Steps 1-4, and 6 are the same Skip step 5 Step 7 is concluded based on the p-value General criteria (in this class) P-value is greater than 0.1 Do not reject P-value is less than 0.01 Reject P-value is between 0.01 and 0.1 Grey area, need more data Note: Less conservative people/application, 0.05 may be used instead of 0.01 (I don t recommend) More conservative people/application may use a criteria less than 0.01 depending on experience 4-4 Inference on the Mean of a Population, Variance Known Assumptions
30 4-4 Inference on the Mean of a Population, Variance Known Hypothesis Testing on the Mean We wish to test: The test statistic is: 4-4 Inference on the Mean of a Population, Variance Known Hypothesis Testing on the Mean Reject H 0 if the observed value of the test statistic z 0 is either: Fail to reject H 0 if or

31 4-4 Inference on the Mean of a Population, Variance Known Hypothesis Testing on the Mean 4-4 Inference on the Mean of a Population, Variance Known Hypothesis Testing on the Mean


32 4-4 Inference on the Mean of a Population, Variance Known 4-4. Type II Error and Choice of Sample Size Finding The Probability of Type II Error 4-4 Inference on the Mean of a Population, Variance Known 4-4. Type II Error and Choice of Sample Size Sample Size Formulas


33 4-4 Inference on the Mean of a Population, Variance Known 4-4. Type II Error and Choice of Sample Size Sample Size Formulas 4-4 Inference on the Mean of a Population, Variance Known 4-4. Type II Error and Choice of Sample Size
34 4-4 Inference on the Mean of a Population, Variance Known 4-4. Type II Error and Choice of Sample Size 4-4 Inference on the Mean of a Population, Variance Known Large Sample Test In general, if n 30, the sample variance s will be close to for most samples, and so s can be substituted for in the test procedures with little harmful effect.

35 4-4 Inference on the Mean of a Population, Variance Known Some Practical Comments on Hypothesis Testing The Seven-Step Procedure Only three steps are really required: 4-4 Inference on the Mean of a Population, Variance Known Some Practical Comments on Hypothesis Testing Statistical versus Practical Significance

36 4-4 Inference on the Mean of a Population, Variance Known Some Practical Comments on Hypothesis Testing Statistical versus Practical Significance 4-4 Inference on the Mean of a Population, Variance Known Confidence Interval on the Mean Two-sided confidence interval: One-sided confidence intervals: Confidence coefficient:
37 4-4 Inference on the Mean of a Population, Variance Known Confidence Interval on the Mean 4-4 Inference on the Mean of a Population, Variance Known Confidence Interval on the Mean
 percent confidence interval for the parameter, then the test of")
38 4-4 Inference on the Mean of a Population, Variance Known Confidence Interval on the Mean 4-4 Inference on the Mean of a Population, Variance Known Confidence Interval on the Mean Relationship between Tests of Hypotheses and Confidence Intervals If [l,u] is a 100(1 - ) percent confidence interval for the parameter, then the test of significance level of the hypothesis will lead to rejection of H 0 if and only if the hypothesized value is not in the 100(1 - ) percent confidence interval [l, u].

39 4-4 Inference on the Mean of a Population, Variance Known Confidence Interval on the Mean Confidence Level and Precision of Estimation The length of the two-sided 95% confidence interval is whereas the length of the two-sided 99% confidence interval is 4-4 Inference on the Mean of a Population, Variance Known Confidence Interval on the Mean Choice of Sample Size

40 4-4 Inference on the Mean of a Population, Variance Known Confidence Interval on the Mean Choice of Sample Size 4-4 Inference on the Mean of a Population, Variance Known Confidence Interval on the Mean Choice of Sample Size

41 4-4 Inference on the Mean of a Population, Variance Known Confidence Interval on the Mean One-Sided Confidence Bounds 4-4 Inference on the Mean of a Population, Variance Known General Method for Deriving a Confidence Interval
42 4-5 Inference on the Mean of a Population, Variance Unknown Hypothesis Testing on the Mean 4-5 Inference on the Mean of a Population, Variance Unknown Hypothesis Testing on the Mean
43 4-5 Inference on the Mean of a Population, Variance Unknown Hypothesis Testing on the Mean 4-5 Inference on the Mean of a Population, Variance Unknown Hypothesis Testing on the Mean Calculating the P-value

44 4-5 Inference on the Mean of a Population, Variance Unknown Hypothesis Testing on the Mean 4-5 Inference on the Mean of a Population, Variance Unknown Hypothesis Testing on the Mean
45 4-5 Inference on the Mean of a Population, Variance Unknown Hypothesis Testing on the Mean 4-5 Inference on the Mean of a Population, Variance Unknown Hypothesis Testing on the Mean
46 4-5 Inference on the Mean of a Population, Variance Unknown 4-5. Type II Error and Choice of Sample Size Fortunately, this unpleasant task has already been done, and the results are summarized in a series of graphs in Appendix A Charts Va, Vb, Vc, and Vd that plot for the t-test against a parameter for various sample sizes n. 4-5 Inference on the Mean of a Population, Variance Unknown 4-5. Type II Error and Choice of Sample Size These graphics are called operating characteristic (or OC) curves. Curves are provided for two-sided alternatives on Charts Va and Vb. The abscissa scale factor d on these charts is defined as

47 4-5 Inference on the Mean of a Population, Variance Unknown Confidence Interval on the Mean 4-5 Inference on the Mean of a Population, Variance Unknown Confidence Interval on the Mean
48 4-5 Inference on the Mean of a Population, Variance Unknown Confidence Interval on the Mean 4-6 Inference on the Variance of a Normal Population Hypothesis Testing on the Variance of a Normal Population

49 4-6 Inference on the Variance of a Normal Population Hypothesis Testing on the Variance of a Normal Population 4-6 Inference on the Variance of a Normal Population Hypothesis Testing on the Variance of a Normal Population

50 4-6 Inference on the Variance of a Normal Population Hypothesis Testing on the Variance of a Normal Population 4-6 Inference on the Variance of a Normal Population Hypothesis Testing on the Variance of a Normal Population

51 4-6 Inference on the Variance of a Normal Population Hypothesis Testing on the Variance of a Normal Population 4-6 Inference on the Variance of a Normal Population 4-6. Confidence Interval on the Variance of a Normal Population


52 4-7 Inference on Population Proportion Hypothesis Testing on a Binomial Proportion We will consider testing: 4-7 Inference on Population Proportion Hypothesis Testing on a Binomial Proportion
53 4-7 Inference on Population Proportion Hypothesis Testing on a Binomial Proportion 4-7 Inference on Population Proportion Hypothesis Testing on a Binomial Proportion

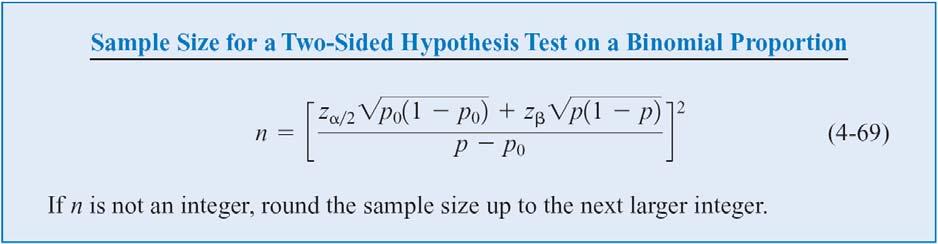
54 4-7 Inference on Population Proportion 4-7. Type II Error and Choice of Sample Size 4-7 Inference on Population Proportion 4-7. Type II Error and Choice of Sample Size


55 4-7 Inference on Population Proportion Confidence Interval on a Binomial Proportion 4-7 Inference on Population Proportion Confidence Interval on a Binomial Proportion


56 4-7 Inference on Population Proportion Confidence Interval on a Binomial Proportion Choice of Sample Size 4-8 Other Interval Estimates for a Single Sample Prediction Interval

57 4-8 Other Interval Estimates for a Single Sample 4-8. Tolerance Intervals for a Normal Distribution 4-10 Testing for Goodness of Fit So far, we have assumed the population or probability distribution for a particular problem is known. There are many instances where the underlying distribution is not known, and we wish to test a particular distribution. Use a goodness-of-fit test procedure based on the chisquare distribution.
58 Goodness-of-Fit Tests Conduct hypothesis testing on data distribution: Chi-square test Likelihood ratio test No single correct distribution in a real application exists. If very little data are available, it is unlikely to reject any candidate distributions If a lot of data are available, it is likely to reject all candidate distributions Chi-Square test Intuition: comparing the histogram of the data to the shape of the candidate density or mass function Valid for large sample sizes when parameters are estimated by maximum likelihood By arranging the n observations into a set of k class intervals or cells, the test statistics is: Observed Frequency 0 k i1 ( O E ) i E i i Expected Frequency E i = n*p i where p i is the theoretical prob. of the ith interval. Suggested Minimum = 5 which approximately follows the chi-square distribution with k-s-1 degrees of freedom, where s = # of parameters of the hypothesized distribution estimated by the sample statistics.
59 Chi-Square test The hypothesis of a chi-square test is: H 0 : The random variable, X, conforms to the distributional assumption with the given parameters (or by the estimates). H 1 : The random variable X does not conform. Example H 0 : Student weights (X) are normally distributed (distributional assumption) with the mean weight of 55 kg (given parameter) or, H 0 : Student weights (X) are normally distributed (distributional assumption) in this case the value of the parameter is estimated from the sample. H 1 : Not the case Chi-Square test If the distribution tested is discrete and combining adjacent cell is not required (so that E i > minimum requirement): UsuallyE i is required to be at least 5 Each value of the random variable should be a class interval, unless combining is necessary, and p i p(x i ) P(X x i )
60 Chi-Square test If the distribution tested is continuous: p i a i a i 1 f ( x) dx F( ai ) F( ai 1) where a i -1 and a i are the endpoints of the i th class interval and f(x) is the assumed pdf, F(x) is the assumed cdf. Recommended number of class intervals (k): Sample Size, n Number of Class Intervals, k 0 Do not use the chi-square test 50 5 to to 0 > 100 n 1/ to n/5 Caution: Different grouping of data (i.e., k) can affect the hypothesis testing result. Vehicle Arrival Example: H 0 : the random variable is Poisson distributed. H 1 : the random variable is not Poisson distributed. x i Observed Frequency, O i Expected Frequency, E i (O i - E i ) /E i Ei np( x) x x! e n > Combined because of min E i Degree of freedom is k-s-1 = = 5, hence, the hypothesis is rejected at the 0.05 level of significance ,5 11.1
61 Steps in Chi-Square Test H 0 : The X 1, X,..., X n are IID random variables with distribution function Fˆ Note that accepting H 0 distributed as Fˆ!! does not mean that the data are truly Step 1: Divide the range of the fitted distribution into k adjacent intervals, a, ), a, ),, a, a ); a or a or both. [ a 0 1 [ 1 a [ k 1 k Step : Count the observed frequency 0 O j in each interval. k Steps in Chi-Square Test (Cont.) Step 3: Compute the expected proportion For continuous, p For discrete, p j a j a j 1 j x j a x a j 1 Then, compute the expected frequency Step 4: Compute the chi-square test statistic p j in each interval. fˆ ( x) dx, where f ˆ( x) is the pdf. j pˆ ( ) where p ˆ( x) is the pmf. j E np in each interval. j j k reject H 0 with confidence (1-) 100% if > k m 1, where m = # of estimated parameter(s). j 1 O j E E j j 1, v. We with
62 Setting the Equi-probable Intervals The equiprobable intervals use p 1 p... pk. Set each interval to have np 5, thus, we let Set expected probability n E j. k Let end points be solving j n k. 5 1 p j, thus, the expected frequency k a j, j 1,,..., k, then we solve for each a j by j Fˆ. k a j 1 Exercise: Chi-Square Test In-Class Exercise: Suppose that 50 interarrival times (in minutes) are collected over the following 100-minute interval. Test the null hypothesis that the interarrival times are exponentially distributed. The data are sorted as follows
63 In-Class Exercise (Cont.) j a j Interval [0, 0.6) [0.6, 0.56) [0.56, 0.9) [0.9, 1.35) [1.35, 1.91) [1.91,.70) [.70, 4.05) [4.05, ) Observed Frequency O j Expected Frequency E j N j np np j j Interval Observed Frequency O j Expected Frequency E j The degree of freedom is k m The critical value from the chi-square table with 6, Therefore, we cannot reject the hypothesis that the data are exponentially distributed ( = 3.36 < 1. 59). 6,0.05 j np [0, 0.6) [0.6, 0.56) [0.56, 0.9) [0.9, 1.35) [1.35, 1.91) [1.91,.70) [.70, 4.05) [4.05, ) N np 3.36 j j
64 Likelihood Ratio Test A better test than Chi-Square test Instead of X statistic, compute the likelihood ratio G statistic k O i G O i ln i1 Ei In the previous example, this G statistic would be G 5ln ln ln which has a higher p-value (easier NOT to reject)
CH.9 Tests of Hypotheses for a Single Sample
 CH.9 Tests of Hypotheses for a Single Sample Hypotheses testing Tests on the mean of a normal distributionvariance known Tests on the mean of a normal distributionvariance unknown Tests on the variance
ME3620. Theory of Engineering Experimentation. Spring Chapter IV. Decision Making for a Single Sample. Chapter IV
 Theory of Engineering Experimentation Chapter IV. Decision Making for a Single Sample Chapter IV 1 4 1 Statistical Inference The field of statistical inference consists of those methods used to make decisions
Dr. Maddah ENMG 617 EM Statistics 10/15/12. Nonparametric Statistics (2) (Goodness of fit tests)
 (Goodness of fit tests)") Dr. Maddah ENMG 617 EM Statistics 10/15/12 Nonparametric Statistics (2) (Goodness of fit tests) Introduction Probability models used in decision making (Operations Research) and other fields require fitting
Dr. Maddah ENMG 617 EM Statistics 10/15/12 Nonparametric Statistics (2) (Goodness of fit tests) Introduction Probability models used in decision making (Operations Research) and other fields require fitting
Math Review Sheet, Fall 2008
 1 Descriptive Statistics Math 3070-5 Review Sheet, Fall 2008 First we need to know about the relationship among Population Samples Objects The distribution of the population can be given in one of the
Modeling and Performance Analysis with Discrete-Event Simulation
 Simulation Modeling and Performance Analysis with Discrete-Event Simulation Chapter 9 Input Modeling Contents Data Collection Identifying the Distribution with Data Parameter Estimation Goodness-of-Fit
Review. December 4 th, Review
 December 4 th, 2017 Att. Final exam: Course evaluation Friday, 12/14/2018, 10:30am 12:30pm Gore Hall 115 Overview Week 2 Week 4 Week 7 Week 10 Week 12 Chapter 6: Statistics and Sampling Distributions Chapter
Statistics - Lecture One. Outline. Charlotte Wickham 1. Basic ideas about estimation
 Statistics - Lecture One Charlotte Wickham wickham@stat.berkeley.edu http://www.stat.berkeley.edu/~wickham/ Outline 1. Basic ideas about estimation 2. Method of Moments 3. Maximum Likelihood 4. Confidence
Computer Science, Informatik 4 Communication and Distributed Systems. Simulation. Discrete-Event System Simulation. Dr.
 Simulation Discrete-Event System Simulation Chapter 8 Input Modeling Purpose & Overview Input models provide the driving force for a simulation model. The quality of the output is no better than the quality
TUTORIAL 8 SOLUTIONS #
 TUTORIAL 8 SOLUTIONS #9.11.21 Suppose that a single observation X is taken from a uniform density on [0,θ], and consider testing H 0 : θ = 1 versus H 1 : θ =2. (a) Find a test that has significance level
Basic Concepts of Inference
 Basic Concepts of Inference Corresponds to Chapter 6 of Tamhane and Dunlop Slides prepared by Elizabeth Newton (MIT) with some slides by Jacqueline Telford (Johns Hopkins University) and Roy Welsch (MIT).
Two hours. To be supplied by the Examinations Office: Mathematical Formula Tables THE UNIVERSITY OF MANCHESTER. 21 June :45 11:45
 Two hours MATH20802 To be supplied by the Examinations Office: Mathematical Formula Tables THE UNIVERSITY OF MANCHESTER STATISTICAL METHODS 21 June 2010 9:45 11:45 Answer any FOUR of the questions. University-approved
Sociology 6Z03 Review II
 Sociology 6Z03 Review II John Fox McMaster University Fall 2016 John Fox (McMaster University) Sociology 6Z03 Review II Fall 2016 1 / 35 Outline: Review II Probability Part I Sampling Distributions Probability
Table of z values and probabilities for the standard normal distribution. z is the first column plus the top row. Each cell shows P(X z).
.") Table of z values and probabilities for the standard normal distribution. z is the first column plus the top row. Each cell shows P(X z). For example P(X.04) =.8508. For z < 0 subtract the value from,
Table of z values and probabilities for the standard normal distribution. z is the first column plus the top row. Each cell shows P(X z). For example P(X.04) =.8508. For z < 0 subtract the value from,
Qualifying Exam CS 661: System Simulation Summer 2013 Prof. Marvin K. Nakayama
 Qualifying Exam CS 661: System Simulation Summer 2013 Prof. Marvin K. Nakayama Instructions This exam has 7 pages in total, numbered 1 to 7. Make sure your exam has all the pages. This exam will be 2 hours
M(t) = 1 t. (1 t), 6 M (0) = 20 P (95. X i 110) i=1
 = 1 t. (1 t), 6 M (0) = 20 P (95. X i 110) i=1") Math 66/566 - Midterm Solutions NOTE: These solutions are for both the 66 and 566 exam. The problems are the same until questions and 5. 1. The moment generating function of a random variable X is M(t)
Math 66/566 - Midterm Solutions NOTE: These solutions are for both the 66 and 566 exam. The problems are the same until questions and 5. 1. The moment generating function of a random variable X is M(t)
CONTINUOUS RANDOM VARIABLES
 the Further Mathematics network www.fmnetwork.org.uk V 07 REVISION SHEET STATISTICS (AQA) CONTINUOUS RANDOM VARIABLES The main ideas are: Properties of Continuous Random Variables Mean, Median and Mode
STAT 135 Lab 5 Bootstrapping and Hypothesis Testing
 STAT 135 Lab 5 Bootstrapping and Hypothesis Testing Rebecca Barter March 2, 2015 The Bootstrap Bootstrap Suppose that we are interested in estimating a parameter θ from some population with members x 1,...,
Preface Introduction to Statistics and Data Analysis Overview: Statistical Inference, Samples, Populations, and Experimental Design The Role of
 Preface Introduction to Statistics and Data Analysis Overview: Statistical Inference, Samples, Populations, and Experimental Design The Role of Probability Sampling Procedures Collection of Data Measures
1/24/2008. Review of Statistical Inference. C.1 A Sample of Data. C.2 An Econometric Model. C.4 Estimating the Population Variance and Other Moments
 /4/008 Review of Statistical Inference Prepared by Vera Tabakova, East Carolina University C. A Sample of Data C. An Econometric Model C.3 Estimating the Mean of a Population C.4 Estimating the Population
OHSU OGI Class ECE-580-DOE :Statistical Process Control and Design of Experiments Steve Brainerd Basic Statistics Sample size?
 ECE-580-DOE :Statistical Process Control and Design of Experiments Steve Basic Statistics Sample size? Sample size determination: text section 2-4-2 Page 41 section 3-7 Page 107 Website::http://www.stat.uiowa.edu/~rlenth/Power/
Primer on statistics:
 Primer on statistics: MLE, Confidence Intervals, and Hypothesis Testing ryan.reece@gmail.com http://rreece.github.io/ Insight Data Science - AI Fellows Workshop Feb 16, 018 Outline 1. Maximum likelihood
Statistical Inference
 Statistical Inference Classical and Bayesian Methods Revision Class for Midterm Exam AMS-UCSC Th Feb 9, 2012 Winter 2012. Session 1 (Revision Class) AMS-132/206 Th Feb 9, 2012 1 / 23 Topics Topics We will
Modern Methods of Data Analysis - WS 07/08
 Modern Methods of Data Analysis Lecture VIc (19.11.07) Contents: Maximum Likelihood Fit Maximum Likelihood (I) Assume N measurements of a random variable Assume them to be independent and distributed according
Module 6: Methods of Point Estimation Statistics (OA3102)
") Module 6: Methods of Point Estimation Statistics (OA3102) Professor Ron Fricker Naval Postgraduate School Monterey, California Reading assignment: WM&S chapter 9.6-9.7 Revision: 1-12 1 Goals for this Module
Module 6: Methods of Point Estimation Statistics (OA3102) Professor Ron Fricker Naval Postgraduate School Monterey, California Reading assignment: WM&S chapter 9.6-9.7 Revision: 1-12 1 Goals for this Module
280 CHAPTER 9 TESTS OF HYPOTHESES FOR A SINGLE SAMPLE Tests of Statistical Hypotheses
 280 CHAPTER 9 TESTS OF HYPOTHESES FOR A SINGLE SAMPLE 9-1.2 Tests of Statistical Hypotheses To illustrate the general concepts, consider the propellant burning rate problem introduced earlier. The null
Distributions of Functions of Random Variables. 5.1 Functions of One Random Variable
 Distributions of Functions of Random Variables 5.1 Functions of One Random Variable 5.2 Transformations of Two Random Variables 5.3 Several Random Variables 5.4 The Moment-Generating Function Technique
Mathematical statistics
 October 18 th, 2018 Lecture 16: Midterm review Countdown to mid-term exam: 7 days Week 1 Chapter 1: Probability review Week 2 Week 4 Week 7 Chapter 6: Statistics Chapter 7: Point Estimation Chapter 8:
Math 152. Rumbos Fall Solutions to Assignment #12
 Math 52. umbos Fall 2009 Solutions to Assignment #2. Suppose that you observe n iid Bernoulli(p) random variables, denoted by X, X 2,..., X n. Find the LT rejection region for the test of H o : p p o versus
Design of Engineering Experiments
 Design of Engineering Experiments Hussam Alshraideh Chapter 2: Some Basic Statistical Concepts October 4, 2015 Hussam Alshraideh (JUST) Basic Stats October 4, 2015 1 / 29 Overview 1 Introduction Basic
Learning Objectives for Stat 225
 Learning Objectives for Stat 225 08/20/12 Introduction to Probability: Get some general ideas about probability, and learn how to use sample space to compute the probability of a specific event. Set Theory:
Wooldridge, Introductory Econometrics, 4th ed. Appendix C: Fundamentals of mathematical statistics
 Wooldridge, Introductory Econometrics, 4th ed. Appendix C: Fundamentals of mathematical statistics A short review of the principles of mathematical statistics (or, what you should have learned in EC 151).
Maximum-Likelihood Estimation: Basic Ideas
 Sociology 740 John Fox Lecture Notes Maximum-Likelihood Estimation: Basic Ideas Copyright 2014 by John Fox Maximum-Likelihood Estimation: Basic Ideas 1 I The method of maximum likelihood provides estimators
Introduction to Maximum Likelihood Estimation
 Introduction to Maximum Likelihood Estimation Eric Zivot July 26, 2012 The Likelihood Function Let 1 be an iid sample with pdf ( ; ) where is a ( 1) vector of parameters that characterize ( ; ) Example:
Statistics 3858 : Maximum Likelihood Estimators
 Statistics 3858 : Maximum Likelihood Estimators 1 Method of Maximum Likelihood In this method we construct the so called likelihood function, that is L(θ) = L(θ; X 1, X 2,..., X n ) = f n (X 1, X 2,...,
5.1 Introduction. # of successes # of trials. 5.2 Part 1: Maximum Likelihood. MTH 452 Mathematical Statistics
 MTH 452 Mathematical Statistics Instructor: Orlando Merino University of Rhode Island Spring Semester, 2006 5.1 Introduction An Experiment: In 10 consecutive trips to the free throw line, a professional
Mathematical statistics
 October 1 st, 2018 Lecture 11: Sufficient statistic Where are we? Week 1 Week 2 Week 4 Week 7 Week 10 Week 14 Probability reviews Chapter 6: Statistics and Sampling Distributions Chapter 7: Point Estimation
2.830J / 6.780J / ESD.63J Control of Manufacturing Processes (SMA 6303) Spring 2008
 Spring 2008") MIT OpenCourseWare http://ocw.mit.edu 2.830J / 6.780J / ESD.63J Control of Processes (SMA 6303) Spring 2008 For information about citing these materials or our Terms of Use, visit: http://ocw.mit.edu/terms.
MIT OpenCourseWare http://ocw.mit.edu 2.830J / 6.780J / ESD.63J Control of Processes (SMA 6303) Spring 2008 For information about citing these materials or our Terms of Use, visit: http://ocw.mit.edu/terms.
Review of Statistics 101
 Review of Statistics 101 We review some important themes from the course 1. Introduction Statistics- Set of methods for collecting/analyzing data (the art and science of learning from data). Provides methods
, 0 x < 2. a. Find the probability that the text is checked out for more than half an hour but less than an hour. = (1/2)2
2") Math 205 Spring 206 Dr. Lily Yen Midterm 2 Show all your work Name: 8 Problem : The library at Capilano University has a copy of Math 205 text on two-hour reserve. Let X denote the amount of time the text
Math 205 Spring 206 Dr. Lily Yen Midterm 2 Show all your work Name: 8 Problem : The library at Capilano University has a copy of Math 205 text on two-hour reserve. Let X denote the amount of time the text
Mathematical statistics
 October 4 th, 2018 Lecture 12: Information Where are we? Week 1 Week 2 Week 4 Week 7 Week 10 Week 14 Probability reviews Chapter 6: Statistics and Sampling Distributions Chapter 7: Point Estimation Chapter
Multiple Regression Analysis
 Multiple Regression Analysis y = β 0 + β 1 x 1 + β 2 x 2 +... β k x k + u 2. Inference 0 Assumptions of the Classical Linear Model (CLM)! So far, we know: 1. The mean and variance of the OLS estimators
Department of Statistical Science FIRST YEAR EXAM - SPRING 2017
 Department of Statistical Science Duke University FIRST YEAR EXAM - SPRING 017 Monday May 8th 017, 9:00 AM 1:00 PM NOTES: PLEASE READ CAREFULLY BEFORE BEGINNING EXAM! 1. Do not write solutions on the exam;
Exam C Solutions Spring 2005
 Exam C Solutions Spring 005 Question # The CDF is F( x) = 4 ( + x) Observation (x) F(x) compare to: Maximum difference 0. 0.58 0, 0. 0.58 0.7 0.880 0., 0.4 0.680 0.9 0.93 0.4, 0.6 0.53. 0.949 0.6, 0.8
Fall 2017 STAT 532 Homework Peter Hoff. 1. Let P be a probability measure on a collection of sets A.
 1. Let P be a probability measure on a collection of sets A. (a) For each n N, let H n be a set in A such that H n H n+1. Show that P (H n ) monotonically converges to P ( k=1 H k) as n. (b) For each n
Section 10.1 (Part 2 of 2) Significance Tests: Power of a Test
 Significance Tests: Power of a Test") 1 Section 10.1 (Part 2 of 2) Significance Tests: Power of a Test Learning Objectives After this section, you should be able to DESCRIBE the relationship between the significance level of a test, P(Type
1 Section 10.1 (Part 2 of 2) Significance Tests: Power of a Test Learning Objectives After this section, you should be able to DESCRIBE the relationship between the significance level of a test, P(Type
STATS 200: Introduction to Statistical Inference. Lecture 29: Course review
 STATS 200: Introduction to Statistical Inference Lecture 29: Course review Course review We started in Lecture 1 with a fundamental assumption: Data is a realization of a random process. The goal throughout
MTH 452 Mathematical Statistics
 MTH 452 Mathematical Statistics Instructor: Orlando Merino University of Rhode Island Spring Semester, 2006 1 5.1 Introduction An Experiment: In 10 consecutive trips to the free throw line, a professional
Testing Hypothesis. Maura Mezzetti. Department of Economics and Finance Università Tor Vergata
 Maura Department of Economics and Finance Università Tor Vergata Hypothesis Testing Outline It is a mistake to confound strangeness with mystery Sherlock Holmes A Study in Scarlet Outline 1 The Power Function
Northwestern University Department of Electrical Engineering and Computer Science
 Northwestern University Department of Electrical Engineering and Computer Science EECS 454: Modeling and Analysis of Communication Networks Spring 2008 Probability Review As discussed in Lecture 1, probability
Bias Variance Trade-off
 Bias Variance Trade-off The mean squared error of an estimator MSE(ˆθ) = E([ˆθ θ] 2 ) Can be re-expressed MSE(ˆθ) = Var(ˆθ) + (B(ˆθ) 2 ) MSE = VAR + BIAS 2 Proof MSE(ˆθ) = E((ˆθ θ) 2 ) = E(([ˆθ E(ˆθ)]
Math 494: Mathematical Statistics
 Math 494: Mathematical Statistics Instructor: Jimin Ding jmding@wustl.edu Department of Mathematics Washington University in St. Louis Class materials are available on course website (www.math.wustl.edu/
HANDBOOK OF APPLICABLE MATHEMATICS
 HANDBOOK OF APPLICABLE MATHEMATICS Chief Editor: Walter Ledermann Volume VI: Statistics PART A Edited by Emlyn Lloyd University of Lancaster A Wiley-Interscience Publication JOHN WILEY & SONS Chichester
Statistics Ph.D. Qualifying Exam: Part I October 18, 2003
 Statistics Ph.D. Qualifying Exam: Part I October 18, 2003 Student Name: 1. Answer 8 out of 12 problems. Mark the problems you selected in the following table. 1 2 3 4 5 6 7 8 9 10 11 12 2. Write your answer
Definition 3.1 A statistical hypothesis is a statement about the unknown values of the parameters of the population distribution.
 Hypothesis Testing Definition 3.1 A statistical hypothesis is a statement about the unknown values of the parameters of the population distribution. Suppose the family of population distributions is indexed
2008 Winton. Statistical Testing of RNGs
 1 Statistical Testing of RNGs Criteria for Randomness For a sequence of numbers to be considered a sequence of randomly acquired numbers, it must have two basic statistical properties: Uniformly distributed
Confidence Intervals. Confidence interval for sample mean. Confidence interval for sample mean. Confidence interval for sample mean
 Confidence Intervals Confidence interval for sample mean The CLT tells us: as the sample size n increases, the sample mean is approximately Normal with mean and standard deviation Thus, we have a standard
Institute of Actuaries of India
 Institute of Actuaries of India Subject CT3 Probability & Mathematical Statistics May 2011 Examinations INDICATIVE SOLUTION Introduction The indicative solution has been written by the Examiners with the
This does not cover everything on the final. Look at the posted practice problems for other topics.
 Class 7: Review Problems for Final Exam 8.5 Spring 7 This does not cover everything on the final. Look at the posted practice problems for other topics. To save time in class: set up, but do not carry
Institute of Actuaries of India
 Institute of Actuaries of India Subject CT3 Probability and Mathematical Statistics For 2018 Examinations Subject CT3 Probability and Mathematical Statistics Core Technical Syllabus 1 June 2017 Aim The
Review Quiz. 1. Prove that in a one-dimensional canonical exponential family, the complete and sufficient statistic achieves the
 Review Quiz 1. Prove that in a one-dimensional canonical exponential family, the complete and sufficient statistic achieves the Cramér Rao lower bound (CRLB). That is, if where { } and are scalars, then
Hypothesis Testing. 1 Definitions of test statistics. CB: chapter 8; section 10.3
 Hypothesis Testing CB: chapter 8; section 0.3 Hypothesis: statement about an unknown population parameter Examples: The average age of males in Sweden is 7. (statement about population mean) The lowest
ACTEX CAS EXAM 3 STUDY GUIDE FOR MATHEMATICAL STATISTICS
 ACTEX CAS EXAM 3 STUDY GUIDE FOR MATHEMATICAL STATISTICS TABLE OF CONTENTS INTRODUCTORY NOTE NOTES AND PROBLEM SETS Section 1 - Point Estimation 1 Problem Set 1 15 Section 2 - Confidence Intervals and
APPENDICES APPENDIX A. STATISTICAL TABLES AND CHARTS 651 APPENDIX B. BIBLIOGRAPHY 677 APPENDIX C. ANSWERS TO SELECTED EXERCISES 679
 APPENDICES APPENDIX A. STATISTICAL TABLES AND CHARTS 1 Table I Summary of Common Probability Distributions 2 Table II Cumulative Standard Normal Distribution Table III Percentage Points, 2 of the Chi-Squared
Parameter estimation! and! forecasting! Cristiano Porciani! AIfA, Uni-Bonn!
 Parameter estimation! and! forecasting! Cristiano Porciani! AIfA, Uni-Bonn! Questions?! C. Porciani! Estimation & forecasting! 2! Cosmological parameters! A branch of modern cosmological research focuses
p(z)
") Chapter Statistics. Introduction This lecture is a quick review of basic statistical concepts; probabilities, mean, variance, covariance, correlation, linear regression, probability density functions and
Chapter Statistics. Introduction This lecture is a quick review of basic statistical concepts; probabilities, mean, variance, covariance, correlation, linear regression, probability density functions and
Statistical Data Analysis Stat 3: p-values, parameter estimation
 Statistical Data Analysis Stat 3: p-values, parameter estimation London Postgraduate Lectures on Particle Physics; University of London MSci course PH4515 Glen Cowan Physics Department Royal Holloway,
Midterm Examination. STA 215: Statistical Inference. Due Wednesday, 2006 Mar 8, 1:15 pm
 Midterm Examination STA 215: Statistical Inference Due Wednesday, 2006 Mar 8, 1:15 pm This is an open-book take-home examination. You may work on it during any consecutive 24-hour period you like; please
Statistics. Lecture 2 August 7, 2000 Frank Porter Caltech. The Fundamentals; Point Estimation. Maximum Likelihood, Least Squares and All That
 Statistics Lecture 2 August 7, 2000 Frank Porter Caltech The plan for these lectures: The Fundamentals; Point Estimation Maximum Likelihood, Least Squares and All That What is a Confidence Interval? Interval
Central Limit Theorem ( 5.3)
") Central Limit Theorem ( 5.3) Let X 1, X 2,... be a sequence of independent random variables, each having n mean µ and variance σ 2. Then the distribution of the partial sum S n = X i i=1 becomes approximately
Central Limit Theorem ( 5.3) Let X 1, X 2,... be a sequence of independent random variables, each having n mean µ and variance σ 2. Then the distribution of the partial sum S n = X i i=1 becomes approximately
1; (f) H 0 : = 55 db, H 1 : < 55.
 H 0 : = 55 db, H 1 : < 55.") Reference: Chapter 8 of J. L. Devore s 8 th Edition By S. Maghsoodloo TESTING a STATISTICAL HYPOTHESIS A statistical hypothesis is an assumption about the frequency function(s) (i.e., pmf or pdf) of one
Reference: Chapter 8 of J. L. Devore s 8 th Edition By S. Maghsoodloo TESTING a STATISTICAL HYPOTHESIS A statistical hypothesis is an assumption about the frequency function(s) (i.e., pmf or pdf) of one
Statistical Inference with Regression Analysis
 Introductory Applied Econometrics EEP/IAS 118 Spring 2015 Steven Buck Lecture #13 Statistical Inference with Regression Analysis Next we turn to calculating confidence intervals and hypothesis testing
Probability and Estimation. Alan Moses
 Probability and Estimation Alan Moses Random variables and probability A random variable is like a variable in algebra (e.g., y=e x ), but where at least part of the variability is taken to be stochastic.
Chapter 7: Hypothesis Testing
 Chapter 7: Hypothesis Testing *Mathematical statistics with applications; Elsevier Academic Press, 2009 The elements of a statistical hypothesis 1. The null hypothesis, denoted by H 0, is usually the nullification
Unobservable Parameter. Observed Random Sample. Calculate Posterior. Choosing Prior. Conjugate prior. population proportion, p prior:
 Pi Priors Unobservable Parameter population proportion, p prior: π ( p) Conjugate prior π ( p) ~ Beta( a, b) same PDF family exponential family only Posterior π ( p y) ~ Beta( a + y, b + n y) Observed
Joint Probability Distributions and Random Samples (Devore Chapter Five)
") Joint Probability Distributions and Random Samples (Devore Chapter Five) 1016-345-01: Probability and Statistics for Engineers Spring 2013 Contents 1 Joint Probability Distributions 2 1.1 Two Discrete
Joint Probability Distributions and Random Samples (Devore Chapter Five) 1016-345-01: Probability and Statistics for Engineers Spring 2013 Contents 1 Joint Probability Distributions 2 1.1 Two Discrete
Random Number Generation. CS1538: Introduction to simulations
 Random Number Generation CS1538: Introduction to simulations Random Numbers Stochastic simulations require random data True random data cannot come from an algorithm We must obtain it from some process
ISyE 6644 Fall 2014 Test 3 Solutions
 1 NAME ISyE 6644 Fall 14 Test 3 Solutions revised 8/4/18 You have 1 minutes for this test. You are allowed three cheat sheets. Circle all final answers. Good luck! 1. [4 points] Suppose that the joint
An interval estimator of a parameter θ is of the form θl < θ < θu at a
 Chapter 7 of Devore CONFIDENCE INTERVAL ESTIMATORS An interval estimator of a parameter θ is of the form θl < θ < θu at a confidence pr (or a confidence coefficient) of 1 α. When θl =, < θ < θu is called
Probability and Statistics Notes
 Probability and Statistics Notes Chapter Seven Jesse Crawford Department of Mathematics Tarleton State University Spring 2011 (Tarleton State University) Chapter Seven Notes Spring 2011 1 / 42 Outline
Distribution Fitting (Censored Data)
") Distribution Fitting (Censored Data) Summary... 1 Data Input... 2 Analysis Summary... 3 Analysis Options... 4 Goodness-of-Fit Tests... 6 Frequency Histogram... 8 Comparison of Alternative Distributions...
Distribution Fitting (Censored Data) Summary... 1 Data Input... 2 Analysis Summary... 3 Analysis Options... 4 Goodness-of-Fit Tests... 6 Frequency Histogram... 8 Comparison of Alternative Distributions...
Inferring from data. Theory of estimators
 Inferring from data Theory of estimators 1 Estimators Estimator is any function of the data e(x) used to provide an estimate ( a measurement ) of an unknown parameter. Because estimators are functions
McGill University. Faculty of Science. Department of Mathematics and Statistics. Part A Examination. Statistics: Theory Paper
 McGill University Faculty of Science Department of Mathematics and Statistics Part A Examination Statistics: Theory Paper Date: 10th May 2015 Instructions Time: 1pm-5pm Answer only two questions from Section
Non-parametric Inference and Resampling
 Non-parametric Inference and Resampling Exercises by David Wozabal (Last update. Juni 010) 1 Basic Facts about Rank and Order Statistics 1.1 10 students were asked about the amount of time they spend surfing
SPRING 2007 EXAM C SOLUTIONS
 SPRING 007 EXAM C SOLUTIONS Question #1 The data are already shifted (have had the policy limit and the deductible of 50 applied). The two 350 payments are censored. Thus the likelihood function is L =
STAT 512 sp 2018 Summary Sheet
 STAT 5 sp 08 Summary Sheet Karl B. Gregory Spring 08. Transformations of a random variable Let X be a rv with support X and let g be a function mapping X to Y with inverse mapping g (A = {x X : g(x A}
STA 732: Inference. Notes 2. Neyman-Pearsonian Classical Hypothesis Testing B&D 4
 STA 73: Inference Notes. Neyman-Pearsonian Classical Hypothesis Testing B&D 4 1 Testing as a rule Fisher s quantification of extremeness of observed evidence clearly lacked rigorous mathematical interpretation.
Lectures 5 & 6: Hypothesis Testing
 Lectures 5 & 6: Hypothesis Testing in which you learn to apply the concept of statistical significance to OLS estimates, learn the concept of t values, how to use them in regression work and come across
Math 152. Rumbos Fall Solutions to Exam #2
 Math 152. Rumbos Fall 2009 1 Solutions to Exam #2 1. Define the following terms: (a) Significance level of a hypothesis test. Answer: The significance level, α, of a hypothesis test is the largest probability
15 Discrete Distributions
 Lecture Note 6 Special Distributions (Discrete and Continuous) MIT 4.30 Spring 006 Herman Bennett 5 Discrete Distributions We have already seen the binomial distribution and the uniform distribution. 5.
1. Point Estimators, Review
 AMS571 Prof. Wei Zhu 1. Point Estimators, Review Example 1. Let be a random sample from. Please find a good point estimator for Solutions. There are the typical estimators for and. Both are unbiased estimators.
4 Hypothesis testing. 4.1 Types of hypothesis and types of error 4 HYPOTHESIS TESTING 49
 4 HYPOTHESIS TESTING 49 4 Hypothesis testing In sections 2 and 3 we considered the problem of estimating a single parameter of interest, θ. In this section we consider the related problem of testing whether
AMS7: WEEK 7. CLASS 1. More on Hypothesis Testing Monday May 11th, 2015
 AMS7: WEEK 7. CLASS 1 More on Hypothesis Testing Monday May 11th, 2015 Testing a Claim about a Standard Deviation or a Variance We want to test claims about or 2 Example: Newborn babies from mothers taking
Terminology Suppose we have N observations {x(n)} N 1. Estimators as Random Variables. {x(n)} N 1
} N 1. Estimators as Random Variables. {x(n)} N 1") Estimation Theory Overview Properties Bias, Variance, and Mean Square Error Cramér-Rao lower bound Maximum likelihood Consistency Confidence intervals Properties of the mean estimator Properties of the
Estimation Theory Overview Properties Bias, Variance, and Mean Square Error Cramér-Rao lower bound Maximum likelihood Consistency Confidence intervals Properties of the mean estimator Properties of the
STATISTICS SYLLABUS UNIT I
 STATISTICS SYLLABUS UNIT I (Probability Theory) Definition Classical and axiomatic approaches.laws of total and compound probability, conditional probability, Bayes Theorem. Random variable and its distribution
A Very Brief Summary of Statistical Inference, and Examples
 A Very Brief Summary of Statistical Inference, and Examples Trinity Term 2009 Prof. Gesine Reinert Our standard situation is that we have data x = x 1, x 2,..., x n, which we view as realisations of random
y ˆ i = ˆ " T u i ( i th fitted value or i th fit)
") 1 2 INFERENCE FOR MULTIPLE LINEAR REGRESSION Recall Terminology: p predictors x 1, x 2,, x p Some might be indicator variables for categorical variables) k-1 non-constant terms u 1, u 2,, u k-1 Each u
1 2 INFERENCE FOR MULTIPLE LINEAR REGRESSION Recall Terminology: p predictors x 1, x 2,, x p Some might be indicator variables for categorical variables) k-1 non-constant terms u 1, u 2,, u k-1 Each u
Three hours. To be supplied by the Examinations Office: Mathematical Formula Tables and Statistical Tables THE UNIVERSITY OF MANCHESTER.
 Three hours To be supplied by the Examinations Office: Mathematical Formula Tables and Statistical Tables THE UNIVERSITY OF MANCHESTER EXTREME VALUES AND FINANCIAL RISK Examiner: Answer QUESTION 1, QUESTION
Using R in Undergraduate Probability and Mathematical Statistics Courses. Amy G. Froelich Department of Statistics Iowa State University
 Using R in Undergraduate Probability and Mathematical Statistics Courses Amy G. Froelich Department of Statistics Iowa State University Undergraduate Probability and Mathematical Statistics at Iowa State
GEOMETRIC -discrete A discrete random variable R counts number of times needed before an event occurs
 STATISTICS 4 Summary Notes. Geometric and Exponential Distributions GEOMETRIC -discrete A discrete random variable R counts number of times needed before an event occurs P(X = x) = ( p) x p x =,, 3,...
The University of Hong Kong Department of Statistics and Actuarial Science STAT2802 Statistical Models Tutorial Solutions Solutions to Problems 71-80
 The University of Hong Kong Department of Statistics and Actuarial Science STAT2802 Statistical Models Tutorial Solutions Solutions to Problems 71-80 71. Decide in each case whether the hypothesis is simple