Related Improvements. A DFS Application. Mark A. Bourassa
|
|
|
- Luke Dean
- 5 years ago
- Views:
Transcription


1 Related Improvements in Surface Turbulent Heat Fluxes A DFS Application Center for Ocean-Atmospheric Prediction Studies & Department of Earth, Ocean and Atmospheric Sciences, The Florida State University, Tallahassee, FL Bourassa@coaps.fsu.edu 16 th ASI


2 Initial Global Ocean Observing System for Climate Status against the GCOS Implementation Plan and JCOMM targets Total in situ networks 62% January % 100% 59% Origin 80% 100% 48% 34% 73% 62% System % complete Original goal: 100% implementation in 2010
3 Motivation Surface turbulent fluxes from space will have much better spatial sampling that the in situ observing system Better temporal sampling over most of the global oceans Mid-level (85kPa to 70kPa) water vapor plays an important role in hurricane and mid-latitude storm evolution In many cases, surface fluxes are non-negligible, g but Surface fluxes are often more important for the conditioning of the environment about the storm Surface vector winds (or stress) and air/sea temperature differences are important players in getting the moisture out of the boundary-layer and into the lower portion of the free atmosphere. I will show how surface turbulent fluxes of energy (sensible and latent heat) and moisture (evaporation) can be calculated from satellite observations similar to those expected to be on GCOM-W2 3
4 Flux Accuracies and Applications 50 Wm years 10 years 1 year 1 month 1 week 10 Wm -2 5 Wm -2 1 Wm Wm Nm -2 Unknown Mesoscale and shorter scale physical-biological Interaction Open Ocean Upwelling Upper Ocean Heat Content & NH Hurricane Activity Stress for Dense Water CO Formation 2 Fluxes Atm. Rossby Ocean Eddies and Wave Breaking Fronts Polynyas Ice Shelf Breakup Processes Ice Sheet Evolution Climate Change Annual Ice Mass Budget Annual Ocean Heat Flux 1 day Leads Conv. Clouds & Precip NWP High Impact Weather 1 hour Mark A. 10m Bourassa 100m 1km 10km 100km 10 3 km 10 4 km 10 5 km
5 Flux Parameterizations = u u C D (U 10 U s ) (U 10 U s ) Stress H = - C p * u C p C H (T s T 10 ) (U 10 U s ) Sensible Heat Flux E= - q u C E (q s q 10 ) (U 10 U s ) Evaporation Q = - L v q u L v E Latent Heat Flux air density u friction velocity C D drag coefficient temperature scale factor C H heat transfer coefficient (analogous to friction velocity) C E moisture transfer coefficient q moisture scale factor U s mean surface motion T mean air temperature U 10 Wind speed at height of 10m q mean specific humidity L v latent heat of vaporization C p heat capacity Traditionally, scatterometer winds are tuned to equivalent neutral winds (Ross et al. 1985), which are directly translatable to friction velocity not stress 5

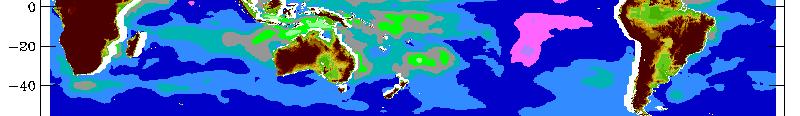
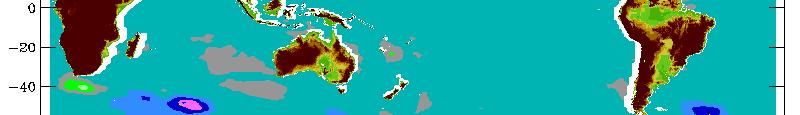
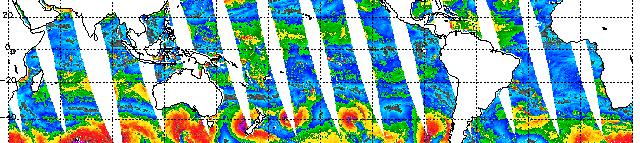
6 Monthly LHF Differences Due to Wave-Induced Shear February 1999 August

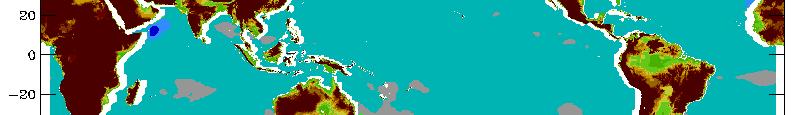
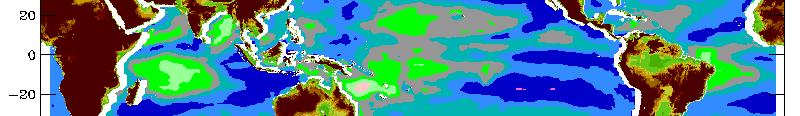
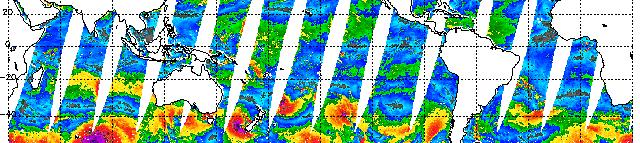
7 Monthly SHF Differences Due to Wave-Induced Shear February 2000 August
8 Flux Parameterizations Further Complications 1/2 C H = c h c d, where c d = C D C E = c e c d All wave related variability can be included d in C D and U s c h and c e depend only on boundary-layer stratification = u u C DN (U 10EN U s ) (U 10EN U s ) Stress H = - C p * u C p c h c d (T 10 T s ) (U 10 U s ) Sensible E = - q u c e c d (q 10 q s ) (U 10 U s ) Evaporation Q = - L v q u L v E Latent So we want to be able to accurately estimate T 10 T s q 10 q s 8
9 Example Retrievals of 10m Air Temperature Multiple linear Regression technique Pretty good for most conditions Issues for very low temperature and very high temperatures 9
10 Comparison With The Latest Technique Jackson and Wick Roberts et al. 10
11 Comparison With The Latest Technique Jackson and Wick Roberts et al. 11
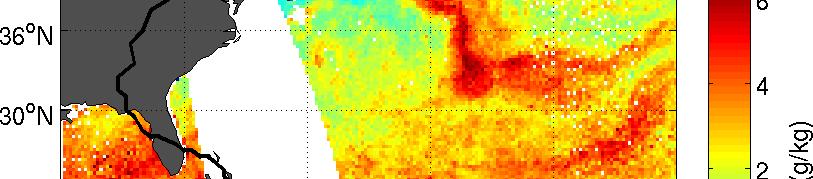
12 Validation of Air/Sea Temperature Differences Roberts et al. (2010) retrieval technique for T 10 and q 10. Comparison to buoy observations (circles in the Gulf of Mexico) 12

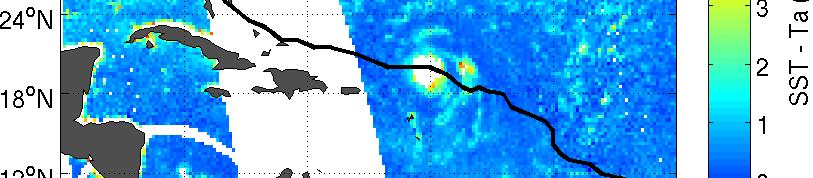
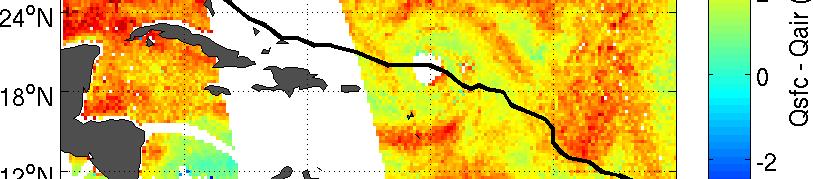
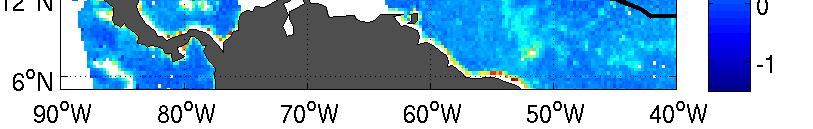
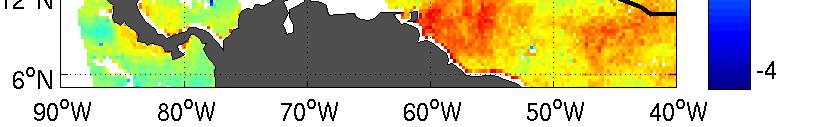
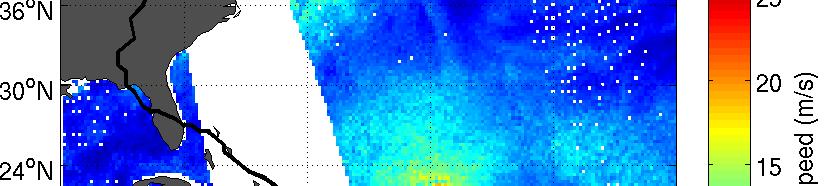
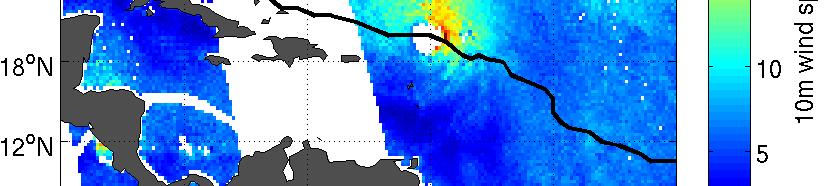
13 Hurricane Francis Air/Sea Differences 30 Aug Z Humidity Temperature Wind 13


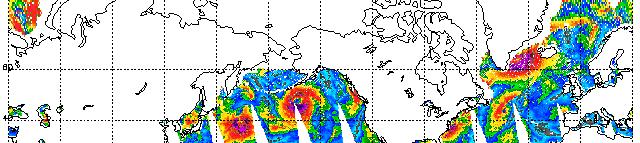
14 Hurricane Francis LHF 30 Aug Z T 10 and q 10 from Roberts et al. Wind speed interpolated from RSS 14

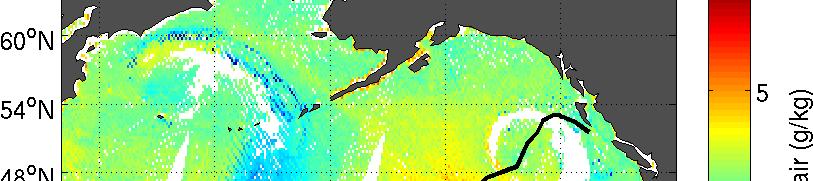
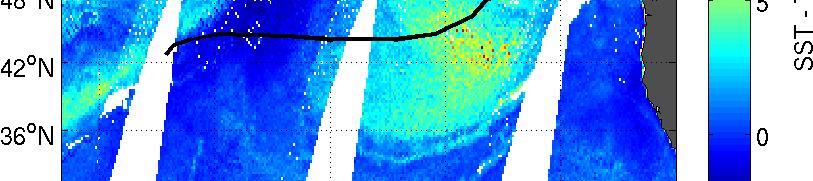
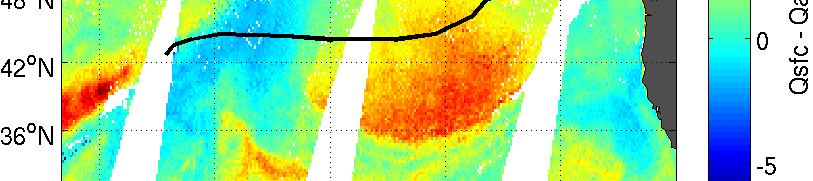
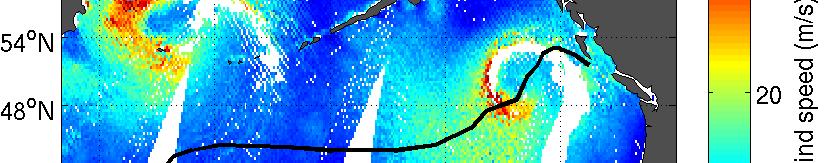
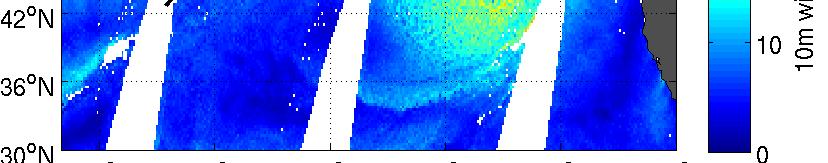
15 Warm Core Seclusion Air/Sea Differences Temperature Humidity Wind 15
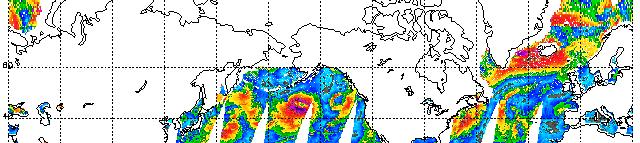
16 Example LHF Retrieval: Warm Core Seclusion Black line is the track from L k f t i li Ryan Maue s data set with too much rain Bl k li i th t k f Lack of retrieval in areas 16
17 Conclusions Preliminary results are quite impressive Concerns Need for more careful calibration & intercalibration Further reduction of biases Non-linear processes converting random errors to biases?? Particularly for low temperatures and high winds Sampling missing some of the really big events Accuracy of winds (or stress) for high wind speeds Quality assessment flags Preliminary results are quite impressive Retrieval of stress from an active instrument should improve retrievals of temperature and humidity. High resolution surface winds should be helpful in modeling exchange between the boundary-layer y and the lower free atmosphere 17
18 Related Improvements in Surface Turbulent Heat Fluxes A DFS Application Center for Ocean-Atmospheric Prediction Studies & Department of Earth, Ocean and Atmospheric Sciences, The Florida State University, i Tallahassee, FL Bourassa@coaps.fsu.edu 16 th ASI
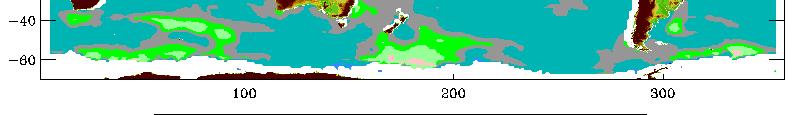
19 LHF Differences Due to Wave-Induced Shear Animation of 6 hourly change in fluxes: Case with waves minus case with U orb = 0 6 hour time step USCLIVAR/SeaFlux 19
20 Submonthly Contribution to Average LHF L is determined through a bulk formula. _ Where the overbar indicates a monthly average There is considerable controversy about that accuracy of this averaging A more accurate approach is to calculate the flux at each time step then average these fluxes: If we apply Reynolds averaging this equation becomes If we assume density variations are not important, t this equation becomes Following examples of monthly biases are based on ECMWF reanalysis. Plots bias from using monthly averaged flux input data They do not include wave information USCLIVAR/SeaFlux 20


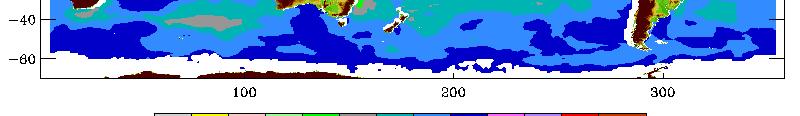
 latent heat")


 minus (2)")


21 Bias in Monthly Latent Heat Flux (1) latent heat flux determined from 6 hourly data and (2) latent heat flux determined from monthly averaged input Monthly climatology computed for Figures show: (1) minus (2) Bias in Latent Heat Flux (Wm -2 ) Thanks to Paul Hughes and Ryan Maue USCLIVAR/SeaFlux 21
22 Observed (x) and Modeled (y) Friction Velocity (u * ) Large and Pond (1981) 1.0 Smith (1988) Taylor and Yelland Bourassa (2006) (2001) Ocean Sciences
23 Wave Motions Modify U sfc and Hence change the Wind Shear For wind driven waves and common wave ages this is qualitatively similar to the HEXOS results, and qualtitatively similar to Taylor and Yelland (2001) Ocean Sciences


24 _/ VA _ V A _/ _ _/ VA ) _ Percentage Change in Surface Relative Winds Example for a 00Z Comparison V A = 10m wind vector A V C = surface current V W = Wave-related surface motion The percentage change in surface relative winds is roughly proportional to the change in energy fluxes. The percentage change squared is roughly proportional to changes in stress. The drag coefficient also changes by about half this percentage. From Kara et al. (2007, GRL) Ocean Sciences


25 ASCAT vs. QuikSCAT Daily Coverage ASCAT 8 April 2008 QuikSCAT 25
26 To What Does a Scatterometer Respond? It can be further improved in terms of surface relative wind vectors: L = L v C E (q 10 q sfc ) U 10 U sfc Does a scatterometer respond to U 10 or to U 10 U sfc or stress? Cornillon and Park (2001, GRL), Kelly et al. (2001, GRL), and Chelton et al. (2004, Science) showed that scatterometer winds were relative to surface currents. Bentamy et al. (2001, JTech) indicate there is also a dependence on wave characteristics. The drag coefficient can be modeled as depending on waves Bourassa (2006, WIT Press) showed that wave dependency can be parameterized as a change in U sfc. This greatly simplifies the drag coefficient Considering waves reduces the residual between scatterometer equivalent neutral winds and equivalent neutral winds calculated from buoy observations A 0.5 dependency is found in the residual between scatterometer equivalent neutral winds and equivalent neutral winds calculated from buoy observations USCLIVAR/SeaFlux 26
Improved Fields of Satellite-Derived Ocean Surface Turbulent Fluxes of Energy and Moisture
 Improved Fields of Satellite-Derived Ocean Surface Turbulent Fluxes of Energy and Moisture First year report on NASA grant NNX09AJ49G PI: Mark A. Bourassa Co-Is: Carol Anne Clayson, Shawn Smith, and Gary
John Steffen and Mark A. Bourassa
 John Steffen and Mark A. Bourassa Funding by NASA Climate Data Records and NASA Ocean Vector Winds Science Team Florida State University Changes in surface winds due to SST gradients are poorly modeled
Air sea satellite flux datasets and what they do (and don't) tell us about the air sea interface in the Southern Ocean
 tell us about the air sea interface in the Southern Ocean") Air sea satellite flux datasets and what they do (and don't) tell us about the air sea interface in the Southern Ocean Carol Anne Clayson Woods Hole Oceanographic Institution Southern Ocean Workshop Seattle,
Air sea satellite flux datasets and what they do (and don't) tell us about the air sea interface in the Southern Ocean Carol Anne Clayson Woods Hole Oceanographic Institution Southern Ocean Workshop Seattle,
The SeaFlux Turbulent Flux Dataset Version 1.0 Documentation
 The SeaFlux Turbulent Flux Dataset The SeaFlux Turbulent Flux Dataset Version 1.0 Documentation Carol Anne Clayson1 J. Brent Roberts2 Alec S. Bogdanoff1,3 1. Woods Hole Oceanographic Institution, Woods
Do Differences between NWP Model and EO Winds Matter?
 Do Differences between NWP Model and EO Winds Matter? Ad.Stoffelen@knmi.nl Anton Verhoef, Jos de Kloe, Jur Vogelzang, Jeroen Verspeek, Greg King, Wenming Lin, Marcos Portabella Ana Trindade Substantial
Wind, Current, Wave, and Stress Coupling in the Boundary Layer and A Plan for Observing This Coupling from Space
 Wind, Current, Wave, and Stress Coupling in the Boundary Layer and A Plan for Observing This Coupling from Space Mark A. Bourassa and Qi Shi COAPS, EOAS & GFDI, Florida State University With input from
Evaluation of modeled diurnally varying sea surface temperatures and the influence of surface winds
 Evaluation of modeled diurnally varying sea surface temperatures and the influence of surface winds Rachel R. Weihs and Mark A. Bourassa Center for Ocean-Atmospheric Prediction Studies IOVWST Meeting 6-8
Validation of the JRA-55 based data set: Comparison with buoy observations
 Validation of the JRA-55 based data set: Comparison with buoy observations Hiroyuki TOMITA (Nagoya University) tomita@hyarc.nagoya-u.ac.jp 2016.01.14 OMDP extended meeting JAMSTEC@Yokohama Objectives IN
Atmosphere-Ocean Interaction in Tropical Cyclones
 Atmosphere-Ocean Interaction in Tropical Cyclones Isaac Ginis University of Rhode Island Collaborators: T. Hara, Y.Fan, I-J Moon, R. Yablonsky. ECMWF, November 10-12, 12, 2008 Air-Sea Interaction in Tropical
2.1 OBSERVATIONS AND THE PARAMETERISATION OF AIR-SEA FLUXES DURING DIAMET
 2.1 OBSERVATIONS AND THE PARAMETERISATION OF AIR-SEA FLUXES DURING DIAMET Peter A. Cook * and Ian A. Renfrew School of Environmental Sciences, University of East Anglia, Norwich, UK 1. INTRODUCTION 1.1
over the Northern West Florida Shelf from SeaWinds and ASCAT
 Interannual Variability of Synoptic Scale Winds over the Northern West Florida Shelf from SeaWinds and ASCAT Steve Morey Mark Bourassa Austin Todd COAPS/FSU This work is sponsored by the NASA Ocean Vector
Analysis of Turbulent Flux Quality
 Analysis of Turbulent Flux Quality A. Bentamy IFREMER. France S. Grodsky Univ. of Maryland. USA R. Pinker Univ. of Maryland. USA K. Katsaros NOAA. USA. A. Mestas-Nuñez Univ Corpus Christi. USA. W. Bruch
Earth Observatory, Columbia University
 Satellite-Based Mid dlatitude Cyclone Statistics Over the Southern Ocean -- Tracks and Su urface Fluxes Xiaojun Yuan August 19, 2009 In collaboration with Jérôme Pato oux at University of Washington and
5. General Circulation Models
 5. General Circulation Models I. 3-D Climate Models (General Circulation Models) To include the full three-dimensional aspect of climate, including the calculation of the dynamical transports, requires
Temporal and spatial variations in radiation and energy fluxes across Lake Taihu
 Temporal and spatial variations in radiation and energy fluxes across Lake Taihu Wang Wei YNCenter Video Conference May 10, 2012 Outline 1. Motivation 2. Hypothesis 3. Methodology 4. Preliminary results
The Ocean-Atmosphere System II: Oceanic Heat Budget
 The Ocean-Atmosphere System II: Oceanic Heat Budget C. Chen General Physical Oceanography MAR 555 School for Marine Sciences and Technology Umass-Dartmouth MAR 555 Lecture 2: The Oceanic Heat Budget Q
Effect of ocean surface currents on wind stress, heat flux, and wind power input to the ocean
 GEOPHYSICAL RESEARCH LETTERS, VOL. 33,, doi:10.1029/2006gl025784, 2006 Effect of ocean surface currents on wind stress, heat flux, and wind power input to the ocean Jordan T. Dawe 1 and LuAnne Thompson
Florida State University Libraries
 Florida State University Libraries Electronic Theses, Treatises and Dissertations The Graduate School 2014 The Effects of Sea Surface Temperature Gradients on Surface Turbulent Fluxes John Steffen Follow
Climate data records from OSI SAF scatterometer winds. Anton Verhoef Jos de Kloe Jeroen Verspeek Jur Vogelzang Ad Stoffelen
 Climate data records from OSI SAF scatterometer winds Anton Verhoef Jos de Kloe Jeroen Verspeek Jur Vogelzang Ad Stoffelen Outline Motivation Planning Preparation and methods Quality Monitoring Output
US CLIVAR High-Latitude Surface Flux Working Group
 US CLIVAR High-Latitude Surface Flux Working Group Co-chairs: Mark Bourassa and Sarah Gille Ed Andreas, Cecelia Bitz, Dave Carlson, Ivana Cerovecki, Meghan,Cronin Will Drennan, Chris Fairall, Ross Hoffman,
Interannual Variability of Wind Induced Onshore Transport over the Northern West Florida Shelf
 Interannual Variability of Wind Induced Onshore Transport over the Northern West Florida Shelf Steve Morey Austin Todd Mark Bourassa COAPS/FSU Motivation Understand the physical controls on regional Gag
New Release of Oceanic Scatterometer and Radiometer Turbulent Air-Sea Fluxes
 New Release of Oceanic Scatterometer and Radiometer Turbulent Air-Sea Fluxes A. Bentamy IFREMER. France S. Grodsky Univ. of Maryland. USA K. Katsaros NOAA. USA. A. Mestas-Nuñez Univ Corpus Christi. USA.
IMPACT OF GROUND-BASED GPS PRECIPITABLE WATER VAPOR AND COSMIC GPS REFRACTIVITY PROFILE ON HURRICANE DEAN FORECAST. (a) (b) (c)
 (b) (c)") 9B.3 IMPACT OF GROUND-BASED GPS PRECIPITABLE WATER VAPOR AND COSMIC GPS REFRACTIVITY PROFILE ON HURRICANE DEAN FORECAST Tetsuya Iwabuchi *, J. J. Braun, and T. Van Hove UCAR, Boulder, Colorado 1. INTRODUCTION
9B.3 IMPACT OF GROUND-BASED GPS PRECIPITABLE WATER VAPOR AND COSMIC GPS REFRACTIVITY PROFILE ON HURRICANE DEAN FORECAST Tetsuya Iwabuchi *, J. J. Braun, and T. Van Hove UCAR, Boulder, Colorado 1. INTRODUCTION
P R O L O G U E CORRELATION COEF. dsst/dt during wintertime (i.e., end of Feb. minus beginning of Dec, using 11-day averaged climatology)
") P R O L O G U E dsst/dt during wintertime (i.e., end of Feb. minus beginning of Dec, using 11-day averaged climatology) Correlation between total precipitable water (from NVAP-M) and total cloud (from
P R O L O G U E dsst/dt during wintertime (i.e., end of Feb. minus beginning of Dec, using 11-day averaged climatology) Correlation between total precipitable water (from NVAP-M) and total cloud (from
Sensitivity of zonal-mean circulation to air-sea roughness in climate models
 Sensitivity of zonal-mean circulation to air-sea roughness in climate models Inna Polichtchouk & Ted Shepherd Royal Meteorological Society National Meeting 16.11.2016 MOTIVATION Question: How sensitive
NOTES AND CORRESPONDENCE. Wind Stress Drag Coefficient over the Global Ocean*
 5856 J O U R N A L O F C L I M A T E VOLUME 20 NOTES AND CORRESPONDENCE Wind Stress Drag Coefficient over the Global Ocean* A. BIROL KARA, ALAN J. WALLCRAFT, E. JOSEPH METZGER, AND HARLEY E. HURLBURT Oceanography
Using Ensemble Sensitivity to Understand the Role of Sea Surface Temperatures in Midlatitude Storm Development in the Gulf Stream Region
 Using Ensemble Sensitivity to Understand the Role of Sea Surface Temperatures in Midlatitude Storm Development in the Gulf Stream Region Jimmy Booth, Susan Bates, LuAnne Thompson, Kathie Kelly University
PRMS WHITE PAPER 2014 NORTH ATLANTIC HURRICANE SEASON OUTLOOK. June RMS Event Response
 PRMS WHITE PAPER 2014 NORTH ATLANTIC HURRICANE SEASON OUTLOOK June 2014 - RMS Event Response 2014 SEASON OUTLOOK The 2013 North Atlantic hurricane season saw the fewest hurricanes in the Atlantic Basin
The impact of polar mesoscale storms on northeast Atlantic Ocean circulation
 The impact of polar mesoscale storms on northeast Atlantic Ocean circulation Influence of polar mesoscale storms on ocean circulation in the Nordic Seas Supplementary Methods and Discussion Atmospheric
Impact of METOP ASCAT Ocean Surface Winds in the NCEP GDAS/GFS and NRL NAVDAS
 Impact of METOP ASCAT Ocean Surface Winds in the NCEP GDAS/GFS and NRL NAVDAS COAMPS @ Li Bi 1,2 James Jung 3,4 Michael Morgan 5 John F. Le Marshall 6 Nancy Baker 2 Dave Santek 3 1 University Corporation
Assessing high-resolution analysis of surface heat fluxes in the Gulf Stream region
 JOURNAL OF GEOPHYSICAL RESEARCH: OCEANS, VOL. 118, 5353 5375, doi:10.1002/jgrc.20386, 2013 Assessing high-resolution analysis of surface heat fluxes in the Gulf Stream region Xiangze Jin 1 and Lisan Yu
Coastal Antarctic polynyas: A coupled process requiring high model resolution in the ocean and atmosphere
 Coastal Antarctic polynyas: A coupled process requiring high model resolution in the ocean and atmosphere Mike Dinniman and John Klinck Center for Coastal Physical Oceanography Old Dominion University
M. Mielke et al. C5816
 Atmos. Chem. Phys. Discuss., 14, C5816 C5827, 2014 www.atmos-chem-phys-discuss.net/14/c5816/2014/ Author(s) 2014. This work is distributed under the Creative Commons Attribute 3.0 License. Atmospheric
Uncertainty in Ocean Surface Winds over the Nordic Seas
 Uncertainty in Ocean Surface Winds over the Nordic Seas Dmitry Dukhovskoy and Mark Bourassa Arctic Ocean Center for Ocean-Atmospheric Prediction Studies Florida State University Funded by the NASA OVWST,
Atmospheric Sciences 321. Science of Climate. Lecture 13: Surface Energy Balance Chapter 4
 Atmospheric Sciences 321 Science of Climate Lecture 13: Surface Energy Balance Chapter 4 Community Business Check the assignments HW #4 due Wednesday Quiz #2 Wednesday Mid Term is Wednesday May 6 Practice
EUMETSAT SAF Wind Services
 EUMETSAT SAF Wind Services Ad Stoffelen Marcos Portabella (CMIMA) Anton Verhoef Jeroen Verspeek Jur Vogelzang Maria Belmonte scat@knmi.nl Status SAF activities NWP SAF software AWDP1. beta tested; being
Scatterometer winds in rapidly developing storms (SCARASTO) First experiments on data assimilation of scatterometer winds
 First experiments on data assimilation of scatterometer winds") Scatterometer winds in rapidly developing storms (SCARASTO) First experiments on data assimilation of scatterometer winds Teresa Valkonen, EUMETSAT fellow Norwegian Meteorological Institute MET Norway,Oslo
Scatterometer winds in rapidly developing storms (SCARASTO) First experiments on data assimilation of scatterometer winds Teresa Valkonen, EUMETSAT fellow Norwegian Meteorological Institute MET Norway,Oslo
Use of Satellite Observations to Measure Air-Sea Coupling and to Validate Its Estimates from Numerical Atmospheric Models
 Use of Satellite Observations to Measure Air-Sea Coupling and to Validate Its Estimates from Numerical Atmospheric Models Natalie Perlin, Dudley Chelton, Simon de Szoeke College of Earth, Ocean, and Atmospheric
Transient and Eddy. Transient/Eddy Flux. Flux Components. Lecture 3: Weather/Disturbance. Transient: deviations from time mean Time Mean
 Lecture 3: Weather/Disturbance Transients and Eddies Climate Roles Mid-Latitude Cyclones Tropical Hurricanes Mid-Ocean Eddies Transient and Eddy Transient: deviations from time mean Time Mean Eddy: deviations
Turbulent fluxes. Sensible heat flux. Momentum flux = Wind stress ρc D (U-U s ) 2. Latent heat flux. ρc p C H (U-U s ) (T s -T a )
 2. Latent heat flux. ρc p C H (U-U s ) (T s -T a )") Intertropical ocean-atmosphere coupling in a state of the art Earth System Model: Evaluating the representation of turbulent air-sea fluxes in IPSL-CM5A Alina Găinuşă-Bogdan, Pascale Braconnot Laboratoire
Intertropical ocean-atmosphere coupling in a state of the art Earth System Model: Evaluating the representation of turbulent air-sea fluxes in IPSL-CM5A Alina Găinuşă-Bogdan, Pascale Braconnot Laboratoire
Divergence, Spin, and Tilt. Convergence and Divergence. Midlatitude Cyclones. Large-Scale Setting
 Midlatitude Cyclones Equator-to-pole temperature gradient tilts pressure surfaces and produces westerly jets in midlatitudes Waves in the jet induce divergence and convergence aloft, leading to surface
Seeking a consistent view of energy and water flows through the climate system
 Seeking a consistent view of energy and water flows through the climate system Robert Pincus University of Colorado and NOAA/Earth System Research Lab Atmospheric Energy Balance [Wm -2 ] 340.1±0.1 97-101
Lecture 7: The Monash Simple Climate
 Climate of the Ocean Lecture 7: The Monash Simple Climate Model Dr. Claudia Frauen Leibniz Institute for Baltic Sea Research Warnemünde (IOW) claudia.frauen@io-warnemuende.de Outline: Motivation The GREB
HY-2A Satellite User s Guide
 National Satellite Ocean Application Service 2013-5-16 Document Change Record Revision Date Changed Pages/Paragraphs Edit Description i Contents 1 Introduction to HY-2 Satellite... 1 2 HY-2 satellite data
Gravity Waves from Southern Ocean Islands and the Southern Hemisphere Circulation
 Gravity Waves from Southern Ocean Islands and the Southern Hemisphere Circulation Chaim Garfinkel 1, Luke Oman 2 1. Earth Science Institute, Hebrew University 2 NASA GSFC ECMWF, September 2016 Topographic
Interannual variability of top-ofatmosphere. CERES instruments
 Interannual variability of top-ofatmosphere albedo observed by CERES instruments Seiji Kato NASA Langley Research Center Hampton, VA SORCE Science team meeting, Sedona, Arizona, Sep. 13-16, 2011 TOA irradiance
APPLICATIONS OF SEA-LEVEL PRESSURE
 APPLICATIONS OF SEA-LEVEL PRESSURE RETRIEVAL FROM SCATTEROMETER WINDS Jérôme Patoux, Ralph C. Foster and Robert A. Brown OVWST meeting Seattle, November 20, 2008 Pressure retrieval: how does it work? model
Name the surface winds that blow between 0 and 30. GEO 101, February 25, 2014 Monsoon Global circulation aloft El Niño Atmospheric water
 GEO 101, February 25, 2014 Monsoon Global circulation aloft El Niño Atmospheric water Name the surface winds that blow between 0 and 30 What is the atmospheric pressure at 0? What is the atmospheric pressure
Figure 1: Two schematic views of the global overturning circulation. The Southern Ocean plays two key roles in the global overturning: (1) the
 the") Figure 1: Two schematic views of the global overturning circulation. The Southern Ocean plays two key roles in the global overturning: (1) the Antarctic Circumpolar Current connects the ocean basins, establishing
Figure 1: Two schematic views of the global overturning circulation. The Southern Ocean plays two key roles in the global overturning: (1) the Antarctic Circumpolar Current connects the ocean basins, establishing
Land Data Assimilation at NCEP NLDAS Project Overview, ECMWF HEPEX 2004
 Dag.Lohmann@noaa.gov, Land Data Assimilation at NCEP NLDAS Project Overview, ECMWF HEPEX 2004 Land Data Assimilation at NCEP: Strategic Lessons Learned from the North American Land Data Assimilation System
Near-surface weather prediction and surface data assimilation: challenges, development, and potential data needs
 Near-surface weather prediction and surface data assimilation: challenges, development, and potential data needs Zhaoxia Pu Department of Atmospheric Sciences University of Utah, Salt Lake City, Utah,
Assimilation of ASCAT soil wetness
 EWGLAM, October 2010 Assimilation of ASCAT soil wetness Bruce Macpherson, on behalf of Imtiaz Dharssi, Keir Bovis and Clive Jones Contents This presentation covers the following areas ASCAT soil wetness
Study for utilizing high wind speed data in the JMA s Global NWP system
 Study for utilizing high wind speed data in the JMA s Global NWP system Masami Moriya Numerical Prediction Division, Japan Meteorological Agency (JMA) IOVWST Meeting, Portland, USA, 19-21 May 2015 1 Contents
Arctic System Reanalysis Provides Highresolution Accuracy for Arctic Studies
 Arctic System Reanalysis Provides Highresolution Accuracy for Arctic Studies David H. Bromwich, Aaron Wilson, Lesheng Bai, Zhiquan Liu POLAR2018 Davos, Switzerland Arctic System Reanalysis Regional reanalysis
SUPPLEMENTARY INFORMATION
 Figure S1. Summary of the climatic responses to the Gulf Stream. On the offshore flank of the SST front (black dashed curve) of the Gulf Stream (green long arrow), surface wind convergence associated with
Calculating Latent Heat Fluxes Over the Labrador Sea Using SSM/I Data
 Calculating Latent Heat Fluxes Over the Labrador Sea Using SSM/I Data Bernard Walter NorthWest Research Associates P. O. Box 3027 Bellevue, WA 98009 phone: (425) 644-9660, x-320; fax: (425) 644-8422; e-mail:
Coincident Observations with QuikSCAT and ASCAT of the Effects of Rain-Induced Sea Surface Stress During Hurricane Ike
 Coincident Observations with QuikSCAT and ASCAT of the Effects of Rain-Induced Sea Surface Stress During Hurricane Ike David E. Weissman Hofstra University Hempstead, New York 11549 Mark A. Bourassa Center
Arctic Climate Change. Glen Lesins Department of Physics and Atmospheric Science Dalhousie University Create Summer School, Alliston, July 2013
 Arctic Climate Change Glen Lesins Department of Physics and Atmospheric Science Dalhousie University Create Summer School, Alliston, July 2013 When was this published? Observational Evidence for Arctic
GCOM-W2 Water & Winds Mission
 GCOM-W2 Water & Winds Mission Mark Bourassa Florida State University With a lot of input from: Ernesto Rodriguez, Dudley Chelton, David Long, Nikolai Maxeminko, Frank Wentz, and Shang-Ping Xie And additional
Tropical Cyclone Hyperactivity in the Eastern and Central Caribbean Sea During the 2005 Atlantic Hurricane Season
 Proceedings of the National Conference On Undergraduate Research (NCUR) 2006 The University of North Carolina at Asheville Asheville, North Carolina April 6 8, 2006 Tropical Cyclone Hyperactivity in the
Oceanic Eddies in the VOCALS Region of the Southeast Pacific Ocean
 Oceanic Eddies in the VOCALS Region of the Southeast Pacific Ocean Outline: Overview of VOCALS Dudley B. Chelton Oregon State University Overview of the oceanographic component of VOCALS Preliminary analysis
DEPARTMENT OF EARTH & CLIMATE SCIENCES Name SAN FRANCISCO STATE UNIVERSITY Nov 29, ERTH 360 Test #2 200 pts
 DEPARTMENT OF EARTH & CLIMATE SCIENCES Name SAN FRANCISCO STATE UNIVERSITY Nov 29, 2018 ERTH 360 Test #2 200 pts Each question is worth 4 points. Indicate your BEST CHOICE for each question on the Scantron
Mesoscale meteorological models. Claire L. Vincent, Caroline Draxl and Joakim R. Nielsen
 Mesoscale meteorological models Claire L. Vincent, Caroline Draxl and Joakim R. Nielsen Outline Mesoscale and synoptic scale meteorology Meteorological models Dynamics Parametrizations and interactions
Integrating Multiple Scatterometer Observations into a Climate Data Record of Ocean Vector Winds
 Integrating Multiple Scatterometer Observations into a Climate Data Record of Ocean Vector Winds Lucrezia Ricciardulli and Frank Wentz Remote Sensing Systems, CA, USA E-mail: Ricciardulli@remss.com presented
Dmitry Dukhovskoy and Mark Bourassa
 Dmitry Dukhovskoy and Mark Bourassa Center for Ocean-Atmospheric Prediction Studies Florida State University Funded by the NASA OVWST, HYCOM consortium and NSF AOMIP Acknowledgement: P. Hughes (FSU), E.J.
Lecture 1. Amplitude of the seasonal cycle in temperature
 Lecture 6 Lecture 1 Ocean circulation Forcing and large-scale features Amplitude of the seasonal cycle in temperature 1 Atmosphere and ocean heat transport Trenberth and Caron (2001) False-colour satellite
EVALUATION OF WINDSAT SURFACE WIND DATA AND ITS IMPACT ON OCEAN SURFACE WIND ANALYSES AND NUMERICAL WEATHER PREDICTION
 5.8 EVALUATION OF WINDSAT SURFACE WIND DATA AND ITS IMPACT ON OCEAN SURFACE WIND ANALYSES AND NUMERICAL WEATHER PREDICTION Robert Atlas* NOAA/Atlantic Oceanographic and Meteorological Laboratory, Miami,
IMPACT OF SOIL FREEZING ON THE CONTINENTAL-SCALE SEASONAL CYCLE SIMULATED BY A GENERAL CIRCULATION MODEL
 IMPACT OF SOIL FREEZING ON THE CONTINENTAL-SCALE SEASONAL CYCLE SIMULATED BY A GENERAL CIRCULATION MODEL Kumiko Takata 1, Masahide Kimoto 2 1. Domestic Research Fellow, National Institute of Environmental
A comparative assessment of monthly mean wind speed products over the global ocean
 INTERNATIONAL JOURNAL OF CLIMATOLOGY Int. J. Climatol. 33: 2520 2541 (2013) Published online 16 November 2012 in Wiley Online Library (wileyonlinelibrary.com) DOI: 10.1002/joc.3606 A comparative assessment
A diurnally corrected highresolution
 A diurnally corrected highresolution SST analysis Andy Harris 1, Jonathan Mittaz 1,4, Gary Wick 3, Prabhat Koner 1, Eileen Maturi 2 1 NOAA-CICS, University of Maryland 2 NOAA/NESDIS/STAR 3 NOAA/OAR/ESRL
A perturbed physics ensemble climate modeling. requirements of energy and water cycle. Yong Hu and Bruce Wielicki
 A perturbed physics ensemble climate modeling study for defining satellite measurement requirements of energy and water cycle Yong Hu and Bruce Wielicki Motivation 1. Uncertainty of climate sensitivity
Impact of the Loss of QuikSCAT on NOAA NWS Marine Warning and
 Impact of the Loss of QuikSCAT on NOAA NWS Marine Warning and Forecast Operations Joseph Sienkiewicz 1 Michael J. Brennan 2, Richard Knabb 3, Paul S. Chang 4, Hugh Cobb 2, Zorana J. Jelenak 5, Khalil A.
Richard W. Reynolds * NOAA National Climatic Data Center, Asheville, North Carolina
 8.1 A DAILY BLENDED ANALYSIS FOR SEA SURFACE TEMPERATURE Richard W. Reynolds * NOAA National Climatic Data Center, Asheville, North Carolina Kenneth S. Casey NOAA National Oceanographic Data Center, Silver
Simulating and Visualizing Hurricane-Ocean Interactions using High-Resolution CESM
 Simulating and Visualizing Hurricane-Ocean Interactions using High-Resolution CESM Ryan Sriver, Dept. of Atmospheric Sciences, University of Illinois Hui Li, Dept. of Atmospheric Sciences, University of
HWRF Ocean: MPIPOM-TC
 HWRF v3.7a Tutorial Nanjing, China, December 2, 2015 HWRF Ocean: MPIPOM-TC Ligia Bernardet NOAA SRL Global Systems Division, Boulder CO University of Colorado CIRS, Boulder CO Acknowledgement Richard Yablonsky
IMPORTANCE OF SATELLITE DATA (FOR REANALYSIS AND BEYOND) Jörg Schulz EUMETSAT
 Jörg Schulz EUMETSAT") IMPORTANCE OF SATELLITE DATA (FOR REANALYSIS AND BEYOND) Jörg Schulz EUMETSAT Why satellite data for climate monitoring? Global coverage Global consistency, sometimes also temporal consistency High spatial
IMPORTANCE OF SATELLITE DATA (FOR REANALYSIS AND BEYOND) Jörg Schulz EUMETSAT Why satellite data for climate monitoring? Global coverage Global consistency, sometimes also temporal consistency High spatial
HWRF Ocean: The Princeton Ocean Model. HWRF Tutorial NCWCP, College Park, MD January 2018
 HWRF Ocean: The Princeton Ocean Model Isaac Ginis Graduate School of Oceanography University of Rhode Island HWRF Tutorial NCWCP, College Park, MD 23-25 January 2018 1 1 Why Couple a 3-D Ocean Model to
Assimilation of satellite derived soil moisture for weather forecasting
 Assimilation of satellite derived soil moisture for weather forecasting www.cawcr.gov.au Imtiaz Dharssi and Peter Steinle February 2011 SMOS/SMAP workshop, Monash University Summary In preparation of the
Strongly coupled data assimilation experiments with a full OGCM and an atmospheric boundary layer model: preliminary results
 Strongly coupled data assimilation experiments with a full OGCM and an atmospheric boundary layer model: preliminary results Andrea Storto CMCC, Bologna, Italy Coupled Data Assimilation Workshop Toulouse,
The Effect of Sea Spray on Tropical Cyclone Intensity
 The Effect of Sea Spray on Tropical Cyclone Intensity Jeffrey S. Gall, Young Kwon, and William Frank The Pennsylvania State University University Park, Pennsylvania 16802 1. Introduction Under high-wind
Ocean Vector Wind as Essential Climate Variable.
 Ocean Vector Wind as Essential Climate Variable Ad.Stoffelen@knmi.nl Context WCRP, World Climate Research Program WOAP, WCRP Observation Assimilation Panel GCOS, Global Climate Observing System Essential
Extreme Weather and Climate Change: the big picture Alan K. Betts Atmospheric Research Pittsford, VT NESC, Saratoga, NY
 Extreme Weather and Climate Change: the big picture Alan K. Betts Atmospheric Research Pittsford, VT http://alanbetts.com NESC, Saratoga, NY March 10, 2018 Increases in Extreme Weather Last decade: lack
SST in Climate Research
 SST in Climate Research Roger Saunders, Met Office with inputs from Nick Rayner, John Kennedy, Rob Smith, Karsten Fennig, Sarah Millington, Owen Embury. This work is supported by the Joint DECC and Defra
Climate Outlook through 2100 South Florida Ecological Services Office Vero Beach, FL September 9, 2014
 Climate Outlook through 2100 South Florida Ecological Services Office Vero Beach, FL September 9, 2014 Short Term Drought Map: Short-term (
2013 ATLANTIC HURRICANE SEASON OUTLOOK. June RMS Cat Response
 2013 ATLANTIC HURRICANE SEASON OUTLOOK June 2013 - RMS Cat Response Season Outlook At the start of the 2013 Atlantic hurricane season, which officially runs from June 1 to November 30, seasonal forecasts
Large-Eddy Simulations of Tropical Convective Systems, the Boundary Layer, and Upper Ocean Coupling
 DISTRIBUTION STATEMENT A. Approved for public release; distribution is unlimited. Large-Eddy Simulations of Tropical Convective Systems, the Boundary Layer, and Upper Ocean Coupling Eric D. Skyllingstad
The World Ocean. Pacific Ocean 181 x 10 6 km 2. Indian Ocean 74 x 10 6 km 2. Atlantic Ocean 106 x 10 6 km 2
 The World Ocean The ocean and adjacent seas cover 70.8% of the surface of Earth, an area of 361,254,000 km 2 Pacific Ocean 181 x 10 6 km 2 Indian Ocean 74 x 10 6 km 2 Atlantic Ocean 106 x 10 6 km 2 Oceanic
Scatterometer Wind Assimilation at the Met Office
 Scatterometer Wind Assimilation at the Met Office James Cotton International Ocean Vector Winds Science Team (IOVWST) meeting, Brest, June 2014 Outline Assimilation status Global updates: Metop-B and spatial
Lake parameters climatology for cold start runs (lake initialization) in the ECMWF forecast system
 in the ECMWF forecast system") 2nd Workshop on Parameterization of Lakes in Numerical Weather Prediction and Climate Modelling Lake parameters climatology for cold start runs (lake initialization) in the ECMWF forecast system R. Salgado(1),
2nd Workshop on Parameterization of Lakes in Numerical Weather Prediction and Climate Modelling Lake parameters climatology for cold start runs (lake initialization) in the ECMWF forecast system R. Salgado(1),
An Overview of Atmospheric Analyses and Reanalyses for Climate
 An Overview of Atmospheric Analyses and Reanalyses for Climate Kevin E. Trenberth NCAR Boulder CO Analysis Data Assimilation merges observations & model predictions to provide a superior state estimate.
Variations of total heat flux during typhoons in the South China Sea
 78 Variations of total heat flux during typhoons in the South China Sea Wan Ruslan Ismail 1, and Tahereh Haghroosta 2,* 1 Section of Geography, School of Humanities, Universiti Sains Malaysia, 11800 Minden,
Daily OI SST Trip Report Richard W. Reynolds National Climatic Data Center (NCDC) Asheville, NC July 29, 2005
 Asheville, NC July 29, 2005") Daily OI SST Trip Report Richard W. Reynolds National Climatic Data Center (NCDC) Asheville, NC July 29, 2005 I spent the month of July 2003 working with Professor Dudley Chelton at the College of Oceanic
Daily OI SST Trip Report Richard W. Reynolds National Climatic Data Center (NCDC) Asheville, NC July 29, 2005 I spent the month of July 2003 working with Professor Dudley Chelton at the College of Oceanic
SMAP Winds. Hurricane Irma Sep 5, AMS 33rd Conference on Hurricanes and Tropical Meteorology Ponte Vedra, Florida, 4/16 4/20, 2018
 Intensity and Size of Strong Tropical Cyclones in 2017 from NASA's SMAP L-Band Radiometer Thomas Meissner, Lucrezia Ricciardulli, Frank Wentz, Remote Sensing Systems, Santa Rosa, USA Charles Sampson, Naval
Global analysis of ocean surface fluxes of heat and freshwater: satellite products, NWP analyses, and CMIP simulations
 NASA NEWS: Year 4 Annual Report Title: PI: Co-Is: Global analysis of ocean surface fluxes of heat and freshwater: satellite products, NWP analyses, and CMIP simulations Judith A. Curry Carol Ann Clayson,
Ocean variability contributing to basal melt rate near the ice front of Ross Ice Shelf, Antarctica
 Ocean variability contributing to basal melt rate near the ice front of Ross Ice Shelf, Antarctica Laurie Padman I. Arzeno, R.C. Beardsley, R. Limeburner, B. Owens, S.R. Springer, C.L. Stewart, M.J.M.
An Introduction to Coupled Models of the Atmosphere Ocean System
 An Introduction to Coupled Models of the Atmosphere Ocean System Jonathon S. Wright jswright@tsinghua.edu.cn Atmosphere Ocean Coupling 1. Important to climate on a wide range of time scales Diurnal to
Glaciology HEAT BUDGET AND RADIATION
 HEAT BUDGET AND RADIATION A Heat Budget 1 Black body radiation Definition. A perfect black body is defined as a body that absorbs all radiation that falls on it. The intensity of radiation emitted by a
Status and Plans of using the scatterometer winds in JMA's Data Assimilation and Forecast System
 Status and Plans of using the scatterometer winds in 's Data Assimilation and Forecast System Masaya Takahashi¹ and Yoshihiko Tahara² 1- Numerical Prediction Division, Japan Meteorological Agency () 2-
Transient/Eddy Flux. Transient and Eddy. Flux Components. Lecture 7: Disturbance (Outline) Why transients/eddies matter to zonal and time means?
 Why transients/eddies matter to zonal and time means?") Lecture 7: Disturbance (Outline) Transients and Eddies Climate Roles Mid-Latitude Cyclones Tropical Hurricanes Mid-Ocean Eddies (From Weather & Climate) Flux Components (1) (2) (3) Three components contribute
Lecture 7: Disturbance (Outline) Transients and Eddies Climate Roles Mid-Latitude Cyclones Tropical Hurricanes Mid-Ocean Eddies (From Weather & Climate) Flux Components (1) (2) (3) Three components contribute
ATOC 5051 INTRODUCTION TO PHYSICAL OCEANOGRAPHY. Lecture 19. Learning objectives: develop a physical understanding of ocean thermodynamic processes
 ATOC 5051 INTRODUCTION TO PHYSICAL OCEANOGRAPHY Lecture 19 Learning objectives: develop a physical understanding of ocean thermodynamic processes 1. Ocean surface heat fluxes; 2. Mixed layer temperature