Complex statistics of Synthetic Aperture Radar data using high resolution TerraSAR-X images Anca Popescu, Mihai Datcu, Madalin Frunzete
|
|
|
- Catherine Charleen Doyle
- 5 years ago
- Views:
Transcription


1 Complex statistics of Synthetic Aperture Radar data using high resolution TerraSAR-X images Anca Popescu, Mihai Datcu, Madalin Frunzete The 5 th TerraSAR-X Science Team Meeting DLR, 2013
2 Outline 1. Problem statement SAR data modeling 2. The increased resolution problem 3. General assumptions on SAR data statistics 4. Statistical testing 1. Experimental data 2. Results and discussion 7. Conclusions

3 1. Problem statement SAR data modeling Generally the complex SAR signal is treated as proper circular random process, under the assumption that the real and imaginary parts are independent Gaussian distributed random variables. However, in practice, this assumption rarely validates, especially with very high resolution data. The implications are on the usage of special statistics adapted for complex signals which do not follow the circularity assumptions.
4 1. Problem statement SAR data modeling Information in EO SAR data: - Geometry - Patterns and structures - Time changes - Texture - Artifacts and distorssions - Phase. Most of the SAR processing tools rely on assumed data models and preprocess data Most of the remote sensing applications make use of data statistics Huge amount of data used in KDD, which depend on correctly assessed data properties

5 1. Problem statement SAR data modeling KDD Process Model definition is essential for Knowledge Extraction training, fitting, tuning - prediction error

6 1. Problem statement SAR data modeling Increased number of applications and techniques, increased number of missions, higher resolution, higher quality, increased information Smaller observation time intervals for the signal to be assumed stationary.


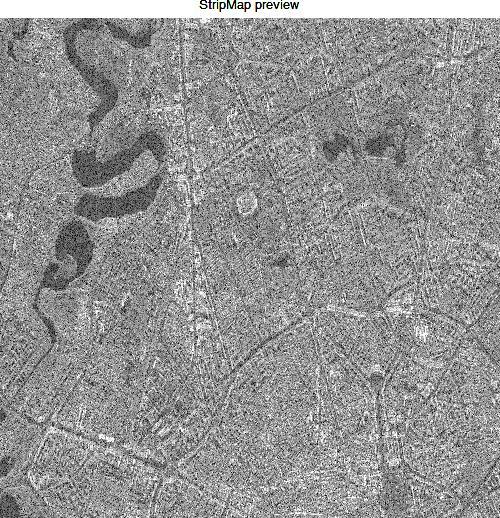
7 2. The increased resolution problem ERS 1, TerraSAR-X StripMap and TerraSAR-X High Resolution Spotlight of Bucharest and House of Parliament
 y n 1 exp( ny), n, y 0 Multiplicative model for speckle to take into account the image formation process (valid for all coherent data acquisitions) The bivariate Gaussian model assumes real")
8 3. General assumptions on SAR data statistics The speckle intensity after multi-looking is generally modeled as a Gamma distributed random variable assumption holds for homogeneous areas f Yi ( y) n n ( n) y n 1 exp( ny), n, y 0 Multiplicative model for speckle to take into account the image formation process (valid for all coherent data acquisitions) The bivariate Gaussian model assumes real and imaginary parts independent and identically distributed zero mean random variables (1 look Rayleigh distribution, n-looks Gamma distribution)
9 3. General assumptions on SAR data statistics The Gaussian distribution is the most commonly employed model for the observed data, mainly to facilitate computation seldom confirmed in practice Intensity backscatter is modeled as generalized inverse Gaussian, particularized for different scattering cases (homogeneous Gamma, heterogeneous K- distribution, very heterogeneous G-Zero distribution) Complex statistics pseudo-covariance, pseudo power spectral density, almost never employed Covz[ k ~ Cov [ k z 1 1, k, k 2 2 ] E{ z[ k ] 1 E{ z[ k 1 ] z * [ k ] z[ k 2 2 ]} ]}
10 4. Statistical testing 1. Distribution fitting on a class-dependent approach 2. Zero Mean Gaussian assumption for real and imaginary parts 3. Goodness of fit for Gaussian distribution test 4. Statistical independence test 5. Pseudo-covariance computation and assessment

11 4. Statistical testing Data characteristics


12 4. Statistical testing Data characteristics Water Tested classes Preview Industrial Area Park Parliament Sports Arena Apartment blocks Road Houses
13 4. Statistical testing Distribution fitting on a class-dependent approach Fit all valid distributions to the data (for real and imaginary parts, amplitude and intensity) Estimation performed based on Bayes Information Criterion (BIC) and Akaike Information Criterion (AIC) Evaluate distribution parameters Fitted distributions : Normal, t-location scale, Logistic, Exponential, Generalized Extreme Value, Generalized pareto


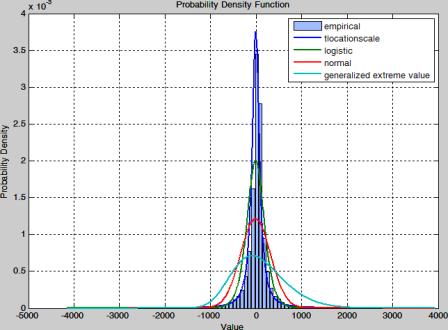


14 4. Statistical testing Distribution Fitting Water Park Sports Arena Road StripMap Industrial Area Parliament Apartment blocks Houses Spotlight

 Test")


15 4. Statistical testing Hypothesis testing (normal distribution) Test the real and imaginary parts for SM and HS samples from 8 different classes against the hypothesis that they come from a normal distribution. Water Park Sports Arena Road StripMap Industrial Area Parliament Apartment blocks Houses Spotlight
16 4. Statistical testing Hypothesis testing (Gaussian distribution) Chi-square goodness-of-fit test the real and imaginary parts for SM and HS samples from 8 different classes against the hypothesis that they come from a normal distribution. SM Tested classes Chi-square test score (null hypothesis rejected at 5 % significance level) Chi-square Test Score (1 = fail) T-Test Score (zero-mean normal distribution) HS Chi-square Test Score (1 = fail) Water 1 0 Water 1 0 T-Test Score (zero-mean normal distribution) Park 1 0 Park 1 1 Grassland 1 0 Industrial Area 1 1 Sports Arena 1 1 Parliament 1 0 Road 1 1 Apartment blocks 1 0 Apartment blocks 1 0 Houses 1 0
17 4. Statistical testing Statistical Independence Test the independence of real and imaginary parts. Hypotheses: H0: real (R) and imaginary (I) parts are statistically independent H1: real and imaginary parts are dependent Two successive transforms are applied on each of the two investigated random variables : R and I are are uniformly distributed in the (0; 1) interval, and U and V are standard normal random variables. By this approach, the entire independence analysis is shifted by the two transforms from the (R, I) coordinates to (R, I ) coordinates and finally to the (u, v) coordinates. R I R' U I' V


18 4. Statistical testing Statistical Independence Algorithm:
19 4. Statistical testing Statistical Independence Water Corr = 0,0173 t = 1,7313 h= 1 Park Corr = -0,0041 t = 0,4199 h= 1 Sports Arena Corr = t = h = 1 Road Corr = t = 2,0512 h = 0 Industrial Area Corr = 0,0013 t = 0,1611 h= 1 Parliament Corr = 0,122 t =2,4339 h= 0 Apartment blocks Corr = -0,0012 t =0,1733 h= 1 Houses Corr = -0,0061 t =0,8565 h= 1
20 4. Complex statistics pseudo covariance Second order statistics of complex signals are usually described by the covariance function : z( t) [ x( t), y( t)] T, z( t) x( t) i y( t) Cov z ( t1, t2) E{ z( t1) z *( t The covariance function is not always sufficient to completely describe the second order statistics. The pseudo-covariance function is defined as: ~ Cov z ( t1, t2) E{ z( t1) z( t If the signal is circular, then the pseudo-covariance function vanishes and the covariance is sufficient. A second-order circular signal is a signal whose secondorder statistics are invariant in any phase transformation. 2 )} 2 )}

21 4. Complex statistics pseudo covariance Circularity test for SM and HS data: Water Park Sports Arena Road Industrial Area Parliament Apartment blocks Houses
22 4. Conclusions Even with reduced analysis window size, the increased heterogeneity of high resolution SAR image signal leads to failure in most hypothesis testing scenarios. Areas which appear to be homogeneous and ensure WSS fail statistical tests in most of the cases Heterogeneous and man-made structures never obey generally accepted statistical hypotheses In order to describe the second-order properties of complex random signals completely, it is necessary to use two moments: the classical covariance function, and the pseudo-covariance function. As a direct consequence, PSD and pseudo-psd should be employed WSS should be extended to SOS (second order stationarity), to take into account the pseudo-covariance
Improved PSI Performance for Landslide Monitoring Applications. J. Duro, R. Iglesias, P. Blanco-Sánchez, F. Sánchez and D. Albiol
 Improved PSI Performance for Landslide Monitoring Applications J. Duro, R. Iglesias, P. Blanco-Sánchez, F. Sánchez and D. Albiol Outline Area of Study Previous PSI (and others) studies Main conclusions
Shashi Kumar. Indian Institute of Remote Sensing. (Indian Space Research Organisation)
") Practical-1 SAR Image Interpretation Shashi Kumar Indian Institute of Remote Sensing (Indian Space Research Organisation) Department of Space, Government of India 04 Kalidas Road, Dehradun - 248 001, U.K.
Practical-1 SAR Image Interpretation Shashi Kumar Indian Institute of Remote Sensing (Indian Space Research Organisation) Department of Space, Government of India 04 Kalidas Road, Dehradun - 248 001, U.K.
Statistics Introductory Correlation
 Statistics Introductory Correlation Session 10 oscardavid.barrerarodriguez@sciencespo.fr April 9, 2018 Outline 1 Statistics are not used only to describe central tendency and variability for a single variable.
Nemours Biomedical Research Biostatistics Core Statistics Course Session 4. Li Xie March 4, 2015
 Nemours Biomedical Research Biostatistics Core Statistics Course Session 4 Li Xie March 4, 2015 Outline Recap: Pairwise analysis with example of twosample unpaired t-test Today: More on t-tests; Introduction
STT 843 Key to Homework 1 Spring 2018
 STT 843 Key to Homework Spring 208 Due date: Feb 4, 208 42 (a Because σ = 2, σ 22 = and ρ 2 = 05, we have σ 2 = ρ 2 σ σ22 = 2/2 Then, the mean and covariance of the bivariate normal is µ = ( 0 2 and Σ
An Investigation of the Generalised Range-Based Detector in Pareto Distributed Clutter
 Progress In Electromagnetics Research C, Vol. 85, 1 8, 2018 An Investigation of the Generalised Range-Based Detector in Pareto Distributed Clutter Graham V. Weinberg * and Charlie Tran Abstract The purpose
A Family of Distribution-Entropy MAP Speckle Filters for Polarimetric SAR Data, and for Single or Multi-Channel Detected and Complex SAR Images
 A Family of Distribution-Entropy MAP Specle Filters for Polarimetric SAR Data, and for Single or Multi-Channel Detected and Complex SAR Images Edmond NEZRY and Francis YAKAM-SIMEN PRIVATEERS N.V., Private
Stochastic Processes. M. Sami Fadali Professor of Electrical Engineering University of Nevada, Reno
 Stochastic Processes M. Sami Fadali Professor of Electrical Engineering University of Nevada, Reno 1 Outline Stochastic (random) processes. Autocorrelation. Crosscorrelation. Spectral density function.
MARINE AND MARITIME SAR APPLICATIONS: COSMO-SKYMED FROM 1 ST TO 2 ND GENERATION
 MARINE AND MARITIME SAR APPLICATIONS: COSMO-SKYMED FROM 1 ST TO 2 ND GENERATION Maurizio Migliaccio, Ferdinando Nunziata, Andrea Buono Dipartimento di Ingegneria, Università degli Studi di Napoli Parthenope
Name of the Student: Problems on Discrete & Continuous R.Vs
 Engineering Mathematics 08 SUBJECT NAME : Probability & Random Processes SUBJECT CODE : MA645 MATERIAL NAME : University Questions REGULATION : R03 UPDATED ON : November 07 (Upto N/D 07 Q.P) (Scan the
Outline for Today. Review of In-class Exercise Bivariate Hypothesis Test 2: Difference of Means Bivariate Hypothesis Testing 3: Correla
 Outline for Today 1 Review of In-class Exercise 2 Bivariate hypothesis testing 2: difference of means 3 Bivariate hypothesis testing 3: correlation 2 / 51 Task for ext Week Any questions? 3 / 51 In-class
Daniel Hogan 19. CSIR, Pretoria, South Africa Natural Resources & Environment Earth Observations
 Daniel Hogan 19 CSIR, Pretoria, South Africa Natural Resources & Environment Earth Observations My (initial) Work Initially, my project was an extension of the work from last year. I was to download and
P 1.5 X 4.5 / X 2 and (iii) The smallest value of n for
 The smallest value of n for") DHANALAKSHMI COLLEGE OF ENEINEERING, CHENNAI DEPARTMENT OF ELECTRONICS AND COMMUNICATION ENGINEERING MA645 PROBABILITY AND RANDOM PROCESS UNIT I : RANDOM VARIABLES PART B (6 MARKS). A random variable X
DHANALAKSHMI COLLEGE OF ENEINEERING, CHENNAI DEPARTMENT OF ELECTRONICS AND COMMUNICATION ENGINEERING MA645 PROBABILITY AND RANDOM PROCESS UNIT I : RANDOM VARIABLES PART B (6 MARKS). A random variable X
Subject-specific observed profiles of log(fev1) vs age First 50 subjects in Six Cities Study
 vs age First 50 subjects in Six Cities Study") Subject-specific observed profiles of log(fev1) vs age First 50 subjects in Six Cities Study 1.4 0.0-6 7 8 9 10 11 12 13 14 15 16 17 18 19 age Model 1: A simple broken stick model with knot at 14 fit with
Subject-specific observed profiles of log(fev1) vs age First 50 subjects in Six Cities Study 1.4 0.0-6 7 8 9 10 11 12 13 14 15 16 17 18 19 age Model 1: A simple broken stick model with knot at 14 fit with
USE OF INTERFEROMETRIC SATELLITE SAR FOR EARTHQUAKE DAMAGE DETECTION ABSTRACT
 USE OF INTERFEROMETRIC SATELLITE SAR FOR EARTHQUAKE DAMAGE DETECTION Masashi Matsuoka 1 and Fumio Yamazaki 2 ABSTRACT Synthetic Aperture Radar (SAR) is one of the most promising remote sensing technologies
Seminar über Statistik FS2008: Model Selection
 Seminar über Statistik FS2008: Model Selection Alessia Fenaroli, Ghazale Jazayeri Monday, April 2, 2008 Introduction Model Choice deals with the comparison of models and the selection of a model. It can
Outline Introduction OLS Design of experiments Regression. Metamodeling. ME598/494 Lecture. Max Yi Ren
 1 / 34 Metamodeling ME598/494 Lecture Max Yi Ren Department of Mechanical Engineering, Arizona State University March 1, 2015 2 / 34 1. preliminaries 1.1 motivation 1.2 ordinary least square 1.3 information
Mapping small reservoirs in semi-arid regions using multitemporal SAR: methods and applications
 Mapping small reservoirs in semi-arid regions using multitemporal SAR: methods and applications Donato Amitrano Gerardo Di Martino Antonio Iodice Daniele Riccio Giuseppe Ruello University of Napoli, Italy
Introduction to Regression Analysis. Dr. Devlina Chatterjee 11 th August, 2017
 Introduction to Regression Analysis Dr. Devlina Chatterjee 11 th August, 2017 What is regression analysis? Regression analysis is a statistical technique for studying linear relationships. One dependent
Defect Detection using Nonparametric Regression
 Defect Detection using Nonparametric Regression Siana Halim Industrial Engineering Department-Petra Christian University Siwalankerto 121-131 Surabaya- Indonesia halim@petra.ac.id Abstract: To compare
Statistical Methods in Particle Physics
 Statistical Methods in Particle Physics Lecture 11 January 7, 2013 Silvia Masciocchi, GSI Darmstadt s.masciocchi@gsi.de Winter Semester 2012 / 13 Outline How to communicate the statistical uncertainty
TABLE OF CONTENTS CHAPTER 1 COMBINATORIAL PROBABILITY 1
 TABLE OF CONTENTS CHAPTER 1 COMBINATORIAL PROBABILITY 1 1.1 The Probability Model...1 1.2 Finite Discrete Models with Equally Likely Outcomes...5 1.2.1 Tree Diagrams...6 1.2.2 The Multiplication Principle...8
Performance Analysis of the Nonhomogeneity Detector for STAP Applications
 Performance Analysis of the Nonhomogeneity Detector for STAP Applications uralidhar Rangaswamy ARCON Corporation 6 Bear ill Rd. Waltham, assachusetts, USA Braham imed AFRL/SNRT 6 Electronic Parway Rome,
Hyung So0 Kim and Alfred 0. Hero
 WHEN IS A MAXIMAL INVARIANT HYPOTHESIS TEST BETTER THAN THE GLRT? Hyung So0 Kim and Alfred 0. Hero Department of Electrical Engineering and Computer Science University of Michigan, Ann Arbor, MI 48109-2122
ME3620. Theory of Engineering Experimentation. Spring Chapter IV. Decision Making for a Single Sample. Chapter IV
 Theory of Engineering Experimentation Chapter IV. Decision Making for a Single Sample Chapter IV 1 4 1 Statistical Inference The field of statistical inference consists of those methods used to make decisions
Appendix from L. J. Revell, On the Analysis of Evolutionary Change along Single Branches in a Phylogeny
 008 by The University of Chicago. All rights reserved.doi: 10.1086/588078 Appendix from L. J. Revell, On the Analysis of Evolutionary Change along Single Branches in a Phylogeny (Am. Nat., vol. 17, no.
Statistical techniques for data analysis in Cosmology
 Statistical techniques for data analysis in Cosmology arxiv:0712.3028; arxiv:0911.3105 Numerical recipes (the bible ) Licia Verde ICREA & ICC UB-IEEC http://icc.ub.edu/~liciaverde outline Lecture 1: Introduction
Fall 2017 STAT 532 Homework Peter Hoff. 1. Let P be a probability measure on a collection of sets A.
 1. Let P be a probability measure on a collection of sets A. (a) For each n N, let H n be a set in A such that H n H n+1. Show that P (H n ) monotonically converges to P ( k=1 H k) as n. (b) For each n
Information theoretical approach for domain ontology exploration in large Earth observation image archives
 Information theoretical approach for domain ontology exploration in large Earth observation image archives Mihai Datcu, Mariana Ciucu DLR Oberpfaffenhofen IGARSS 2004 KIM - Knowledge driven Information
ELEG 3143 Probability & Stochastic Process Ch. 6 Stochastic Process
 Department of Electrical Engineering University of Arkansas ELEG 3143 Probability & Stochastic Process Ch. 6 Stochastic Process Dr. Jingxian Wu wuj@uark.edu OUTLINE 2 Definition of stochastic process (random
Multivariate Time Series Analysis and Its Applications [Tsay (2005), chapter 8]
![Multivariate Time Series Analysis and Its Applications [Tsay (2005), chapter 8]](/thumbs/77/75858385.jpg "Multivariate Time Series Analysis and Its Applications [Tsay (2005), chapter 8]") 1 Multivariate Time Series Analysis and Its Applications [Tsay (2005), chapter 8] Insights: Price movements in one market can spread easily and instantly to another market [economic globalization and internet
1 Multivariate Time Series Analysis and Its Applications [Tsay (2005), chapter 8] Insights: Price movements in one market can spread easily and instantly to another market [economic globalization and internet
Model Estimation Example
 Ronald H. Heck 1 EDEP 606: Multivariate Methods (S2013) April 7, 2013 Model Estimation Example As we have moved through the course this semester, we have encountered the concept of model estimation. Discussions
Analysis of the Temporal Behavior of Coherent Scatterers (CSs) in ALOS PalSAR Data
 in ALOS PalSAR Data") Analysis of the Temporal Behavior of Coherent Scatterers (CSs) in ALOS PalSAR Data L. Marotti, R. Zandona-Schneider & K.P. Papathanassiou German Aerospace Center (DLR) Microwaves and Radar Institute0 PO.BOX
Analysis of the Temporal Behavior of Coherent Scatterers (CSs) in ALOS PalSAR Data L. Marotti, R. Zandona-Schneider & K.P. Papathanassiou German Aerospace Center (DLR) Microwaves and Radar Institute0 PO.BOX
Stochastic Processes: I. consider bowl of worms model for oscilloscope experiment:
 Stochastic Processes: I consider bowl of worms model for oscilloscope experiment: SAPAscope 2.0 / 0 1 RESET SAPA2e 22, 23 II 1 stochastic process is: Stochastic Processes: II informally: bowl + drawing
covariance function, 174 probability structure of; Yule-Walker equations, 174 Moving average process, fluctuations, 5-6, 175 probability structure of
 Index* The Statistical Analysis of Time Series by T. W. Anderson Copyright 1971 John Wiley & Sons, Inc. Aliasing, 387-388 Autoregressive {continued) Amplitude, 4, 94 case of first-order, 174 Associated
THE PYLA 2001 EXPERIMENT : EVALUATION OF POLARIMETRIC RADAR CAPABILITIES OVER A FORESTED AREA
 THE PYLA 2001 EXPERIMENT : EVALUATION OF POLARIMETRIC RADAR CAPABILITIES OVER A FORESTED AREA M. Dechambre 1, S. Le Hégarat 1, S. Cavelier 1, P. Dreuillet 2, I. Champion 3 1 CETP IPSL (CNRS / Université
Applied Probability and Stochastic Processes
 Applied Probability and Stochastic Processes In Engineering and Physical Sciences MICHEL K. OCHI University of Florida A Wiley-Interscience Publication JOHN WILEY & SONS New York - Chichester Brisbane
Testing methodology. It often the case that we try to determine the form of the model on the basis of data
 Testing methodology It often the case that we try to determine the form of the model on the basis of data The simplest case: we try to determine the set of explanatory variables in the model Testing for
Random Vibrations & Failure Analysis Sayan Gupta Indian Institute of Technology Madras
 Random Vibrations & Failure Analysis Sayan Gupta Indian Institute of Technology Madras Lecture 1: Introduction Course Objectives: The focus of this course is on gaining understanding on how to make an
arxiv: v1 [stat.co] 10 Jul 2012
![arxiv: v1 [stat.co] 10 Jul 2012](/thumbs/92/110326464.jpg "arxiv: v1 [stat.co] 10 Jul 2012") Pattern Analysis and Applications manuscript No. (will be inserted by the editor) Parametric and Nonparametric Tests for Speckled Imagery Renato J. Cintra Alejandro C. Frery Abraão D. C. Nascimento arxiv:1207.2378v1
Pattern Analysis and Applications manuscript No. (will be inserted by the editor) Parametric and Nonparametric Tests for Speckled Imagery Renato J. Cintra Alejandro C. Frery Abraão D. C. Nascimento arxiv:1207.2378v1
Threshold models with fixed and random effects for ordered categorical data
 Threshold models with fixed and random effects for ordered categorical data Hans-Peter Piepho Universität Hohenheim, Germany Edith Kalka Universität Kassel, Germany Contents 1. Introduction. Case studies
Likelihood-Based Methods
 Likelihood-Based Methods Handbook of Spatial Statistics, Chapter 4 Susheela Singh September 22, 2016 OVERVIEW INTRODUCTION MAXIMUM LIKELIHOOD ESTIMATION (ML) RESTRICTED MAXIMUM LIKELIHOOD ESTIMATION (REML)
Booth School of Business, University of Chicago Business 41914, Spring Quarter 2017, Mr. Ruey S. Tsay. Solutions to Midterm
 Booth School of Business, University of Chicago Business 41914, Spring Quarter 017, Mr Ruey S Tsay Solutions to Midterm Problem A: (51 points; 3 points per question) Answer briefly the following questions
Coherency Matrix Estimation of Heterogeneous Clutter in High-Resolution Polarimetric SAR Images
 IEEE TRANSACTIONS ON GEOSCIENCE AND REMOTE SENSING 1 Coherency Matrix Estimation of Heterogeneous Clutter in High-Resolution Polarimetric SAR Images Gabriel Vasile, Member, IEEE, Jean-Philippe Ovarlez,
Lecture 6: Univariate Volatility Modelling: ARCH and GARCH Models
 Lecture 6: Univariate Volatility Modelling: ARCH and GARCH Models Prof. Massimo Guidolin 019 Financial Econometrics Winter/Spring 018 Overview ARCH models and their limitations Generalized ARCH models
CHARACTERISTICS OF SNOW AND ICE MORPHOLOGICAL FEATURES DERIVED FROM MULTI-POLARIZATION TERRASAR-X DATA
 CHARACTERISTICS OF SNOW AND ICE MORPHOLOGICAL FEATURES DERIVED FROM MULTI-POLARIZATION TERRASAR-X DATA Dana Floricioiu 1, Helmut Rott 2, Thomas Nagler 2, Markus Heidinger 2 and Michael Eineder 1 1 DLR,
HYPOTHESIS TESTING: THE CHI-SQUARE STATISTIC
 1 HYPOTHESIS TESTING: THE CHI-SQUARE STATISTIC 7 steps of Hypothesis Testing 1. State the hypotheses 2. Identify level of significant 3. Identify the critical values 4. Calculate test statistics 5. Compare
hypothesis a claim about the value of some parameter (like p)
") Testing hypotheses hypothesis a claim about the value of some parameter (like p) significance test procedure to assess the strength of evidence provided by a sample of data against the claim of a hypothesized
Testing hypotheses hypothesis a claim about the value of some parameter (like p) significance test procedure to assess the strength of evidence provided by a sample of data against the claim of a hypothesized
Index. Regression Models for Time Series Analysis. Benjamin Kedem, Konstantinos Fokianos Copyright John Wiley & Sons, Inc. ISBN.
 Regression Models for Time Series Analysis. Benjamin Kedem, Konstantinos Fokianos Copyright 0 2002 John Wiley & Sons, Inc. ISBN. 0-471-36355-3 Index Adaptive rejection sampling, 233 Adjacent categories
Logistic Regression Analysis
 Logistic Regression Analysis Predicting whether an event will or will not occur, as well as identifying the variables useful in making the prediction, is important in most academic disciplines as well
Diversity of Settlement Categories in Very High Resolution SAR Images
 Diversity of Settlement Categories in Very High Resolution SAR Images Corneliu Octavian Dumitru Remote Sensing Technology Institute (IMF) German Aerospace Center (DLR) Oberpfaffenhofen Wessling, Germany
HANDBOOK OF APPLICABLE MATHEMATICS
 HANDBOOK OF APPLICABLE MATHEMATICS Chief Editor: Walter Ledermann Volume II: Probability Emlyn Lloyd University oflancaster A Wiley-Interscience Publication JOHN WILEY & SONS Chichester - New York - Brisbane
Bridging the two cultures: Latent variable statistical modeling with boosted regression trees
 Bridging the two cultures: Latent variable statistical modeling with boosted regression trees Thomas G. Dietterich and Rebecca Hutchinson Oregon State University Corvallis, Oregon, USA 1 A Species Distribution
Comparison of Harmonic, Geometric and Arithmetic means for change detection in SAR time series
 Comparison of Harmonic, Geometric and Arithmetic means for change detection in SAR time series Guillaume Quin, Béatrice Pinel-Puysségur, Jean-Marie Nicolas To cite this version: Guillaume Quin, Béatrice
Model Selection Tutorial 2: Problems With Using AIC to Select a Subset of Exposures in a Regression Model
 Model Selection Tutorial 2: Problems With Using AIC to Select a Subset of Exposures in a Regression Model Centre for Molecular, Environmental, Genetic & Analytic (MEGA) Epidemiology School of Population
Homework Exercises. 1. You want to conduct a test of significance for p the population proportion.
 Homework Exercises 1. You want to conduct a test of significance for p the population proportion. The test you will run is H 0 : p = 0.4 Ha: p > 0.4, n = 80. you decide that the critical value will be
Score test for random changepoint in a mixed model
 Score test for random changepoint in a mixed model Corentin Segalas and Hélène Jacqmin-Gadda INSERM U1219, Biostatistics team, Bordeaux GDR Statistiques et Santé October 6, 2017 Biostatistics 1 / 27 Introduction
Contents Preface iii 1 Origins and Manifestations of Speckle 2 Random Phasor Sums 3 First-Order Statistical Properties
 Contents Preface iii 1 Origins and Manifestations of Speckle 1 1.1 General Background............................. 1 1.2 Intuitive Explanation of the Cause of Speckle................ 2 1.3 Some Mathematical
Probability Space. J. McNames Portland State University ECE 538/638 Stochastic Signals Ver
 Stochastic Signals Overview Definitions Second order statistics Stationarity and ergodicity Random signal variability Power spectral density Linear systems with stationary inputs Random signal memory Correlation
RADAR REMOTE SENSING OF PLANETARY SURFACES
 RADAR REMOTE SENSING OF PLANETARY SURFACES BRUCE A. CAMPBELL Smithsonian Institution CAMBRIDGE UNIVERSITY PRESS Contents Acknowledgments page ix 1 Introduction 1 1.1 Radar remote sensing 1 1.2 Historical
Modeling and Performance Analysis with Discrete-Event Simulation
 Simulation Modeling and Performance Analysis with Discrete-Event Simulation Chapter 9 Input Modeling Contents Data Collection Identifying the Distribution with Data Parameter Estimation Goodness-of-Fit
CFAR DETECTION OF SPATIALLY DISTRIBUTED TARGETS IN K- DISTRIBUTED CLUTTER WITH UNKNOWN PARAMETERS
 CFAR DETECTION OF SPATIALLY DISTRIBUTED TARGETS IN K- DISTRIBUTED CLUTTER WITH UNKNOWN PARAMETERS N. Nouar and A.Farrouki SISCOM Laboratory, Department of Electrical Engineering, University of Constantine,
Advanced Econometrics
 Advanced Econometrics Marco Sunder Nov 04 2010 Marco Sunder Advanced Econometrics 1/ 25 Contents 1 2 3 Marco Sunder Advanced Econometrics 2/ 25 Music Marco Sunder Advanced Econometrics 3/ 25 Music Marco
PROVENCE INTER-COMPARISON. Marta Agudo, Michele Crosetto Institute of Geomatics
 PROVENCE INTER-COMPARISON Marta Agudo, Michele Crosetto Institute of Geomatics Final version Castelldefels, 16 March 2007 INDEX INDEX... 2 1. INTRODUCTION... 3 2. PRE-PROCESSING STEPS... 5 2.1 Input data...
Signal Detection Basics - CFAR
 Signal Detection Basics - CFAR Types of noise clutter and signals targets Signal separation by comparison threshold detection Signal Statistics - Parameter estimation Threshold determination based on the
Modeling of Atmospheric Effects on InSAR Measurements With the Method of Stochastic Simulation
 Modeling of Atmospheric Effects on InSAR Measurements With the Method of Stochastic Simulation Z. W. LI, X. L. DING Department of Land Surveying and Geo-Informatics, Hong Kong Polytechnic University, Hung
Fulong Chen Nicola Masini, Jie Liu, Jiangbin You, Rosa Lasaponara MAEIC
 Archaeological prospection in the Western Regions of Western Han Dynasty by satellite synthetic aperture radar data, case studies of Yumen Frontier Pass and Niya ruins Fulong Chen chenfl@radi.ac.cn Nicola
Non-gaussian spatiotemporal modeling
 Dec, 2008 1/ 37 Non-gaussian spatiotemporal modeling Thais C O da Fonseca Joint work with Prof Mark F J Steel Department of Statistics University of Warwick Dec, 2008 Dec, 2008 2/ 37 1 Introduction Motivation
Testing Hypothesis. Maura Mezzetti. Department of Economics and Finance Università Tor Vergata
 Maura Department of Economics and Finance Università Tor Vergata Hypothesis Testing Outline It is a mistake to confound strangeness with mystery Sherlock Holmes A Study in Scarlet Outline 1 The Power Function
Signal Modeling Techniques in Speech Recognition. Hassan A. Kingravi
 Signal Modeling Techniques in Speech Recognition Hassan A. Kingravi Outline Introduction Spectral Shaping Spectral Analysis Parameter Transforms Statistical Modeling Discussion Conclusions 1: Introduction
AMS7: WEEK 7. CLASS 1. More on Hypothesis Testing Monday May 11th, 2015
 AMS7: WEEK 7. CLASS 1 More on Hypothesis Testing Monday May 11th, 2015 Testing a Claim about a Standard Deviation or a Variance We want to test claims about or 2 Example: Newborn babies from mothers taking
Statistics Ph.D. Qualifying Exam: Part I October 18, 2003
 Statistics Ph.D. Qualifying Exam: Part I October 18, 2003 Student Name: 1. Answer 8 out of 12 problems. Mark the problems you selected in the following table. 1 2 3 4 5 6 7 8 9 10 11 12 2. Write your answer
Probability and Statistics for Final Year Engineering Students
 Probability and Statistics for Final Year Engineering Students By Yoni Nazarathy, Last Updated: May 24, 2011. Lecture 6p: Spectral Density, Passing Random Processes through LTI Systems, Filtering Terms
Second Midterm Exam Economics 410 Thurs., April 2, 2009
 Second Midterm Exam Economics 410 Thurs., April 2, 2009 Show All Work. Only partial credit will be given for correct answers if we can not figure out how they were derived. Note that we have not put equal
TIME SERIES ANALYSIS AND FORECASTING USING THE STATISTICAL MODEL ARIMA
 CHAPTER 6 TIME SERIES ANALYSIS AND FORECASTING USING THE STATISTICAL MODEL ARIMA 6.1. Introduction A time series is a sequence of observations ordered in time. A basic assumption in the time series analysis
Parametric Signal Modeling and Linear Prediction Theory 1. Discrete-time Stochastic Processes
 Parametric Signal Modeling and Linear Prediction Theory 1. Discrete-time Stochastic Processes Electrical & Computer Engineering North Carolina State University Acknowledgment: ECE792-41 slides were adapted
Supervised Baysian SAR image Classification Using The Full Polarimetric Data
 Supervised Baysian SAR iage Classification Using The Full Polarietric Data (1) () Ziad BELHADJ (1) SUPCOM, Route de Raoued 3.5 083 El Ghazala - TUNSA () ENT, BP. 37, 100 Tunis Belvedere, TUNSA Abstract
PATTERN RECOGNITION AND MACHINE LEARNING
 PATTERN RECOGNITION AND MACHINE LEARNING Slide Set 3: Detection Theory January 2018 Heikki Huttunen heikki.huttunen@tut.fi Department of Signal Processing Tampere University of Technology Detection theory
Bayesian-based Wavelet Shrinkage for SAR Image Despeckling Using Cycle Spinning *
 Jun. 006 Journal of Electronic Science and Technology of China Vol.4 No. ayesian-based Wavelet Shrinkage for SAR Image Despeckling Using Cycle Spinning * ZHANG De-xiang,, GAO Qing-wei,, CHEN Jun-ning.
Ch 6. Model Specification. Time Series Analysis
 We start to build ARIMA(p,d,q) models. The subjects include: 1 how to determine p, d, q for a given series (Chapter 6); 2 how to estimate the parameters (φ s and θ s) of a specific ARIMA(p,d,q) model (Chapter
Chapter 1 Statistical Inference
 Chapter 1 Statistical Inference causal inference To infer causality, you need a randomized experiment (or a huge observational study and lots of outside information). inference to populations Generalizations
Testing and Model Selection
 Testing and Model Selection This is another digression on general statistics: see PE App C.8.4. The EViews output for least squares, probit and logit includes some statistics relevant to testing hypotheses
Stat 5101 Lecture Notes
 Stat 5101 Lecture Notes Charles J. Geyer Copyright 1998, 1999, 2000, 2001 by Charles J. Geyer May 7, 2001 ii Stat 5101 (Geyer) Course Notes Contents 1 Random Variables and Change of Variables 1 1.1 Random
Statistics 251: Statistical Methods
 Statistics 251: Statistical Methods 1-sample Hypothesis Tests Module 9 2018 Introduction We have learned about estimating parameters by point estimation and interval estimation (specifically confidence
AR, MA and ARMA models
 AR, MA and AR by Hedibert Lopes P Based on Tsay s Analysis of Financial Time Series (3rd edition) P 1 Stationarity 2 3 4 5 6 7 P 8 9 10 11 Outline P Linear Time Series Analysis and Its Applications For
Exercises Chapter 4 Statistical Hypothesis Testing
 Exercises Chapter 4 Statistical Hypothesis Testing Advanced Econometrics - HEC Lausanne Christophe Hurlin University of Orléans December 5, 013 Christophe Hurlin (University of Orléans) Advanced Econometrics
Dr. Simon Plank. German Remote Sensing Data Center (DFD), German Aerospace Center (DLR)
, German Aerospace Center (DLR)") Pre-survey suitability analysis of the differential and persistent scatterer synthetic ti aperture radar interferometry t method for deformation monitoring of landslides Dr. Simon Plank German Remote Sensing
Pre-survey suitability analysis of the differential and persistent scatterer synthetic ti aperture radar interferometry t method for deformation monitoring of landslides Dr. Simon Plank German Remote Sensing
Circle the single best answer for each multiple choice question. Your choice should be made clearly.
 TEST #1 STA 4853 March 6, 2017 Name: Please read the following directions. DO NOT TURN THE PAGE UNTIL INSTRUCTED TO DO SO Directions This exam is closed book and closed notes. There are 32 multiple choice
Dependence. MFM Practitioner Module: Risk & Asset Allocation. John Dodson. September 11, Dependence. John Dodson. Outline.
 MFM Practitioner Module: Risk & Asset Allocation September 11, 2013 Before we define dependence, it is useful to define Random variables X and Y are independent iff For all x, y. In particular, F (X,Y
M.Sc. (MATHEMATICS WITH APPLICATIONS IN COMPUTER SCIENCE) M.Sc. (MACS)
 M.Sc. (MACS)") No. of Printed Pages : 6 MMT-008 M.Sc. (MATHEMATICS WITH APPLICATIONS IN COMPUTER SCIENCE) M.Sc. (MACS) Term-End Examination 0064 December, 202 MMT-008 : PROBABILITY AND STATISTICS Time : 3 hours Maximum
No. of Printed Pages : 6 MMT-008 M.Sc. (MATHEMATICS WITH APPLICATIONS IN COMPUTER SCIENCE) M.Sc. (MACS) Term-End Examination 0064 December, 202 MMT-008 : PROBABILITY AND STATISTICS Time : 3 hours Maximum
Using the MBES for classification of riverbed sediments
 Acoustics 8 Paris Using the MBES for classification of riverbed sediments A. Amiri-Simkooei a, M. Snellen a and D. G Simons b a Acoustic Remote Sensing Group, Delft Institute of Earth Observation and Space
3. (a) (8 points) There is more than one way to correctly express the null hypothesis in matrix form. One way to state the null hypothesis is
 (8 points) There is more than one way to correctly express the null hypothesis in matrix form. One way to state the null hypothesis is") Stat 501 Solutions and Comments on Exam 1 Spring 005-4 0-4 1. (a) (5 points) Y ~ N, -1-4 34 (b) (5 points) X (X,X ) = (5,8) ~ N ( 11.5, 0.9375 ) 3 1 (c) (10 points, for each part) (i), (ii), and (v) are
Stat 501 Solutions and Comments on Exam 1 Spring 005-4 0-4 1. (a) (5 points) Y ~ N, -1-4 34 (b) (5 points) X (X,X ) = (5,8) ~ N ( 11.5, 0.9375 ) 3 1 (c) (10 points, for each part) (i), (ii), and (v) are
5 Introduction to the Theory of Order Statistics and Rank Statistics
 5 Introduction to the Theory of Order Statistics and Rank Statistics This section will contain a summary of important definitions and theorems that will be useful for understanding the theory of order
1 Introduction. 2 AIC versus SBIC. Erik Swanson Cori Saviano Li Zha Final Project
 Erik Swanson Cori Saviano Li Zha Final Project 1 Introduction In analyzing time series data, we are posed with the question of how past events influences the current situation. In order to determine this,
You may not use your books/notes on this exam. You may use calculator.
 MATH 450 Fall 2018 Review problems 12/03/18 Time Limit: 60 Minutes Name (Print: This exam contains 6 pages (including this cover page and 5 problems. Check to see if any pages are missing. Enter all requested
Airborne Holographic SAR Tomography at L- and P-band
 Airborne Holographic SAR Tomography at L- and P-band O. Ponce, A. Reigber and A. Moreira. Microwaves and Radar Institute (HR), German Aerospace Center (DLR). 1 Outline Introduction to 3-D SAR Holographic
Earth Observatory of Singapore. Nina Lin 22 Jan 2018
 Earth Observatory of Singapore Nina Lin 22 Jan 2018 EOS Our Mission Our Mission Director Prof. Kerry Sieh The Earth Observatory of Singapore conducts fundamental research on earthquakes, volcanic eruptions,
Lesson 4: Stationary stochastic processes
 Dipartimento di Ingegneria e Scienze dell Informazione e Matematica Università dell Aquila, umberto.triacca@univaq.it Stationary stochastic processes Stationarity is a rather intuitive concept, it means
STATISTICS SYLLABUS UNIT I
 STATISTICS SYLLABUS UNIT I (Probability Theory) Definition Classical and axiomatic approaches.laws of total and compound probability, conditional probability, Bayes Theorem. Random variable and its distribution
Fundamentals of Statistical Signal Processing Volume II Detection Theory
 Fundamentals of Statistical Signal Processing Volume II Detection Theory Steven M. Kay University of Rhode Island PH PTR Prentice Hall PTR Upper Saddle River, New Jersey 07458 http://www.phptr.com Contents