Lecture 6: Univariate Volatility Modelling: ARCH and GARCH Models
|
|
|
- Oliver Logan
- 6 years ago
- Views:
Transcription
1 Lecture 6: Univariate Volatility Modelling: ARCH and GARCH Models Prof. Massimo Guidolin 019 Financial Econometrics Winter/Spring 018
2 Overview ARCH models and their limitations Generalized ARCH models and the reasons of their success Integrated GARCH Exponential GARCH and asymmetric effects in volatility
3 ARCH Models The key idea of ARCH is that conditional forecasts are generally vastly superior to unconditional forecasts Because the model is based on the decomposition and σσ tt+1 tt is time-varying provided that at least one of the coefficients α 1, α,, α p is positive, by Jensen s inequality, we have (*) Because ARCH(p) generates a symmetric return distribution to integrate to 1 the inflated tails must be compensated by the absence of probability mass in the intermediate range, ARCH captures the leptokurtic nature of asset returns 14
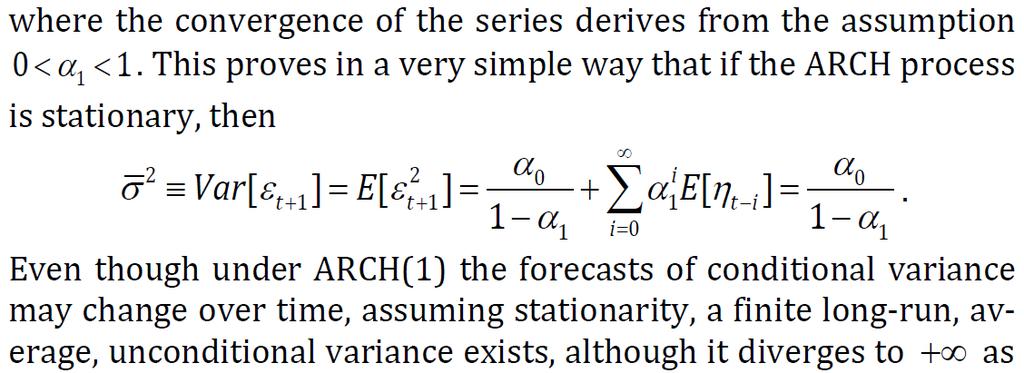
4 ARCH Models ARCH captures volatility clustering: large past squared innovations will lead to large forecasts of subsequent variance when all or most α 1, α,, α p coefficients are positive and non-negligible However, ARCH models cannot capture the existence of asymmetric reaction of conditional variance to positive vs. negative shocks ARCH(p), in particular ARCH(1) differs from RiskMetrics in ways: 1 It features no memory for recent, past variance forecasts It features a constant α 0 that was absent in RiskMetrics o When we set α 0 = 0 and α i = 1/W, then an ARCH(W) model simply becomes a rolling window variance model o Appendix A collects the moments and key properties of a ARCH(1) o Algebra in this Appendix establishes that long-run, ergodic variance from ARCH(p) is: Even though conditional variance changes over time, the model can be (covariance) stationary and the unconditional variance exists 15
5 ARCH Models: One Example Even though ARCH represents progress vs. simple rolling window, one limitation: in many, their specification is richly parameterized o Given the empirical success of RiskMetrics, a need to pick a large p does not come as surprise, because such a selection obviously surrogates the role played by σσ tt tt 1 on the RHS of RiskMetrics Consider CRSP stock excess daily returns o SACF/SPACF and information criteria analyses suggest a MA(1) mean p-values o SACF/SPACF of squared residuals give evidence of AR(5) at least 16
6 ARCH Models: One Example o BIC criterion for MA(1)/ARCH(6) is.446 and for MA(1)/ARCH(5) is.4513; therefore, we select the former model o Such a BIC is lower vs from a homoskedastic MA(1) model o The MA(1)/ARCH(6) model estimated by ML in Eviews is o Each of the estimated coefficients is positive and statistically significant and their sum is which establishes stationarity o One wonders if a more parsimonious way can be found 17
7 Are ARCH Models Enough? ARCH models are not set up or estimated to imply unconditional variance = sample variance and this may be embarrassing One constraint often imposed in estimation is variance targeting: o It guarantees that ARCH(p) yields unconditional = sample variance How do assess whether a CH model is adequate for a given application/data sets? 1 If a CH model is correctly specified, then the standardized residuals from the model should reflect any assumptions made when the model has been specified and estimated o E.g., from, check whether holds o Testable by using (i = 1,, ) for sensible choices of the functions h: R R and g:r R (not necessarily identical) A good CH model should accurately predict future variance 18
8 Are ARCH Models Enough? o What does it means that a CH models yield good forecasts? A requirement is that on average the realized squared residuals must equal the variance forecasts that a model offers: White noise o Empirically, it implies that two simple restrictions must be satisfied in the regression o a = 0 and b = 1, jointly (when this occurs, σσ tt+1 tt offers an unbiased predictor of squared residuals, used as a proxy of realized variance) o The regression R must be large o However, this test of predictive performance may be fallacious: the process εε tt invariably provides a poor proxy for the process followed by the true but unobserved time-varying variance, σσ tt o This follows from 19
9 Are ARCH Models Enough? 4 o When either σσ tt+1 tt (hence, σσ tt+1 tt ) or the kurtosis of the stdz. residuals are high, VVVVVV[εε tt+1 ] will be large, and using squared residuals to proxy instantaneous variances exposes a researcher to a lot of noise o This choice is almost guaranteed to yield low regression R o We shall examine a few suggested remedies later on o Compare ARCH and RiskMetrics for daily stock returns, o ARCH(6) forecasts are spikier o However, there are significant departures from IID-ness in the squared stdz. residuals from both models 0
10 Are ARCH Models Enough? o All forecasting power of past squared residuals is well captured o It seems that past US equities losses lead to subsequent higher variance, the leverage effect o Predictive accuracy regressions give (std errors in parentheses): o Crucial to report standard errors and not p-values because the simple null hypothesis of b = 1 requires that we calculate the t ratios: o The null of a = 0 may be rejected with p-values close to o Given individual rejections, pointless to apply F-tests of joint hypothesis 1
11 Generalized ARCH Models o Although R s are not irrelevant, positive significant estimates of intercepts predicted variance is too low vs. realized variance o The two slope coefficients significantly less than 1 realized variance moves over time less vs. what is predicted Because of its limitation, ARCH has soon be generalized from an AR(p)-style model for squared residuals, to ARMA(max[p,q], q): Bollerslev (1987) observed that such a process may be written as
12 Generalized ARCH Models Key issue of GARCH models is to keep variance forecasts positive o ω > 0, α 1, α,, α p 0, and β 1, β,, β q 0 are only sufficient o Under technical conditions on the lag polynomials characterized by α 1, α,, α p and β 1 β,, β q (provided the roots of the polynomial defined by the βs lie outside the unit circle), positivity constraint is satisfied o As for all ARMA processes, GARCH will be (covariance) stationary if and only if the roots of the characteristic polynomial associated to the coeffs α 1 + β 1, α + β,, α max(p,q) + β max(p,q) lie outside the unit circle o As far strict stationarity goes, in the case of a GARCH(1,1), the condition is sufficient (see Lumsdaine, 1996) o However, because under covariance stationarity, for a GARCH(1,1), covariance stationarity guarantees strict stationarity GARCH is a highly successful and resilient empirical model because with few parameters than a ARCH, it may lead to a more parsimonious representation of volatility clustering 3
13 GARCH(1,1): The Reasons of Its Success ARCH(p) is simply a GARCH(p,0) model in which there is no memory in the process for past conditional variance predictions Because in forecasting applications it has proven to be very hard to beat (Hansen and Lunde, 005), practitioners usually resort to simple GARCH(1,1) models: o ARMA(1,1) for squared errors o In the case of GARCH(1,1), positivity comes from the restrictions ω > 0, α 0, and β 0 and stationarity from the constraint α + β < 1 o Exploiting equivalence to ARMA(1,1), the stationary long-run variance: Under stationarity, Wold s theorem GARCH(1,1) is a sample variance that downweights distant lagged squared errors:
14 GARCH(1,1): The Reasons of Its Success o The reason for the success of GARCH(1,1) over complex ARCH(p) with relatively large p is that GARCH(1,1) can be shown to be equivalent to an ARCH( ) model with a special structure of decaying weights! o GARCH(1,1) is a prediction a weighted average of long-term variance (the constant), most recent forecast (GARCH term), and information about volatility observed in the previous period (ARCH term): o Let s study weekly returns on 10-year US Treasury notes o A BIC-based specification leads to a simple AR(1) mean model o SACF and SPACF of squared residuals show evidence of ARMA 5
15 GARCH(1,1): A Fixed Income Example o Attempt to use ARCH leads to a large, possibly ARCH(11) specification o GARCH(1,1) offers best trade-off between simplicity and in-sample fit p-values o The sum of the coefficients is (covariance) stationarity o Evidence in favor of GARCH(1,1) is strong: SACF of squared stdz residuals is characterized by absence of additional structure o Regression that tests whether GARCH(1,1) can forecast squared residuals gives (standard errors in parentheses): o Intercept is not significant, while o F-test of hypothesis of a = 0, b = 1 gives that with (, 18) d.f. implies a p-value of and leads to a failure to reject 6
16 The Persistence of Shocks in GARCH(1,1) Models Although the persistence index of a GARCH(p,q) model is given by different coefficients contribute to increase σσ tt+1 tt in different ways o The larger are the α i s, the larger is the response of σσ tt+1 tt to new information; the larger are the β j s, the longer and stronger is the memory of conditional variance to past (forecasts of) variance For any given persistence index, it is possible for different stationary GARCH models to behave rather differently and therefore yield heterogeneous economic insights o This plot performs simulations on a baseline estimate Sum = on monthly UK stock returns, sample period o The volatility scenarios different from solid blue fix the persistence but impute it to alternative α and β 7
 Consequently a shock to the conditional variance is infinitely persistent it remains equally important at all horizons IGARCH may be strictly stationary (under appropriate")
17 Integrated GARCH Model In many applications to high-frequency financial data, the estimate of turns out to be close to 1 Empirical motivation for IGARCH(p,q), model, where = 1 (a unit root in ARMA for conditional variance) Consequently a shock to the conditional variance is infinitely persistent it remains equally important at all horizons IGARCH may be strictly stationary (under appropriate conditions, 0) but is not covariance stationary In the case α + β = 1 α = 1 - β, i.e., IGARCH(1,1), this is no news: This is just RiskMetrics in which λ = β and with an intercept, which establishes that RiskMetrics is not covariance stationary o The long-run variance does not exist o Yet, then RiskMetrics should be generalized to include an intercept and to have ARMA complexity dimensions p and q that should be either estimated or at least selected on the basis of the data 8
18 9 Exponential GARCH Model Similarly to ARCH, GARCH captures thick-tailed returns and volatility clustering but it is not well suited to capture the leverage effect because σσ tt+1 tt is only a function of εε tt and not of their signs In the exponential GARCH (EGARCH) model of Nelson (1991), llllσσ tt+1 tt depends on both the size and the sign of lagged residuals and therefore can capture asymmetries
19 Exponential GARCH Model Because σσ tt+1 tt = exp(llllσσ tt+1 tt ) and exp( ) > 0, EGARCH always yields positive variance forecasts without imposing restrictions o is function of both the magnitude and the sign of past standardized residuals, and it allows the conditional variance process to respond asymmetrically to rises and falls in asset prices o It can be rewritten as: o Nelson s EGARCH has another advantage: in a GARCH, the parameter restrictions needed to ensure moment existence become increasingly stringent as the order of the moment grows o E.g., in case of ARCH(1), for an integer r, the rth moment exists if and only if ; for r =, existence of unconditional kurtosis requires α 1 < (1/3) 1/ o In a EGARCH(p,q) case, if the error process η t in the ARMA representation of the model has all moments and, then all moments of an EGARCH process exist How far better can EGARCH fare versus a standard GARCH model? how important are asymmetries in conditional variance? 30

, the latter being preferred:")
20 EGARCH and Asymmetries: One Example o Let s return to the CRSP daily stock excess return data o A model specification search based on information criteria in the space of GARCH and EGARCH(p; q) models yields o The ICs select large models: a GARCH(,) in the GARCH family and even a more complex EGARCH(3,3), the latter being preferred: GARCH(1,1) 31

21 3 EGARCH and Asymmetries: One Example EGARCH(3,3) o This process implies an odd, mixed leverage effect, because negative returns from the previous business day increase predicted variance, but negative returns from two previous business days depress it
22 EGARCH and Asymmetries: One Example o Although variance forecasts are not radically different, the scatter plot shows that when volatility is predicted to be high, often GARCH(1,1) predicts a higher level than EGARCH(3,3) does o We have tested the two models for their ability to predict squared realized residuals, obtaining: o While in the case of GARCH(1,1) we obtain the same result as before, in the case of EGARCH the R increases but the results on the intercept and slope point towards a rejection of model accuracy A preview of topics to follow: Are alternative, possibly more complex GARCH-structures useful? How do you estimate a GARCH-type model? Is there any gain in specifying εε tt to be anything but IID N(0,σσ tt tt 1 )? How do you test whether your data are affected by GARCH? 33
23 Appendix A: Key Properties of ARCH(1) 34
24 Appendix A: Key Properties of ARCH(1) 35

25 Appendix A: Key Properties of ARCH(1) 36
GARCH Models. Eduardo Rossi University of Pavia. December Rossi GARCH Financial Econometrics / 50
 GARCH Models Eduardo Rossi University of Pavia December 013 Rossi GARCH Financial Econometrics - 013 1 / 50 Outline 1 Stylized Facts ARCH model: definition 3 GARCH model 4 EGARCH 5 Asymmetric Models 6
Lecture 2: Univariate Time Series
 Lecture 2: Univariate Time Series Analysis: Conditional and Unconditional Densities, Stationarity, ARMA Processes Prof. Massimo Guidolin 20192 Financial Econometrics Spring/Winter 2017 Overview Motivation:
Lecture 8: Multivariate GARCH and Conditional Correlation Models
 Lecture 8: Multivariate GARCH and Conditional Correlation Models Prof. Massimo Guidolin 20192 Financial Econometrics Winter/Spring 2018 Overview Three issues in multivariate modelling of CH covariances
Volatility. Gerald P. Dwyer. February Clemson University
 Volatility Gerald P. Dwyer Clemson University February 2016 Outline 1 Volatility Characteristics of Time Series Heteroskedasticity Simpler Estimation Strategies Exponentially Weighted Moving Average Use
Lecture 3: Autoregressive Moving Average (ARMA) Models and their Practical Applications
 Models and their Practical Applications") Lecture 3: Autoregressive Moving Average (ARMA) Models and their Practical Applications Prof. Massimo Guidolin 20192 Financial Econometrics Winter/Spring 2018 Overview Moving average processes Autoregressive
Lecture 3: Autoregressive Moving Average (ARMA) Models and their Practical Applications Prof. Massimo Guidolin 20192 Financial Econometrics Winter/Spring 2018 Overview Moving average processes Autoregressive
Econ 423 Lecture Notes: Additional Topics in Time Series 1
 Econ 423 Lecture Notes: Additional Topics in Time Series 1 John C. Chao April 25, 2017 1 These notes are based in large part on Chapter 16 of Stock and Watson (2011). They are for instructional purposes
ECON3327: Financial Econometrics, Spring 2016
 ECON3327: Financial Econometrics, Spring 2016 Wooldridge, Introductory Econometrics (5th ed, 2012) Chapter 11: OLS with time series data Stationary and weakly dependent time series The notion of a stationary
Lecture 5: Unit Roots, Cointegration and Error Correction Models The Spurious Regression Problem
 Lecture 5: Unit Roots, Cointegration and Error Correction Models The Spurious Regression Problem Prof. Massimo Guidolin 20192 Financial Econometrics Winter/Spring 2018 Overview Stochastic vs. deterministic
ECONOMICS 7200 MODERN TIME SERIES ANALYSIS Econometric Theory and Applications
 ECONOMICS 7200 MODERN TIME SERIES ANALYSIS Econometric Theory and Applications Yongmiao Hong Department of Economics & Department of Statistical Sciences Cornell University Spring 2019 Time and uncertainty
Lecture 9: Markov Switching Models
 Lecture 9: Markov Switching Models Prof. Massimo Guidolin 20192 Financial Econometrics Winter/Spring 2018 Overview Defining a Markov Switching VAR model Structure and mechanics of Markov Switching: from
13. Estimation and Extensions in the ARCH model. MA6622, Ernesto Mordecki, CityU, HK, References for this Lecture:
 13. Estimation and Extensions in the ARCH model MA6622, Ernesto Mordecki, CityU, HK, 2006. References for this Lecture: Robert F. Engle. GARCH 101: The Use of ARCH/GARCH Models in Applied Econometrics,
Introduction to ARMA and GARCH processes
 Introduction to ARMA and GARCH processes Fulvio Corsi SNS Pisa 3 March 2010 Fulvio Corsi Introduction to ARMA () and GARCH processes SNS Pisa 3 March 2010 1 / 24 Stationarity Strict stationarity: (X 1,
Forecasting the term structure interest rate of government bond yields
 Forecasting the term structure interest rate of government bond yields Bachelor Thesis Econometrics & Operational Research Joost van Esch (419617) Erasmus School of Economics, Erasmus University Rotterdam
Multivariate GARCH models.
 Multivariate GARCH models. Financial market volatility moves together over time across assets and markets. Recognizing this commonality through a multivariate modeling framework leads to obvious gains
Some Time-Series Models
 Some Time-Series Models Outline 1. Stochastic processes and their properties 2. Stationary processes 3. Some properties of the autocorrelation function 4. Some useful models Purely random processes, random
ISSN Article. Selection Criteria in Regime Switching Conditional Volatility Models
 Econometrics 2015, 3, 289-316; doi:10.3390/econometrics3020289 OPEN ACCESS econometrics ISSN 2225-1146 www.mdpi.com/journal/econometrics Article Selection Criteria in Regime Switching Conditional Volatility
GARCH Models Estimation and Inference. Eduardo Rossi University of Pavia
 GARCH Models Estimation and Inference Eduardo Rossi University of Pavia Likelihood function The procedure most often used in estimating θ 0 in ARCH models involves the maximization of a likelihood function
Autoregressive Moving Average (ARMA) Models and their Practical Applications
 Models and their Practical Applications") Autoregressive Moving Average (ARMA) Models and their Practical Applications Massimo Guidolin February 2018 1 Essential Concepts in Time Series Analysis 1.1 Time Series and Their Properties Time series:
Autoregressive Moving Average (ARMA) Models and their Practical Applications Massimo Guidolin February 2018 1 Essential Concepts in Time Series Analysis 1.1 Time Series and Their Properties Time series:
Stochastic Processes
 Stochastic Processes Stochastic Process Non Formal Definition: Non formal: A stochastic process (random process) is the opposite of a deterministic process such as one defined by a differential equation.
Diagnostic Test for GARCH Models Based on Absolute Residual Autocorrelations
 Diagnostic Test for GARCH Models Based on Absolute Residual Autocorrelations Farhat Iqbal Department of Statistics, University of Balochistan Quetta-Pakistan farhatiqb@gmail.com Abstract In this paper
Heteroskedasticity in Time Series
 Heteroskedasticity in Time Series Figure: Time Series of Daily NYSE Returns. 206 / 285 Key Fact 1: Stock Returns are Approximately Serially Uncorrelated Figure: Correlogram of Daily Stock Market Returns.
Time Series Models and Inference. James L. Powell Department of Economics University of California, Berkeley
 Time Series Models and Inference James L. Powell Department of Economics University of California, Berkeley Overview In contrast to the classical linear regression model, in which the components of the
Time Series Analysis -- An Introduction -- AMS 586
 Time Series Analysis -- An Introduction -- AMS 586 1 Objectives of time series analysis Data description Data interpretation Modeling Control Prediction & Forecasting 2 Time-Series Data Numerical data
AR, MA and ARMA models
 AR, MA and AR by Hedibert Lopes P Based on Tsay s Analysis of Financial Time Series (3rd edition) P 1 Stationarity 2 3 4 5 6 7 P 8 9 10 11 Outline P Linear Time Series Analysis and Its Applications For
FE570 Financial Markets and Trading. Stevens Institute of Technology
 FE570 Financial Markets and Trading Lecture 5. Linear Time Series Analysis and Its Applications (Ref. Joel Hasbrouck - Empirical Market Microstructure ) Steve Yang Stevens Institute of Technology 9/25/2012
11. Further Issues in Using OLS with TS Data
 11. Further Issues in Using OLS with TS Data With TS, including lags of the dependent variable often allow us to fit much better the variation in y Exact distribution theory is rarely available in TS applications,
Final Exam Financial Data Analysis at the University of Freiburg (Winter Semester 2008/2009) Friday, November 14, 2008,
 Friday, November 14, 2008,") Professor Dr. Roman Liesenfeld Final Exam Financial Data Analysis at the University of Freiburg (Winter Semester 2008/2009) Friday, November 14, 2008, 10.00 11.30am 1 Part 1 (38 Points) Consider the following
Professor Dr. Roman Liesenfeld Final Exam Financial Data Analysis at the University of Freiburg (Winter Semester 2008/2009) Friday, November 14, 2008, 10.00 11.30am 1 Part 1 (38 Points) Consider the following
MFE Financial Econometrics 2018 Final Exam Model Solutions
 MFE Financial Econometrics 2018 Final Exam Model Solutions Tuesday 12 th March, 2019 1. If (X, ε) N (0, I 2 ) what is the distribution of Y = µ + β X + ε? Y N ( µ, β 2 + 1 ) 2. What is the Cramer-Rao lower
THE UNIVERSITY OF CHICAGO Graduate School of Business Business 41202, Spring Quarter 2003, Mr. Ruey S. Tsay
 THE UNIVERSITY OF CHICAGO Graduate School of Business Business 41202, Spring Quarter 2003, Mr. Ruey S. Tsay Solutions to Homework Assignment #4 May 9, 2003 Each HW problem is 10 points throughout this
GARCH processes probabilistic properties (Part 1)
") GARCH processes probabilistic properties (Part 1) Alexander Lindner Centre of Mathematical Sciences Technical University of Munich D 85747 Garching Germany lindner@ma.tum.de http://www-m1.ma.tum.de/m4/pers/lindner/
GARCH processes probabilistic properties (Part 1) Alexander Lindner Centre of Mathematical Sciences Technical University of Munich D 85747 Garching Germany lindner@ma.tum.de http://www-m1.ma.tum.de/m4/pers/lindner/
Introduction to Econometrics
 Introduction to Econometrics T H I R D E D I T I O N Global Edition James H. Stock Harvard University Mark W. Watson Princeton University Boston Columbus Indianapolis New York San Francisco Upper Saddle
Financial Econometrics
 Financial Econometrics Topic 5: Modelling Volatility Lecturer: Nico Katzke nicokatzke@sun.ac.za Department of Economics Texts used The notes and code in R were created using many references. Intuitively,
at least 50 and preferably 100 observations should be available to build a proper model
 III Box-Jenkins Methods 1. Pros and Cons of ARIMA Forecasting a) need for data at least 50 and preferably 100 observations should be available to build a proper model used most frequently for hourly or
Normal Probability Plot Probability Probability
 Modelling multivariate returns Stefano Herzel Department ofeconomics, University of Perugia 1 Catalin Starica Department of Mathematical Statistics, Chalmers University of Technology Reha Tutuncu Department
Appendix 1 Model Selection: GARCH Models. Parameter estimates and summary statistics for models of the form: 1 if ɛt i < 0 0 otherwise
 Appendix 1 Model Selection: GARCH Models Parameter estimates and summary statistics for models of the form: R t = µ + ɛ t ; ɛ t (0, h 2 t ) (1) h 2 t = α + 2 ( 2 ( 2 ( βi ht i) 2 + γi ɛt i) 2 + δi D t
GARCH Models Estimation and Inference
 GARCH Models Estimation and Inference Eduardo Rossi University of Pavia December 013 Rossi GARCH Financial Econometrics - 013 1 / 1 Likelihood function The procedure most often used in estimating θ 0 in
The Instability of Correlations: Measurement and the Implications for Market Risk
 The Instability of Correlations: Measurement and the Implications for Market Risk Prof. Massimo Guidolin 20254 Advanced Quantitative Methods for Asset Pricing and Structuring Winter/Spring 2018 Threshold
GARCH Models Estimation and Inference
 Università di Pavia GARCH Models Estimation and Inference Eduardo Rossi Likelihood function The procedure most often used in estimating θ 0 in ARCH models involves the maximization of a likelihood function
6. The econometrics of Financial Markets: Empirical Analysis of Financial Time Series. MA6622, Ernesto Mordecki, CityU, HK, 2006.
 6. The econometrics of Financial Markets: Empirical Analysis of Financial Time Series MA6622, Ernesto Mordecki, CityU, HK, 2006. References for Lecture 5: Quantitative Risk Management. A. McNeil, R. Frey,
Symmetric btw positive & negative prior returns. where c is referred to as risk premium, which is expected to be positive.
 Advantages of GARCH model Simplicity Generates volatility clustering Heavy tails (high kurtosis) Weaknesses of GARCH model Symmetric btw positive & negative prior returns Restrictive Provides no explanation
9) Time series econometrics
 Time series econometrics") 30C00200 Econometrics 9) Time series econometrics Timo Kuosmanen Professor Management Science http://nomepre.net/index.php/timokuosmanen 1 Macroeconomic data: GDP Inflation rate Examples of time series
30C00200 Econometrics 9) Time series econometrics Timo Kuosmanen Professor Management Science http://nomepre.net/index.php/timokuosmanen 1 Macroeconomic data: GDP Inflation rate Examples of time series
Empirical Market Microstructure Analysis (EMMA)
") Empirical Market Microstructure Analysis (EMMA) Lecture 3: Statistical Building Blocks and Econometric Basics Prof. Dr. Michael Stein michael.stein@vwl.uni-freiburg.de Albert-Ludwigs-University of Freiburg
Empirical Market Microstructure Analysis (EMMA) Lecture 3: Statistical Building Blocks and Econometric Basics Prof. Dr. Michael Stein michael.stein@vwl.uni-freiburg.de Albert-Ludwigs-University of Freiburg
Multivariate Time Series Analysis and Its Applications [Tsay (2005), chapter 8]
![Multivariate Time Series Analysis and Its Applications [Tsay (2005), chapter 8]](/thumbs/77/75858385.jpg "Multivariate Time Series Analysis and Its Applications [Tsay (2005), chapter 8]") 1 Multivariate Time Series Analysis and Its Applications [Tsay (2005), chapter 8] Insights: Price movements in one market can spread easily and instantly to another market [economic globalization and internet
1 Multivariate Time Series Analysis and Its Applications [Tsay (2005), chapter 8] Insights: Price movements in one market can spread easily and instantly to another market [economic globalization and internet
Alastair Hall ECG 752: Econometrics Spring 2005
 Alastair Hall ECG 752: Econometrics Spring 2005 SAS Handout # 6 Estimation of ARCH models In this handout we consider the estimation of ARCH models for the the US dollar trade weighted exchange index.
Wooldridge, Introductory Econometrics, 4th ed. Chapter 2: The simple regression model
 Wooldridge, Introductory Econometrics, 4th ed. Chapter 2: The simple regression model Most of this course will be concerned with use of a regression model: a structure in which one or more explanatory
Discussion of Bootstrap prediction intervals for linear, nonlinear, and nonparametric autoregressions, by Li Pan and Dimitris Politis
 Discussion of Bootstrap prediction intervals for linear, nonlinear, and nonparametric autoregressions, by Li Pan and Dimitris Politis Sílvia Gonçalves and Benoit Perron Département de sciences économiques,
ECONOMETRIC REVIEWS, 5(1), (1986) MODELING THE PERSISTENCE OF CONDITIONAL VARIANCES: A COMMENT
, (1986) MODELING THE PERSISTENCE OF CONDITIONAL VARIANCES: A COMMENT") ECONOMETRIC REVIEWS, 5(1), 51-56 (1986) MODELING THE PERSISTENCE OF CONDITIONAL VARIANCES: A COMMENT Professors Engle and Bollerslev have delivered an excellent blend of "forest" and "trees"; their important
ECONOMETRIC REVIEWS, 5(1), 51-56 (1986) MODELING THE PERSISTENCE OF CONDITIONAL VARIANCES: A COMMENT Professors Engle and Bollerslev have delivered an excellent blend of "forest" and "trees"; their important
Note: The primary reference for these notes is Enders (2004). An alternative and more technical treatment can be found in Hamilton (1994).
. An alternative and more technical treatment can be found in Hamilton (1994).") Chapter 4 Analysis of a Single Time Series Note: The primary reference for these notes is Enders (4). An alternative and more technical treatment can be found in Hamilton (994). Most data used in financial
Chapter 4 Analysis of a Single Time Series Note: The primary reference for these notes is Enders (4). An alternative and more technical treatment can be found in Hamilton (994). Most data used in financial
Arma-Arch Modeling Of The Returns Of First Bank Of Nigeria
 Arma-Arch Modeling Of The Returns Of First Bank Of Nigeria Emmanuel Alphonsus Akpan Imoh Udo Moffat Department of Mathematics and Statistics University of Uyo, Nigeria Ntiedo Bassey Ekpo Department of
FINANCIAL ECONOMETRICS AND EMPIRICAL FINANCE -MODULE2 Midterm Exam Solutions - March 2015
 FINANCIAL ECONOMETRICS AND EMPIRICAL FINANCE -MODULE2 Midterm Exam Solutions - March 205 Time Allowed: 60 minutes Family Name (Surname) First Name Student Number (Matr.) Please answer all questions by
10. Time series regression and forecasting
 10. Time series regression and forecasting Key feature of this section: Analysis of data on a single entity observed at multiple points in time (time series data) Typical research questions: What is the
Stationarity, Memory and Parameter Estimation of FIGARCH Models
 WORKING PAPER n.03.09 July 2003 Stationarity, Memory and Parameter Estimation of FIGARCH Models M. Caporin 1 1 GRETA, Venice Stationarity, Memory and Parameter Estimation of FIGARCH Models Massimiliano
TIME SERIES ANALYSIS PROF. MASSIMO GUIDOLIN
 Massimo Guidolin Massimo.Guidolin@unibocconi.it Dept. of Finance TIME SERIES ANALYSIS PROF. MASSIMO GUIDOLIN LECTURE 3: UNIVARIATE ARCH MODELS AND EXTENSIONS (ADDITIONAL, OPTIONAL READING) Lecture 3: Univariate
Time Series Analysis. James D. Hamilton PRINCETON UNIVERSITY PRESS PRINCETON, NEW JERSEY
 Time Series Analysis James D. Hamilton PRINCETON UNIVERSITY PRESS PRINCETON, NEW JERSEY & Contents PREFACE xiii 1 1.1. 1.2. Difference Equations First-Order Difference Equations 1 /?th-order Difference
Chapter 12: An introduction to Time Series Analysis. Chapter 12: An introduction to Time Series Analysis
 Chapter 12: An introduction to Time Series Analysis Introduction In this chapter, we will discuss forecasting with single-series (univariate) Box-Jenkins models. The common name of the models is Auto-Regressive
The GARCH Analysis of YU EBAO Annual Yields Weiwei Guo1,a
 2nd Workshop on Advanced Research and Technology in Industry Applications (WARTIA 2016) The GARCH Analysis of YU EBAO Annual Yields Weiwei Guo1,a 1 Longdong University,Qingyang,Gansu province,745000 a
Studies in Nonlinear Dynamics & Econometrics
 Studies in Nonlinear Dynamics & Econometrics Volume 9, Issue 2 2005 Article 4 A Note on the Hiemstra-Jones Test for Granger Non-causality Cees Diks Valentyn Panchenko University of Amsterdam, C.G.H.Diks@uva.nl
Time Series Analysis. James D. Hamilton PRINCETON UNIVERSITY PRESS PRINCETON, NEW JERSEY
 Time Series Analysis James D. Hamilton PRINCETON UNIVERSITY PRESS PRINCETON, NEW JERSEY PREFACE xiii 1 Difference Equations 1.1. First-Order Difference Equations 1 1.2. pth-order Difference Equations 7
Determining and Forecasting High-Frequency Value-at-Risk by Using Lévy Processes
 Determining and Forecasting High-Frequency Value-at-Risk by Using Lévy Processes W ei Sun 1, Svetlozar Rachev 1,2, F rank J. F abozzi 3 1 Institute of Statistics and Mathematical Economics, University
Introduction to Regression Analysis. Dr. Devlina Chatterjee 11 th August, 2017
 Introduction to Regression Analysis Dr. Devlina Chatterjee 11 th August, 2017 What is regression analysis? Regression analysis is a statistical technique for studying linear relationships. One dependent
Nonlinear time series
 Based on the book by Fan/Yao: Nonlinear Time Series Robert M. Kunst robert.kunst@univie.ac.at University of Vienna and Institute for Advanced Studies Vienna October 27, 2009 Outline Characteristics of
ECON2228 Notes 2. Christopher F Baum. Boston College Economics. cfb (BC Econ) ECON2228 Notes / 47
 ECON2228 Notes / 47") ECON2228 Notes 2 Christopher F Baum Boston College Economics 2014 2015 cfb (BC Econ) ECON2228 Notes 2 2014 2015 1 / 47 Chapter 2: The simple regression model Most of this course will be concerned with
ECON2228 Notes 2 Christopher F Baum Boston College Economics 2014 2015 cfb (BC Econ) ECON2228 Notes 2 2014 2015 1 / 47 Chapter 2: The simple regression model Most of this course will be concerned with
Financial Econometrics
 Financial Econometrics Nonlinear time series analysis Gerald P. Dwyer Trinity College, Dublin January 2016 Outline 1 Nonlinearity Does nonlinearity matter? Nonlinear models Tests for nonlinearity Forecasting
A time series is called strictly stationary if the joint distribution of every collection (Y t
 5 Time series A time series is a set of observations recorded over time. You can think for example at the GDP of a country over the years (or quarters) or the hourly measurements of temperature over a
Applied time-series analysis
 Robert M. Kunst robert.kunst@univie.ac.at University of Vienna and Institute for Advanced Studies Vienna October 18, 2011 Outline Introduction and overview Econometric Time-Series Analysis In principle,
STAT Financial Time Series
 STAT 6104 - Financial Time Series Chapter 9 - Heteroskedasticity Chun Yip Yau (CUHK) STAT 6104:Financial Time Series 1 / 43 Agenda 1 Introduction 2 AutoRegressive Conditional Heteroskedastic Model (ARCH)
Econometric Forecasting
 Robert M. Kunst robert.kunst@univie.ac.at University of Vienna and Institute for Advanced Studies Vienna October 1, 2014 Outline Introduction Model-free extrapolation Univariate time-series models Trend
DEPARTMENT OF ECONOMICS
 ISSN 0819-64 ISBN 0 7340 616 1 THE UNIVERSITY OF MELBOURNE DEPARTMENT OF ECONOMICS RESEARCH PAPER NUMBER 959 FEBRUARY 006 TESTING FOR RATE-DEPENDENCE AND ASYMMETRY IN INFLATION UNCERTAINTY: EVIDENCE FROM
CONTAGION VERSUS FLIGHT TO QUALITY IN FINANCIAL MARKETS
 EVA IV, CONTAGION VERSUS FLIGHT TO QUALITY IN FINANCIAL MARKETS Jose Olmo Department of Economics City University, London (joint work with Jesús Gonzalo, Universidad Carlos III de Madrid) 4th Conference
1 Phelix spot and futures returns: descriptive statistics
 MULTIVARIATE VOLATILITY MODELING OF ELECTRICITY FUTURES: ONLINE APPENDIX Luc Bauwens 1, Christian Hafner 2, and Diane Pierret 3 October 13, 2011 1 Phelix spot and futures returns: descriptive statistics
Oil price volatility in the Philippines using generalized autoregressive conditional heteroscedasticity
 Oil price volatility in the Philippines using generalized autoregressive conditional heteroscedasticity Carl Ceasar F. Talungon University of Southern Mindanao, Cotabato Province, Philippines Email: carlceasar04@gmail.com
13. Time Series Analysis: Asymptotics Weakly Dependent and Random Walk Process. Strict Exogeneity
 Outline: Further Issues in Using OLS with Time Series Data 13. Time Series Analysis: Asymptotics Weakly Dependent and Random Walk Process I. Stationary and Weakly Dependent Time Series III. Highly Persistent
Univariate Volatility Modeling
 Univariate Volatility Modeling Kevin Sheppard http://www.kevinsheppard.com Oxford MFE This version: January 10, 2013 January 14, 2013 Financial Econometrics (Finally) This term Volatility measurement and
Econometrics I Lecture 3: The Simple Linear Regression Model
 Econometrics I Lecture 3: The Simple Linear Regression Model Mohammad Vesal Graduate School of Management and Economics Sharif University of Technology 44716 Fall 1397 1 / 32 Outline Introduction Estimating
Finite Sample Performance of the MLE in GARCH(1,1): When the Parameter on the Lagged Squared Residual Is Close to Zero
: When the Parameter on the Lagged Squared Residual Is Close to Zero") Finite Sample Performance of the MLE in GARCH1,1): When the Parameter on the Lagged Squared Residual Is Close to Zero Suduk Kim Department of Economics Hoseo University Asan Si, ChungNam, Korea, 336-795
Finite Sample Performance of the MLE in GARCH1,1): When the Parameter on the Lagged Squared Residual Is Close to Zero Suduk Kim Department of Economics Hoseo University Asan Si, ChungNam, Korea, 336-795
University of Pretoria Department of Economics Working Paper Series
 University of Pretoria Department of Economics Working Paper Series Predicting Stock Returns and Volatility Using Consumption-Aggregate Wealth Ratios: A Nonlinear Approach Stelios Bekiros IPAG Business
FinQuiz Notes
 Reading 9 A time series is any series of data that varies over time e.g. the quarterly sales for a company during the past five years or daily returns of a security. When assumptions of the regression
Time Series 4. Robert Almgren. Oct. 5, 2009
 Time Series 4 Robert Almgren Oct. 5, 2009 1 Nonstationarity How should you model a process that has drift? ARMA models are intrinsically stationary, that is, they are mean-reverting: when the value of
Financial Times Series. Lecture 12
 Financial Times Series Lecture 12 Multivariate Volatility Models Here our aim is to generalize the previously presented univariate volatility models to their multivariate counterparts We assume that returns
A Non-Parametric Approach of Heteroskedasticity Robust Estimation of Vector-Autoregressive (VAR) Models
 Models") Journal of Finance and Investment Analysis, vol.1, no.1, 2012, 55-67 ISSN: 2241-0988 (print version), 2241-0996 (online) International Scientific Press, 2012 A Non-Parametric Approach of Heteroskedasticity
Journal of Finance and Investment Analysis, vol.1, no.1, 2012, 55-67 ISSN: 2241-0988 (print version), 2241-0996 (online) International Scientific Press, 2012 A Non-Parametric Approach of Heteroskedasticity
Econ 623 Econometrics II Topic 2: Stationary Time Series
 1 Introduction Econ 623 Econometrics II Topic 2: Stationary Time Series In the regression model we can model the error term as an autoregression AR(1) process. That is, we can use the past value of the
A TIME SERIES PARADOX: UNIT ROOT TESTS PERFORM POORLY WHEN DATA ARE COINTEGRATED
 A TIME SERIES PARADOX: UNIT ROOT TESTS PERFORM POORLY WHEN DATA ARE COINTEGRATED by W. Robert Reed Department of Economics and Finance University of Canterbury, New Zealand Email: bob.reed@canterbury.ac.nz
Time Series 2. Robert Almgren. Sept. 21, 2009
 Time Series 2 Robert Almgren Sept. 21, 2009 This week we will talk about linear time series models: AR, MA, ARMA, ARIMA, etc. First we will talk about theory and after we will talk about fitting the models
Introduction to Stochastic processes
 Università di Pavia Introduction to Stochastic processes Eduardo Rossi Stochastic Process Stochastic Process: A stochastic process is an ordered sequence of random variables defined on a probability space
Lecture 5: Unit Roots, Cointegration and Error Correction Models The Spurious Regression Problem
 Lecture 5: Unit Roots, Cointegration and Error Correction Models The Spurious Regression Problem Prof. Massimo Guidolin 20192 Financial Econometrics Winter/Spring 2018 Overview Defining cointegration Vector
Week 5 Quantitative Analysis of Financial Markets Characterizing Cycles
 Week 5 Quantitative Analysis of Financial Markets Characterizing Cycles Christopher Ting http://www.mysmu.edu/faculty/christophert/ Christopher Ting : christopherting@smu.edu.sg : 6828 0364 : LKCSB 5036
Univariate ARIMA Models
 Univariate ARIMA Models ARIMA Model Building Steps: Identification: Using graphs, statistics, ACFs and PACFs, transformations, etc. to achieve stationary and tentatively identify patterns and model components.
End-Semester Examination MA 373 : Statistical Analysis on Financial Data
 End-Semester Examination MA 373 : Statistical Analysis on Financial Data Instructor: Dr. Arabin Kumar Dey, Department of Mathematics, IIT Guwahati Note: Use the results in Section- III: Data Analysis using
Vector Auto-Regressive Models
 Vector Auto-Regressive Models Laurent Ferrara 1 1 University of Paris Nanterre M2 Oct. 2018 Overview of the presentation 1. Vector Auto-Regressions Definition Estimation Testing 2. Impulse responses functions
Nonparametric Verification of GARCH-Class Models for Selected Polish Exchange Rates and Stock Indices *
 JEL Classification: C14, C22, C58 Keywords: GARCH, iid property, BDS test, mutual information measure, nonparametric tests Nonparametric Verification of GARCH-Class Models for Selected Polish Exchange
Univariate Time Series Analysis; ARIMA Models
 Econometrics 2 Fall 24 Univariate Time Series Analysis; ARIMA Models Heino Bohn Nielsen of4 Outline of the Lecture () Introduction to univariate time series analysis. (2) Stationarity. (3) Characterizing
Financial Econometrics and Quantitative Risk Managenent Return Properties
 Financial Econometrics and Quantitative Risk Managenent Return Properties Eric Zivot Updated: April 1, 2013 Lecture Outline Course introduction Return definitions Empirical properties of returns Reading
Stock index returns density prediction using GARCH models: Frequentist or Bayesian estimation?
 MPRA Munich Personal RePEc Archive Stock index returns density prediction using GARCH models: Frequentist or Bayesian estimation? Ardia, David; Lennart, Hoogerheide and Nienke, Corré aeris CAPITAL AG,
Bootstrap tests of multiple inequality restrictions on variance ratios
 Economics Letters 91 (2006) 343 348 www.elsevier.com/locate/econbase Bootstrap tests of multiple inequality restrictions on variance ratios Jeff Fleming a, Chris Kirby b, *, Barbara Ostdiek a a Jones Graduate
VAR Models and Applications
 VAR Models and Applications Laurent Ferrara 1 1 University of Paris West M2 EIPMC Oct. 2016 Overview of the presentation 1. Vector Auto-Regressions Definition Estimation Testing 2. Impulse responses functions
ARIMA Modelling and Forecasting
 ARIMA Modelling and Forecasting Economic time series often appear nonstationary, because of trends, seasonal patterns, cycles, etc. However, the differences may appear stationary. Δx t x t x t 1 (first
Do Markov-Switching Models Capture Nonlinearities in the Data? Tests using Nonparametric Methods
 Do Markov-Switching Models Capture Nonlinearities in the Data? Tests using Nonparametric Methods Robert V. Breunig Centre for Economic Policy Research, Research School of Social Sciences and School of
Bayesian Semiparametric GARCH Models
 Bayesian Semiparametric GARCH Models Xibin (Bill) Zhang and Maxwell L. King Department of Econometrics and Business Statistics Faculty of Business and Economics xibin.zhang@monash.edu Quantitative Methods
DynamicAsymmetricGARCH
 DynamicAsymmetricGARCH Massimiliano Caporin Dipartimento di Scienze Economiche Università Ca Foscari di Venezia Michael McAleer School of Economics and Commerce University of Western Australia Revised: