A Comprehensive Framework for Modeling and Correcting Color Variations in Multi Projector Displays
|
|
|
- Angelina Brooks
- 5 years ago
- Views:
Transcription
1 A Comprehensive Framework for Modeling and Correcting Color Variations in Multi Projector Displays Aditi Majumder Slide 1 Historical Perspective A dream computer in 1980 (Bill Joy and others) Megabytes of memory Megahertz of speed Mega pixels Today Gigabytes of memory Gigahertz of speed And still Mega pixels!! (1000 x 1000 monitor) Slide 2


2 Large Area Displays Size We have today in common use 19 inch diagonal We would like to have 15 feet x 10 feet Resolution 60 pixels/inch pixels/inch Field of View # of pixels degrees 1 million degrees million Slide 3 Applications Scientific Visualization Medical Visualization Telecollaboration Virtual Reality Flow Visualization of Fluids at Argonne National Laboratory (ANL) Training and Simulation Medical Visualization at Radiology Department of Stanford Slide 4


3 Multi Projector Displays Tile projectors Slide 5 Multi Projector Displays Tile projectors 15 projectors 3x5 array 10 feet x 8 feet 50 pixels/inch 12 million pixels At ANL Slide 6

4 Building Multi Projector Displays Display Screen Projectors Servers Network Client Viewer Slide 7 Making them seamless Geometric Alignment Slide 8

5 Making them seamless Geometric Alignment Slide 9 Making them seamless Geometric Alignment Slide 10


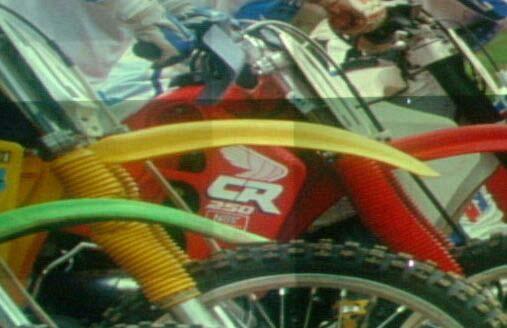
6 Making them seamless Geometric Alignment Color Seamlessness Overlapping Abutting Slide 11 The Problem Even with perfect geometric alignment, color variation breaks the illusion of a single seamless display At ANL Slide 12

7 The Goal of Color Seamlessness Slide 13 The Goal of Color Seamlessness Should look like a single display Cannot tell the number of projectors Slide 14
 Slide 15 Color Seamlessness Luminance Seamlessness (Brightness) Chrominance Seamlessness (Hue)")
8 Background: Color Perceptual Representation Luminance (L)» Sense of Brightness Chrominance ( x, y )» Sense of hue Representation Using Primaries Three channels (Red, Green, Blue) Slide 15 Color Seamlessness Luminance Seamlessness (Brightness) Chrominance Seamlessness (Hue) Slide 16
9 Why Is It Difficult? No comprehensive model of color variation No formal definition of color seamlessness The problem is inherently five dimensional Color (3D 1D luminance and 2D chrominance) Display surface (2D) Humans are more sensitive spatial variations than to temporal variations in color Slide 17 Innovations Emineoptic function : Models the luminance and chrominance variation in multi projector displays emineoptic signifies s viewing projected light A definition for color seamlessness Optimization Problem An algorithm to address luminance variation (photometric seamlessness) Same model projectors differ significantly in luminance Humans are more sensitive to luminance than chrominance Slide 18
10 Thesis Statement The color variation in multi-projector displays can be modeled by the emineoptic function. Achieving color seamlessness is an optimization problem that can be defined using the emineoptic function. Perceptually uniform high quality displays can be achieved by realizing a desired emineoptic function that differs minimally from the original function and has imperceptible color variation. Slide 19 Organization Previous Work The Emineoptic Function Definition of Color Seamlessness Achieving Photometric Seamlessness Results Slide 20
11 Organization Previous Work The Emineoptic Function Definition of Color Seamlessness Achieving Photometric Seamlessness Results Slide 21 Classification of Color Variation Intra-projector Within a single projector Inter-projector Across different projectors Overlaps Slide 22
12 Classification of Color Variation Intra-projector Within a single projector Inter-projector Across different projectors Overlaps Slide 23 Edge Blending Proj1 Proj2 Proj1 Proj2 Overlap Region Overlap Region Slide 24

 Slide 25 Aperture Edge")

13 Software Edge Blending Before Software Blending Raskar et al 1998 (UNC) Yang et al 2001 (UNC) Slide 25 Aperture Edge Blending Before Aperture Blending Li et al 2000 (Princeton) Slide 26
14 Classification of Color Variation Intra-projector Within a single projector Inter-projector Across different projectors Overlaps Slide 27 Previous Work Projector Controls Using the same bulb Pailthorpe et al 2001 (NSCA San Diego) Inter-projector response matching Stone et al 2000, 2001 (Stanford) Chen et al 2002 (Princeton) Slide 28

15 Classification of Color Variation Intra-projector Within a single projector Inter-projector Across different projectors Overlaps Slide 29 Intra-Projector Variations Chrominance response x y Chromaticity Pixels in X Pixels in Y Slide 30
16 Intra-Projector Variations Luminance response Luminance Pixels in X Pixels in Y Slide 31 Slide 32

17 Intra-Projector Variations Luminance response Black offset Always present Luminance Luminance Pixels in X Pixels in Y Pixels in X Pixels in Y Slide 33 Limitations of Previous Methods No algorithm addresses intra projector variation No algorithm addresses more than one class of problems Each class of problems treated as a special case Strict uniformity mindset Identical color response at every display coordinate Slide 34
18 Desiderata Comprehensive and general framework Addresses intra, inter and overlap variations Design general solutions» No special cases» Automated» Scalable Explain and compare existing methods Slide 35 Organization Previous Work The Emineoptic Function Definition of Color Seamlessness Achieving Photometric Seamlessness Results Slide 36
19 Achieving Color Seamlessness To correct, first capture Complexity of capture Input color space : 24 bit color Need 2 24 images Reduce complexity by modeling projector color variations Emineoptic Function Slide 37 Thesis Statement The color variation in multi-projector displays can be modeled by the emineoptic function. Achieving color seamlessness is an optimization problem that can be defined using the emineoptic function. Perceptually uniform high quality displays can be achieved by realizing a desired emineoptic function that differs minimally from the original function and has imperceptible color variation. Slide 38
20 The Emineoptic Function E( u, v, i, e ) Lambertian Screen i e E i Slide 39 The Emineoptic Function E( u, v, i ) Lambertian Screen i E L, (x, y ) i Slide 40
21 Single Pixel, Single Channel Input 1.0 h l 0.0 i l 1.0 Maximum channel luminance (M l ) Variation in luminance with channel input» Channel transfer function function ( h l ( i l ) ) C l ( i l ) = h l ( i l ) M l Slide 41 Single Pixel, Three Channel Input At one pixel for one channel: C l ( i l ) = h l ( i l ) M l For any input i = ( i r, i g, i b ) : P ( i ) = C r ( i r ) + C g ( i g ) + C b (i b ) With black Offset B : P ( i ) = C r ( i r ) + C g ( i g ) + C b (i b ) + B Slide 42
22 Single Projector Display At one pixel for one channel: C l ( i l, u, v) = h l ( i l, u, v ) M l ( u, v) For any input i = ( i r, i g, i b ) : P ( i, u, v) = C r ( i r, u, v ) + C g ( i g, u, v ) + C b (i b, u, v ) With black Offset B : P ( i, u, v) = C r ( i r, u, v ) + C g ( i g, u, v ) + C b (i b, u, v ) + B ( u, v) Slide 43 Single Projector Display At one pixel for one channel: C l ( i l, u, v) = h l ( i l ) M l ( u, v) For any input i = ( i r, i g, i b ) : P ( i, u, v) = C r ( i r, u, v ) + C g ( i g, u, v ) + C b (i b, u, v ) With black Offset B : P ( i, u, v) = C r ( i r, u, v ) + C g ( i g, u, v ) + C b (i b, u, v ) + B ( u, v) Slide 44
23 Single Projector Display At one pixel for one channel: C l ( i l, u, v) = h l ( i l ) M l ( u, v) For any input i = ( i r, i g, i b ) : P ( i, u, v) = C r ( i r, u, v ) + C g ( i g, u, v ) + C b (i b, u, v ) With black Offset B : P ( i, u, v) = h r ( i r ) M r ( u, v ) + h g ( i g ) M g ( u, v ) + h b (i b ) M b ( u, v ) + B ( u, v) Slide 45 Single Projector Display P ( i, u, v) = h r ( i r ) M r (u, v ) + h g ( i g ) M g (u, v ) + h b ( i b ) M b (u, v ) + B ( u, v) Transfer Functions Luminance Functions Black Offset Slide 46
24 Multi-Projector Display N =1 2 N =1 E( u, v, i ) = j P j ( u, v, i) N (u,v) N =2 4 N =2 N =1 2 N =1 E ( i, u, v) = h r ( i r ) M r (u, v ) + h g ( i g ) M g (u, v ) + h b ( i b ) M b (u, v ) + B ( u, v) j N (u,v) Slide 47 Multi-Projector Display Intra projector luminance variation M l (u, v) and B ( u, v ) are not flat Inter projector luminance variation h l (i l ) is different M l (u, v) and B ( u, v ) have different shapes Overlap luminance variation N is different E ( i, u, v) = h r ( i r ) M r (u, v ) + h g ( i g ) M g (u, v ) + h b ( i b ) M b (u, v ) + B ( u, v) j N (u,v) Slide 48
25 Including Chrominance E ( i, u, v) = h r ( i r ) M r (u, v ) + h g ( i g ) M g (u, v ) + h b ( i b ) M b (u, v ) + B ( u, v) j N ( u,v) Slide 49 Including Chrominance E ( i, u, v) = h r ( i r ) ( M r (u, v ), c r ( u, v ) ) + h g ( i g ) ( M g (u, v ), c g ( u, v ) ) + h b ( i b ) ( M b (u, v ), c b ( u, v ) ) + (B ( u, v), c B ( u, v ) ) j N ( u, v ) Slide 50
26 Including Chrominance E ( i, u, v) = h r ( i r ) x ( M r (u, v ), c r ( u, v ) ) + h g ( i g ) x ( M g (u, v ), c g ( u, v ) ) + h b ( i b ) x ( M b (u, v ), c b ( u, v ) ) + (B ( u, v), c B ( u, v ) ) j N ( u, v) k x (L 1, c 1 ) = ( k L 1, c 1 ) Luminance Scaling Slide 51 Including Chrominance + E ( i, u, v) = h r ( i r ) x ( M r (u, v ), c r ( u, v) ) + + h g ( i g ) x ( M g (u, v ), c g ( u, v) ) + + h b ( i b ) x ( M b (u, v ), c b ( u, v) ) + + (B ( u, v), c B ( u, v ) ) j N ( u, v ) k x (L 1, c 1 ) = ( k L 1, c 1 ) Luminance Scaling + ( ) (L 1, c 1 ) (L 2, c 2 ) = L 1 + L 2, c 1 L 1 c 2 L + 2 L 1 + L 2 L 1 + L 2 Optical Superposition Slide 52
27 Including Chrominance + E ( i, u, v) = h r ( i r ) x ( M r (u, v ), c r ( u, v) ) + + h g ( i g ) x ( M g (u, v ), c g ( u, v) ) + + h b ( i b ) x ( M b (u, v ), c b ( u, v) ) + + (B ( u, v), c B ( u, v ) ) j N ( u, v ) Intra projector chrominance variation c l (u, v) and c B ( u, v ) are not flat M r, M g, and M b differ in shape Inter projector and overlap chrominance variation c l and c B differ The relative proportions of max( M l (u, v) ) across channels Slide 53 Model Verification Predicted Color of the Test Image Projected on Display Test Image Multiple Projectors Emineoptic Function Hypothetical Camera Reconstructed Parameters of the Emineoptic Function Predicted Response Actual Response Physical Camera Slide 54


28 Modeled vs Actual (Both luminance and chrominance) Test Image Predicted Response Actual Response Slide 55 Organization Previous Work The Emineoptic Function Definition of Color Seamlessness Achieving Photometric Seamlessness Results Slide 56
29 Thesis Statement The color variation in multi-projector displays can be modeled by the emineoptic function. Achieving color seamlessness is an optimization problem that can be defined using the emineoptic function. Perceptually uniform high quality displays can be achieved by realizing a desired emineoptic function that differs minimally from the original function and has imperceptible color variation. Slide 57 Properties of Color Variation Based on extensive empirical analysis of real projectors Intra-projector Within a single projector Inter-projector Across different projectors Overlaps Slide 58

30 Properties of Color Variation Based on extensive empirical analysis of real projectors Intra-projector Within a single projector Inter-projector Across different projectors Overlaps Slide 59 Intra-Projector Variations Chrominance is almost constant Luminance is not Chromaticity Pixels in X Pixels in Y Luminance variation is more significant than chrominance variation Luminance Pixels in X Pixels Slide in Y60
31 Intra-Projector Variations Chrominance is constant Luminance is not + E ( i, u, v) = h r ( i r ) x ( M r (u, v ), c r ( u, v) ) + + h g ( i g ) x ( M g (u, v ), c g ( u, v) ) + + h b ( i b ) x ( M b (u, v ), c b ( u, v) ) + + (B ( u, v), c B ( u, v ) ) j N ( u, v) Slide 61 Properties of Color Variation Based on extensive empirical analysis of real projectors Intra-projector Within a single projector Inter-projector Across different projectors Overlaps Slide 62
 of a four projector display Luminance variation is more significant than")
32 Inter-Projector Variations Projectors of same model Chrominance variation is negligible Luminance variation is significant Projectors of different models Chrominance variation is relatively very small Luminance variation is significant Chromaticity x Pixels in X Proj1 Proj3 Proj2 Proj4 Pixels in Y Chrominance ( x ) of a four projector display Luminance variation is more significant than chrominance variation Slide 63 Inter-Projector Variations + E ( i, u, v) = h r ( i r ) x ( M r (u, v ), c r ( u, v) ) + + h g ( i g ) x ( M g (u, v ), c g ( u, v) ) + + h b ( i b ) x ( M b (u, v ), c b ( u, v) ) + + (B ( u, v), c B ( u, v ) ) j N ( u, v) Slide 64
33 Properties of Color Variation Based on extensive empirical analysis of real projectors Intra-projector Within a single projector Inter-projector Across different projectors Overlaps Slide 65 Overlaps For displays made of same model projectors, at overlap regions Chrominance remains almost constant Luminance almost gets multiplied by the number of overlapping projectors Luminance variation is more significant than chrominance variation Slide 66
34 Addresses only Luminance Most display walls made of same model projectors Spatial variation in chrominance is insignificant compared to luminance Humans are more sensitive to spatial luminance variation than to spatial chrominance variation Slide 67 Achieving Photometric Seamlessness Reconstruction Reconstruct E Modification Modify E to E Reprojection Reproject E Slide 68
 + h g ( i g ) M g (u, v ) Transfer + h b (i b ) M b (u, v ) Function + B ( u, v) j N ( u, v) Luminance Function Luminance Black Offset Pixels in X Pixels Slide in Y")
35 Achieving Photometric Seamlessness Reconstruction Reconstruct E Modification Modify E to E Reprojection Reproject E Slide 69 Reconstruction E ( i, u, v) = h r ( i r ) M r (u, v ) + h g ( i g ) M g (u, v ) Transfer + h b (i b ) M b (u, v ) Function + B ( u, v) j N ( u, v) Luminance Function Luminance Black Offset Pixels in X Pixels Slide in Y 70
36 Reconstruction E ( i, u, v) = h r ( i r ) M r (u, v ) + h g ( i g ) M g (u, v ) + h b (i b ) M b (u, v ) + B ( u, v) Photometer j N ( u, v) Camera Luminance Pixels in X Pixels Slide in Y 71 Achieving Photometric Seamlessness Reconstruction Reconstruct E Modification Modify E to E Reprojection Reproject E Slide 72
37 Modification 1 P ( i, u, v) = h r ( i r ) M r (u, v ) + h g ( i g ) M g (u, v ) + h b (i b ) M b (u, v ) + B ( u, v) Single Projector E ( i, u, v) = h r ( i r ) M r (u, v ) + h g ( i g ) M g (u, v ) Multi Projector + h b (i b ) M b (u, v ) + B ( u, v) j N ( u, v) Match h l (i l ) of projectors Slide 73 Modification 1 P ( i, u, v) = h r ( i r ) M r (u, v ) + h g ( i g ) M g (u, v ) + h b (i b ) M b (u, v ) + B ( u, v) Single Projector E ( i, u, v) = H r ( i r ) M r (u, v ) + H g ( i g ) M g (u, v ) Multi Projector + H b (i b ) M b (u, v ) + B ( u, v) j N ( u, v) Match h l (i l ) of projectors Slide 74
38 Modification 1 P ( i, u, v) = h r ( i r ) M r (u, v ) + h g ( i g ) M g (u, v ) + h b (i b ) M b (u, v ) + B ( u, v) Single Projector E ( i, u, v) = H r ( i r ) M r (u, v ) + H g ( i g ) M g (u, v ) Multi Projector + H b (i b ) M b (u, v ) + B ( u, v) j N ( u, v) Match h l (i l ) of projectors Slide 75 Modification 1 P ( i, u, v) = h r ( i r ) M r (u, v ) + h g ( i g ) M g (u, v ) + h b (i b ) M b (u, v ) + B ( u, v) Transfer Function of one Projector E ( i, u, v) = H r ( i r ) M r (u, v ) + H g ( i g ) M g (u, v ) Common Transfer + H b (i b ) M b (u, v ) Function + B ( u, v) j N ( u, v) Luminance Functions of one Projector Black Offset of one Projector Luminance Functions of the whole Display Black Offset of the whole Display Display is like a single large projector Slide 76


39 Display Luminance Functions One Projector Display 15 Projector Display Slide 77 Display Luminance Functions Slide 78
40 Modification 2 Sharp discontinuities are the cause of photometric seams Remove the sharp discontinuities Slide 79 The Problem L u Slide 80
41 Strict Photometric Uniformity L u Slide 81 Strict Photometric Uniformity lumlum ( E ( u 1, v 1, i, e) ) lum ( E ( u 2, v 2, i, e) ) = 0 The luminance of the light reaching the viewer from any two coordinates is identical Strict Color Uniformity E ( u 1, v 1, i, e) - E ( u 2, v 2, i, e) = 0 The color of the light reaching the viewer from any two coordinates is identical Slide 82

42 Strict Photometric Uniformity Suboptimal use of system resources L Significant Contrast/ Dynamic Range Compression u Slide 83 Display Quality Which one is better? After Strict Photometric Uniformity Before Slide 84


43 Is Strict Photometric Uniformity Required? Humans cannot detect smooth luminance variations Perceptual Uniformity Slide 85 Achieving Photometric Seamlessness Optimization Problem Perceptual Uniformity» Creates the perception of uniformity Display Quality» Maintains high display quality Slide 86
44 Optimization Problem L L u Strict photometric uniformity is a special case of perceptual uniformity u Slide 87 Photometric Seamlessness Perceptual Uniformity lum (E ( u 1, v 1, i, e) ) - lum ( E ( u 2, v 2, i, e) ) Display Quality Minimize Distance (lum ( E( u, v, i, e) ), lum( ( E ( u, v, i, e) ) ) Slide 88
45 Color Seamlessness Perceptual Uniformity E ( u 1, v 1, i, e) - E ( u 2, v 2, i, e) Display Quality Minimize Distance ( E( u, v, i, e), E ( u, v, i, e) ) Perceptually uniform high quality displays can be achieved by realizing a desired emineoptic function that differs minimally from the original function and has imperceptible color variation. Slide 89 Strict Photometric Uniformity After Strict Photometric Uniformity Before Slide 90


46 Photometric Seamlessness After Photometric Seamlessness Before Slide 91 Smooth Luminance Functions 5 x 3 array of fifteen projectors Before smoothing After smoothing Slide 92
")

 Slide 94")
47 Different Smoothing Parameter (2x2 array of four projectors) Smooth Original Smoother Flat Slide 93 Using different smoothing parameters (3x5 array of 15 projectors) Smooth Original Smoother Flat Slide 94
48 Achieving Photometric Seamlessness Reconstruction Reconstruct E Modification Modify E to E Reprojection Reproject E Slide 95 Reprojection f 1 (i) f 1 i E f 2 (i) f 2 i Slide 96

 Projector Attenuation")
49 Smoothing Maps Attenuation Map Per pixel luminance attenuation to achieve the desired luminance function Offset Map Per pixel luminance offset to achieve the desired black offset Slide 97 Attenuation Map Display Attenuation Map (15 projector display) Projector Attenuation Map Slide 98
50 Per Projector Image Correction Channel Linearization Function Smoothing Maps h l -1 Inverse of each projector s transfer function Smooth M r (u, v ) Smooth B ( u, v) = Match h l (i l ) to H l (i l ) X + Offset map Common Transfer Function f 1 H l Slide 99 Reprojection f 1 (i) f 1 i E f 2 (i) f 2 i Slide 100
51 System Pipeline OFF-LINE CALIBRATION Reconstruct Display Luminance Functions Generate Smooth Luminance Functions Choose Common Transfer Function Reconstruct Transfer Functions Channel Linearization Function Attenuation and Offset Maps Uncorrected Image ON-LINE IMAGE CORRECTION Corrected Image Apply Channel Linearization Function Apply Attenuation and Offset Maps Apply Common Transfer Function Slide 101 Issues Camera Linearity Dynamic Range Sampling Frequency Scalability Slide 102

52 Organization Previous Work The Emineoptic Function Definition of Color Seamlessness Achieving Photometric Seamlessness Results Slide 103 Results (After) Slide 104
")
53 Results (Before) 6 Projector Display Slide 105 Results (After) Slide 106

54 Results (Before) 15 Projector Display Slide 107 Chrominance Chrominance and luminance are not independent parameters 5D nonlinear optimization problem No definite perceptual objective metric Insights from emineoptic function Luminance variations can be perceived as chrominance variations How far can we go with just luminance? Slide 108
55 The Comprehensive Framework Validity of the Emineoptic Function Model verification Generality Can be used to model color variations of other devices Also a camera Unifying Parametric Space Explain and compare different algorithms» Parameters addressed» Formal color correction goal they strive to achieve» Success they can achieve Design new algorithms Slide 109 Evaluation Metric Comparing the quality of display Brightness Contrast Seamlessness Slide 110
56 Summary Modeling color variation comprehensively Color Seamlessness Optimization Problem Achieving Photometric Seamlessness Slide 111 Future Work (Handling Chrominance) Before Slide 112

57 Future Work (Handling Chrominance) After Slide 113 Future Work Real time Calibration Different kinds of sensors Perceptual Image Quality Metric Slide 114
58 THE END Before After Smoothing Slide 115
SYDE 575: Introduction to Image Processing. Image Compression Part 2: Variable-rate compression
 SYDE 575: Introduction to Image Processing Image Compression Part 2: Variable-rate compression Variable-rate Compression: Transform-based compression As mentioned earlier, we wish to transform image data
Lecture 8: Interest Point Detection. Saad J Bedros
 #1 Lecture 8: Interest Point Detection Saad J Bedros sbedros@umn.edu Review of Edge Detectors #2 Today s Lecture Interest Points Detection What do we mean with Interest Point Detection in an Image Goal:
Color Seamlessness in Multi-Projector Displays using Constrained Gamut Morphing
 Coor Seamessness in Muti-Projector Dispays using Constrained Gamut Morphing IEEE Transactions on Visuaization and Computer Graphics, Vo. 15, No. 6, 2009 Behzad Sajadi, Maxim Lazarov, Aditi Majumder, and
CS Color. Aditi Majumder, CS 112 Slide 1
 CS 112 - Color Aditi Majumder, CS 112 Slide 1 Visible Light Spectrum Aditi Majumder, CS 112 Slide 2 Color is due to.. Selective emission/reflection of different wavelengths by surfaces in the world Different
Lecture 8: Interest Point Detection. Saad J Bedros
 #1 Lecture 8: Interest Point Detection Saad J Bedros sbedros@umn.edu Last Lecture : Edge Detection Preprocessing of image is desired to eliminate or at least minimize noise effects There is always tradeoff
The Visual Perception of Images
 C. A. Bouman: Digital Image Processing - January 8, 2018 1 The Visual Perception of Images In order to understand images you must understand how humans perceive visual stimulus. Objectives: Understand
6.869 Advances in Computer Vision. Bill Freeman, Antonio Torralba and Phillip Isola MIT Oct. 3, 2018
 6.869 Advances in Computer Vision Bill Freeman, Antonio Torralba and Phillip Isola MIT Oct. 3, 2018 1 Sampling Sampling Pixels Continuous world 3 Sampling 4 Sampling 5 Continuous image f (x, y) Sampling
Art & Science of Shadows
 Art & Science of Shadows Cast Shadows Size and sharpness of a cast shadow depends on: Size of the light source Distance from light to object Distance from light to wall Cast Shadow for Directional Light
Visual Imaging and the Electronic Age Color Science Metamers & Chromaticity Diagrams. Lecture #6 September 7, 2017 Prof. Donald P.
 Visual Imaging and the Electronic Age Color Science Metamers & Chromaticity Diagrams Lecture #6 September 7, 2017 Prof. Donald P. Greenberg Matching the Power Spectrum of the Test Lamp with a Full Set
Motion Estimation (I) Ce Liu Microsoft Research New England
 Ce Liu Microsoft Research New England") Motion Estimation (I) Ce Liu celiu@microsoft.com Microsoft Research New England We live in a moving world Perceiving, understanding and predicting motion is an important part of our daily lives Motion
Motion Estimation (I) Ce Liu celiu@microsoft.com Microsoft Research New England We live in a moving world Perceiving, understanding and predicting motion is an important part of our daily lives Motion
Motion Estimation (I)
") Motion Estimation (I) Ce Liu celiu@microsoft.com Microsoft Research New England We live in a moving world Perceiving, understanding and predicting motion is an important part of our daily lives Motion
Motion Estimation (I) Ce Liu celiu@microsoft.com Microsoft Research New England We live in a moving world Perceiving, understanding and predicting motion is an important part of our daily lives Motion
Digital Image Processing COSC 6380/4393
 Digital Image Processing COSC 6380/4393 Lecture 7 Sept 11 th, 2018 Pranav Mantini Slides from Dr. Shishir K Shah and Frank (Qingzhong) Liu Today Review Binary Image Processing Opening and Closing Skeletonization
Capturing and Processing Deep Space Images. Petros Pissias Eumetsat Astronomy Club 15/03/2018
 Capturing and Processing Deep Space Images Petros Pissias Eumetsat Astronomy Club 15/03/2018 Agenda Introduction Basic Equipment Preparation Acquisition Processing Quick demo Petros Pissias Eumetsat Astronomy
E27 SPRING 2015 ZUCKER PROJECT 2 LAPLACIAN PYRAMIDS AND IMAGE BLENDING
 E27 SPRING 2015 ZUCKER PROJECT 2 PROJECT 2 LAPLACIAN PYRAMIDS AND IMAGE BLENDING OVERVIEW In this project, you will investigate two applications: Laplacian pyramid blending and hybrid images. You can use
Digital Elevation Models (DEM)
") Digital Elevation Models (DEM) Digital representation of the terrain surface enable 2.5 / 3D views Rule #1: they are models, not reality Rule #2: they always include some errors (subject to scale and data
Digital Elevation Models (DEM) Digital representation of the terrain surface enable 2.5 / 3D views Rule #1: they are models, not reality Rule #2: they always include some errors (subject to scale and data
Introduction to Video Compression H.261
 Introduction to Video Compression H.6 Dirk Farin, Contact address: Dirk Farin University of Mannheim Dept. Computer Science IV L 5,6, 683 Mannheim, Germany farin@uni-mannheim.de D.F. YUV-Colorspace Computer
Vision & Perception. Simple model: simple reflectance/illumination model. image: x(n 1,n 2 )=i(n 1,n 2 )r(n 1,n 2 ) 0 < r(n 1,n 2 ) < 1
=i(n 1,n 2 )r(n 1,n 2 ) 0 < r(n 1,n 2 ) < 1") Simple model: simple reflectance/illumination model Eye illumination source i(n 1,n 2 ) image: x(n 1,n 2 )=i(n 1,n 2 )r(n 1,n 2 ) reflectance term r(n 1,n 2 ) where 0 < i(n 1,n 2 ) < 0 < r(n 1,n 2 )
Simple model: simple reflectance/illumination model Eye illumination source i(n 1,n 2 ) image: x(n 1,n 2 )=i(n 1,n 2 )r(n 1,n 2 ) reflectance term r(n 1,n 2 ) where 0 < i(n 1,n 2 ) < 0 < r(n 1,n 2 )
CS4495/6495 Introduction to Computer Vision. 6B-L1 Dense flow: Brightness constraint
 CS4495/6495 Introduction to Computer Vision 6B-L1 Dense flow: Brightness constraint Motion estimation techniques Feature-based methods Direct, dense methods Motion estimation techniques Direct, dense methods
Color2Gray: Salience-Preserving Color Removal
 Color2Gray: Salience-Preserving Color Removal Amy Gooch Sven Olsen Jack Tumblin Bruce Gooch Slides by Gooch et al. Color Removal Color Grayscale Color Removal Color Proposed Algorithm Isoluminant Colors
Lab VI Light Emitting Diodes ECE 476
 Lab VI Light Emitting Diodes ECE 476 I. Purpose This experiment examines the properties of light emitting diodes. The use of the monochromator for studying the spectrum of light sources is also examined.
Old painting digital color restoration
 Old painting digital color restoration Michail Pappas Ioannis Pitas Dept. of Informatics, Aristotle University of Thessaloniki GR-54643 Thessaloniki, Greece Abstract Many old paintings suffer from the
What is Image Deblurring?
 What is Image Deblurring? When we use a camera, we want the recorded image to be a faithful representation of the scene that we see but every image is more or less blurry, depending on the circumstances.
Color perception SINA 08/09
 Color perception Color adds another dimension to visual perception Enhances our visual experience Increase contrast between objects of similar lightness Helps recognizing objects However, it is clear that
Contrast Sensitivity
 Contrast Sensitivity Performance in a vision based task, such as reading text, recognizing faces, or operating a vehicle, is limited by the overall quality of the image. Image quality depends on many factors,
When taking a picture, what color is a (Lambertian) surface?
 surface?") Shadow removal When taking a picture, what color is a (Lambertian) surface? What if it s not a cloudy day? Region lit by skylight only Region lit by sunlight and skylight What great things could we do
Shadow removal When taking a picture, what color is a (Lambertian) surface? What if it s not a cloudy day? Region lit by skylight only Region lit by sunlight and skylight What great things could we do
CITS 4402 Computer Vision
 CITS 4402 Computer Vision A/Prof Ajmal Mian Adj/A/Prof Mehdi Ravanbakhsh Lecture 06 Object Recognition Objectives To understand the concept of image based object recognition To learn how to match images
Screen-space processing Further Graphics
 Screen-space processing Rafał Mantiuk Computer Laboratory, University of Cambridge Cornell Box and tone-mapping Rendering Photograph 2 Real-world scenes are more challenging } The match could not be achieved
Perceptually Uniform Color Spaces
 C. A. Bouman: Digital Image Processing - January 8, 2018 1 Perceptually Uniform Color Spaces Problem: Small changes in XYZ may result in small or large perceptual changes. Solution: Formulate a perceptually
Physics I : Oscillations and Waves Prof. S. Bharadwaj Department of Physics and Meteorology Indian Institute of Technology, Kharagpur
 Physics I : Oscillations and Waves Prof. S. Bharadwaj Department of Physics and Meteorology Indian Institute of Technology, Kharagpur Lecture - 21 Diffraction-II Good morning. In the last class, we had
Color Image Correction
 FLDE. p. 1/48 Color Image Correction Benasque, September 2007 Vicent Caselles Departament de Tecnologia Universitat Pompeu Fabra joint work with M.Bertalmío, R. Palma, E. Provenzi FLDE. p. 2/48 Overview
Feasibility study: Use of Sigma 0 and radar images to extract and classify roads in Central Africa. Progress Reports
 : Use of Sigma 0 and radar images to extract and classify roads in Central Africa Progress Reports Study supported by the Canadian Space Agency : Use of Sigma 0 and radar images to extract and classify
Using a Hopfield Network: A Nuts and Bolts Approach
 Using a Hopfield Network: A Nuts and Bolts Approach November 4, 2013 Gershon Wolfe, Ph.D. Hopfield Model as Applied to Classification Hopfield network Training the network Updating nodes Sequencing of
Edges and Scale. Image Features. Detecting edges. Origin of Edges. Solution: smooth first. Effects of noise
 Edges and Scale Image Features From Sandlot Science Slides revised from S. Seitz, R. Szeliski, S. Lazebnik, etc. Origin of Edges surface normal discontinuity depth discontinuity surface color discontinuity
CHAPTER 4 PRINCIPAL COMPONENT ANALYSIS-BASED FUSION
 59 CHAPTER 4 PRINCIPAL COMPONENT ANALYSIS-BASED FUSION 4. INTRODUCTION Weighted average-based fusion algorithms are one of the widely used fusion methods for multi-sensor data integration. These methods
Image Filtering. Slides, adapted from. Steve Seitz and Rick Szeliski, U.Washington
 Image Filtering Slides, adapted from Steve Seitz and Rick Szeliski, U.Washington The power of blur All is Vanity by Charles Allen Gillbert (1873-1929) Harmon LD & JuleszB (1973) The recognition of faces.
LED Measurement Instrumentation
 R.Young LED Measurement Instrumentation Optronic Laboratories, Inc. ABSTRACT The production and use of LEDs is increasing rapidly. They are being used in applications previously occupied by traditional
Visual Object Recognition
 Visual Object Recognition Lecture 2: Image Formation Per-Erik Forssén, docent Computer Vision Laboratory Department of Electrical Engineering Linköping University Lecture 2: Image Formation Pin-hole, and
Spatial Vision: Primary Visual Cortex (Chapter 3, part 1)
") Spatial Vision: Primary Visual Cortex (Chapter 3, part 1) Lecture 6 Jonathan Pillow Sensation & Perception (PSY 345 / NEU 325) Princeton University, Spring 2015 1 Chapter 2 remnants 2 Receptive field:
Spatial Vision: Primary Visual Cortex (Chapter 3, part 1) Lecture 6 Jonathan Pillow Sensation & Perception (PSY 345 / NEU 325) Princeton University, Spring 2015 1 Chapter 2 remnants 2 Receptive field:
Sequence Quantization y. C. B. Atkins, T. J. Flohr, D. P. Hilgenberg, C. A. Bouman, and J. P. Allebach
 Model-Based Color Image Sequence Quantization y C. B. Atkins, T. J. Flohr, D. P. Hilgenberg, C. A. Bouman, and J. P. Allebach School of Electrical Engineering, Purdue University, West Lafayette, IN 4797-1285
Feature extraction: Corners and blobs
 Feature extraction: Corners and blobs Review: Linear filtering and edge detection Name two different kinds of image noise Name a non-linear smoothing filter What advantages does median filtering have over
Ground and On-Orbit Characterization and Calibration of the Geosynchronous Imaging Fourier Transform Spectrometer (GIFTS)
") Ground and On-Orbit Characterization and Calibration of the Geosynchronous Imaging Fourier Transform Spectrometer (GIFTS) John D. Elwell 1, Deron K. Scott 1 Henry E. Revercomb 2, Fred A. Best 2, Robert
Ground and On-Orbit Characterization and Calibration of the Geosynchronous Imaging Fourier Transform Spectrometer (GIFTS) John D. Elwell 1, Deron K. Scott 1 Henry E. Revercomb 2, Fred A. Best 2, Robert
Geography 360 Principles of Cartography. April 17, 2006
 Geography 360 Principles of Cartography April 17, 2006 Outlines Cartographic design principles Enhancing visual hierarchies on maps Kinds of numerical data and color scheme What is proportional symbol
March 26, Title: TEMPO 21 Report. Prepared for: Sviazinvest, OJSC. Prepared by: Cree Durham Technology Center (DTC) Ticket Number: T
 Ticket Number: T") March 26, 2012 Title: TEMPO 21 Report Prepared for: Sviazinvest, OJSC Prepared by: Cree Durham Technology Center (DTC) Ticket Number: 10806-T Co NVLAP lab code 500070-0 The accreditation of the Cree Durham
March 26, 2012 Title: TEMPO 21 Report Prepared for: Sviazinvest, OJSC Prepared by: Cree Durham Technology Center (DTC) Ticket Number: 10806-T Co NVLAP lab code 500070-0 The accreditation of the Cree Durham
Waveform-Based Coding: Outline
 Waveform-Based Coding: Transform and Predictive Coding Yao Wang Polytechnic University, Brooklyn, NY11201 http://eeweb.poly.edu/~yao Based on: Y. Wang, J. Ostermann, and Y.-Q. Zhang, Video Processing and
Inverse Problems in Image Processing
 H D Inverse Problems in Image Processing Ramesh Neelamani (Neelsh) Committee: Profs. R. Baraniuk, R. Nowak, M. Orchard, S. Cox June 2003 Inverse Problems Data estimation from inadequate/noisy observations
Channel Representation of Colour Images
 Channel Representation of Colour Images Report LiTH-ISY-R-2418 Per-Erik Forssén, Gösta Granlund and Johan Wiklund Computer Vision Laboratory, Department of Electrical Engineering Linköping University,
Review for Exam 1. Erik G. Learned-Miller Department of Computer Science University of Massachusetts, Amherst Amherst, MA
 Review for Exam Erik G. Learned-Miller Department of Computer Science University of Massachusetts, Amherst Amherst, MA 0003 March 26, 204 Abstract Here are some things you need to know for the in-class
Adaptive Optics for the Giant Magellan Telescope. Marcos van Dam Flat Wavefronts, Christchurch, New Zealand
 Adaptive Optics for the Giant Magellan Telescope Marcos van Dam Flat Wavefronts, Christchurch, New Zealand How big is your telescope? 15-cm refractor at Townsend Observatory. Talk outline Introduction
Colour Part One. Energy Density CPSC 553 P Wavelength 700 nm
 Colour Part One Energy Density 400 Wavelength 700 nm CPSC 553 P 1 Human Perception An Active Organising Process Many illusions experiments from psychology Colour not just a matter of measuring wavelength
Image Data Compression
 Image Data Compression Image data compression is important for - image archiving e.g. satellite data - image transmission e.g. web data - multimedia applications e.g. desk-top editing Image data compression
IMPROVED INTRA ANGULAR PREDICTION BY DCT-BASED INTERPOLATION FILTER. Shohei Matsuo, Seishi Takamura, and Hirohisa Jozawa
 2th European Signal Processing Conference (EUSIPCO 212 Bucharest, Romania, August 27-31, 212 IMPROVED INTRA ANGULAR PREDICTION BY DCT-BASED INTERPOLATION FILTER Shohei Matsuo, Seishi Takamura, and Hirohisa
encoding without prediction) (Server) Quantization: Initial Data 0, 1, 2, Quantized Data 0, 1, 2, 3, 4, 8, 16, 32, 64, 128, 256
 (Server) Quantization: Initial Data 0, 1, 2, Quantized Data 0, 1, 2, 3, 4, 8, 16, 32, 64, 128, 256") General Models for Compression / Decompression -they apply to symbols data, text, and to image but not video 1. Simplest model (Lossless ( encoding without prediction) (server) Signal Encode Transmit (client)
General Models for Compression / Decompression -they apply to symbols data, text, and to image but not video 1. Simplest model (Lossless ( encoding without prediction) (server) Signal Encode Transmit (client)
Radiometry. Nuno Vasconcelos UCSD
 Radiometry Nuno Vasconcelos UCSD Light Last class: geometry of image formation pinhole camera: point (x,y,z) in 3D scene projected into image pixel of coordinates (x, y ) according to the perspective projection
Quality Report Generated with Pix4Dmapper Pro version
 Quality Report Generated with Pix4Dmapper Pro version 3.0.13 Important: Click on the different icons for: Help to analyze the results in the Quality Report Additional information about the sections Click
HELIOSTAT FIELD EFFICIENCY TEST OF BEAM DOWN CSP PILOT PLANT EXPEREMINATAL RESULTS
 HELIOSTAT FIELD EFFICIENCY TEST OF BEAM DOWN CSP PILOT PLANT EXPEREMINATAL RESULTS Marwan Mokhtar 1, Irene Rubalcaba 1, Steven Meyers 1, Abdul Qadir 1, Peter Armstrong 1, Matteo Chiesa 1 Masdar Institute
Face Detection and Recognition
 Face Detection and Recognition Face Recognition Problem Reading: Chapter 18.10 and, optionally, Face Recognition using Eigenfaces by M. Turk and A. Pentland Queryimage face query database Face Verification
Opponent Color Spaces
 C. A. Bouman: Digital Image Processing - January 8, 2018 1 Opponent Color Spaces Perception of color is usually not best represented in RGB. A better model of HVS is the so-call opponent color model Opponent
THE MEASUREMENT OF COLOR IN A QUALITY CONTROL SYSTEM: TEXTILE COLOR MATCHING
 th IMEKO TC7 International Symposium June 3 July 2, 24, Saint-Petersburg, Russia THE MEASUREMENT OF COLOR IN A QUALITY CONTROL SYSTEM: TEXTILE COLOR MATCHING Andrea Zanobini, Gaetano Iuculano Department
Contents of today s lecture
 Contents of today s lecture Blasius solution for laminar flat-plate boundary layer where external velocity is constant ( ) About solution methods for laminar boundary layers Thwaites method as an example
How can you factor the trinomial x 2 + bx + c into the product of two binomials? ACTIVITY: Finding Binomial Factors
 7.7 Factoring x 2 + bx + c How can you factor the trinomial x 2 + bx + c into the product of two binomials? 1 ACTIVITY: Finding Binomial Factors Work with a partner. Six different algebra tiles are shown
Three-Dimensional Electron Microscopy of Macromolecular Assemblies
 Three-Dimensional Electron Microscopy of Macromolecular Assemblies Joachim Frank Wadsworth Center for Laboratories and Research State of New York Department of Health The Governor Nelson A. Rockefeller
Over-enhancement Reduction in Local Histogram Equalization using its Degrees of Freedom. Alireza Avanaki
 Over-enhancement Reduction in Local Histogram Equalization using its Degrees of Freedom Alireza Avanaki ABSTRACT A well-known issue of local (adaptive) histogram equalization (LHE) is over-enhancement
BigBOSS Data Reduction Software
 BigBOSS Data Reduction Software The University of Utah Department of Physics & Astronomy The Premise BigBOSS data reduction software is as important as BigBOSS data collection hardware to the scientific
Human Visual System Based Adaptive Inter Quantization
 Human Visual System Based Adaptive Inter Quantization Jin Li 1, Jari Koivusaari 1,Jarma akala 1,Moncef Gabbouj 1 and Hexin Chen 2 Department of Information echnology, ampere University of echnology ampere,
Diagnosing and Correcting Systematic Errors in Spectral-Based Digital Imaging
 Diagnosing and Correcting Systematic Errors in Spectral-Based Digital Imaging Mahnaz Mohammadi and Roy S Berns, Munsell Color Science Laboratory, Chester F Carlson Center for Imaging Science, Rochester
Half-Pel Accurate Motion-Compensated Orthogonal Video Transforms
 Flierl and Girod: Half-Pel Accurate Motion-Compensated Orthogonal Video Transforms, IEEE DCC, Mar. 007. Half-Pel Accurate Motion-Compensated Orthogonal Video Transforms Markus Flierl and Bernd Girod Max
RESTORATION OF VIDEO BY REMOVING RAIN
 RESTORATION OF VIDEO BY REMOVING RAIN Sajitha Krishnan 1 and D.Venkataraman 1 1 Computer Vision and Image Processing, Department of Computer Science, Amrita Vishwa Vidyapeetham University, Coimbatore,
CS Sampling and Aliasing. Analog vs Digital
 CS 112 - Sampling and Aliasing Aditi Majumder, CS 112, Winter 2007 Slide 1 Analog vs Digital God has created the world analog Man has created digital world Aditi Majumder, CS 112, Winter 2007 Slide 2 1
Discriminative Direction for Kernel Classifiers
 Discriminative Direction for Kernel Classifiers Polina Golland Artificial Intelligence Lab Massachusetts Institute of Technology Cambridge, MA 02139 polina@ai.mit.edu Abstract In many scientific and engineering
CSE 408 Multimedia Information System Yezhou Yang
 Image and Video Compression CSE 408 Multimedia Information System Yezhou Yang Lots of slides from Hassan Mansour Class plan Today: Project 2 roundup Today: Image and Video compression Nov 10: final project
Basic principles of cartographic design. Makram Murad-al-shaikh M.S. Cartography Esri education delivery team
 Basic principles of cartographic design Makram Murad-al-shaikh M.S. Cartography Esri education delivery team Cartographic concepts Cartography defined The communication channel - Why maps fail Objectives
CHARA Meeting 2017 Pasadena, California
 MORE AUTOMATION Laszlo Sturmann M7 ACTUATORS LAB. LASER ALIGNMENT TELESCOPE OPTICAL ALIGNMENT NEW ACTUATORS REMOTELY ACTUATED M7 MOUNT MOTIVATION THE PRECISION OF THE COUDE ALIGNMENT WAS NOT SUFFICIENT
Color and compositing
 Color and compositing 2D Computer Graphics: Diego Nehab Summer 208. Radiometry Measurement of radiant energy in terms of absolute power Wave vs. particle Wavelength (λ), frequency (ν = c λ ), and amplitude
Inverse Heat Flux Evaluation using Conjugate Gradient Methods from Infrared Imaging
 11 th International Conference on Quantitative InfraRed Thermography Inverse Heat Flux Evaluation using Conjugate Gradient Methods from Infrared Imaging by J. Sousa*, L. Villafane*, S. Lavagnoli*, and
FluxGage - A Photometric Test System for LED Luminaires Based on Solar Panels
 FluxGage - A Photometric Test System for LED Luminaires Based on Solar Panels Efi Rotem, Raphael Cohen, Shimon Elstein, Daniel Sebbag, Ephraim Greenfield Abstract We present a novel photometric test system
Colour. The visible spectrum of light corresponds wavelengths roughly from 400 to 700 nm.
 Colour The visible spectrum of light corresponds wavelengths roughly from 4 to 7 nm. The image above is not colour calibrated. But it offers a rough idea of the correspondence between colours and wavelengths.
G EOSPAT I A L ERDAS IMAGINE. The world s most widely-used software package for creating information from geospatial data
 G EOSPAT I A L ERDAS IMAGINE The world s most widely-used software package for creating information from geospatial data ERDAS IMAGINE Geographic imaging professionals need to process vast amounts of
Radiometry. Basics Extended Sources Blackbody Radiation Cos4 th power Lasers and lamps Throughput. ECE 5616 Curtis
 Radiometry Basics Extended Sources Blackbody Radiation Cos4 th power Lasers and lamps Throughput Radiometry Terms Note: Power is sometimes in units of Lumens. This is the same as power in watts (J/s) except
NICMOS Status and Plans
 1997 HST Calibration Workshop Space Telescope Science Institute, 1997 S. Casertano, et al., eds. NICMOS Status and Plans Rodger I. Thompson Steward Observatory, University of Arizona, Tucson, AZ 85721
Trimble s ecognition Product Suite
 Trimble s ecognition Product Suite Dr. Waldemar Krebs October 2010 Trimble Geospatial in the Image Processing Chain Data Acquisition Pre-processing Manual/Pixel-based Object-/contextbased Interpretation
ANALYSIS AND PREDICTION OF JND-BASED VIDEO QUALITY MODEL
 ANALYSIS AND PREDICTION OF JND-BASED VIDEO QUALITY MODEL Haiqiang Wang, Xinfeng Zhang, Chao Yang and C.-C. Jay Kuo University of Southern California, Los Angeles, California, USA {haiqianw, xinfengz, yangchao}@usc.edu,
Overview. Analog capturing device (camera, microphone) PCM encoded or raw signal ( wav, bmp, ) A/D CONVERTER. Compressed bit stream (mp3, jpg, )
 PCM encoded or raw signal ( wav, bmp, ) A/D CONVERTER. Compressed bit stream (mp3, jpg, )") Overview Analog capturing device (camera, microphone) Sampling Fine Quantization A/D CONVERTER PCM encoded or raw signal ( wav, bmp, ) Transform Quantizer VLC encoding Compressed bit stream (mp3, jpg,
Overview Analog capturing device (camera, microphone) Sampling Fine Quantization A/D CONVERTER PCM encoded or raw signal ( wav, bmp, ) Transform Quantizer VLC encoding Compressed bit stream (mp3, jpg,
Single Exposure Enhancement and Reconstruction. Some slides are from: J. Kosecka, Y. Chuang, A. Efros, C. B. Owen, W. Freeman
 Single Exposure Enhancement and Reconstruction Some slides are from: J. Kosecka, Y. Chuang, A. Efros, C. B. Owen, W. Freeman 1 Reconstruction as an Inverse Problem Original image f Distortion & Sampling
Silencing the Experience of Change. Sebastian Watzl (Harvard University)
") Silencing the Experience of Change Sebastian Watzl (Harvard University) 1 Our focus today: Visual experiences as of change. Change of Color Change of Size Change of Shape Change of Location (Movement)
Silencing the Experience of Change Sebastian Watzl (Harvard University) 1 Our focus today: Visual experiences as of change. Change of Color Change of Size Change of Shape Change of Location (Movement)
Pose Tracking II! Gordon Wetzstein! Stanford University! EE 267 Virtual Reality! Lecture 12! stanford.edu/class/ee267/!
 Pose Tracking II! Gordon Wetzstein! Stanford University! EE 267 Virtual Reality! Lecture 12! stanford.edu/class/ee267/!! WARNING! this class will be dense! will learn how to use nonlinear optimization
Watershed Modeling With DEMs
 Watershed Modeling With DEMs Lesson 6 6-1 Objectives Use DEMs for watershed delineation. Explain the relationship between DEMs and feature objects. Use WMS to compute geometric basin data from a delineated
Exoplanet False Positive Detection with Sub-meter Telescopes
 Exoplanet False Positive Detection with Sub-meter Telescopes Dennis M. Conti Chair, AAVSO Exoplanet Section Member, TESS Follow-up Observing Program Copyright Dennis M. Conti 2018 1 Topics What are typical
The wavelength reconstruction from toroidal spectrometer image data
 Computational Methods and Experimental Measurements XIII 165 The wavelength reconstruction from toroidal spectrometer image data J. Blazej 1, M. Tamas 1, L. Pina 1, A. Jancarek 1, S. Palinek 1, P. Vrba
What and how do we learn when we give an ontology?
 What and how do we learn when we give an ontology? Paul Teller prteller@ucdavis.edu April, 2011 1 Difficulties with the idea of giving an ontology The case of atoms 2 Argument for atoms Appeal to atoms
The Dark Energy Survey Public Data Release 1
 The Dark Energy Survey Public Data Release 1 Matias Carrasco Kind (NCSA/UIUC) and the DR1 Release Team https://des.ncsa.illinois.edu/ Near-Field Cosmology with DES DR1 and Beyond Workshop, June 27-29th,
Detection of Artificial Satellites in Images Acquired in Track Rate Mode.
 Detection of Artificial Satellites in Images Acquired in Track Rate Mode. Martin P. Lévesque Defence R&D Canada- Valcartier, 2459 Boul. Pie-XI North, Québec, QC, G3J 1X5 Canada, martin.levesque@drdc-rddc.gc.ca
Cross-calibration of Geostationary Satellite Visible-channel Imagers Using the Moon as a Common Reference
 Cross-calibration of Geostationary Satellite Visible-channel Imagers Using the Moon as a Common Reference Thomas C. Stone U.S. Geological Survey, Flagstaff AZ, USA 27 30 August, 2012 Motivation The archives
Digital Image Processing
 Digital Image Processing 16 November 2006 Dr. ir. Aleksandra Pizurica Prof. Dr. Ir. Wilfried Philips Aleksandra.Pizurica @telin.ugent.be Tel: 09/264.3415 UNIVERSITEIT GENT Telecommunicatie en Informatieverwerking
Metamaterials & Plasmonics
 Metamaterials & Plasmonics Exploring the Impact of Rotating Rectangular Plasmonic Nano-hole Arrays on the Transmission Spectra and its Application as a Plasmonic Sensor. Abstract Plasmonic nano-structures
Phase-Correlation Motion Estimation Yi Liang
 EE 392J Final Project Abstract Phase-Correlation Motion Estimation Yi Liang yiliang@stanford.edu Phase-correlation motion estimation is studied and implemented in this work, with its performance, efficiency
Classifying Galaxy Morphology using Machine Learning
 Julian Kates-Harbeck, Introduction: Classifying Galaxy Morphology using Machine Learning The goal of this project is to classify galaxy morphologies. Generally, galaxy morphologies fall into one of two
For this project, you will create a series of paintings that communicate a message through their use of color.
 Kensington Woods School Name: Art 1 Experiment Project For this project, you will create a series of paintings that communicate a message through their use of color. Create a series of 3+ small painting
Midterm Summary Fall 08. Yao Wang Polytechnic University, Brooklyn, NY 11201
 Midterm Summary Fall 8 Yao Wang Polytechnic University, Brooklyn, NY 2 Components in Digital Image Processing Output are images Input Image Color Color image image processing Image Image restoration Image
CS 179: LECTURE 16 MODEL COMPLEXITY, REGULARIZATION, AND CONVOLUTIONAL NETS
 CS 179: LECTURE 16 MODEL COMPLEXITY, REGULARIZATION, AND CONVOLUTIONAL NETS LAST TIME Intro to cudnn Deep neural nets using cublas and cudnn TODAY Building a better model for image classification Overfitting
Discrimination of Closely-Spaced Geosynchronous Satellites Phase Curve Analysis & New Small Business Innovative Research (SBIR) Efforts
 Efforts") Discrimination of Closely-Spaced Geosynchronous Satellites Phase Curve Analysis & New Small Business Innovative Research (SBIR) Efforts Paul LeVan Air Force Research Laboratory Space Vehicles Directorate
Discrimination of Closely-Spaced Geosynchronous Satellites Phase Curve Analysis & New Small Business Innovative Research (SBIR) Efforts Paul LeVan Air Force Research Laboratory Space Vehicles Directorate