Establishment of Local Trip Generation Rates or Equations for Mixed-Use Developments in Kansas
|
|
|
- Franklin Brooks
- 5 years ago
- Views:
Transcription


1 Report No. K-TRAN: KU-11-7 FINAL REPORT October 2012 Establishment of Local Trip Generation Rates or Equations for Mixed-Use Developments in Kansas Mehrdad Givechi, P.E., PTOE George Sarkodee The University of Kansas A cooperative transportation research program between Kansas Department of Transportation, Kansas State University Transportation Center, and The University of Kansas
2 This page intentionally left blank. i
3 1 Report No. 2 Government Accession No. 3 Recipient Catalog No. K-TRAN: KU Title and Subtitle 5 Report Date Establishment of Local Trip Generation Rates or Equations for Mixed-Use Developments October 2012 in Kansas 6 Performing Organization Code 7 Author(s) Mehrdad Givechi, P.E., PTOE; George Sarkodee 9 Performing Organization Name and Address University of Kansas Civil, Environmental & Architectural Engineering Department 1530 West 15 th Street Lawrence, Kansas Sponsoring Agency Name and Address Kansas Department of Transportation Bureau of Materials and Research 700 SW Harrison Street Topeka, Kansas Performing Organization Report No. 10 Work Unit No. (TRAIS) 11 Contract or Grant No. C Type of Report and Period Covered Final Report August 2010 August Sponsoring Agency Code RE Supplementary Notes 16 Abstract Currently, the trip generation rates and equations contained in the Institute of Transportation Engineers (ITE) Trip Generation Manual, 8 th Edition are based on the information collected at single-use, free-standing sites and cannot be directly applied to multi-use developments. Application of this data for multi-use development sites requires use of an adjustment factor called internal capture rate, which is expressed as a percent reduction to the trips generated by individual land uses. These reductions are applied externally to the site at the entrances, adjacent intersections and roadways. They are distinct and separate from pass-by and diverted-link trips and are applied before pass-by and diverted-link trip reductions are applied. While the trip generation rates for individual uses on a multi-use development site may be the same or similar to what they are for free-standing sites, there is potential for interaction between among those uses within the site, particularly where the trip can be made by walking. As a result, the total generation of vehicle trips entering and exiting the multi-use site may be reduced from simply a sum of the individual, discrete trips generated by each land use. Because the development of mixed-use or multi-use sites is increasingly popular, ITE wishes to increase the database on multi-use developments in order to provide internal capture data for a broader range of land uses. ITE would appreciate additional data from analyses of such developments. The goal of this research project is to establish a local trip generation rate model for multi-use developments in state of Kansas, which can potentially be submitted to the ITE headquarter for inclusion in the national database as well. The primary objectives were to identify several appropriate multi-use development sites in the state and document vehicular trip data generated by each site in order to develop a trip generation model that can be used to better estimate trip numbers generated by such sites. A total of three sites were selected and studied for this project including Mission Farms and Park Place developments, both in Leawood, Kansas; and Metcalf95 Complex in Overland Park, Kansas. 17 Key Words Trip Generation Rates, Internal Trip Capture Rates, Mixed- Use Developments, Multi-Use Developments 18 Distribution Statement No restrictions. This document is available to the public through the National Technical Information Service 19 Security Classification (of this report) Unclassified Form DOT F (8-72) 20 Security Classification (of this page) Unclassified 21 No. of pages Price ii
4 Establishment of Local Trip Generation Rates or Equations for Mixed-Use Developments in Kansas Final Report Prepared by Mehrdad Givechi, P.E., PTOE George Sarkodee A Report on Research Sponsored by THE KANSAS DEPARTMENT OF TRANSPORTATION TOPEKA, KANSAS and THE UNIVERSITY OF KANSAS LAWRENCE, KANSAS October 2012 Copyright 2012, Kansas Department of Transportation iii
5 PREFACE The Kansas Department of Transportation s (KDOT) Kansas Transportation Research and New- Developments (K-TRAN) Research Program funded this research project. It is an ongoing, cooperative and comprehensive research program addressing transportation needs of the state of Kansas utilizing academic and research resources from KDOT, Kansas State University and the University of Kansas. Transportation professionals in KDOT and the universities jointly develop the projects included in the research program. NOTICE The authors and the state of Kansas do not endorse products or manufacturers. Trade and manufacturers names appear herein solely because they are considered essential to the object of this report. This information is available in alternative accessible formats. To obtain an alternative format, contact the Office of Transportation Information, Kansas Department of Transportation, 700 SW Harrison, Topeka, Kansas or phone (785) (Voice) (TDD). DISCLAIMER The contents of this report reflect the views of the authors who are responsible for the facts and accuracy of the data presented herein. The contents do not necessarily reflect the views or the policies of the state of Kansas. This report does not constitute a standard, specification or regulation. iv
6 Abstract Currently, the trip generation rates and equations contained in the Institute of Transportation Engineers (ITE) Trip Generation Manual, 8 th Edition are based on the information collected at single-use, free-standing sites and cannot be directly applied to multiuse developments. Application of this data for multi-use development sites requires use of an adjustment factor called internal capture rate, which is expressed as a percent reduction to the trips generated by individual land uses. These reductions are applied externally to the site at the entrances, adjacent intersections and roadways. They are distinct and separate from pass-by and diverted-link trips and are applied before pass-by and diverted-link trip reductions are applied. While the trip generation rates for individual uses on a multi-use development site may be the same or similar to what they are for free-standing sites, there is potential for interaction between among those uses within the site, particularly where the trip can be made by walking. As a result, the total generation of vehicle trips entering and exiting the multi-use site may be reduced from simply a sum of the individual, discrete trips generated by each land use. Because the development of mixed-use or multi-use sites is increasingly popular, ITE wishes to increase the database on multi-use developments in order to provide internal capture data for a broader range of land uses. ITE would appreciate additional data from analyses of such developments. The goal of this research project is to establish a local trip generation rate model for multi-use developments in state of Kansas, which can potentially be submitted to the ITE headquarter for inclusion in the national database as well. The primary objectives were to identify several appropriate multi-use development sites in the state and document vehicular trip data generated by each site in order to develop a trip generation model that can be used to better estimate trip numbers generated by such sites. A total of three sites were selected and studied for this project including Mission Farms and Park Place developments, both in Leawood, Kansas; and Metcalf95 Complex in Overland Park, Kansas. v
7 Acknowledgments The work reported herein has been performed as project number K-TRAN: KU-11-7 Establishment of Local Trip Generation Rates or Equations for Mixed-Use Developments in Kansas for the Kansas Department of Transportation (KDOT) by the Kansas University Transportation Center (KUTC), a subsidiary of the Kansas University Transportation Research Institute (KUTRI), and administered by The Kansas University Center for Research (KUCR). The completion of this project was the combined effort of a number of dedicated staff members of these organizations who helped with contractual agreements preparation; project coordination and monitoring; data collection, summary, reduction and analysis; report finalization and editorial comments. Furthermore, a number of public agencies and business entities throughout the state played significant instrumental roles in providing valuable information during the data collection process. The author wishes to express his sincere gratitude to the following individuals for their contributions, efforts and patience in making this project possible: David Cronister, Statewide Planner, KDOT, and David Schwartz, Statewide Planning Engineer, KDOT, both for their roles as the Project Monitors. George Sarkodee, Graduate Research Assistant, Department of Civil, Environmental and Architectural Engineering at the University of Kansas, for his extensive efforts in data collection and summary. Scott McCullough, Director of Planning Department, City of Lawrence, Kansas; Joseph C. Rexwinkle, Planner II, City of Leawood, Kansas; Mark Stuecheli, Senior Transportation Planner, City of Overland Park, Kansas and all their staff for providing invaluable information that led to selection of the appropriate sites for this project. Julie Serati and Valerie O Meara with Park Place development management team; and staff members of both Mission Farms and Metcalf95 development management teams for providing site-specific information. John E. Selk for his professional input; Nick L. Givechi and Vincent Cody for their volunteer help with certain data collection efforts. vi
8 Table of Contents Abstract... v Acknowledgments... vi Chapter 1: Introduction Background Goals and Objectives Scope Need Project Approach... 3 Chapter 2: Site Selection Site Selection Criteria General Criteria for all Development Sites Multi-Use Development Site Criteria Site Selection and Evaluation Site #1 Mission Farms Site #2 Park Place Site #3 Metcalf95 Complex Chapter 3: Trip Data Collection Methodology General Methodology for all Development Sites Field Data Collection and Limitations Chapter 4: ITE Trip Generation Estimation Analysis Site #1 Mission Farms Site #2 Park Place Site #3 Metcalf95 Complex Chapter 5: Trip Generation Rate Model Formulation Analysis Morning Peak-Hour of a Typical Weekday Afternoon Peak-Hour of a Typical Weekday Model Formulation Trip Generation Rate Model for Morning Peak-Hour Trip Generation Rate Model for Afternoon Peak-Hour vii
9 5.2.3 Model Variables Actual (Observed) Trips versus Estimated Trips (ITE Rates) Findings References Appendix A: Appendix B: Appendix C: Appendix D: Summary of Land-Use and Size Characteristics for Individual Sites Selected for Analysis Summary of Cordon Traffic Counts (Peak-Hours of Typical Weekdays) Summary of Trip Generation Estimations (Using ITE Trip Generation Manual, 8 th Edition) Correspondence Letter Addressed to Local Agencies Requesting Identification of Candidate Mixed-Use Development Sites within Their Jurisdictions viii
10 List of Tables Table 2-1 Site Selection Criteria Checklist Table 2-2 Various Land-Use Composition for Selected Sites Table 3-1 Summary of Peak-Hour Trips, Generated by Mission Farms Mixed-Use Development Site Table 3-2 Summary of Peak-Hour Trips, Generated by Park Place Mixed-Use Development Site Table 3-3 Summary of Peak-Hour Trips, Generated by Metcalf95 Complex Mixed-Use Development Site Table 4-1 Summary of Trip Generation Calculation Using ITE TGM for Mission Farms Mixed-Use Development Site Table 4-2 Summary of Trip Generation Calculation Using ITE TGM for Park Place Mixed-Use Development Site Table 4-3 Summary of Trip Generation Calculation Using ITE TGM for Metcalf95 Complex Mixed- Use Development Site Table 5-1 Comparison of the Actual Site-Generated Trips (Observed) to The Estimated Values Using ITE TGM Rates List of Figures Figure 2-1 Location Map, Site #1: Mission Farms, Leawood, KS Figure 2-2 Location Map, Site #2: Park Place, Leawood, KS Figure 2-3 Location Map, Site #3: Metcalf95 Complex, Overland Park, KS Figure 5-1 Trip Generation Rate Model for Multi-Use Development Site (Morning Peak-Hour of a Typical Weekday) Figure 5-2 Trip Generation Rate Model for Multi-Use Development Site (Afternoon Peak-Hour of a Typical Weekday) ix
11 Chapter 1: Introduction 1.1 Background According to the Institute of Transportation Engineers (ITE) Trip Generation Handbook, a multi-use development is typically a single site consisting of two or more ITE land use classifications between which trips can be made without leaving the site. They are commonly ranging in size from 100,000 to 2 million square feet. While the trips generated by individual land uses on such sites may be the same or similar to what they are for free-standing sites, there is potential for interaction among the individual uses. The trips made between individual land uses within a multi-use development site are called internal or captured trips. They can be made by walking or by vehicles using the internal roadways without using external streets. Therefore, the total vehicular trips entering and exiting the site can/may be less than the sum of the individual discrete trips generated by each land use. Currently, the trip generation rates and equations contained in the Institute of Transportation Engineers (ITE) Trip Generation manual, 8 th Edition are based on the information collected at single-use, free-standing sites and cannot be directly applied to multi-use developments. Application of this data for multi-use development sites requires use of an adjustment factor called internal capture rate, which is expressed as a percent reduction to the trips generated by individual land uses. These reductions are applied externally to the site at the entrances, adjacent intersections and roadways. They are distinct and separate from pass-by and diverted-link trips and are applied before pass-by and diverted-link trip reductions are applied. 1.2 Goals and Objectives The objective of this research project is to To collect and compile trip data for a number of mixed-use development sites at selected locations in Kansas. The procedure in which the data will be collected and compiled will follow the recommended guidelines suggested by ITE. Using the collected data, develop a model that can be used to estimate trip generation rates for mixed-use developments in Kansas. This model can be 1
12 expressed in the form of Rates, Equations and/or Internal Capture Rates ; and Submit the collected data to ITE Headquarter for inclusion in the national database. 1.3 Scope Because the concept of mixed-use development is still, relatively, new in Kansas with only a few sites in existence and/or underdevelopment, the scope of this project was originally set at studying four or fewer sites that would fit the characteristics of a mixed-use development as described by ITE. As mentioned in the subsequent Chapters, a statewide search resulted in identifying five sites as potential candidates for this study, only three of which mixed-use development suitable for analysis purposes. were qualified as appropriate 1.4 Need Internally captured trips can/may be a significant component in the travel patterns at a multi-use development. Current studies conducted by ITE to quantify these capture rates are limited and the need for local mixed-use trip rates is eminent, especially with mixed-use developments gaining popularity. The results of this research can, hopefully, be used To better estimate the trips generated by mixed-use developments in state of Kansas; To identify and evaluate potential interaction among different uses of mixed-use development sites; and To expand the database on observed trip generation rates published by ITE for use at national level. Currently, transportation professionals in Kansas use the trip generation rates outlined in the ITE Trip Generation Manual, 8 th Edition. With fast growing communities in certain parts of the state and mixed-use developments becoming more popular, the need for local mixed-use trip rates become more eminent. 2
13 Lack of both, national and local data on trip rates for mixed-use developments has raised a number of decision-making concerns amongst politicians and transportation professionals to produce more accurate forecasts of new trips generated by proposed new mixed-use developments. Establishment of local trip generation Rates, Equations and/or Internal Capture Rates for such developments will enable analysts to assess traffic impact of such new developments on adjacent street network more accurately. 1.5 Project Approach The following paragraphs highlight the steps taken to conduct this study A large number of local agencies throughout the state, with likelihood of having one or more existing multi-use development sites in their jurisdictions, were contacted to identify as many sites as possible that would fit the characteristics of a multi-use development. The focus areas included major population areas including cities and counties in the state of Kansas. A copy of the correspondence letter requesting this information is included in Appendix D with the list of individual local agencies that were contacted. Upon identification of candidate sites by local agencies, a preliminary investigation was conducted to obtain pertinent information on file such as land-use characteristics, size, occupancy rate, location, and etc. for individual sites. Furthermore, a cursory field and online investigation was conducted to compile additional data necessary to verify that the candidate sites meet the ITE s definition and guidelines for multi-use developments. Based on the preliminary investigation, appropriate sites were selected for this study. In-depth field and office investigations were conducted at each of the selected sites to describe site characteristics, identify limitations and establish a procedure to collect trip data by examining different methods such as the 3
14 o Need for in-person interviews o Need for cordon traffic count during peak-hours and/or 24-hour period o Need for internal traffic counts if internal streets exist and can be isolated and if they carry most of the internal trips (both pedestrian and vehicular) Trip data at each selected site were collected, compiled and results summarized. An analysis was conducted to establish trip rates for each selected site. A model for use in estimating trip numbers generated by a multi-use development site was developed. A trip generation analysis (using the rates suggested by the ITE Trip Generation Manual, 8 th Edition for individual free-standing land uses) was conducted for each of the selected sites and results were compared to the actual trips as well as those predicted by the developed model. 4
15 Chapter 2: Site Selection 2.1 Site Selection Criteria To maintain consistency with ITE s nationally recognized database and procedure, the following criteria were considered for selection of appropriate sites for this study. These criteria are divided into two categories general criteria for all development sites and criteria specific to multi-use development sites General Criteria for all Development Sites Number of Survey Sites Sufficient sample size is necessary to enable the analyst to draw valid conclusions from the trip generation study. However, no simple statistical methodology has been established for determining the number of sites that should be studied to obtain statistically significant trip generation results. In reality, trip generation is influenced by far more than one or two independent variables. As a result, significant variation of individual sites from the weighted average rate or regression curve is frequent. Common practice in the traffic planning industry has been to collect trip generation data at three to five sites that truly meet the recommended site selection criteria with the assumption that this data will yield a relatively stable sample. In specific, for establishing a local trip generation rate, at least three sites need to be surveyed Selection of Appropriate Sites Site selection is critical in achieving representative and consistent trip generation rates. Suggested criteria for identifying sites for collection of trip generation data are as follows Data should be transferable; therefore it is critical that both trip data and development characteristics be representative of the land use to be analyzed. This includes development size, mix of development 5
16 components and geographic location with respect to the area roadway network and area development patterns The development should have reasonably full occupancy (i.e. at 85 th percent) and appear to be economically healthy (Note: %occupancy at the time of the survey, if applicable, should be recorded). The development should be mature (i.e. at least two years old) and located in a mature area so it represents the ultimate characteristics of a successful development. The data needed to describe the independent variable should be available. The site should be selected on the ability to obtain accurate trip generation and development characteristics. It should be possible to isolate the site for counting purposes The site should have a limited number of driveways (as data collection cost consideration). The driveways (or the method of counting traffic) should ensure against double-counting vehicles. It should be possible for counts to be made safely. The need for any special security measures should be identified. The site should consist of multi-use activity. There should be minimal to no on-site construction or adjacent roadway construction. Permission should be obtained from the owner or the building manager (Note: owners/managers are sometimes more willing to be surveyed if the confidentiality of their site is guaranteed or if the results are provided to them) Multi-Use Development Site Criteria A basic premise behind the data presented in ITE Trip Generation Manual is that data were collected at single-use, free-standing sites. However, the development of mixed-use or 6
17 multi-use sites is increasingly popular. While the trip generation rates for individual uses on such sites may be the same or similar to what they are for free-standing sites, there is potential for interaction between among those uses within the multi-use site, particularly where the trip can be made by walking. As a result, the total generation of vehicle trips entering and exiting the multiuse site may be reduced from simply a sum of the individual, discrete trips generated by each land use. A multi-use development, as defined by ITE Trip Generation Handbook, is typically a single real-estate project that consists of two or more ITE Land Use classifications between which trips can be made without using the offsite road system. Because of the nature of these land uses, the trip-making characteristics are interrelated, and some trips are made among the on-site uses. This capture or trips internal to the site has the net effect of reducing vehicle trip generation between the overall development site and the external street system. Multi-use developments are commonly found ranging in size from 100,000 square feet to 2 million square feet. The internal trip-making characteristics of a multi-use development sites are directly related to the mix of on-site land uses (which are typically a combination of residential, office, shopping/retail, restaurant, entertainment and hotel/motel). When combined within a single mixed-use development, these land uses tend to interact and thus attract a portion of each other s trip generation. The driveways serving the multi-use site should not serve any adjacent property. The selected multi-use site should have no or a minimal presence of through trips (i.e. external trips that pass through the site without stopping). What is NOT a multi-use development o CBD 7
18 o Suburban activity centers o Existing ITE land use classification with potential for a mix of land uses, such as o Shopping center o Office park with retail o Office building with retail o Hotel with limited retail and restaurant space 2.2 Site Selection and Evaluation As mentioned earlier, a large number of local agencies throughout the state, with likelihood of having one or more existing multi-use development sites in their jurisdictions, were contacted to identify as many sites as possible that would fit the characteristics of a multi-use development. The focus areas included major population areas including cities and counties in the state of Kansas. A copy of the correspondence letter requesting this information is included in Appendix D with the list of individual local agencies that were contacted. Because the concept of mixed-use development is still, relatively, new in Kansas with only a few sites in existence and/or under development, only a few cities responded favorably - collectively, identifying five candidate sites as follows: Site #1 Mission Farms development located at the intersection of Mission Road and Indian Creek Parkway in Leawood, Kansas (See Figure 2.1 for details). Site #2 Park Place development located on the northeast corner of the intersection of Nall Road and 117 th Street in Leawood, Kansas (See Figure 2.2 for details). Site #3 Metcalf95 Complex development located on the southwest corner of the intersection of 95 th Street and Metcalf Avenue in Overland Park, Kansas (See Figure 2.3 for details). Site #4 Parkway Plaza development located on the northwest corner of the intersection of 135 th Street and Roe Avenue in Leawood, Kansas. 8
19 Site #5 Hobbs Taylor Lofts development located on the northeast corner of 8 th Street and New Hampshire Road in Lawrence, Kansas. As the next step, a preliminary investigation was conducted to screen these sites and verify whether or not they meet the ITE criteria for multi-use development sites. The process included field inspection, online search and checking city records on file for general information such as land-use characteristics, development size, occupancy rate, internal and adjacent roadway characteristics, economic viability of the sites and etc. The results of this investigation, as summarized in Table 2.1, indicate that only Sites #1, #2 and #3 meet all the ITE criteria for multi-use development sites. For the purpose of this study, therefore, only these three sites are selected as appropriate sites. Note: The original proposal for this project called for four sites to be investigated. Selection of only three sites is a deviation from the original scope of work and is a noted limitation for this study due to lack of number of qualified sites. Following paragraphs highlight some of the main characteristics of these sites with additional detail information included in Appendix A Site #1 Mission Farms A mixed-use development located at the intersection of Mission Road and Indian Creek Parkway in Leawood, Kansas. The master plan for this development shows two independent areas Mission Farms located on the east side of Mission Road at Indian Creek Parkway (partially developed and occupied), and Mission Farms West located on the west side of Mission Road between 105 th Street and Indian Creek Parkway (currently under construction). This study focuses on Mission Farms site that is partially built and occupied with the following site characteristics: Built portion consists of approximately 155,205 square feet of gross floor area. Approximately 75.5% of the built space is occupied and operational. Various land use components comprising the occupied space include residential, office, retail, restaurant and bank. 9
20 The site appears to be economically healthy. Access to the site is provided at two locations on Mission Road. An unrestricted primary access drive that lines up with Indian Creek Parkway to the west and a restricted (right-in/right-out) secondary access drive near the property line to the north. For more details, refer to Figure 2.1. Field observation indicates that current construction activity on Mission Farms West does not interfere with the traffic flow to/from the site under study Site #2 Park Place A mixed-use development located on the northeast corner of the intersection of 117 th Street and Nall Avenue in Leawood, Kansas. This site is also partially built and occupied with some construction activity on the northwestern portion of the site. This study focuses on the built and occupied portion of the site with the following characteristics: Built portion consists of approximately 329,452 square feet of gross floor area. Approximately 92.6% of the built space is occupied and operational. Various land use components comprising the occupied space include office, retail, restaurant and hotel with residential component being added as future phases. The site appears to be economically healthy. Access to the site is provided at five locations. Two unrestricted access drives one on 117 th Street providing direct access to one of the two garages and one on Town Center Drive. Three restricted access drives a right-in/right-out/left-in on 117 th Street functioning as the primary access drive to the site and two right-in/right-out access drives on Nall Avenue providing one of which provides direct access to the second garage. For more details, refer to Figure
21 Field observation indicates that current construction activity on the northwest portion of the site (future phase of the development) does not interfere with the traffic flow to/from the site under study Site #3 Metcalf95 Complex A mixed-use development located on the southwest corner of the intersection of 95 th Street and Metcalf Avenue in Overland Park, Kansas. Unlike the other two sites, this site is fully built but partially occupied with the following characteristics: The site (100% built) consists of approximately 161,129 square feet of gross floor area. Approximately 82.3% of the built space is occupied and operational. Various land use components comprising the occupied space include office, retail and restaurant with no residential component. The site appears to be economically healthy. Access to the site is provided at several locations all of which are indirect access drives shared with adjoining properties. As illustrated in Figure 2.3, the points of access onto the adjacent street network include two unrestricted access drives on Riely Road (to the west), two restricted (right-in/right-out) access drives on 95 th Street (to the north), another restricted (right-in/right-out) access drive on Metcalf Avenue (to the east), and two unrestricted access drives on 97 th Street. Filed observation indicates that although all driveways to this site are shared with adjoining properties, it is practically possible (at the time trip count surveys are being conducted) to distinguish between trips generated by this site and those by the adjoining businesses. Table 2.2 provides a summary of the various land use composition for each of the subject sites. The data shows that various land use components, among the three selected sites, fall under the following ranges (expressed as percent of total occupied gross floor area): 11
22 Residential Use: 0% 43% Office Use: 25% 67% Retail/Service Use: 31% 52% o Retail Stores: 8% 19% o Restaurants: 13% 15% o Others: 3% 29% 12
 I 435 Figure 2 1 Site #1: Mission")
23 Secondary Access Point (Right In/Right Out) Mission Rd. Mission Farms Mixed Use Development Primary Access Point (Full Access) I 435 Figure 2 1 Site #1: Mission Farms Mixed Use Development, Leawood, Kansas (June 2012)
 Access Point #5 (Full Access) 117 th St.")
24 Access Point #2 (Right In/Right Out) Nall Ave Access Point #1 (Full Access) Access Point #3 (Right In/Right Out) Park Place Mixed Use Development Access Point #4 (Right In/Right Out/Left In) Access Point #5 (Full Access) 117 th St. Figure 2 2 Site #2: Park Place Mixed Use Development, Leawood, Kansas (June 2012)
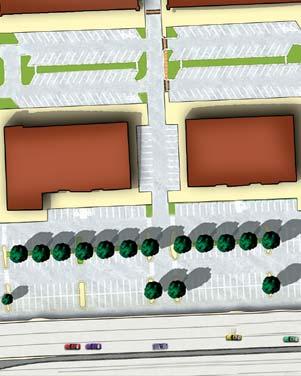
 Northwest Southwest Access Points (7 Full (Full Access Access) Drives) Metcalf Ave Figure 2 3 Site #3:")
25 Northwest Access Points (4 Full (Full Access Access) Drives) Northeast Access Point (Right In/Right Out) 95 th St. Metcalf95 Complex Mixed Use Development Southeast Access Point (Full Access) Northwest Southwest Access Points (7 Full (Full Access Access) Drives) Metcalf Ave Figure 2 3 Site #3: Metcalf95 Complex Mixed Use Development, Overland Park, Kansas (June 2012)
26 Table 2 1 Site Selection Criteria Checklist Item Characteristics of a Site #1 Site #2 Site #3 Site #4 Site #5 No. Multi Use Development Site Mission Farms Park Place Metcalf95 Parkway Plaza Hobbs Taylor Lofts (ITE Guidelines) Leawood, KS Leawood, KS Overland Park, KS Leawood, KS Lawrence, KS 1 Is the site a single real estate project? Residential Residential Residential Residential Does the site consist of two (2) or more Office Office Office Office 2 ITE land use classifications? Retail Retail Retail Retail Retail Restaurant Restaurant Restaurant Restaurant Bank Hotel 3 Is the site fully developed/built? Partial * Partial * Partial * Is the total square footage of the built 4 portion of the site between 100,000 and ~ 155,205 sf * ~ 329,452 sf * ~ 161,129 sf * ~ 70,000 sf * ~ 110,000 sf * 2,000,000 square feet? NO Does the built portion of the site have a ~ 117,180 sf ~ 305,110 sf ~ 132,531 sf 5 reasonably high occupancy rate? and/or 75.5% * 92.6% * 82.3% * < 50% * (NO) < 60% * (NO) appears to be economically healthy? NO NO 6 Is the site mature (over 2 years old)? NO Can the trips between various land use 7 componenets be made without using the off site roadway system? Does the site have its own independent 8 driveway(s), not shared with any adjacent NO property? 9 Is the presence of through traffic minimal? Are the site's internal and/or adjacent 10 streets free of any construction activity that would interfere with traffic flow? ** 11 Is the site away from CBD/downtown area? NO Site meets ITE Multi Use Development Criteria? NO NO * As of July 2012
27 Table 2 2 Various Land Use Composition * for Selected Mixed Use Development Sites Development Land Use Component Name Occupied Site and Space Residential Office Retail Restaurant Bank Hotel Location (sf) (sf) % of (sf) % of (sf) % of (sf) % of (sf) % of (sf) % of Total Total Total Total Total Total Mission Farms, 1 Leawood 117,180 49, % 30, % 17, % 15, % 3, % 0 0% Kansas Park Place, 2 Leawood 305, % 147, % 26, % 44, % 0 0% 86, % Kansas Metcalf95, 3 Overland Park 132, % 88, % 24, % 19, % 0 0% 0 0% Kansas * As of July 2012
28 Chapter 3: Trip Data Collection 3.1 Methodology To maintain consistency with ITE s nationally recognized database and procedure, efforts were made to follow (when practically possible and within project budget) the methodology prescribed by ITE during data collection phase of this study. Following paragraphs highlight a complete and exhaustive list of the ITE guidelines for use with general sites as well as multi-use development sites General Methodology for all Development Sites Survey Period Site-generated traffic should be counted, if possible, for a full 7-day period to determine when total site-generated trips peak during weekdays and the weekend. At the minimum, automatic traffic recorder counts should be taken throughout a full 24-hour period, although a preferred length of time would consist of 48 consecutive hours. Some sites require manual counting techniques because automatic traffic recorder devices will not capture all trips (or may not be accurate due to the configuration of the site driveways). Manual traffic counts should last for a minimum of 2 hours for each peak period, depending on whether the adjacent street traffic peak or the generator s peak is being surveyed. If the desired traffic analysis requires other periods, counts for those periods should also be obtained. The day of the week and time of the day are also important considerations in obtaining meaningful results. The purpose of the study will dictate the critical time period for analysis. In many cases the season of the year is also important. In general, traffic generation for land uses with little or no seasonal variation should be 18
29 counted on average days. For land uses with significant seasonal variation, time periods representing the 30 th to 50 th highest hours of the year may be used. Care should be taken to avoid making counts during special events, holidays, construction periods, bad weather, or other times when conditions at the study site or in its vicinity may affect site trip generation. The time period being surveyed should represent typical activity for the site (e.g. no data collection should be conducted during a super sale at a retail site) unless the study is specifically designed for collecting data during a peak time (e.g. holiday shopping season for retail sites) Independent Variable Data Compilation The data for the independent variable should be readily available, for the survey site. The number of trips generated at the site should be influenced in a logical way by the independent variable. Available site data should be accurate, for sites being counted and proposed future development (i.e. if it cannot be projected for new development, it is not an appropriate independent variable). Variables for similar sites should be provided directly and not merely estimated from a different variable. In general, it is recommended that data be collected and compiled for as many potential, appropriate independent variables as practical. The sample data collection forms presented here, contain a list of suggested data to obtain Development Data Requirements Trip generation estimates are based on development characteristics that are used as independent variables. This normally requires a check with the 19
30 owners or managers of the development to ensure the availability of accurate data on physical characteristics. o Number of dwelling units vs. occupied dwelling units o Number of square footage vs. occupied square footage o Leased vs. owned Description of the site o Square Footage and/or units o Percent Occupancy o Site Acreage o Location within area (central business district, suburban, rural) o Name and description of principal uses Site Plan Adjacent Street Traffic Volumes Traffic Counting Count directional traffic volumes (entering and exiting) by 15-minute period. Where directional counts cannot be made automatically, manual counts should be made during the street peak periods, plus the peak period of the generator to record the peak-hour entering and exiting volumes. Two or more days of peak period traffic counts are desirable. If possible, collect hourly traffic volume data (or obtain from the governing jurisdiction) on all streets adjacent to and with access to/or from the site so that adjacent street peak hours can be determined. The traffic volumes must be done concurrently. Surveys of traffic counts conducted on public streets may require a courtesy call to the proper governing authority. Providing a copy of the traffic volume data or the final study to either the public or private agency involved is another good policy. 20
31 Data concerning the site should be obtained through interviews with the site owner or manager and, if necessary, by means of measurements. Verify automatic counts with manual counts for short periods. If pneumatic road tube counters are used, exercise extra caution and verification because the accuracy of this equipment may degrade at low speed traffic conditions. If pass-by data are being collected, specific intercepts surveys will be needed. If needed, record hourly entering and exiting traffic by vehicle classification and vehicle occupancy and compare with corresponding automatic counts to determine a factor for adjusting the raw automatic counts. This may require classifying vehicles by number of axles if automatic counters have been used Data Collection at Multi-Use Developments As ITE wishes to increase the database on multi-use developments in order to provide internal capture data for a broader range of land uses, efforts were made to follow their guidelines (if practically possible) when collecting trip data for this study. The field data collection at the site should include an in-person, on-site interview and a cordon traffic count. Conducting internal traffic counts should also be considered at sites where internal streets exist and can be isolated and where internal streets carry most of the internal trips (both pedestrian and vehicular) Site Characteristics Compile the necessary information to describe the multi-use development and each of its individual land uses. Obtain information on the independent variables reported under each of the individual land uses in ITE Trip Generation Manual. 21
32 A map or sketch should also be prepared showing buildings, internal streets, access to the external street system and locations of the counts and interviews. If possible, the data collection program should obtain a description and assessment of the proximity/accessibility of the complementary uses within the site and a description and assessment of the proximity of competing markets outside the site Traffic Count (Cordon) Driveway volumes at all entrances/exits at the multi-use site should be counted for as long of a period as possible. If only 48 hours of data can be obtained, volumes should be counted during the mid-week (Tuesday through Thursday) to avoid daily variations that may occur on Monday and Friday. If the selected period for design of site access could be the weekend, traffic counts and surveys should likewise be conducted during the weekend. Ideally 7 consecutive days of data are recommended if budgets allow and if site driveways are configured to enable complete and accurate counts. With 7 days of data, daily variations can be computed and a weekday average and weekend average can be calculated. Driveway counts should be conducted during the same periods as interviews Traffic Count (Internal) For some multi-use developments, it will be possible to validate the survey results for overall internal trip-making with a comprehensive count of internal pedestrians and vehicles. In such cases, pedestrians and vehicles travelling among on-site land uses should be counted during the interview time periods. 22
33 Intercept Interviews Concurrent with gathering driveway volumes, interviews of workers, shoppers, visitors and residents of the site should be conducted. The objective of the intercept survey is to obtain information on trip purposes at the multi-use site, the origins and destinations of trips entering and exiting the site and the mode of each trip. Interviews of persons are typically conducted on site as they leave the site (or leave a single land use within the site). Each interview obtains information on the trips to and from the site and is administered on site. A minimum of 100 interviews per time period should be conducted at the multi-use development. For larger developments (i.e. with at least 300,000 square feet of office or retail space), a minimum of 200 interviews per time period should be completed. 3.2 Field Data Collection and Limitations In an effort to collect site data including trip data collected in the field, utmost care was taken to follow the above-mentioned guidelines as closely as possible - within practical means, budgetary limitations, certain site restrictions and other project constraints. One of the major limitations for collecting field data was imposed by the individual property management entities who did not allow for: Installation of any traffic counters at any of the driveway locations to the sites and/or any locations within the site; and Performing any intercept interviews of the site patrons. Given these constraints and budget limitations, the trip data collection effort conducted in the field was narrowed down to manual cordon counts (less intrusive means) at each site under study as follows: 23
34 During both morning and afternoon peak-hours (7:00 to 9:00 a.m. and 4:00 to 6:00 p.m.) of several typical weekdays in a typical month of the year. Each site was counted on Tuesday, Wednesday and Thursday in June 2012 (i.e. typical weekdays and typical month). Both inbound and outbound trips at each and every driveway to each site under study were recorded for each count period. Counts were conducted in 15-minute intervals. Peak-hour directional counts on adjacent street networks were also recorded at each site. For Site #3, where all driveways to the site are shared by adjoining properties, utmost care was exercised to distinguish between trips to/from the site under study and those of the adjoining properties. The results of these counts are shown in Appendix B and summarized in Tables 3.1, 3.2 and 3.3 for Site #1, #2 and #3, respectively. The values shown in these tables reflect the actual trips observed at each site during each count period with the three-day average values shown as well. In summary, on average Site #1 generates 91 trip-ends (70 inbound and 21 outbound) during the morning peak-hour and 271 trip-ends (168 inbound and 103 outbound) during the afternoon peak-hour of a typical weekday. For this site, the peak flows occur between 7:45 and 8:45 a.m. and 4:45 and 5:45 p.m. Site #2 generates 339 trip-ends (272 inbound and 67 outbound) during the morning peak-hour and 732 trip-ends (405 inbound and 327 outbound) during the afternoon peak-hour of a typical weekday. For this site, the peak flows occur between 7:30 and 8:30 a.m. and 5:00 and 6:00 p.m. Site #3 generates 279 trip-ends (202 inbound and 77 outbound) during the morning peak-hour and 449 trip-ends (237 inbound and 212 outbound) during the afternoon peak-hour of a typical weekday. For this site, the peak flow occurs between 8:00 and 9:00 a.m. and 5:00 and 6:00 p.m. 24
35 Table 3 1 Summary of Peak Hour Trips, Generated by "Mission Farms" Mixed Use Development, Leawood, KS (June 2012) Morning Peak Hour of Generator Afternoon Peak Hour of Generator Site Access Trips (One Hour Between 7:00 and 9:00 a.m.), (One Hour Between 4:00 and 6:00 p.m.), vph vph Count #1 Count #2 Count #3 Average Count #1 Count #2 Count #3 Average Primary Access Inbound Point Outbound (Full Access) Driveway Total (2 Way) Secondary Access Inbound Point Outbound (Right In/Right Out) Driveway Total (2 Way) Combined Access Points Site Total (2 Way)
36 Table 3 2 Summary of Peak Hour Trips, Generated by "Park Place" Mixed Use Development, Leawood, KS (June 2012) Morning Peak Hour of Generator Afternoon Peak Hour of Generator Site Access Trips (One Hour Between 7:00 and 9:00 a.m.), (One Hour Between 4:00 and 6:00 p.m.), vph vph Count #1 Count #2 Count #3 Average Count #1 Count #2 Count #3 Average Access Point Inbound #1 Outbound (Full Access) Driveway Total (2 Way) Access Point Inbound #2 Outbound (Right In/Right Out) Driveway Total (2 Way) Access Point Inbound #3 Outbound (Right In/Right Out) Driveway Total (2 Way) Access Point Inbound #4 Outbound (Right In/Right Out/Left In) Driveway Total (2 Way) Access Point Inbound #5 Outbound (Full Access) Driveway Total (2 Way) Combined Access Points Site Total (2 Way)
37 Table 3 3 Summary of Peak Hour Trips, Generated by "Metcalf95" Mixed Use Development, Overland Park, KS (June 2012) Morning Peak Hour of Generator Afternoon Peak Hour of Generator Site Access Trips (One Hour Between 8:00 and 9:00 a.m.), (One Hour Between 5:00 and 6:00 p.m.), vph vph Count #1 Count #2 Count #3 Average Count #1 Count #2 Count #3 Average Northwest Inbound Access points (4 Drives) Outbound (Full Access) Driveway Total (2 Way) Southwest Inbound Access Points (7 Drives) Outbound (Full Access) Driveway Total (2 Way) Southeast Inbound Access Point Outbound (Full Access) Driveway Total (2 Way) Northeast Inbound Access Point Outbound 10 3 (Right In/Right Out) Driveway Total (2 Way) Combined Access Points Site Total (2 Way) NOTE: Blacked out cells denote closure of the access drive due to repair work. During this time period, vehicles access the site via other drives.
38 Chapter 4: ITE Trip Generation Estimation 4.1 Analysis For comparison purposes, the average vehicular trips generated by each of the subject sites were also estimated (as compared to the actual observed trips) using the trip generation rates suggested by the ITE Trip Generation Manual, 8 th Edition. In doing so, appropriate ITE Land Use Codes best representing the individual components of each site with their respective independent variables were selected and both, Average Rate Method and Regression Equation Method were evaluated. The results of this analysis are shown in Appendix C and highlighted in the following paragraphs Site #1 Mission Farms As mentioned earlier, the built portion of this site is comprises of 155,205 square feet of gross floor area with approximately 75.5% of the space (117,180 sf) occupied and operational. The occupied area consists of: 42 dwelling units of Condominiums (ITE Land Use Code 230 with Number of Dwelling Units as Independent Variable); 30,231 square feet of General Office (ITE Land Use Code 710 with Gross Floor Area as Independent Variable); 17,983 square feet of various retail shops (ITE Land Use Code 814 with Gross Leasable Area as Independent Variable); A bank with 2 drive-thru lanes (ITE Land Use Code 912 with Number of Drive Thru Lanes as Independent Variable; and Four restaurants that collectively occupy approximately 15,518 square feet of space. One of these restaurants is open all day for breakfast, lunch and dinner with relatively high-turnover (ITE Land Code 932 with Gross Floor Area as Independent Variable), and the others are only open for lunch and dinner with less of a turnover (ITE Land Use Code 931 with Gross Floor Area as Independent Variable). 28
39 Table 4.1 provides a summary of the calculated trips generated by Site #1 using the rates suggested by the ITE Trip Generation Manual, 8 th Edition. The results indicate that this site will likely generate the following number of trips: On average, 128 trip-ends (79 inbound and 49 outbound) during the morning peak-hour of a typical weekday; On average, 297 trip-ends (153 inbound and 144 outbound) during the afternoon peak hour of a typical weekday; and On average, 3,154 trip-ends (two-way volumes) during 24-hour period of a typical weekday Site #2 Park Place As mentioned earlier, the built portion of this site is comprises of 329,452 square feet of gross floor area with approximately 92.6% of the space (305,110 sf) occupied and operational. The occupied area consists of: A Hotel with 156 rooms (ITE Land Use Code 310 with Number of Rooms as Independent Variable); A Health/Fitness Center with an area of approximately 2,722 square feet (ITE Land Use Code 492 with Gross Floor Area as Independent Variable); 147,590 square feet of variety of office spaces (ITE Land Use Code 710 with Gross Floor Area as Independent Variable); 26,525 square feet of various retail shops (ITE Land Use Code 814 with Gross Leasable Area as Independent Variable); and A number of restaurants that collectively occupy approximately 44,264 square feet of space. A couple of these restaurants are open all day for breakfast, lunch and dinner with relatively high-turnover (ITE Land Code 932 with Gross Floor Area as Independent Variable) and the others are only open for lunch and dinner with less of a turnover (ITE Land Use Code 931 with Gross Floor Area as Independent Variable). 29
40 Table 4.2 provides a summary of the calculated trips generated by Site #2 using the rates suggested by the ITE Trip Generation Manual, 8 th Edition. The results indicate that this site will likely generate the following number of trips: On average, 450 trip-ends (310 inbound and 140 outbound) during the morning peak-hour of a typical weekday; On average, 747 trip-ends (354 inbound and 393 outbound) during the afternoon peak hour of a typical weekday; and On average, 8,376 trip-ends (two-way volumes) during 24-hour period of a typical weekday Site #3 Metcalf95 Complex As mentioned earlier, this site is fully built and comprises 161,129 square feet of gross floor area with approximately 82.3% of the space (132,531 sf) occupied and operational. The occupied area consists of: 88,175 square feet of variety of office space (ITE Land Use Code 710 with Gross Floor Area as Independent Variable); 24,470 square feet of various retail shops (ITE Land Use Code 814 with Gross Leasable Area as Independent Area); and Four (4) restaurants that collectively occupy approximately 19,886 square feet of space. One of these restaurants is open for breakfast and lunch with relatively high-turnover (ITE Land Use Code 932 with Gross Floor Area as Independent Variable), another one is only open for lunch but provides catering services as well, and the other two are only open for lunch and dinner with less of a turnover (ITE Land Use Code 931 with Gross Floor Area as Independent Variable). Table 4.3 provides a summary of the calculated trips generated by Site #3 using the rates suggested by the ITE Trip Generation Manual, 8 th Edition. The results indicate that this site will likely generate the following number of trips: 30
41 On average, 397 trip-ends (268 inbound and 129 outbound) during the morning peak-hour of a typical weekday; On average, 465 trip-ends (190 inbound and 275 outbound) during the afternoon peak hour of a typical weekday; and On average, 4,824 trip-ends (two-way volumes) during 24-hour period of a typical weekday. 31
42 Table 4-1 Summary of Trip Generation Calculation (Total Driveway Volumes) Using ITE Trip Generation Manual, 8th Edition Occupied Portion of the Existing "Mission Farms" Mixed-Use Develepment, Leawood, KS (June 2012) Method Typical Weekday of Land Use (ITE CODE) Size 24-hr, Two-Way AM Peak-Hour (vph) PM Peak-Hour (vph) Trip Estimation Indep. Var. Volume (vpd) Enter Exit Total Enter Exit Total Residential Component: Condominium (230) 42 Units Office Component: General Office Use (710) 30,231 GFA (sf) Weighted Average Rate Method Retail/Service Component: Specialty Retail Center (814) 17,983 GLA (sf) Bank (912) 2 Drive Thru Lanes Restaurants (931 & 932) 15,518 GFA (sf) 1, Entire Development 3, NOTES: 1) The trip generation numbers in this table are calculated using the rates suggested in the "ITE Trip Generation Manual", 8th Edition. 2) The number of trips are determined by both Weighted Average Rate Method and the Regression Equation Method and the method that generates trips with statistical significance is selected for analysis. 3) GFA denotes Gross Floor Area in square feet. 4) GLA denotes Gross Leasable Area in square feet. 5) Blank cells indicate no data available.
43 Table 4-2 Summary of Trip Generation Calculation (Total Driveway Volumes) Using ITE Trip Generation Manual, 8th Edition Occupied Portion of the Existing "Park Place" Mixed-Use Develepment, Leawood, KS (June 2012) Method Typical Weekday of Land Use (ITE CODE) Size 24-hr, Two-Way AM Peak-Hour (vph) PM Peak-Hour (vph) Trip Estimation Indep. Var. Volume (vpd) Enter Exit Total Enter Exit Total Lodging Component: Hotel (310) 156 rooms 1, Recreation Component: Health/Fitness Center (492) 2,722 GFA (sf) Office Component: General Office Use (710) 147,590 GFA (sf) 1, Weighted Average Rate Method Retail/Service Component: Specialty Retail Center (814) 26,525 GLA (sf) 1, Restaurants (931 & 932) 44,264 GFA (sf) 4, Entire Development 8, NOTES: 1) The trip generation numbers in this table are calculated using the rates suggested in the "ITE Trip Generation Manual", 8th Edition. 2) The number of trips are determined by both Weighted Average Rate Method and the Regression Equation Method and the method that generates trips with statistical significance is selected for analysis. 3) GFA denotes Gross Floor Area in square feet. 4) GLA denotes Gross Leasable Area in square feet. 5) Blank cells indicate no data available.
44 Table 4-3 Summary of Trip Generation Calculation (Total Driveway Volumes) Using ITE Trip Generation Manual, 8th Edition Occupied Portion of the Existing "Metcalf95 Complex" Mixed-Use Develepment, Overland Park, KS (July 2012) Method Typical Weekday of Land Use (ITE CODE) Size 24-hr, Two-Way AM Peak-Hour (vph) PM Peak-Hour (vph) Trip Estimation Indep. Var. Volume (vpd) Enter Exit Total Enter Exit Total Office Component: General Office Use (710) 88,175 GFA (sf) 1, Weighted Average Rate Method Retail/Service Component: Specialty Retail Center (814) 24,470 GLA (sf) 1, Restaurants (932) 19,886 GFA (sf) 2, Entire Development 4, NOTES: 1) The trip generation numbers in this table are calculated using the rates suggested in the "ITE Trip Generation Manual", 8th Edition. 2) The number of trips are determined by both Weighted Average Rate Method and the Regression Equation Method and the method that generates trips with statistical significance is selected for analysis. 3) GFA denotes Gross Floor Area in square feet. 4) GLA denotes Gross Leasable Area in square feet. 5) Blank cells indicate no data available.
45 Chapter 5: Trip Generation Rate Model Formulation 5.1 Analysis As mentioned in the previous Chapters, the occupied portion of the three sites selected for this study range between approximately 117,000 to 305,000 square feet of Gross Floor Area with an average value of approximately 185,000 square feet. Using the information presented in Tables 3.1, 3.2 and 3.3, which represent the actual (observed) morning and afternoon peak-hour trip numbers for Site #1, #2 and #3, respectively, in conjunction with the occupied areas for each site and their overall average, trip rates for these mixed-use development sites were calculated. The results, as summarized at the bottom of Figures 5.1 and 5.2 (labeled as Data Points ), indicate that during the morning peak-hour of a typical weekday and the afternoon peak-hour of a typical weekday Morning Peak-Hour of a Typical Weekday Site #1 generates 0.78 trip-ends/hr/1,000 GFA with directional distribution of 77% 23% (inbound outbound); Site #2 generates 1.11 trip-ends/hr/1,000 GFA with directional distribution of 80% 20% (inbound outbound); and Site #3 generates 2.11 trip-ends/hr/1,000 GFA with directional distribution of 72% 28% (inbound outbound) Afternoon Peak-Hour of a Typical Weekday Site #1 generates 2.31 trip-ends/hr/1,000 GFA with directional distribution of 62% 38% (inbound outbound); Site #2 generates 2.40 trip-ends/hr/1,000 GFA with directional distribution of 55% 45% (inbound outbound); and Site #3 generates 3.39 trip-ends/hr/1,000 GFA with directional distribution of 53% 47% (inbound outbound). 35
46 Based on the data points presented in this study (three selected sites), the data can further be reduced to calculate weighted average trip rate for a mixed-use development site with similar characteristics as the ones selected for this study. The results indicate: An average rate of 1.28 trip-ends/hr/1,000 GFA with directional distribution of 76% 24% (inbound outbound) during the morning peakhour of a typical weekday; and An average rate of 2.62 trip-ends/hr/1,000 GFA with directional distribution of 57% 43% (inbound outbound) during the afternoon peakhour of a typical weekday. 5.2 Model Formulation The results of the analysis show that the aforementioned average values, as depicted in Figures 5.1 and 5.2 (labeled as Data Plot ), represent straight line Models to estimate average trip numbers generated by a mixed-use development site during the morning and afternoon peakhours of a typical weekday Trip Generation Rate Model for Morning Peak-Hour (Equation 5.1) (Equation 5.1a) (Equation 5.1b) Trip Generation Rate Model for Afternoon Peak-Hour (Equation 5.2) (Equation 5.2a) (Equation 5.2b) Where: 36
47 5.2.3 Model Variables Type of Development: Mixed-Use (Multi-Use) Number of Sites (Data Points): 3 Independent Variable Gross Floor Area Range of Size 150,000 sf 350,000 sf Range of Various Land Use Compositions Residential Use 0% 43% Office Use 25% 67% Retail/Service Use 31% 52% 37
48 Mixed Use Development Site Average Vehicle Trip Ends vs: On a: 1000 Sq. Feet Gross Floor Area (GFA) Weekday Peak Hour of Adjacent Street Traffic One Hour Between 7 and 9 a.m. Number of Studies: 3 Average 1000 Sq. Feet of Occupied GFA: 185 Directional Distribution: 76% entering, 24% exiting Trip Generation per 1000 Sq. Feet of Occupied Gross Floor Area (GFA) Weighted Average Rate Range of Rates Standard Deviation Data Plot 500 Caution Use Carefully Small Sample Size 450 T = Average Vehicle Trip Ends Actual Data Point Weighted Ave. Rate X = 1000 Sq. Ft. Gross Floor Area Data Points Site Total Occupied No. GFA (1000 sf), Average Vehicle Trip Ends (vph), T Inbound Trips (% of total) Outbound Trips (% of total) Average Trip Rate (vph/1000 GFA) X % 23% % 20% % 28% 2.11 All % 24% 1.28 Figure 5 1 Trip Generation Rate Model for Multi Use Development Site (Morning Peak Hour of a Typical Weekday)
49 Mixed Use Development Site Average Vehicle Trip Ends vs: On a: 1000 Sq. Feet Gross Floor Area (GFA) Weekday Peak Hour of Adjacent Street Traffic One Hour Between 4 and 6 p.m. Number of Studies: 3 Average 1000 Sq. Feet of Occupied GFA: 185 Directional Distribution: 57% entering, 43% exiting Trip Generation per 1000 Sq. Feet of Occupied Gross Floor Area (GFA) Weighted Average Rate Range of Rates Standard Deviation Data Plot 1000 Caution Use Carefully Small Sample Size T = Average Vehicle Trip Ends Actual Data Point Weighted Ave. Rate X = 1000 Sq. Ft. Gross Floor Area Data Points Site Total Occupied No. GFA (1000 sf), Average Vehicle Trip Ends (vph), T Inbound Trips (% of total) Outbound Trips (% of total) Average Trip Rate (vph/1000 GFA) X % 38% % 45% % 47% 3.39 All % 43% 2.62 Figure 5 2 Trip Generation Rate Model for Multi Use Development Site (Afternoon Peak Hour of a Typical Weekday)
50 5.3 Actual (Observed) Trips versus Estimated Trips (ITE Rates) For comparison purposes, the results of the trip generation analysis using the rates suggested by the ITE Trip Generation Manual, 8 th Edition were measured against the actual trips that were observed in the field. The results, as summarized in Table 5.1, indicate that during both morning and afternoon peak-hours, using the ITE rates results in an overestimation of the trips for each of the subject sites as follows: During the morning peak-hour, the overestimation is, significantly, high in the range of 32.7% to 42.3% with an average value of 37.5%; and During the afternoon peak-hour, however, the overestimation is much less in the range of 2.0% and 9.6% with an average value of 3.9%. These overestimations can be interpreted in several ways and may be the result of one or combination of the following factors: Internal trips between various land use components of the multi-use development sites, resulting in a reduction in the trips on the offsite Streets. As mentioned earlier, ITE rates apply to individual stand-alone land-uses and do not account for internal trip capture, hence overestimating the actual trips for multi-use developments. Normal variation of data presented in the ITE Trip Generation Manual can also result in either under- and/or overestimation of the trips for some or all land-use types. Selection of the most appropriate ITE Land-Use Code to represent various components of the multi-use developments. Other factors such as seasonal variation of traffic, possible offsite events, and potential for error in data collection procedure. 5.4 Findings 1. Although utmost care was taken (for this study) to select the most appropriate multiuse development sites, collect necessary information on the independent variables, and collect field data on trips, caution should be exercised in using the models presented in Equations 5.1, 40
51 5.1a, 5.1b and 5.2, 5.2a, 5.2b. This is mainly because of the small sample size (three sites) and large variation in the land-use composition of each site. More multi-use development sites need to be studied for the results to be conclusive. For instance, as a follow up to this project, future study can be carried out at the same sites when they are fully developed and occupied. 2. With respect to the internal capture rate for multi-use development sites, this study provides very limited information that is not conclusive. This is mainly because an on-site intercept interview was not conducted due to restrictions imposed by the property management entities for all three sites. One could, however, argue that percent overestimation of trip numbers by ITE rates (as mentioned in the previous paragraphs and summarized in Table 5.1) may cautiously be considered as a tool to estimate the internal trips captured between various land-use components of the multi-use site. If this were to be the case, only the numbers for the afternoon peak-hour should be used because they seem to be more realistic as compared to those for the morning peak-hour. For instance, the baseline trips can first be calculated using the ITE rates for individual land use components of the multi-use development site. The sum of all these trips can then be reduced using the discount rates listed in Table 5.1 ranging between 2.0% and 10% in order to estimate the actual trips generated by the subject site during the afternoon peak-hour. 41
52 Table 5 1 Comparison of the Actual Site Generated Trips (Observed) to the Estimated Values Using ITE Rates Development Average Vehicular Trip Ends (2 way Driveway Volumes) Name Occupied During Peak Hour of Adjacent Street Traffic Site and Space One Hour between 7 and 8 a.m. One Hour between 4 and 6 p.m. Location (sf) Actual * ITE Estimate ** ITE Over Estimation *** Actual * ITE Estimate ** ITE Over Estimation *** (vph) (vph) (%) (vph) (vph) (%) Mission Farms, 1 Leawood 117, % % Kansas Park Place, 2 Leawood 305, % % Kansas Metcalf95, 3 Overland Park 132, % % Kansas All 554, % 1,452 1, % NOTES: * Average over three separate field observations one on each typical weekday (i.e. Tuesday, Wednesday and Thursday) in June ** Based on trip rates suggested in the ITE Trip Generation Manual, 8th Edition for individual land use components of the site. *** This over estimation may have been resulted due to one or combination of factors below: 1 Internal trips between various components of the multi use development, resulting in a reduction in the trips on the offsite Streets. 2 Normal variation of data presented in the ITE Trip Generation Manual. 3 Selection of the most appropriate ITE land use code to represent various components of the multi use development.
53 References 1. Brian S. Bochner and Benjamin R. Sperry. Internal Trip Capture Estimator for Mixed-Use Development, Texas Transportation Institute (TTI). Sponsored by The Texas Department of Transportation (TxDOT) and the Federal Highway Administration (FHWA), December 2007 (Published February 2010). 2. G.L. Chang, C.H. Chen and E.C. Carter. A Trip Rate Interaction Model for Mixed Land Use Developments, College Park, MD: University of Maryland Department of Civil Engineering, and Maryland State Highway Administration, November Matthew Ciarkowski, Brian Bochner and H. Gene Hawkins. Analysis of Trip Generation Estimates for Mixed-Use Developments, Texas Transportation Institute. Sponsored by the Texas Department of Transportation and the Federal Highway Administration, August Trip Generation for Mixed-Use Developments, Technical Committee Report. Colorado- Wyoming Section: ITE, January Internalizing Travel by Mixing Land Uses, Study of Master-Planned Communities in South Florida. Reid Ewing, Eric Dumbaugh, and Mike Brown, Transportation Research Record Mark Feldman, Reid Ewing, and Jerry Walters. Evidence on Mixed-Use Trip Generation Local Validation of the National Survey. 7. Kevin G. Hooper and JHK & Associates. Travel Characteristics at Large-Scale Suburban Activity Center, National Cooperative Highway Research Program Report 323. Washington, DC: Transportation Research Board, National Academy of Sciences, The Brandermill PUD Traffic Generation Study, Technical Report. Alexandria, VA: JHK & Associates, June Trip Generation, 8th Edition: An ITE Informational Report. Institute of Transportation Engineers, December Trip Generation Handbook, 2nd Edition: An ITE Recommended Practice. Institute of Transportation Engineers, June Benjamin R. Sperry. Comparing Methodologies to Estimate Internal Trip Capture at Mixed- Use Developments, Texas Transportation Institute. 43
54 12. FDOT Trip Characteristics Study of Multi-Use Developments. Tindale-Oliver and Associates, for FDOT District IV, December Trip Generation at Special Sites, VHTRC 84-R23. Charlottesville, VA: Virginia Transportation Research Council, January Districtwide Trip Generation Study. Walter H. Keller Inc., for the Florida Department of Transportation, District IV, March The Trip Characteristics of New Self Sustaining Communities. 44
55 APPENDIX A SUMMARY OF LAND-USE AND SIZE CHARACTERISTICS FOR INDIVIDUAL SITES SELECTED FOR ANALYSIS
56 Tenant Subdivision Address MIXED USE DEVELOPMENTS IN LEAWOOD KANSAS Occupancy Group Certificate of occupancy ; Date of issue. American Energy Mission Farms Mission Rd. Leawood KS /10/2009 Building a Unit 303 Mission Farms Mission Rd. 303 Leawood KS /16/2009 Building a Unit 305 Mission Farms Mission Rd. 305 Leawood KS /19/2009 Building a Unit 306 Mission Farms Mission Rd. 306 Leawood KS /27/2009 Building a Unit 307 Mission Farms Mission Rd. 307 Leawood KS /16/2009 Building a Unit 308 Mission Farms Mission Rd. 308 Leawood KS /25/2009 Building a Unit 309 Mission Farms Mission Rd. 309 Leawood KS /18/2009 Building a Unit 311 Mission Farms Mission Rd. 311 Leawood KS /27/2009 Building a Unit 312 Mission Farms Mission Rd. 312 Leawood KS /18/2009 Building a Unit 314 Mission Farms Mission Rd. 314 Leawood KS /27/2009 Building a Unit 316 Mission Farms Mission Rd. 316 Leawood KS /9/2009 Building b Unit 201 Mission Farms Mission Rd. 201 Leawood KS /25/2009 Building b Unit 202 Mission Farms Mission Rd. 202 Leawood KS /1/2009 Building b Unit 203 Mission Farms Mission Rd. 203 Leawood KS /27/2009 Building b Unit 204 Mission Farms Mission Rd. 204 Leawood KS /30/2009 Building b Unit 205 Mission Farms Mission Rd. 205 Leawood KS /6/2009 Building b Unit 206 Mission Farms Mission Rd. 206 Leawood KS /30/2009 Building b Unit 207 Mission Farms Mission Rd. 207 Leawood KS /27/2009 Building b Unit 208 Mission Farms Mission Rd. 208 Leawood KS /26/2009 Building b Unit 209 Mission Farms Mission Rd. 209 Leawood KS /26/2009 Building b Unit 210 Mission Farms Mission Rd. 210 Leawood KS /27/2009 Building b Unit 211 Mission Farms Mission Rd. 211 Leawood KS /9/2009 Building b Unit 212 Mission Farms Mission Rd. 212 Leawood KS /27/2009 Building b Unit 214 Mission Farms Mission Rd. 214 Leawood KS /27/2009 Building b Unit 215 Mission Farms Mission Rd. 215 Leawood KS /24/2009 Building b Unit 216 Mission Farms Mission Rd. 216 Leawood KS /1/2009 Computer Sciences co Mission Farms Mission Rd. Leawood KS /10/2009
57 Exclusive md Mission Farms Mission Rd. Leawood KS B 9/24/2009 Ferrel Capital Mission Farms Mission Rd. Leawood KS B 4/15/2011 Kansas Venture Capital Mission Farms Mission Rd. Leawood KS B 2/2/2011 Oppenheimer Mission Farms Mission Rd. Leawood KS B 7/15/2009 Sampson dental Mission Farms Mission Rd. Leawood KS B 4/15/2011 Shell Mission Farms Mission Rd. Leawood KS B 6/18/2008 Solutions Bank Mission Farms Mission Rd. Leawood KS B 6/16/2008 Unit 301 Mission Farms Mission Rd. 301 Leawood KS /23/2009 Unit 302 Mission Farms Mission Rd. 302 Leawood KS /23/2009 Unit 303 Mission Farms Mission Rd. 303 Leawood KS /23/2009 Unit 304 Mission Farms Mission Rd. 304 Leawood KS /23/2009 Unit 305 Mission Farms Mission Rd. 305 Leawood KS /23/2009 Unit 306 Mission Farms Mission Rd. 306 Leawood KS /23/2009 Unit 307 Mission Farms Mission Rd. 307 Leawood KS /23/2009 Unit 308 Mission Farms Mission Rd. 308 Leawood KS /23/2009 Unit 309 Mission Farms Mission Rd. 309 Leawood KS /23/2009 Unit 310 Mission Farms Mission Rd. 310 Leawood KS /23/2009 Unit 311 Mission Farms Mission Rd. 311 Leawood KS /23/2009 Unit 312 Mission Farms Mission Rd. 312 Leawood KS /23/2009 Unit 314 Mission Farms Mission Rd. 314 Leawood KS /11/2009 Unit 315 Mission Farms Mission Rd. 315 Leawood KS /15/2009 Unit 316 Mission Farms Mission Rd. 316 Leawood KS /112009
58 Tenant Subdivision Address Occupancy Group Certificate of occupancy ; Date of issue. American heritage holdings Park Place Ash st. Leawood KS B 8/20/2008 Bella b's & bella bambino Park Place Ash st. Leawood KS M 8/9/2010 Building a shell Park Place Ash st. Leawood KS A 3GEN 2/2/2011 Building g shell Park Place 5201 W 115th Pl. Leawood KS M 12/13/2010 Cafe roux Park Place Ash st. Fish City Grill, Leawood KS A 2 5/10/2010 Carmens cafe Park Place Ash st. Leawood KS A 2 7/20/2010 Craig Allen's Park Place Ash st.craig Allen's, Leawood KS B 9/21/2009 Cupcake al a mode Park Place Ash st. Leawood KS B 3/12/2010 Envy boutique Park Place Ash st. Leawood KS M 6/16/2008 Ericcson conference room Park Place Ash st. Leawood KS /2/2011 Ericsson telecom Park Place Ash st. STE 200 Leawood KS B 8/1/2008 Flowers by emily Park Place Ash st. Leawood KS M 3/12/2010 Fountain capital management Park Place Ash st. Leawood KS B 8/15/2008 Go bug Park Place Ash st. Leawood KS M 10/10/2008 Hathaway shoe Park Place Ash st. Leawood KS M 3/12/2010 IBM Park Place Ash st. STE 200 Leawood KS /18/2009 Ingredient Park Place Ash st. Leawood KS A 2 6/13/2008 Kc surroundings Park Place Ash st. Leawood KS /31/2008 Lululemons Park Place Ash st. 235 Leawood KS B 8/10/2010 Michael shae salon #A 09 Park Place Ash st. Leawood KS M 7/20/2010 Northwest aloft hotel Park Place Ash st. Leawood KS /11/2009 Overland consulting Park Place Ash st. Leawood KS B 3/19/2009 Paciugo gelato shop Park Place 5260 W 116th Pl Paciugo Leawood KS A 1 10/6/2008 Park place developers office Park Place Ash st. Leawood KS /31/2008 Picasso exotic aquatics Park Place Ash st. Leawood KS M 1/25/2011 Ra sushi bar Park Place Ash st. Ra sushi Leawood KS /6/2011 Rice gallery Park Place Ash st. Leawood KS M 10/10/2008
59 Rps financial Park Place 5251 W 116th Pl. Leawood KS B 2/4/2011 Specialty fertilizer products remodel Park Place Ash st. STE 200 Leawood KS B 2/9/2011 Specialty fertilizer products Park Place Ash st. STE 200 Leawood KS /20/2008 The learning tree Park Place Ash st. Leawood KS M 6/27/2008 Tortoise capital Park Place Ash st. STE 200 Leawood KS B 7/11/2008 Zte usa Park Place Ash st. Leawood KS B 1/29/2010 Building 6 shell Parkway Plaza 4861 W 134th st., Leawood KS B 6/18/2008 building 7 shell Parkway Plaza 4851 W 134th st., Leawood KS B 6/18/2008 Emergent care plus Parkway Plaza 4800 W 135th st., Leawood KS B 12/15/2009 Emily hart bridal Parkway Plaza 4800 W 135th st., Leawood KS M 7/21/2010 Eva reynolds fine arts Parkway Plaza 4851 W 134th st., Leawood KS /20/2008 Gaslight grille offices Parkway Plaza Briar st. Leawood KS B 2/2/2011 Gentry dental Parkway Plaza 4861 W 134th st., Leawood KS B 2/10/2009 Green earth cleaners shell Parkway Plaza Roe Ave., Leawood KS B 10/17/2008 Integrite salon Parkway Plaza 4800 W 135th st., Leawood KS B 10/30/2008 Mandarinism Parkway Plaza 4800 W 135th st 170., Leawood KS A 2 7/1/2008 Massage heights Parkway Plaza 4800 W 135th st., Leawood KS /20/2008 Parkway plaza building 9 shell Parkway Plaza Roe Ave., Leawood KS /27/2009 Parkway plaza condo's building 4 Parkway Plaza 4901 W 133 rd st., Leawood KS R 2 12/11/2009 Pizza fusion Parkway Plaza 4800 W 135th st., Leawood KS /20/2009 Runway's clothing store Parkway Plaza 4800 W 135th st., Leawood KS M? Sazzy's Parkway Plaza 4800 W 135th st., Leawood KS M 12/1/2010 Sumo hibachi Parkway Plaza 4800 W 135th st., Leawood KS A 2 6/30/2009 Thompson orthodontics Parkway Plaza 4851 W 134th st., Leawood KS B 6/24/2008 Tide green cleaners tenant finish Parkway Plaza Roe Ave., Leawood KS M 10/17/2008 white box suite b Parkway Plaza 4861 W 134th st., Leawood KS B 6/25/2009
60 SITE #1: MISSION FARMS
61 MASTER PLAN MISSION ROAD (EAST) Built Use Floor Area(sf) Units/stories Building A Existing Retail/Residential 3 stories Building B Existing Retail/Residential 3 stories Building F Existing Retail/Office stories Building E Future Retail/Office Building D Future Office stories Building C Future Retail/Office Townhome Villas Future Residential 20 units MISSION ROAD (WEST) Built Use Floor Area(sf) Units/stories Building 1 Future Retail 8572 Building 6 Future Retail 8000 Building 10 Future Retail 8572 Building 12 Future Office Building 2 Future Retail(Restaurant) Building 3 Future Retail Building 4 Future Retail Building 5 Future Office OR hotel stories The Village at Mission Farms Future Residential 212 units Building 13 (Townhomes) Future Residential 4 units? Building 14 (Townhomes) Future Residential 6 units? Building 15 (Townhomes) Future Residential 4 units?
62 Building A 1st Floor Occupied Space Percent of Floor area (sf) occupiable floor area Occupant type Biz Category Noel's Fine gifts & interiors % Commercial Retail/Interior deco goods Natasha's Mulberry & Mott % Commercial Retail/Restaurant Blue Koi % Commercial Retail/Restaurant Blanc Burgers & Bottles % Commercial Retail/Restaurant Condominium Rental Office % Commercial Office Xiphium % Commercial Retail/Salon Julia Shapiro Photography & Art % Commercial Retail/Photo&Art Sassy Chic % Commercial Retail/Boutique Un Occupied Space % 2nd Floor + 3rd Floor(Dwellings) 32 Occupied Space Dwelling Units Condominiums 23 Residential Un Occupied Space %
63 Building B 1st Floor Occupied Space Percent of Floor area (sf) occupiable floor area Occupant type Biz Category Artichokes % Commercial Retail/Art activities Room % Commercial Retail/Restaurant Van Brocks % Commercial Retail/Jewelry Un Occupied Space % 2nd Floor + 3rd Floor(Dwellings) 30 Occupied Space Dwelling Units Condominiums 19 Residential Un Occupied Space %
64 Building F 1st Floor (total area(sf)) Occupied Space Percent of Floor area (sf) occupiable floor area Occupant type Biz Category Vico's Fine Jewelry % Commercial Retail/Jewelry Elite Cycling % Commercial Retail/Cycling goods Avenues Bistro % Commercial Retail/Restaurant Boutique Chic % Commercial Retail/Boutique Arvest Bank % Commercial Retail/Banking Un Occupied Space % 2nd Floor(total area(sf)) Occupied Space American Energy % Commercial Office Computer Sciences Corporation (CSC) % Commercial Office Kansas Venture Capital(KCVI) % Commercial Office Sampson Dental % Commercial Office Un Occupied Space % 3rd Floor Occupied Space Oppenheimer % Commercial Office Ferrel Capital % Commercial Office Un Occupied Space %


65


66


67 LIVE WORK and play
 1,318 RSF Retail (Space 5) 1,424 RSF Restaurant (Space 6) 3,448")
68 Retail (Space 1) 1,743 RSF Retail (Space 2) 1,014 RSF Retail (Space 3) 1,080 RSF Retail (Space 4) 1,318 RSF Retail (Space 5) 1,424 RSF Restaurant (Space 6) 3,448 RSF


69 105th Street Existing Existing Existing Mission Road 105th Street Indian Creek Parkway


70 1,200 RSF 1,900 RSF 1,900 RSF 3,000 RSF


71


72 103rd Street Roe Avenue Office Site Townhome Site New Indian Creek Parkway Townhome Site Mission Road Village at Mission Farms Restaurant & Retail Sites Roe Avenue Interchange Restaurant & Office Site Restaurant & Retail Site Restaurant & Retail Site Hotel & Retail Site Office Site Retail / Office Site Restaurant & Retail Site North The information contained herein was obtained from sources believed reliable; however, no guarantees, warranties or representations are made as to the completeness or accuracy thereof. The presentation of this property is submitted subject to errors, omissions, change of price or conditions prior to sale or lease, or withdrawal without notice.

73
74
75
76

77
78 SITE #2: PARK PLACE

79
80 PARK PLACE (LEAWOOD KS,66211) Usage Built Area (sf) Office space (total) ~ 147,590 Retail space (total) ~ 102,927 Hotel (total) ~ 86,734 BECKER BUILDING 2 nd/ 3 rd Floor Tenants (Offices) Address Suite # Area (sf) Alpert Company LP Ash Street 200 Fountain Capital Management Ash Street JDMA Group LLC Ash Street Lululemon Athletica Ash Street 235 Mann Development Co. LLC Ash Street 200 Overland Consulting Ash Street 215 Park Place Partners Ash Street 200 ZTE USA Ash Street 220 Total Office Floor Area (2 nd + 3 rd Floors) Ash Street ~ 39,592 1 ST Floor Tenants (Retail) Address Store # Area (sf) KC Surroundings Ash Street 16 Cupcake A La Mode Ash Street 18 The Rice Gallery of Fine Art Ash Street 20 EJ's Boutique Ash Street 22 Luxe Boutique Ash Street 24 Alysa Rene Boutique Ash Street 25 Ingredient Restaurant Ash Street 26 4,607 Flowers by Emily Ash Street 17 J. Hathaway Shoe Boutique Ash Street 19 Le Reve Nail Salon Ash Street 21 Annabelles Fine Linens Ash Street 23 Total Retail Floor Area (1 st Floor) ~ 17,307 STAND ALONE BUSINESSES California Pizza Kitchen th Street 15 8,677 Barley Square Storage Room (empty) 27 Paciugo Gelato th Place Mestizo th Place 31 5,077
81 AUBREY BUILDING 2 nd/ 3 rd Floor Tenants (Offices) Address Suite Area (sf) IBM Corporation Ash Street 350 8,971 Tortoise Capital Advisors Ash Street ,500 Ericsson Inc Ash Street ,376 Specialty Fertilizer Products(SFP) Ash Street ,199 Total Office Floor Area (2 nd + 3 rd Floors) ~ 53,046 1 ST Floor Tenants (Retail) Address Store # Area (sf) Michael Shae Salon & Day Spa Ash Street 1 2,462 Carmen's Cafe Ash Street 2 3,775 The Learning Tree Ash Street 4 3,043 The Gents Place Ash Street 5 3,252 Original Marv Deli Ash Street 6 2,382 Picasso Exotic Aquatics Ash Street 7 3,597 Trezo Vino Wine Bistro (Vacant) Ash Street 8 4,873 Total Retail Floor Area (1 st Floor) ~ 23,384 GIBSON BUILDING 2 nd/ 3rd Floor Tenants Address Suite Area (sf) RPS Financial (North Western Mutual ) 5251 W 116th Place Regus 5251 W 116th Place 200 Total Office Floor Area (2 nd + 3 rd Floors) ~ 45,828 1 ST Floor Tenants (Retail) Address Store # Area (sf) Tallulah Belle s 5255 W 116 th Place Bar Method 5215 W 116 th Place 30 2,722 (Vacant) 19,466 Total Retail Floor Area (1 st Floor) ~ 22,914 BUILDING D Tenant (Office) Address # Area (sf) Muller Bressler Brown Ash Street 9 9,124 Tenant (Retail) Address # Area (sf) 801 Chophouse Ash Street 9 5,249 Ra Sushi Ash Street 12 6,124 Gordon Biersch Ash Street 14 8,373 Total Retail Floor Area ~ 19,746 Tenant (Others) Address # Area (sf)/rooms Aloft Hotel Ash Street rooms
82 Links Leases SF in Leawood/ bressler brown heads to leawood.html offices frets rouse gentile and rhodes.html
83 SITE #3: METCALF95 COMPLEX

84 J
85 METCALF 95 COMPLEX As of 7/21/2012 Address/suite Use Status Area (sf) Total (sf) Available (sf) Leased (sf) Occupancy BUILDING B (7133) % Bridge Studio 7115 Retail Occupied? 7119 Retail Vacant 1700 Matchmaker International 7125 Retail Occupied Cynthia Yin OD LLC 7127 Retail Occupied Farmers Insurance Group 7123 Retail Occupied? 7121 Retail Vacant 1736 Elsa Wood Calson Architects 200 Office Occupied E Tek Global Inc 203 Office Occupied Henry Stoever 209 Office Occupied Jane Head 210 Office Occupied Cassidy Turley 217 Office Occupied Gateway Travel 220 Office Occupied Sheldon & Associates 223 Office Occupied? 205 Office Vacant 1390 Wright Online 218 Office Occupied
86 Address/suite Use Status Area (sf) Total (sf) Available (sf) Leased (sf) BUILDING A (7171) % ej4.com 110 & 120 Office Occupied Health Partnership Clinic 100 Office Occupied ABPathfinder 150 Office Occupied Wright Career College 200 Office Occupied Spark Events, Inc. 210 Office Occupied Our Billing Dept. 220 Office Occupied? 225 Office Vacant 1320 Burr & Temkin South 230 Office Occupied Store Financial Services LLC 330 Office Occupied My FreightWorld LLC 310 Office Occupied Store Financial Services LLC 400 Office Occupied? 5th floor Office Vacant MarketShare Group Inc 600 Office Occupied Address/suite Use Status Area (sf) Total (sf) Available (sf) Leased (sf) BUILDING J ( ) % Acupuncture Center 7211 Retail Occupied? 7203 Retail Vacant 864? 7207 Retail Vacant 1241? 7219 Retail Vacant 1156 Guys Snacks Corporation 230 Office Occupied Audit Store 225 Office Occupied Yoh 350 Office Occupied? 325 Office Vacant 2301
87 Address/suite Use Status Area (sf) Total (sf) Available (sf) Leased (sf) BUILDING G ( ) %? 7225 Retail Vacant 1008 Beauty Obsessions 7227 Retail Occupied Panache Hair Design 7235 Retail Occupied Build MyMove 200 Office Occupied Address/suite Use Status Area (sf) Total (sf) Available (sf) BUILDING? ( ) % MetroWalk & Run(Sports Medicine Store) 7301 Retail Occupied First Watch (Breakfast, Brunch&Lunch) 7305 Retail Occupied Hometown Hearing & Audiology 7309 Retail Occupied Nail & Spa 7313 Retail Occupied Lettuce Eat 7319 Retail Occupied Address/suite Use Status Area (sf) Total (sf) Available (sf) Leased (sf) Leased (sf) BUILDING L ( ) % AmeriKick 9534 Retail Occupied? 9530 Retail Vacant 1500 Address/suite Use Status Area (sf) Total (sf) Available (sf) Leased (sf) RED ROBIN 7111 Retail Occupied % JACK STACK 9520 Retail Occupied % Entire Development Site %
88 APPENDIX B SUMMARY OF CORDON TRAFFIC COUNTS (PEAK-HOURS OF TYPICAL WEEKDAYS, JUNE 2012)
89 SITE #1 MORNING PEAK-HOURS
90 urn()22.5tgroups Printed- Unshifted Mission Road From North Mission Farms Main Drive From East Mission Road From South Indian Creek Pkwy From West Start Time Right Thru Left App. Total Right Thru Left App. Total Right Thru Left App. Total Right Thru Left App. Total Int. Total RT from RT to 2nd 2nd Drive Drive 07:00 AM :15 AM :30 AM :45 AM Total :00 AM :15 AM :30 AM :45 AM Total Grand Total Apprch % Mission Farms Mixed-Use Development Intersection of Mission Road & Indian Cr Morning Peak-Hours Sunny, warm ingmovementcounfile Name : Mission&Indian Creek-am-1 Site Code : 1 Start Date : 6/5/2012 Page No : 1 ts
91 urn()ingmove.856tmission Farms Mixed-Use Development Intersection of Mission Road & Indian Cr Morning Peak-Hours Sunny, warm Mission Road From North Mission Farms Main Drive From East Mission Road From South Indian Creek Pkwy From West Start Time Right Thru Left App. Total Right Thru Left RT from 2nd Drive App. Total Right Thru Left RT to 2nd Drive App. Total Right Thru Left App. Total Int. Total Peak Hour Analysis From 07:00 AM to 08:30 AM - Peak 1 of 1 Peak Hour for Entire Intersection Begins at 07:45 AM 07:45 AM :00 AM :15 AM :30 AM Total Volume % App. Total mentcounfile Name : Mission&Indian Creek-am-1 Site Code : 1 Start Date : 6/5/2012 Page No : 2 ts
92 urn()22tgroups Printed- Unshifted Mission Road From North Mission Farms Main Drive From East Mission Road From South Indian Creek Pkwy From West Start Time Right Thru Left App. Total Right Thru Left App. Total Right Thru Left App. Total Right Thru Left App. Total Int. Total RT from RT to 2nd 2nd Drive Drive 07:00 AM :15 AM :30 AM :45 AM Total :00 AM :15 AM :30 AM :45 AM Total Grand Total Apprch % Mission Farms Mixed-Use Development Intersection of Mission Road & Indian Cr Morning Peak-Hours Sunny, warm ingmovementcounfile Name : Mission&Indian Creek-am-2 Site Code : 1 Start Date : 6/6/2012 Page No : 1 ts
93 urn()ingmove.844tmission Farms Mixed-Use Development Intersection of Mission Road & Indian Cr Morning Peak-Hours Sunny, warm Mission Road From North Mission Farms Main Drive From East Mission Road From South Indian Creek Pkwy From West Start Time Right Thru Left App. Total Right Thru Left RT from 2nd Drive App. Total Right Thru Left RT to 2nd Drive App. Total Right Thru Left App. Total Int. Total Peak Hour Analysis From 07:00 AM to 08:30 AM - Peak 1 of 1 Peak Hour for Entire Intersection Begins at 07:45 AM 07:45 AM :00 AM :15 AM :30 AM Total Volume % App. Total mentcounfile Name : Mission&Indian Creek-am-2 Site Code : 1 Start Date : 6/6/2012 Page No : 2 ts
94 urn()28.9tgroups Printed- Unshifted Mission Road From North Mission Farms Main Drive From East Mission Road From South Indian Creek Parkway From West Start Time Right Thru Left App. Total Right Thru Left App. Total Right Thru Left App. Total Right Thru Left App. Total Int. Total RT from 2nd RT to 2nd Drive Drive 07:00 AM :15 AM :30 AM :45 AM Total :00 AM :15 AM :30 AM :45 AM Total Grand Total Apprch % Mission Farms Mixed-Use Development Intersection of Mission Road & Indian Creek Pkwy Morning Peak-Hours Sunny, cool ingmovementcounfile Name : Mission&Indian Creek-am-3 Site Code : 1 Start Date : 6/7/2012 Page No : 1 ts
95 urn()ingmovemission Farms Mixed-Use Development Intersection of Mission Road & Indian Creek Pkwy Morning Peak-Hours Sunny, cool Mission Road From North Mission Farms Main Drive From East.893TMission Road From South Indian Creek Parkway From West Start Time Right Thru Left App. Total Right Thru Left RT from 2nd Drive App. Total Right Thru Left RT to 2nd Drive App. Total Right Thru Left App. Total Int. Total Peak Hour Analysis From 07:00 AM to 08:30 AM - Peak 1 of 1 Peak Hour for Entire Intersection Begins at 07:45 AM 07:45 AM :00 AM :15 AM :30 AM Total Volume % App. Total mentcounfile Name : Mission&Indian Creek-am-3 Site Code : 1 Start Date : 6/7/2012 Page No : 2 ts
96 urn()7.6tgroups Printed- Unshifted Mission Road From North Mission Farms Main Drive From East Mission Road From South Indian Creek Pkwy From West Start Time Right Thru Left App. Total Right Thru Left App. Total Right Thru Left App. Total Right Thru Left App. Total Int. Total RT from RT to 2nd 2nd Drive Drive 07:00 AM :15 AM :30 AM :45 AM Total :00 AM :15 AM :30 AM :45 AM Total Grand Total Apprch % Mission Farms Mixed-Use Development Intersection of Mission Road & Indian Cr Morning Peak-Hours Sunny, warm ingmovementcountsfile Name : Mission&Indian Creek-am-2-raw Site Code : 1 Start Date : 6/6/2012 Page No : 1
97 urn()ingmove.868tmission Farms Mixed-Use Development Intersection of Mission Road & Indian Cr Morning Peak-Hours Sunny, warm Mission Road From North Mission Farms Main Drive From East Mission Road From South Indian Creek Pkwy From West Start Time Right Thru Left App. Total Right Thru Left RT from 2nd Drive App. Total Right Thru Left RT to 2nd Drive App. Total Right Thru Left App. Total Int. Total Peak Hour Analysis From 07:00 AM to 08:30 AM - Peak 1 of 1 Peak Hour for Entire Intersection Begins at 07:45 AM 07:45 AM :00 AM :15 AM :30 AM Total Volume % App. Total mentcountsfile Name : Mission&Indian Creek-am-2-raw Site Code : 1 Start Date : 6/6/2012 Page No : 2
98 urn()7.5tgroups Printed- Unshifted Mission Road From North Mission Farms Main Drive From East Mission Road From South Indian Creek Parkway From West Start Time Right Thru Left App. Total Right Thru Left App. Total Right Thru Left App. Total Right Thru Left App. Total Int. Total RT from 2nd RT to 2nd Drive Drive 07:00 AM :15 AM :30 AM :45 AM Total :00 AM :15 AM :30 AM :45 AM Total Grand Total Apprch % Mission Farms Mixed-Use Development Intersection of Mission Road & Indian Creek Pkwy Morning Peak-Hours Sunny, cool ingmovementcountsfile Name : Mission&Indian Creek-am-3-raw Site Code : 1 Start Date : 6/7/2012 Page No : 1
99 urn()ingmovemission Farms Mixed-Use Development Intersection of Mission Road & Indian Creek Pkwy Morning Peak-Hours Sunny, cool Mission Road From North Mission Farms Main Drive From East Mission Road From South Indian Creek Parkway From West Start Time Right Thru Left App. Total Right Thru Left RT from 2nd Drive App. Total Right Thru Left RT to 2nd Drive App. Total Right Thru Left App. Total Int. Total Peak Hour Analysis From 07:00 AM to 08:30 AM - Peak 1 of 1 Peak Hour for Entire Intersection Begins at 07:45 AM 07:45 AM T :00 AM :15 AM :30 AM Total Volume % App. Total mentcountsfile Name : Mission&Indian Creek-am-3-raw Site Code : 1 Start Date : 6/7/2012 Page No : 2
100 SITE #1 AFTERNOON PEAK-HOURS
101 urn()11.2tgroups Printed- Unshifted Mission Road From North Mission Farms Main Drive From East Mission Road From South Indian Creek Pkwy From West Start Time Right Thru Left App. Total Right Thru Left App. Total Right Thru Left App. Total Right Thru Left App. Total Int. Total RT from RT to 2nd 2nd DRive Drive 04:00 PM :15 PM :30 PM :45 PM Total :00 PM :15 PM :30 PM :45 PM Total Grand Total Apprch % Mission Farms Mixed-Use Development Intersection of Mission Road & Indian Creek Parkway Afternoon Peak-Hours Sunny, Hot ingmovementcounfile Name : Mission&Indian Creek-pm-1 Site Code : 1 Start Date : 6/5/2012 Page No : 1 ts
102 urn()ingmove.860tmission Farms Mixed-Use Development Intersection of Mission Road & Indian Creek Parkway Afternoon Peak-Hours Sunny, Hot Mission Road From North Mission Farms Main Drive From East Mission Road From South Indian Creek Pkwy From West Start Time Right Thru Left App. Total Right Thru Left RT from 2nd DRive App. Total Right Thru Left RT to 2nd Drive App. Total Right Thru Left App. Total Int. Total Peak Hour Analysis From 04:00 PM to 05:30 PM - Peak 1 of 1 Peak Hour for Entire Intersection Begins at 04:45 PM 04:45 PM :00 PM :15 PM :30 PM Total Volume % App. Total mentcounfile Name : Mission&Indian Creek-pm-1 Site Code : 1 Start Date : 6/5/2012 Page No : 2 ts
103 urn()13.9tgroups Printed- Unshifted Mission Road From North Mission Farms Main Drive From East Mission Road From South Indian Creek Parkway From West Start Time Right Thru Left App. Total Right Thru Left App. Total Right Thru Left App. Total Right Thru Left App. Total Int. Total RT from 2nd RT to 2nd Drive Drive 04:00 PM :15 PM :30 PM :45 PM Total :00 PM :15 PM :30 PM :45 PM Total Grand Total Apprch % Mission Farms Mixed-Use Development Intersection of Mission Road & Indian Creek Parkway Afternoon Peak-Hours Sunny, Hot ingmovementcounfile Name : Mission&Indian Creek-pm-2 Site Code : 1 Start Date : 6/6/2012 Page No : 1 ts
104 urn()ingmovemission Farms Mixed-Use Development Intersection of Mission Road & Indian Creek Parkway Afternoon Peak-Hours Sunny, Hot Mission Road From North Mission Farms Main Drive From East.928TMission Road From South Indian Creek Parkway From West Start Time Right Thru Left App. Total Right Thru Left RT from 2nd Drive App. Total Right Thru Left RT to 2nd Drive App. Total Right Thru Left App. Total Int. Total Peak Hour Analysis From 04:00 PM to 05:45 PM - Peak 1 of 1 Peak Hour for Entire Intersection Begins at 05:00 PM 05:00 PM :15 PM :30 PM :45 PM Total Volume % App. Total mentcounfile Name : Mission&Indian Creek-pm-2 Site Code : 1 Start Date : 6/6/2012 Page No : 2 ts
105 urn()11.5tgroups Printed- Unshifted Mission Road From North Mission Farms Main Drive From East Mission Road From South Indian Creek Pkwy From West Start Time Right Thru Left App. Total Right Thru Left App. Total Right Thru Left App. Total Right Thru Left App. Total Int. Total RT from RT to 2nd 2nd DRive Drive 04:00 PM :15 PM :30 PM :45 PM Total :00 PM :15 PM :30 PM :45 PM Total Grand Total Apprch % Mission Farms Mixed-Use Development Intersection of Mission Road & Indian Cr Afternoon Peak-Hours Sunny, Hot ingmovementcounfile Name : Mission&Indian Creek-pm-3 Site Code : 1 Start Date : 6/7/2012 Page No : 1 ts
106 urn()ingmove.853tmission Farms Mixed-Use Development Intersection of Mission Road & Indian Cr Afternoon Peak-Hours Sunny, Hot Mission Road From North Mission Farms Main Drive From East Mission Road From South Indian Creek Pkwy From West Start Time Right Thru Left App. Total Right Thru Left RT from 2nd DRive App. Total Right Thru Left RT to 2nd Drive App. Total Right Thru Left App. Total Int. Total Peak Hour Analysis From 04:00 PM to 05:30 PM - Peak 1 of 1 Peak Hour for Entire Intersection Begins at 04:45 PM 04:45 PM :00 PM :15 PM :30 PM Total Volume % App. Total mentcounfile Name : Mission&Indian Creek-pm-3 Site Code : 1 Start Date : 6/7/2012 Page No : 2 ts
107 urn()12.3tgroups Printed- Unshifted Mission Road From North Mission Farms Main Drive From East Mission Road From South Indian Creek Pkwy From West Start Time Right Thru Left App. Total Right Thru Left App. Total Right Thru Left App. Total Right Thru Left App. Total Int. Total RT from RT to 2nd 2nd DRive Drive 04:00 PM :15 PM :30 PM :45 PM Total :00 PM :15 PM :30 PM :45 PM Total Grand Total Apprch % Mission Farms Mixed-Use Development Intersection of Mission Road & Indian Creek Parkway Afternoon Peak-Hours Sunny, Hot ingmovementcountsfile Name : Mission&Indian Creek-pm-1-raw Site Code : 1 Start Date : 6/5/2012 Page No : 1
108 urn()ingmove.911tmission Farms Mixed-Use Development Intersection of Mission Road & Indian Creek Parkway Afternoon Peak-Hours Sunny, Hot Mission Road From North Mission Farms Main Drive From East Mission Road From South Indian Creek Pkwy From West Start Time Right Thru Left App. Total Right Thru Left RT from 2nd DRive App. Total Right Thru Left RT to 2nd Drive App. Total Right Thru Left App. Total Int. Total Peak Hour Analysis From 04:00 PM to 05:30 PM - Peak 1 of 1 Peak Hour for Entire Intersection Begins at 04:45 PM 04:45 PM :00 PM :15 PM :30 PM Total Volume % App. Total mentcountsfile Name : Mission&Indian Creek-pm-1-raw Site Code : 1 Start Date : 6/5/2012 Page No : 2
109 urn()13.9tgroups Printed- Unshifted Mission Road From North Mission Farms Main Drive From East Mission Road From South Indian Creek Parkway From West Start Time Right Thru Left App. Total Right Thru Left App. Total Right Thru Left App. Total Right Thru Left App. Total Int. Total RT from 2nd RT to 2nd Drive Drive 04:00 PM :15 PM :30 PM :45 PM Total :00 PM :15 PM :30 PM :45 PM Total Grand Total Apprch % Mission Farms Mixed-Use Development Intersection of Mission Road & Indian Creek Parkway Afternoon Peak-Hours Sunny, Hot ingmovementcountsfile Name : Mission&Indian Creek-pm-2-raw Site Code : 1 Start Date : 6/6/2012 Page No : 1
110 urn()ingmovemission Farms Mixed-Use Development Intersection of Mission Road & Indian Creek Parkway Afternoon Peak-Hours Sunny, Hot Mission Road From North Mission Farms Main Drive From East.885TMission Road From South Indian Creek Parkway From West Start Time Right Thru Left App. Total Right Thru Left RT from 2nd Drive App. Total Right Thru Left RT to 2nd Drive App. Total Right Thru Left App. Total Int. Total Peak Hour Analysis From 04:00 PM to 05:45 PM - Peak 1 of 1 Peak Hour for Entire Intersection Begins at 05:00 PM 05:00 PM :15 PM :30 PM :45 PM Total Volume % App. Total mentcountsfile Name : Mission&Indian Creek-pm-2-raw Site Code : 1 Start Date : 6/6/2012 Page No : 2
111 SITE #2 MORNING PEAK-HOURS
112 Turning Movement Counts (All Vehicles) Park Place Mixed-Use Development Check Points #1 & #2 Morning Peak-Hours Sunny, Mild File Name : Check Points #1 & #2-am-1 Site Code : 2 Start Date : 6/12/2012 Page No : 1 Access onto Town Center Drive From North Northernmost Access onto Nall Ave. From East Groups Printed- Unshifted Access onto Town Center Drive From South Northernmost Access onto Nall Ave. From West Start Time Inbound App. Total Right-Out App. Total Outbound App. Total Right-In App. Total Int. Total 07:15 AM :30 AM :45 AM Total :00 AM :15 AM :30 AM :45 AM Total Grand Total Apprch % Total %
113 Turning Movement Counts (All Vehicles) Park Place Mixed-Use Development Check Points #1 & #2 Morning Peak-Hours Sunny, Mild File Name : Check Points #1 & #2-am-1 Site Code : 2 Start Date : 6/12/2012 Page No : 2 Access onto Town Center Drive From North Northernmost Access onto Nall Ave. From East Access onto Town Center Drive From South Northernmost Access onto Nall Ave. From West Start Time App. Total App. Total Inbound Right-Out Outbound App. Total Right-In App. Total Int. Total Peak Hour Analysis From 07:15 AM to 08:45 AM - Peak 1 of 1 Peak Hour for Entire Intersection Begins at 08:00 AM 08:00 AM :15 AM :30 AM :45 AM Total Volume % App. Total PHF
114 Turning Movement Counts (All Vehicles) Park Place Mixed-Use Development Check Point #3 Morning Peak-Hours Sunny, Mild File Name : Check Point #3-am-1 Site Code : 2 Start Date : 6/12/2012 Page No : 1 Groups Printed- Unshifted From North Southernmost Access onto Nall Ave. From East Nall Avenue From South From West Start Time App. Total Right-Out App. Total Right-In Thru App. Total App. Total Int. Total 07:15 AM :30 AM :45 AM Total :00 AM :15 AM :30 AM :45 AM Total Grand Total Apprch % Total %
115 Turning Movement Counts (All Vehicles) Park Place Mixed-Use Development Check Point #3 Morning Peak-Hours Sunny, Mild File Name : Check Point #3-am-1 Site Code : 2 Start Date : 6/12/2012 Page No : 2 From North Southernmost Access onto Nall Ave. From East Nall Avenue From South From West Start Time App. Total Right-Out App. Total Right-In Thru App. Total App. Total Int. Total Peak Hour Analysis From 07:15 AM to 08:45 AM - Peak 1 of 1 Peak Hour for Entire Intersection Begins at 07:30 AM 07:30 AM :45 AM :00 AM :15 AM Total Volume % App. Total PHF
116 Turning Movement Counts (All Vehicles) Park Place Mixed-Use Development Check Points #4 & #5 Morning Peak-Hours Sunny, Mild File Name : Check Points #4 & #5-am-1 Site Code : 2 Start Date : 6/12/2012 Page No : 1 Access Drives onto 117th Street From North 117th Street From East Groups Printed- Unshifted Access Drives onto 117th Street From South 117th Street From West Start Time Right-Out #5 Thru-Out #5 Left-Out #5 Right-Out #4 App. Total Right-In #5 Right-In #4 App. Total Thru-In #5 App. Total Left-In #5 Left-In #4 App. Total Int. Total 07:15 AM :30 AM :45 AM Total :00 AM :15 AM :30 AM :45 AM Total Grand Total Apprch % Total %
117 Turning Movement Counts (All Vehicles) Park Place Mixed-Use Development Check Points #4 & #5 Morning Peak-Hours Sunny, Mild File Name : Check Points #4 & #5-am-1 Site Code : 2 Start Date : 6/12/2012 Page No : 2 Access Drives onto 117th Street From North 117th Street From East Access Drives onto 117th Street From South 117th Street From West Start Time Right-Out #5 Thru-Out #5 Left-Out #5 App. Total Right-Out #4 Right-In #5 Right-In #4 App. Total Thru-In #5 App. Total Left-In #5 Left-In #4 App. Total Int. Total Peak Hour Analysis From 07:15 AM to 08:45 AM - Peak 1 of 1 Peak Hour for Entire Intersection Begins at 07:30 AM 07:30 AM :45 AM :00 AM :15 AM Total Volume % App. Total PHF
118 Turning Movement Counts (All Vehicles) Park Place Mixed-Use Development Check Points #1 & #2 Morning Peak-Hours Sunny, Mild File Name : Check Points #1 & #2-am-2 Site Code : 2 Start Date : 6/13/2012 Page No : 1 Access onto Town Center Drive From North Northernmost Access onto Nall Ave. From East Groups Printed- Unshifted Access onto Town Center Drive From South Northernmost Access onto Nall Ave. From West Start Time Inbound App. Total Right-Out App. Total Outbound App. Total Right-In App. Total Int. Total 07:00 AM :15 AM :30 AM :45 AM Total :00 AM :15 AM :30 AM :45 AM Total Grand Total Apprch % Total %
119 Turning Movement Counts (All Vehicles) Park Place Mixed-Use Development Check Points #1 & #2 Morning Peak-Hours Sunny, Mild File Name : Check Points #1 & #2-am-2 Site Code : 2 Start Date : 6/13/2012 Page No : 2 Access onto Town Center Drive From North Northernmost Access onto Nall Ave. From East Access onto Town Center Drive From South Northernmost Access onto Nall Ave. From West Start Time App. Total App. Total Inbound Right-Out Outbound App. Total Right-In App. Total Int. Total Peak Hour Analysis From 07:00 AM to 08:45 AM - Peak 1 of 1 Peak Hour for Entire Intersection Begins at 08:00 AM 08:00 AM :15 AM :30 AM :45 AM Total Volume % App. Total PHF
120 Turning Movement Counts (All Vehicles) Park Place Mixed-Use Development Check Point #3 Morning Peak-Hours Sunny, Mild File Name : Check Point #3-am-2 Site Code : 2 Start Date : 6/13/2012 Page No : 1 Groups Printed- Unshifted From North Southernmost Access onto Nall Ave. From East Nall Avenue From South From West Start Time App. Total Right-Out App. Total Right-In Thru App. Total App. Total Int. Total 07:00 AM :15 AM :30 AM :45 AM Total :00 AM :15 AM :30 AM :45 AM Total Grand Total Apprch % Total %
121 Turning Movement Counts (All Vehicles) Park Place Mixed-Use Development Check Point #3 Morning Peak-Hours Sunny, Mild File Name : Check Point #3-am-2 Site Code : 2 Start Date : 6/13/2012 Page No : 2 From North Southernmost Access onto Nall Ave. From East Nall Avenue From South From West Start Time App. Total Right-Out App. Total Right-In Thru App. Total App. Total Int. Total Peak Hour Analysis From 07:00 AM to 08:45 AM - Peak 1 of 1 Peak Hour for Entire Intersection Begins at 07:30 AM 07:30 AM :45 AM :00 AM :15 AM Total Volume % App. Total PHF
122 Turning Movement Counts (All Vehicles) Park Place Mixed-Use Development Check Points #4 & #5 Morning Peak-Hours Sunny, Mild File Name : Check Points #4 & #5-am-2 Site Code : 2 Start Date : 6/13/2012 Page No : 1 Access Drives onto 117th Street From North 117th Street From East Groups Printed- Unshifted - Bank 1 Access Drives onto 117th Street From South 117th Street From West Start Time Right-Out #5 Thru-Out #5 Left-Out #5 Right-Out #4 App. Total Right-In #5 Right-In #4 App. Total Thru-In #5 App. Total Left-In #5 Left-In #4 App. Total Int. Total 07:00 AM :15 AM :30 AM :45 AM Total :00 AM :15 AM :30 AM :45 AM Total Grand Total Apprch % Total % Unshifted % Unshifted Bank % Bank
123 Turning Movement Counts (All Vehicles) Access Drives onto 117th Street From North 117th Street From East Access Drives onto 117th Street From South 117th Street From West Start Time Right-Out #5 Thru-Out #5 Left-Out #5 App. Total Right-Out #4 Right-In #5 Right-In #4 App. Total Thru-In #5 App. Total Left-In #5 Left-In #4 App. Total Int. Total Peak Hour Analysis From 07:00 AM to 08:45 AM - Peak 1 of 1 Peak Hour for Entire Intersection Begins at 07:15 AM 07:15 AM :30 AM :45 AM :00 AM Total Volume % App. Total PHF
124 Turning Movement Counts (All Vehicles) Park Place Mixed-Use Development Check Points #1 & #2 Morning Peak-Hours Sunny, Mild File Name : Check Points #1 & #2-am-3 Site Code : 2 Start Date : 6/14/2012 Page No : 1 Groups Printed- Unshifted Access onto Town Center Drive From North Northernmost Access onto Nall Ave. From East Access onto Town Center Drive From South Northernmost Access onto Nall Ave. From West Start Time Inbound App. Total Right-Out App. Total Outbound App. Total Right-In App. Total Int. Total 07:15 AM :30 AM :45 AM Total :00 AM :15 AM :30 AM :45 AM Total Grand Total Apprch % Total %
125 Turning Movement Counts (All Vehicles) Park Place Mixed-Use Development Check Points #1 & #2 Morning Peak-Hours Sunny, Mild File Name : Check Points #1 & #2-am-3 Site Code : 2 Start Date : 6/14/2012 Page No : 2 Access onto Town Center Drive Northernmost Access onto Nall Ave. Access onto Town Center Drive Northernmost Access onto Nall Ave. From North From East From South From West Start Time Inbound App. Total Right-Out App. Total Outbound App. Total Right-In App. Total Int. Total Peak Hour Analysis From 07:15 AM to 08:45 AM - Peak 1 of 1 Peak Hour for Entire Intersection Begins at 08:00 AM 08:00 AM :15 AM :30 AM :45 AM Total Volume % App. Total PHF
126 Turning Movement Counts (All Vehicles) Park Place Mixed-Use Development Check Point #3 Morning Peak-Hours Sunny, Mild File Name : Check Point #3-am-3 Site Code : 2 Start Date : 6/14/2012 Page No : 1 Groups Printed- Unshifted From North Southernmost Access onto Nall Ave. From East Nall Avenue From South From West Start Time App. Total Right-Out App. Total Right-In Thru App. Total App. Total Int. Total 07:15 AM :30 AM :45 AM Total :00 AM :15 AM :30 AM :45 AM Total Grand Total Apprch % Total %
127 Turning Movement Counts (All Vehicles) Park Place Mixed-Use Development Check Point #3 Morning Peak-Hours Sunny, Mild File Name : Check Point #3-am-3 Site Code : 2 Start Date : 6/14/2012 Page No : 2 Southernmost Access onto Nall Ave. Nall Avenue From North From East From South From West Start Time App. Total Right-Out App. Total Right-In Thru App. Total App. Total Int. Total Peak Hour Analysis From 07:15 AM to 08:45 AM - Peak 1 of 1 Peak Hour for Entire Intersection Begins at 07:30 AM 07:30 AM :45 AM :00 AM :15 AM Total Volume % App. Total PHF
128 Turning Movement Counts (All Vehicles) Park Place Mixed-Use Development Check Points #4 & #5 Morning Peak-Hours Sunny, Mild File Name : Check Points #4 & #5-am-3 Site Code : 2 Start Date : 6/14/2012 Page No : 1 Groups Printed- Unshifted Access Drives onto 117th Street From North 117th Street From East Access Drives onto 117th Street From South 117th Street From West Start Time Right-Out #5 Thru-Out #5 Left-Out #5 Right-Out #4 App. Total Right-In #5 Right-In #4 App. Total Thru-In #5 App. Total Left-In #5 Left-In #4 App. Total Int. Total 07:15 AM :30 AM :45 AM Total :00 AM :15 AM :30 AM :45 AM Total Grand Total Apprch % Total %
129 Turning Movement Counts (All Vehicles) Park Place Mixed-Use Development Check Points #4 & #5 Morning Peak-Hours Sunny, Mild File Name : Check Points #4 & #5-am-3 Site Code : 2 Start Date : 6/14/2012 Page No : 2 Access Drives onto 117th Street 117th Street Access Drives onto 117th Street 117th Street From North From East From South From West Start Time Right-Out #5 Thru-Out #5 Left-Out #5 Right-Out #4 App. Total Right-In #5 Right-In #4 App. Total Thru-In #5 App. Total Left-In #5 Left-In #4 App. Total Int. Total Peak Hour Analysis From 07:15 AM to 08:45 AM - Peak 1 of 1 Peak Hour for Entire Intersection Begins at 07:30 AM 07:30 AM :45 AM :00 AM :15 AM Total Volume % App. Total PHF
130 SITE #2 AFTERNOON PEAK-HOURS
131 Turning Movement Counts (All Vehicles) Park Place Mixed-Use Development Check Points #1 & #2 Afternoon Peak-Hours Sunny, Hot File Name : Check Points #1 & #2-pm-1 Site Code : 2 Start Date : 6/12/2012 Page No : 1 Groups Printed- Unshifted Access onto Town Center Drive From North Northernmost Access onto Nall Ave. From East Access onto Town Center Drive From South Northernmost Access onto Nall Ave. From West Start Time Inbound App. Total Right-Out App. Total Outbound App. Total Right-In App. Total Int. Total 03:30 PM :45 PM Total :00 PM :15 PM :30 PM :45 PM Total :00 PM :15 PM :30 PM :45 PM Total Grand Total Apprch % Total %
132 Turning Movement Counts (All Vehicles) Park Place Mixed-Use Development Check Points #1 & #2 Afternoon Peak-Hours Sunny, Hot File Name : Check Points #1 & #2-pm-1 Site Code : 2 Start Date : 6/12/2012 Page No : 2 Access onto Town Center Drive Northernmost Access onto Nall Ave. Access onto Town Center Drive Northernmost Access onto Nall Ave. From North From East From South From West Start Time Inbound App. Total Right-Out App. Total Outbound App. Total Right-In App. Total Int. Total Peak Hour Analysis From 03:30 PM to 05:45 PM - Peak 1 of 1 Peak Hour for Entire Intersection Begins at 05:00 PM 05:00 PM :15 PM :30 PM :45 PM Total Volume % App. Total PHF
133 Turning Movement Counts (All Vehicles) Park Place Mixed-Use Development Check Point #3 Afternoon Peak-Hours Sunny, Hot File Name : Check Point #3-pm-1 Site Code : 2 Start Date : 6/12/2012 Page No : 1 Groups Printed- Unshifted From North Southernmost Access onto Nall Ave. From East Nall Avenue From South From West Start Time App. Total Right-Out App. Total Right-In Thru App. Total App. Total Int. Total 03:30 PM :45 PM Total :00 PM :15 PM :30 PM :45 PM Total :00 PM :15 PM :30 PM :45 PM Total Grand Total Apprch % Total %
134 Turning Movement Counts (All Vehicles) Park Place Mixed-Use Development Check Point #3 Afternoon Peak-Hours Sunny, Hot File Name : Check Point #3-pm-1 Site Code : 2 Start Date : 6/12/2012 Page No : 2 Southernmost Access onto Nall Ave. Nall Avenue From North From East From South From West Start Time App. Total Right-Out App. Total Right-In Thru App. Total App. Total Int. Total Peak Hour Analysis From 03:30 PM to 05:45 PM - Peak 1 of 1 Peak Hour for Entire Intersection Begins at 04:45 PM 04:45 PM :00 PM :15 PM :30 PM Total Volume % App. Total PHF
135 Turning Movement Counts (All Vehicles) Park Place Mixed-Use Development Check Points #4 & #5 Afternoon Peak-Hours Sunny, Hot File Name : Check Points #4 & #5-pm-1 Site Code : 2 Start Date : 6/12/2012 Page No : 1 Groups Printed- Unshifted Access Drives onto 117th Street From North 117th Street From East Access Drives onto 117th Street From South 117th Street From West Start Time Right-Out #5 Thru-Out #5 Left-Out #5 Right-Out #4 App. Total Right-In #5 Thru Right-In #4 App. Total Thru-In #5 App. Total Thru Left-In #5 Left-In #4 App. Total Int. Total 03:30 PM :45 PM Total :00 PM :15 PM :30 PM :45 PM Total :00 PM :15 PM :30 PM :45 PM Total Grand Total Apprch % Total %
136 Turning Movement Counts (All Vehicles) Park Place Mixed-Use Development Check Points #4 & #5 Afternoon Peak-Hours Sunny, Hot File Name : Check Points #4 & #5-pm-1 Site Code : 2 Start Date : 6/12/2012 Page No : 2 Access Drives onto 117th Street 117th Street Access Drives onto 117th Street 117th Street From North From East From South From West Start Time Right-Out #5 Thru-Out #5 Left-Out #5 Right-Out #4 App. Total Right-In #5 Thru Right-In #4 App. Total Thru-In #5 App. Total Thru Left-In #5 Left-In #4 App. Total Int. Total Peak Hour Analysis From 03:30 PM to 05:30 PM - Peak 1 of 1 Peak Hour for Entire Intersection Begins at 04:45 PM 04:45 PM :00 PM :15 PM :30 PM Total Volume % App. Total PHF
137 Turning Movement Counts (All Vehicles) Park Place Mixed-Use Development Check Points #1 & #2 Afternoon Peak-Hours Sunny, Hot File Name : Check Points #1 & #2-pm-2 Site Code : 2 Start Date : 6/13/2012 Page No : 1 Groups Printed- Unshifted Access onto Town Center Drive From North Northernmost Access onto Nall Ave. From East Access onto Town Center Drive From South Northernmost Access onto Nall Ave. From West Start Time Inbound App. Total Right-Out App. Total Outbound App. Total Right-In App. Total Int. Total 03:30 PM :45 PM Total :00 PM :15 PM :30 PM :45 PM Total :00 PM :15 PM :30 PM :45 PM Total Grand Total Apprch % Total %
138 Turning Movement Counts (All Vehicles) Park Place Mixed-Use Development Check Points #1 & #2 Afternoon Peak-Hours Sunny, Hot File Name : Check Points #1 & #2-pm-2 Site Code : 2 Start Date : 6/13/2012 Page No : 2 Access onto Town Center Drive Northernmost Access onto Nall Ave. Access onto Town Center Drive Northernmost Access onto Nall Ave. From North From East From South From West Start Time Inbound App. Total Right-Out App. Total Outbound App. Total Right-In App. Total Int. Total Peak Hour Analysis From 03:30 PM to 05:45 PM - Peak 1 of 1 Peak Hour for Entire Intersection Begins at 04:45 PM 04:45 PM :00 PM :15 PM :30 PM Total Volume % App. Total PHF
139 Turning Movement Counts (All Vehicles) Park Place Mixed-Use Development Check Point #3 Afternoon Peak-Hours Sunny, Hot File Name : Check Point #3-pm-2 Site Code : 2 Start Date : 6/13/2012 Page No : 1 Groups Printed- Unshifted From North Southernmost Access onto Nall Ave. From East Nall Avenue From South From West Start Time App. Total Right-Out App. Total Right-In Thru App. Total App. Total Int. Total 03:30 PM :45 PM Total :00 PM :15 PM :30 PM :45 PM Total :00 PM :15 PM :30 PM :45 PM Total Grand Total Apprch % Total %
140 Turning Movement Counts (All Vehicles) Park Place Mixed-Use Development Check Point #3 Afternoon Peak-Hours Sunny, Hot File Name : Check Point #3-pm-2 Site Code : 2 Start Date : 6/13/2012 Page No : 2 Southernmost Access onto Nall Ave. Nall Avenue From North From East From South From West Start Time App. Total Right-Out App. Total Right-In Thru App. Total App. Total Int. Total Peak Hour Analysis From 03:30 PM to 05:45 PM - Peak 1 of 1 Peak Hour for Entire Intersection Begins at 05:00 PM 05:00 PM :15 PM :30 PM :45 PM Total Volume % App. Total PHF
141 Turning Movement Counts (All Vehicles) Park Place Mixed-Use Development Check Points #4 & #5 Afternoon Peak-Hours Sunny, Hot File Name : Check Points #4 & #5-pm-2 Site Code : 2 Start Date : 6/13/2012 Page No : 1 Groups Printed- Unshifted Access Drives onto 117th Street From North 117th Street From East Access Drives onto 117th Street From South 117th Street From West Start Time Right-Out #5 Thru-Out #5 Left-Out #5 Right-Out #4 App. Total Right-In #5 Thru Right-In #4 App. Total Thru-In #5 App. Total Thru Left-In #5 Left-In #4 App. Total Int. Total 03:30 PM :45 PM Total :00 PM :15 PM :30 PM :45 PM Total :00 PM :15 PM :30 PM :45 PM Total Grand Total Apprch % Total %
142 Turning Movement Counts (All Vehicles) Park Place Mixed-Use Development Check Points #4 & #5 Afternoon Peak-Hours Sunny, Hot File Name : Check Points #4 & #5-pm-2 Site Code : 2 Start Date : 6/13/2012 Page No : 2 Access Drives onto 117th Street 117th Street Access Drives onto 117th Street 117th Street From North From East From South From West Start Time Right-Out #5 Thru-Out #5 Left-Out #5 Right-Out #4 App. Total Right-In #5 Thru Right-In #4 App. Total Thru-In #5 App. Total Thru Left-In #5 Left-In #4 App. Total Int. Total Peak Hour Analysis From 03:30 PM to 05:30 PM - Peak 1 of 1 Peak Hour for Entire Intersection Begins at 04:45 PM 04:45 PM :00 PM :15 PM :30 PM Total Volume % App. Total PHF
143 Turning Movement Counts (All Vehicles) Park Place Mixed-Use Development Check Points #1 & #2 Afternoon Peak-Hours Sunny, Hot File Name : Check Points #1 & #2-pm-3 Site Code : 2 Start Date : 6/14/2012 Page No : 1 Groups Printed- Unshifted Access onto Town Center Drive From North Northernmost Access onto Nall Ave. From East Access onto Town Center Drive From South Northernmost Access onto Nall Ave. From West Start Time Inbound App. Total Right-Out App. Total Outbound App. Total Right-In App. Total Int. Total 03:45 PM Total :00 PM :15 PM :30 PM :45 PM Total :00 PM :15 PM :30 PM :45 PM Total Grand Total Apprch % Total %
144 Turning Movement Counts (All Vehicles) Park Place Mixed-Use Development Check Points #1 & #2 Afternoon Peak-Hours Sunny, Hot File Name : Check Points #1 & #2-pm-3 Site Code : 2 Start Date : 6/14/2012 Page No : 2 Access onto Town Center Drive Northernmost Access onto Nall Ave. Access onto Town Center Drive Northernmost Access onto Nall Ave. From North From East From South From West Start Time Inbound App. Total Right-Out App. Total Outbound App. Total Right-In App. Total Int. Total Peak Hour Analysis From 03:45 PM to 05:45 PM - Peak 1 of 1 Peak Hour for Entire Intersection Begins at 05:00 PM 05:00 PM :15 PM :30 PM :45 PM Total Volume % App. Total PHF
145 Turning Movement Counts (All Vehicles) Park Place Mixed-Use Development Check Point #3 Afternoon Peak-Hours Sunny, Hot File Name : Check Point #3-pm-3 Site Code : 2 Start Date : 6/14/2012 Page No : 1 Groups Printed- Unshifted From North Southernmost Access onto Nall Ave. From East Nall Avenue From South From West Start Time App. Total Right-Out App. Total Right-In Thru App. Total App. Total Int. Total 03:45 PM Total :00 PM :15 PM :30 PM :45 PM Total :00 PM :15 PM :30 PM :45 PM Total Grand Total Apprch % Total %
146 Turning Movement Counts (All Vehicles) Park Place Mixed-Use Development Check Point #3 Afternoon Peak-Hours Sunny, Hot File Name : Check Point #3-pm-3 Site Code : 2 Start Date : 6/14/2012 Page No : 2 Southernmost Access onto Nall Ave. Nall Avenue From North From East From South From West Start Time App. Total Right-Out App. Total Right-In Thru App. Total App. Total Int. Total Peak Hour Analysis From 03:45 PM to 05:45 PM - Peak 1 of 1 Peak Hour for Entire Intersection Begins at 05:00 PM 05:00 PM :15 PM :30 PM :45 PM Total Volume % App. Total PHF
147 Turning Movement Counts (All Vehicles) Park Place Mixed-Use Development Check Points #4 & #5 Afternoon Peak-Hours Sunny, Hot File Name : Check Points #4 & #5-pm-3 Site Code : 2 Start Date : 6/14/2012 Page No : 1 Groups Printed- Unshifted Access Drives onto 117th Street From North 117th Street From East Access Drives onto 117th Street From South 117th Street From West Start Time Right-Out #5 Thru-Out #5 Left-Out #5 Right-Out #4 App. Total Right-In #5 Thru Right-In #4 App. Total Thru-In #5 App. Total Thru Left-In #5 Left-In #4 App. Total Int. Total 03:45 PM Total :00 PM :15 PM :30 PM :45 PM Total :00 PM :15 PM :30 PM :45 PM Total Grand Total Apprch % Total %
148 Turning Movement Counts (All Vehicles) Park Place Mixed-Use Development Check Points #4 & #5 Afternoon Peak-Hours Sunny, Hot File Name : Check Points #4 & #5-pm-3 Site Code : 2 Start Date : 6/14/2012 Page No : 2 Access Drives onto 117th Street 117th Street Access Drives onto 117th Street 117th Street From North From East From South From West Start Time Right-Out #5 Thru-Out #5 Left-Out #5 Right-Out #4 App. Total Right-In #5 Thru Right-In #4 App. Total Thru-In #5 App. Total Thru Left-In #5 Left-In #4 App. Total Int. Total Peak Hour Analysis From 03:45 PM to 05:45 PM - Peak 1 of 1 Peak Hour for Entire Intersection Begins at 05:00 PM 05:00 PM :15 PM :30 PM :45 PM Total Volume % App. Total PHF
149 Turning Movement Counts (All Vehicles) Park Place Mixed-Use Development Check Points #4 & #5 Afternoon Peak-Hours Sunny, Hot File Name : 117th-Check Points #4 & #5-pm-1 Site Code : 2 Start Date : 6/12/2012 Page No : 1 Groups Printed- Unshifted Access Drives onto 117th Street From North 117th Street From East Access Drives onto 117th Street From South 117th Street From West Start Time Right-Out #5 Thru-Out #5 Left-Out #5 Right-Out #4 App. Total Right-In #5 Thru Right-In #4 App. Total Thru-In #5 App. Total Thru Left-In #5 Left-In #4 App. Total Int. Total 03:30 PM :45 PM Total :00 PM :15 PM :30 PM :45 PM Total :00 PM :15 PM :30 PM :45 PM Total Grand Total Apprch % Total %
150 Turning Movement Counts (All Vehicles) Park Place Mixed-Use Development Check Points #4 & #5 Afternoon Peak-Hours Sunny, Hot File Name : 117th-Check Points #4 & #5-pm-1 Site Code : 2 Start Date : 6/12/2012 Page No : 2 Access Drives onto 117th Street 117th Street Access Drives onto 117th Street 117th Street From North From East From South From West Start Time Right-Out #5 Thru-Out #5 Left-Out #5 Right-Out #4 App. Total Right-In #5 Thru Right-In #4 App. Total Thru-In #5 App. Total Thru Left-In #5 Left-In #4 App. Total Int. Total Peak Hour Analysis From 03:30 PM to 05:30 PM - Peak 1 of 1 Peak Hour for Entire Intersection Begins at 04:15 PM 04:15 PM :30 PM :45 PM :00 PM Total Volume % App. Total PHF
151 Turning Movement Counts (All Vehicles) Park Place Mixed-Use Development Check Points #4 & #5 Afternoon Peak-Hours Sunny, Hot File Name : 117th-Check Points #4 & #5-pm-2 Site Code : 2 Start Date : 6/14/2012 Page No : 1 Groups Printed- Unshifted Access Drives onto 117th Street From North 117th Street From East Access Drives onto 117th Street From South 117th Street From West Start Time Right-Out #5 Thru-Out #5 Left-Out #5 Right-Out #4 App. Total Right-In #5 Thru Right-In #4 App. Total Thru-In #5 App. Total Thru Left-In #5 Left-In #4 App. Total Int. Total 03:45 PM Total :00 PM :15 PM :30 PM :45 PM Total :00 PM :15 PM :30 PM :45 PM Total Grand Total Apprch % Total %
152 Turning Movement Counts (All Vehicles) Park Place Mixed-Use Development Check Points #4 & #5 Afternoon Peak-Hours Sunny, Hot File Name : 117th-Check Points #4 & #5-pm-2 Site Code : 2 Start Date : 6/14/2012 Page No : 2 Access Drives onto 117th Street 117th Street Access Drives onto 117th Street 117th Street From North From East From South From West Start Time Right-Out #5 Thru-Out #5 Left-Out #5 Right-Out #4 App. Total Right-In #5 Thru Right-In #4 App. Total Thru-In #5 App. Total Thru Left-In #5 Left-In #4 App. Total Int. Total Peak Hour Analysis From 03:45 PM to 05:45 PM - Peak 1 of 1 Peak Hour for Entire Intersection Begins at 04:30 PM 04:30 PM :45 PM :00 PM :15 PM Total Volume % App. Total PHF
153 Turning Movement Counts (All Vehicles) Park Place Mixed-Use Development Check Point #3 Afternoon Peak-Hours Sunny, Hot File Name : Nall-Check Point #3-pm-1 Site Code : 2 Start Date : 6/12/2012 Page No : 1 Groups Printed- Unshifted From North Southernmost Access onto Nall Ave. From East Nall Avenue From South From West Start Time App. Total Right-Out App. Total Right-In Thru Left Peds App. Total App. Total Int. Total 03:30 PM :45 PM Total :00 PM :15 PM :30 PM :45 PM Total :00 PM :15 PM :30 PM :45 PM Total Grand Total Apprch % Total %
154 Turning Movement Counts (All Vehicles) Park Place Mixed-Use Development Check Point #3 Afternoon Peak-Hours Sunny, Hot File Name : Nall-Check Point #3-pm-1 Site Code : 2 Start Date : 6/12/2012 Page No : 2 Southernmost Access onto Nall Ave. Nall Avenue From North From East From South From West Start Time App. Total Right-Out App. Total Right-In Thru Left Peds App. Total App. Total Int. Total Peak Hour Analysis From 03:30 PM to 05:45 PM - Peak 1 of 1 Peak Hour for Entire Intersection Begins at 04:30 PM 04:30 PM :45 PM :00 PM :15 PM Total Volume % App. Total PHF
155 Turning Movement Counts (All Vehicles) Park Place Mixed-Use Development Check Point #3 Afternoon Peak-Hours Sunny, Hot File Name : Nall-Check Point #3-pm-3 Site Code : 2 Start Date : 6/14/2012 Page No : 1 Groups Printed- Unshifted From North Southernmost Access onto Nall Ave. From East Nall Avenue From South From West Start Time App. Total Right-Out App. Total Right-In Thru App. Total App. Total Int. Total 03:45 PM Total :00 PM :15 PM :30 PM :45 PM Total :00 PM :15 PM :30 PM :45 PM Total Grand Total Apprch % Total %
156 Turning Movement Counts (All Vehicles) Park Place Mixed-Use Development Check Point #3 Afternoon Peak-Hours Sunny, Hot File Name : Nall-Check Point #3-pm-3 Site Code : 2 Start Date : 6/14/2012 Page No : 2 Southernmost Access onto Nall Ave. Nall Avenue From North From East From South From West Start Time App. Total Right-Out App. Total Right-In Thru App. Total App. Total Int. Total Peak Hour Analysis From 03:45 PM to 05:45 PM - Peak 1 of 1 Peak Hour for Entire Intersection Begins at 04:30 PM 04:30 PM :45 PM :00 PM :15 PM Total Volume % App. Total PHF
157 SITE #3 MORNING PEAK-HOURS
158 Turning Movement Counts (All Vehicles) 95th & Metcalf Mixed-Use Development Northwest Check Point Morning Peak-Hours Sunny, Mild File Name : 95 & met-nwcp-am-1-raw Site Code : 3 Start Date : 6/19/2012 Page No : 1 Northwest Check Point From North Northwest Check Point From East Groups Printed- Unshifted Northwest Check Point From South Start Time Thru Left Drives Inbound App. Total Right Thru Left App. Total Right Thru Left Drives Outbound Northwest Check Point From West App. Total Right Thru App. Total Int. Total 07:15 AM :30 AM :45 AM Total :00 AM :15 AM :30 AM :45 AM Total Grand Total Apprch % Total %
159 Turning Movement Counts (All Vehicles) 95th & Metcalf Mixed-Use Development Northwest Check Point Morning Peak-Hours Sunny, Mild File Name : 95 & met-nwcp-am-1-raw Site Code : 3 Start Date : 6/19/2012 Page No : 2 Northwest Check Point Northwest Check Point Northwest Check Point Northwest Check Point From North From East From South From West Start Time Thru Left Drives Inbound App. Total Right Thru Left App. Total Right Thru Left Drives Outbound App. Total Right Thru App. Total Int. Total Peak Hour Analysis From 07:15 AM to 08:45 AM - Peak 1 of 1 Peak Hour for Entire Intersection Begins at 08:00 AM 08:00 AM :15 AM :30 AM :45 AM Total Volume % App. Total PHF
160 Turning Movement Counts (All Vehicles) 95th & Metcalf Mixed-Use Development Southeast & Southwest Check Points Morning Peak-Hours Sunny, Mild File Name : 95 & met-swsecp-am-1-raw Site Code : 3 Start Date : 6/19/2012 Page No : 1 Southeast & Southwest Check Points From North Start Time Right Thru Left Drives Outbound Southeast & Southwest Check Points From East Groups Printed- Unshifted Southeast & Southwest Check Points From South Southeast & Southwest Check Points From West App. Total Right App. Total Thru Drives Inbound App. Total Left App. Total Int. Total 07:15 AM :30 AM :45 AM Total :00 AM :15 AM :30 AM :45 AM Total Grand Total Apprch % Total %
161 Turning Movement Counts (All Vehicles) 95th & Metcalf Mixed-Use Development Southeast & Southwest Check Points Morning Peak-Hours Sunny, Mild File Name : 95 & met-swsecp-am-1-raw Site Code : 3 Start Date : 6/19/2012 Page No : 2 Southeast & Southwest Check Points Southeast & Southwest Check Points Southeast & Southwest Check Points Southeast & Southwest Check Points From North From East From South From West Start Time Right Thru Left Drives Outbound App. Total Right App. Total Thru Drives Inbound App. Total Left App. Total Int. Total Peak Hour Analysis From 07:15 AM to 08:45 AM - Peak 1 of 1 Peak Hour for Entire Intersection Begins at 08:00 AM 08:00 AM :15 AM :30 AM :45 AM Total Volume % App. Total PHF
162 Turning Movement Counts (All Vehicles) 95th & Metcalf Mixed-Use Development Northwest Check Point Morning Peak-Hours Sunny, Mild File Name : 95 & met-nwcp-am-2-raw Site Code : 3 Start Date : 6/20/2012 Page No : 1 Northwest Check Point From North Northwest Check Point From East Groups Printed- Unshifted Northwest Check Point From South Start Time Thru Left Drives Inbound App. Total Right Thru Left App. Total Right Thru Left Drives Outbound Northwest Check Point From West App. Total Right Thru App. Total Int. Total 07:00 AM :15 AM :30 AM :45 AM Total :00 AM :15 AM :30 AM :45 AM Total Grand Total Apprch % Total %
163 Turning Movement Counts (All Vehicles) 95th & Metcalf Mixed-Use Development Northwest Check Point Morning Peak-Hours Sunny, Mild File Name : 95 & met-nwcp-am-2-raw Site Code : 3 Start Date : 6/20/2012 Page No : 2 Northwest Check Point Northwest Check Point Northwest Check Point Northwest Check Point From North From East From South From West Start Time Thru Left Drives Inbound App. Total Right Thru Left App. Total Right Thru Left Drives Outbound App. Total Right Thru App. Total Int. Total Peak Hour Analysis From 07:00 AM to 08:45 AM - Peak 1 of 1 Peak Hour for Entire Intersection Begins at 08:00 AM 08:00 AM :15 AM :30 AM :45 AM Total Volume % App. Total PHF
164 Turning Movement Counts (All Vehicles) 95th & Metcalf Mixed-Use Development Southwest Check Point Morning Peak-Hours Sunny, Mild File Name : 95 & met-swcp-am-2-raw Site Code : 3 Start Date : 6/20/2012 Page No : 1 Southwest Check Point From North Start Time Right Thru Left Drives Outbound Southwest Check Point From East Groups Printed- Unshifted Southwest Check Point From South Southwest Check Point From West App. Total Right App. Total Thru Drives Inbound App. Total Left App. Total Int. Total 07:00 AM :15 AM :30 AM :45 AM Total :00 AM :15 AM :30 AM :45 AM Total Grand Total Apprch % Total %
165 Turning Movement Counts (All Vehicles) 95th & Metcalf Mixed-Use Development Southwest Check Point Morning Peak-Hours Sunny, Mild File Name : 95 & met-swcp-am-2-raw Site Code : 3 Start Date : 6/20/2012 Page No : 2 Southwest Check Point Southwest Check Point Southwest Check Point Southwest Check Point From North From East From South From West Start Time Right Thru Left Drives Outbound App. Total Right App. Total Thru Drives Inbound App. Total Left App. Total Int. Total Peak Hour Analysis From 07:00 AM to 08:45 AM - Peak 1 of 1 Peak Hour for Entire Intersection Begins at 07:45 AM 07:45 AM :00 AM :15 AM :30 AM Total Volume % App. Total PHF
166 Turning Movement Counts (All Vehicles) 95th & Metcalf Mixed-Use Development Southeast Checkpoint Morning Peak-Hours Sunny, Mild File Name : 95 & met-secp-am-2-raw Site Code : 3 Start Date : 6/20/2012 Page No : 1 Groups Printed- Unshifted - Bank 1 Southeast Check Point From North Southeast Check Point From East Southeast Check Point From South Southeast Check Point From West Start Time Right Thru Left App. Total Right App. Total Thru App. Total Left App. Total Int. Total 07:00 AM :15 AM :30 AM :45 AM Total :00 AM :15 AM :30 AM :45 AM Total Grand Total Apprch % Total % Unshifted % Unshifted Bank % Bank
167 Turning Movement Counts (All Vehicles) 95th & Metcalf Mixed-Use Development Southeast Checkpoint Morning Peak-Hours Sunny, Mild File Name : 95 & met-secp-am-2-raw Site Code : 3 Start Date : 6/20/2012 Page No : 2 Southeast Check Point Southeast Check Point Southeast Check Point Southeast Check Point From North From East From South From West Start Time Right Thru Left App. Total Right App. Total Thru App. Total Left App. Total Int. Total Peak Hour Analysis From 07:00 AM to 08:45 AM - Peak 1 of 1 Peak Hour for Entire Intersection Begins at 07:45 AM 07:45 AM :00 AM :15 AM :30 AM Total Volume % App. Total PHF
168 Turning Movement Counts (All Vehicles) 95th & Metcalf Mixed-Use Development Northwest Check Point Morning Peak-Hours Sunny, Mild File Name : 95 & met-nwcp-am-3-raw Site Code : 3 Start Date : 6/21/2012 Page No : 1 Northwest Check Point From North Northwest Check Point From East Groups Printed- Unshifted Northwest Check Point From South Start Time Thru Left Drives Inbound App. Total Right Thru Left App. Total Right Thru Left Drives Outbound Northwest Check Point From West App. Total Right Thru App. Total Int. Total 07:00 AM :15 AM :30 AM :45 AM Total :00 AM :15 AM :30 AM :45 AM Total Grand Total Apprch % Total %
169 Turning Movement Counts (All Vehicles) 95th & Metcalf Mixed-Use Development Northwest Check Point Morning Peak-Hours Sunny, Mild File Name : 95 & met-nwcp-am-3-raw Site Code : 3 Start Date : 6/21/2012 Page No : 2 Northwest Check Point Northwest Check Point Northwest Check Point Northwest Check Point From North From East From South From West Start Time Thru Left Drives Inbound App. Total Right Thru Left App. Total Right Thru Left Drives Outbound App. Total Right Thru App. Total Int. Total Peak Hour Analysis From 07:00 AM to 08:45 AM - Peak 1 of 1 Peak Hour for Entire Intersection Begins at 08:00 AM 08:00 AM :15 AM :30 AM :45 AM Total Volume % App. Total PHF
170 Turning Movement Counts (All Vehicles) 95th & Metcalf Mixed-Use Development Southwest Check Point Morning Peak-Hours Sunny, Mild File Name : 95 & met-swcp-am-3-raw Site Code : 3 Start Date : 6/21/2012 Page No : 1 Southwest Check Point From North Start Time Right Thru Left Drives Outbound Southwest Check Point From East Groups Printed- Unshifted Southwest Check Point From South Southwest Check Point From West App. Total Right App. Total Thru Drives Inbound App. Total Left App. Total Int. Total 07:00 AM :15 AM :30 AM :45 AM Total :00 AM :15 AM :30 AM :45 AM Total Grand Total Apprch % Total %
171 Turning Movement Counts (All Vehicles) 95th & Metcalf Mixed-Use Development Southwest Check Point Morning Peak-Hours Sunny, Mild File Name : 95 & met-swcp-am-3-raw Site Code : 3 Start Date : 6/21/2012 Page No : 2 Southwest Check Point Southwest Check Point Southwest Check Point Southwest Check Point From North From East From South From West Start Time Right Thru Left Drives Outbound App. Total Right App. Total Thru Drives Inbound App. Total Left App. Total Int. Total Peak Hour Analysis From 07:00 AM to 08:45 AM - Peak 1 of 1 Peak Hour for Entire Intersection Begins at 07:45 AM 07:45 AM :00 AM :15 AM :30 AM Total Volume % App. Total PHF
172 Turning Movement Counts (All Vehicles) 95th & Metcalf Mixed-Use Development Southeast Checkpoint Morning Peak-Hours Sunny, Mild File Name : 95 & met-secp-am-3-raw Site Code : 3 Start Date : 6/21/2012 Page No : 1 Groups Printed- Unshifted - Bank 1 Southeast Check Point From North Southeast Check Point From East Southeast Check Point From South Southeast Check Point From West Start Time Right Thru Left App. Total Right App. Total Thru App. Total Left App. Total Int. Total 07:00 AM :15 AM :30 AM :45 AM Total :00 AM :15 AM :30 AM :45 AM Total Grand Total Apprch % Total % Unshifted % Unshifted Bank % Bank
173 Turning Movement Counts (All Vehicles) 95th & Metcalf Mixed-Use Development Southeast Checkpoint Morning Peak-Hours Sunny, Mild File Name : 95 & met-secp-am-3-raw Site Code : 3 Start Date : 6/21/2012 Page No : 2 Southeast Check Point Southeast Check Point Southeast Check Point Southeast Check Point From North From East From South From West Start Time Right Thru Left App. Total Right App. Total Thru App. Total Left App. Total Int. Total Peak Hour Analysis From 07:00 AM to 08:45 AM - Peak 1 of 1 Peak Hour for Entire Intersection Begins at 08:00 AM 08:00 AM :15 AM :30 AM :45 AM Total Volume % App. Total PHF
174 SITE #3 AFTERNOON PEAK-HOURS
175 Turning Movement Counts (All Vehicles) 95th & Metcalf Mixed-Use Development Northwest Check Point Afternoon Peak-Hours Sunny, Hot File Name : 95 & met-nwcp-pm-1-raw Site Code : 3 Start Date : 6/20/2012 Page No : 1 Northwest Check Point From North Northwest Check Point From East Groups Printed- Unshifted Northwest Check Point From South Start Time Thru Left Drives Inbound App. Total Right Thru Left App. Total Right Thru Left Drives Outbound Northwest Check Point From West App. Total Right Thru App. Total Int. Total 04:00 PM :15 PM :30 PM :45 PM Total :00 PM :15 PM :30 PM :45 PM Total Grand Total Apprch % Total %
176 Turning Movement Counts (All Vehicles) 95th & Metcalf Mixed-Use Development Northwest Check Point Afternoon Peak-Hours Sunny, Hot File Name : 95 & met-nwcp-pm-1-raw Site Code : 3 Start Date : 6/20/2012 Page No : 2 Northwest Check Point Northwest Check Point Northwest Check Point Northwest Check Point From North From East From South From West Start Time Thru Left Drives Inbound App. Total Right Thru Left App. Total Right Thru Left Drives Outbound App. Total Right Thru App. Total Int. Total Peak Hour Analysis From 04:00 PM to 05:45 PM - Peak 1 of 1 Peak Hour for Entire Intersection Begins at 04:45 PM 04:45 PM :00 PM :15 PM :30 PM Total Volume % App. Total PHF
177 Turning Movement Counts (All Vehicles) 95th & Metcalf Mixed-Use Development Southwest Check Point Afternoon Peak-Hours Sunny, Hot File Name : 95 & met-swcp-pm-1-raw Site Code : 3 Start Date : 6/20/2012 Page No : 1 Southwest Check Point From North Start Time Right Thru Left Drives Outbound Southwest Check Point From East Groups Printed- Unshifted Southwest Check Point From South Southwest Check Point From West App. Total Right App. Total Thru Drives Inbound App. Total Left App. Total Int. Total 04:00 PM :15 PM :30 PM :45 PM Total :00 PM :15 PM :30 PM :45 PM Total Grand Total Apprch % Total %
178 Turning Movement Counts (All Vehicles) 95th & Metcalf Mixed-Use Development Southwest Check Point Afternoon Peak-Hours Sunny, Hot File Name : 95 & met-swcp-pm-1-raw Site Code : 3 Start Date : 6/20/2012 Page No : 2 Southwest Check Point Southwest Check Point Southwest Check Point Southwest Check Point From North From East From South From West Start Time Right Thru Left Drives Outbound App. Total Right App. Total Thru Drives Inbound App. Total Left App. Total Int. Total Peak Hour Analysis From 04:00 PM to 05:45 PM - Peak 1 of 1 Peak Hour for Entire Intersection Begins at 04:30 PM 04:30 PM :45 PM :00 PM :15 PM Total Volume % App. Total PHF
179 Turning Movement Counts (All Vehicles) 95th & Metcalf Mixed-Use Development Southeast Check Point Afternoon Peak-Hours Sunny, Hot File Name : 95 & met-secp-pm-1-raw Site Code : 3 Start Date : 6/20/2012 Page No : 1 Groups Printed- Unshifted Southeast Check Point From North Southeast Check Point From East Southeast Check Point From South Southeast Check Point From West Start Time Right Thru Left App. Total Right App. Total Thru App. Total Left App. Total Int. Total 04:00 PM :15 PM :30 PM :45 PM Total :00 PM :15 PM :30 PM :45 PM Total Grand Total Apprch % Total %
180 Turning Movement Counts (All Vehicles) 95th & Metcalf Mixed-Use Development Southeast Check Point Afternoon Peak-Hours Sunny, Hot File Name : 95 & met-secp-pm-1-raw Site Code : 3 Start Date : 6/20/2012 Page No : 2 Southeast Check Point Southeast Check Point Southeast Check Point Southeast Check Point From North From East From South From West Start Time Right Thru Left App. Total Right App. Total Thru App. Total Left App. Total Int. Total Peak Hour Analysis From 04:00 PM to 05:45 PM - Peak 1 of 1 Peak Hour for Entire Intersection Begins at 05:00 PM 05:00 PM :15 PM :30 PM :45 PM Total Volume % App. Total PHF
181 Turning Movement Counts (All Vehicles) 95th & Metcalf Mixed-Use Development Northwest Check Point Afternoon Peak-Hours Sunny, Hot File Name : 95 & met-nwcp-pm-2-raw Site Code : 3 Start Date : 6/26/2012 Page No : 1 Northwest Check Point From North Northwest Check Point From East Groups Printed- Unshifted Northwest Check Point From South Start Time Thru Left Drives Inbound App. Total Right Thru Left App. Total Right Thru Left Drives Outbound Northwest Check Point From West App. Total Right Thru App. Total Int. Total 04:00 PM :15 PM :30 PM :45 PM Total :00 PM :15 PM :30 PM :45 PM Total Grand Total Apprch % Total %
182 Turning Movement Counts (All Vehicles) 95th & Metcalf Mixed-Use Development Northwest Check Point Afternoon Peak-Hours Sunny, Hot File Name : 95 & met-nwcp-pm-2-raw Site Code : 3 Start Date : 6/26/2012 Page No : 2 Northwest Check Point Northwest Check Point Northwest Check Point Northwest Check Point From North From East From South From West Start Time Thru Left Drives Inbound App. Total Right Thru Left App. Total Right Thru Left Drives Outbound App. Total Right Thru App. Total Int. Total Peak Hour Analysis From 04:00 PM to 05:45 PM - Peak 1 of 1 Peak Hour for Entire Intersection Begins at 04:45 PM 04:45 PM :00 PM :15 PM :30 PM Total Volume % App. Total PHF
183 Turning Movement Counts (All Vehicles) 95th & Metcalf Mixed-Use Development Southwest Check Point Afternoon Peak-Hours Sunny, Hot File Name : 95 & met-swcp-pm-2-raw Site Code : 3 Start Date : 6/26/2012 Page No : 1 Southwest Check point From North Start Time Right Thru Left Drives Outbound Southwest Check point From East Groups Printed- Unshifted Southwest Check point From South Southwest Check point From West App. Total Right App. Total Thru Drives Inbound App. Total Left App. Total Int. Total 04:00 PM :15 PM :30 PM :45 PM Total :00 PM :15 PM :30 PM :45 PM Total Grand Total Apprch % Total %
184 Turning Movement Counts (All Vehicles) 95th & Metcalf Mixed-Use Development Southwest Check Point Afternoon Peak-Hours Sunny, Hot File Name : 95 & met-swcp-pm-2-raw Site Code : 3 Start Date : 6/26/2012 Page No : 2 Southwest Check point Southwest Check point Southwest Check point Southwest Check point From North From East From South From West Start Time Right Thru Left Drives Outbound App. Total Right App. Total Thru Drives Inbound App. Total Left App. Total Int. Total Peak Hour Analysis From 04:00 PM to 05:45 PM - Peak 1 of 1 Peak Hour for Entire Intersection Begins at 04:15 PM 04:15 PM :30 PM :45 PM :00 PM Total Volume % App. Total PHF
185 Turning Movement Counts (All Vehicles) 95th & Metcalf Mixed-Use Development Southeast Check Point Afternoon Peak-Hours Sunny, Hot File Name : 95 & met-secp-pm-2-raw Site Code : 3 Start Date : 6/26/2012 Page No : 1 Groups Printed- Unshifted Southeast Check Point From North Southeast Check Point From East Southeast Check Point From South Southeast Check Point From West Start Time Right Thru Left App. Total Right App. Total Thru App. Total Left App. Total Int. Total 04:00 PM :15 PM :30 PM :45 PM Total :00 PM :15 PM :30 PM :45 PM Total Grand Total Apprch % Total %
186 Turning Movement Counts (All Vehicles) 95th & Metcalf Mixed-Use Development Southeast Check Point Afternoon Peak-Hours Sunny, Hot File Name : 95 & met-secp-pm-2-raw Site Code : 3 Start Date : 6/26/2012 Page No : 2 Southeast Check Point Southeast Check Point Southeast Check Point Southeast Check Point From North From East From South From West Start Time Right Thru Left App. Total Right App. Total Thru App. Total Left App. Total Int. Total Peak Hour Analysis From 04:00 PM to 05:45 PM - Peak 1 of 1 Peak Hour for Entire Intersection Begins at 05:00 PM 05:00 PM :15 PM :30 PM :45 PM Total Volume % App. Total PHF
187 Turning Movement Counts (All Vehicles) 95th & Metcalf Mixed-Use Development Northwest Check Point Afternoon Peak-Hours Sunny, Hot File Name : 95 & met-nwcp-pm-3-raw Site Code : 3 Start Date : 6/27/2012 Page No : 1 Northwest Check Point From North Northwest Check Point From East Groups Printed- Unshifted Northwest Check Point From South Start Time Thru Left Drives Inbound App. Total Right Thru Left App. Total Right Thru Left Drives Outbound Northwest Check Point From West App. Total Right Thru App. Total Int. Total 04:00 PM :15 PM :30 PM :45 PM Total :00 PM :15 PM :30 PM :45 PM Total Grand Total Apprch % Total %
188 Turning Movement Counts (All Vehicles) 95th & Metcalf Mixed-Use Development Northwest Check Point Afternoon Peak-Hours Sunny, Hot File Name : 95 & met-nwcp-pm-3-raw Site Code : 3 Start Date : 6/27/2012 Page No : 2 Northwest Check Point Northwest Check Point Northwest Check Point Northwest Check Point From North From East From South From West Start Time Thru Left Drives Inbound App. Total Right Thru Left App. Total Right Thru Left Drives Outbound App. Total Right Thru App. Total Int. Total Peak Hour Analysis From 04:00 PM to 05:45 PM - Peak 1 of 1 Peak Hour for Entire Intersection Begins at 04:45 PM 04:45 PM :00 PM :15 PM :30 PM Total Volume % App. Total PHF
189 Turning Movement Counts (All Vehicles) 95th & Metcalf Mixed-Use Development Southwest Check Point Afternoon Peak-Hours Sunny, Hot File Name : 95 & met-swcp-pm-3-raw Site Code : 3 Start Date : 6/27/2012 Page No : 1 Southwest Checkpoint From North Start Time Right Thru Left Drives Outbound Southwest Checkpoint From East Groups Printed- Unshifted Southwest Checkpoint From South Southwest Checkpoint From West App. Total Right App. Total Thru Drives Inbound App. Total Left App. Total Int. Total 04:00 PM :15 PM :30 PM :45 PM Total :00 PM :15 PM :30 PM :45 PM Total Grand Total Apprch % Total %
190 Turning Movement Counts (All Vehicles) 95th & Metcalf Mixed-Use Development Southwest Check Point Afternoon Peak-Hours Sunny, Hot File Name : 95 & met-swcp-pm-3-raw Site Code : 3 Start Date : 6/27/2012 Page No : 2 Southwest Checkpoint Southwest Checkpoint Southwest Checkpoint Southwest Checkpoint From North From East From South From West Start Time Right Thru Left Drives Outbound App. Total Right App. Total Thru Drives Inbound App. Total Left App. Total Int. Total Peak Hour Analysis From 04:00 PM to 05:45 PM - Peak 1 of 1 Peak Hour for Entire Intersection Begins at 04:15 PM 04:15 PM :30 PM :45 PM :00 PM Total Volume % App. Total PHF
191 Turning Movement Counts (All Vehicles) 95th & Metcalf Mixed-Use Development Southeast Check Point Afternoon Peak-Hours Sunny, Hot File Name : 95 & met-secp-pm-3-raw Site Code : 3 Start Date : 6/27/2012 Page No : 1 Groups Printed- Unshifted Southeast Check Point From North Southeast Check Point From East Southeast Check Point From South Southeast Check Point From West Start Time Right Thru Left App. Total Right App. Total Thru App. Total Left App. Total Int. Total 04:00 PM :15 PM :30 PM :45 PM Total :00 PM :15 PM :30 PM :45 PM Total Grand Total Apprch % Total %
192 Turning Movement Counts (All Vehicles) 95th & Metcalf Mixed-Use Development Southeast Check Point Afternoon Peak-Hours Sunny, Hot File Name : 95 & met-secp-pm-3-raw Site Code : 3 Start Date : 6/27/2012 Page No : 2 Southeast Check Point Southeast Check Point Southeast Check Point Southeast Check Point From North From East From South From West Start Time Right Thru Left App. Total Right App. Total Thru App. Total Left App. Total Int. Total Peak Hour Analysis From 04:00 PM to 05:45 PM - Peak 1 of 1 Peak Hour for Entire Intersection Begins at 05:00 PM 05:00 PM :15 PM :30 PM :45 PM Total Volume % App. Total PHF
193 APPENDIX C SUMMARY OF TRIP GENERATION ESTIMATIONS (USING ITE TRIP GENERATION MANUAL, 8 TH EDITION)
194 SITE #1: MISSION FARMS
195 Summary of Trip Generation Calculation For 42 Dwelling Units of Residential Condominium / Townhouse July 13, 2012 Average Standard Adjustment Driveway Rate Deviation Factor Volume Avg. Weekday 2-Way Volume AM Peak Hour Enter AM Peak Hour Exit AM Peak Hour Total PM Peak Hour Enter PM Peak Hour Exit PM Peak Hour Total AM Pk Hr, Generator, Enter AM Pk Hr, Generator, Exit AM Pk Hr, Generator, Total PM Pk Hr, Generator, Enter PM Pk Hr, Generator, Exit PM Pk Hr, Generator, Total Saturday 2-Way Volume Saturday Peak Hour Enter Saturday Peak Hour Exit Saturday Peak Hour Total Sunday 2-Way Volume Sunday Peak Hour Enter Sunday Peak Hour Exit Sunday Peak Hour Total Note: A zero indicates no data available. Source: Institute of Transportation Engineers Trip Generation, 8th Edition, TRIP GENERATION BY MICROTRANS
196 Summary of Trip Generation Rates For 42 Dwelling Units of Residential Condominium / Townhouse July 13, 2012 Avg. Min. Max. No. Trip Trip Trip Std. of Rate Rate Rate Dev. Studies Avg. Weekday 2-Way Volume AM Peak Hour Enter AM Peak Hour Exit AM Peak Hour Total PM Peak Hour Enter PM Peak Hour Exit PM Peak Hour Total AM Pk Hr, Generator, Enter AM Pk Hr, Generator, Exit AM Pk Hr, Generator, Total PM Pk Hr, Generator, Enter PM Pk Hr, Generator, Exit PM Pk Hr, Generator, Total Saturday 2-Way Volume Saturday Peak Hour Enter Saturday Peak Hour Exit Saturday Peak Hour Total Sunday 2-Way Volume Sunday Peak Hour Enter Sunday Peak Hour Exit Sunday Peak Hour Total Note: A zero indicates no data available. Source: Institute of Transportation Engineers Trip Generation, 8th Edition, TRIP GENERATION BY MICROTRANS
197 Summary of Trip Generation Calculation For 42 Dwelling Units of Residential Condominium / Townhouse July 13, 2012 Average Standard Adjustment Driveway Rate Deviation Factor Volume Avg. Weekday 2-Way Volume AM Peak Hour Enter AM Peak Hour Exit AM Peak Hour Total PM Peak Hour Enter PM Peak Hour Exit PM Peak Hour Total AM Pk Hr, Generator, Enter AM Pk Hr, Generator, Exit AM Pk Hr, Generator, Total PM Pk Hr, Generator, Enter PM Pk Hr, Generator, Exit PM Pk Hr, Generator, Total Saturday 2-Way Volume Saturday Peak Hour Enter Saturday Peak Hour Exit Saturday Peak Hour Total Sunday 2-Way Volume Sunday Peak Hour Enter Sunday Peak Hour Exit Sunday Peak Hour Total Note: A zero indicates no data available. The above rates were calculated from these equations: 24-Hr. 2-Way Volume: LN(T) =.87LN(X) , R^2 = AM Peak Hr. Total: LN(T) =.8LN(X) +.26 R^2 = 0.76, 0.17 Enter, 0.83 Exit 4-6 PM Peak Hr. Total: LN(T) =.82LN(X) +.32 R^2 = 0.8, 0.67 Enter, 0.33 Exit AM Gen Pk Hr. Total: LN(T) =.82LN(X) +.15 R^2 = 0.8, 0.19 Enter, 0.81 Exit PM Gen Pk Hr. Total: T =.34(X) R^2 = 0.82, 0.64 Enter, 0.36 Exit Sat. 2-Way Volume: T = 3.62(X) , R^2 = 0.84 Sat. Pk Hr. Total: T =.29(X) R^2 = 0.84, 0.54 Enter, 0.46 Exit Sun. 2-Way Volume: T = 3.13(X) , R^2 = 0.88 Sun. Pk Hr. Total: T =.23(X) R^2 = 0.78, 0.49 Enter, 0.51 Exit Source: Institute of Transportation Engineers Trip Generation, 8th Edition, TRIP GENERATION BY MICROTRANS
198 Mission Farms Mixed-Use Development Summary of Trip Generation Calculation For Th.Sq.Ft. GFA of General Office Building July 05, 2012 Average Standard Adjustment Driveway Rate Deviation Factor Volume Avg. Weekday 2-Way Volume AM Peak Hour Enter AM Peak Hour Exit AM Peak Hour Total PM Peak Hour Enter PM Peak Hour Exit PM Peak Hour Total AM Pk Hr, Generator, Enter AM Pk Hr, Generator, Exit AM Pk Hr, Generator, Total PM Pk Hr, Generator, Enter PM Pk Hr, Generator, Exit PM Pk Hr, Generator, Total Saturday 2-Way Volume Saturday Peak Hour Enter Saturday Peak Hour Exit Saturday Peak Hour Total Sunday 2-Way Volume Sunday Peak Hour Enter Sunday Peak Hour Exit Sunday Peak Hour Total Note: A zero indicates no data available. Source: Institute of Transportation Engineers Trip Generation, 8th Edition, TRIP GENERATION BY MICROTRANS
199 Mission Farms Mixed-Use Development Summary of Trip Generation Rates For Th.Sq.Ft. GFA of General Office Building July 05, 2012 Avg. Min. Max. No. Trip Trip Trip Std. of Rate Rate Rate Dev. Studies Avg. Weekday 2-Way Volume AM Peak Hour Enter AM Peak Hour Exit AM Peak Hour Total PM Peak Hour Enter PM Peak Hour Exit PM Peak Hour Total AM Pk Hr, Generator, Enter AM Pk Hr, Generator, Exit AM Pk Hr, Generator, Total PM Pk Hr, Generator, Enter PM Pk Hr, Generator, Exit PM Pk Hr, Generator, Total Saturday 2-Way Volume Saturday Peak Hour Enter Saturday Peak Hour Exit Saturday Peak Hour Total Sunday 2-Way Volume Sunday Peak Hour Enter Sunday Peak Hour Exit Sunday Peak Hour Total Note: A zero indicates no data available. Source: Institute of Transportation Engineers Trip Generation, 8th Edition, TRIP GENERATION BY MICROTRANS
200 Mission Farms Mixed-Use Development Summary of Trip Generation Calculation For Th.Sq.Ft. GFA of General Office Building July 05, 2012 Average Standard Adjustment Driveway Rate Deviation Factor Volume Avg. Weekday 2-Way Volume AM Peak Hour Enter AM Peak Hour Exit AM Peak Hour Total PM Peak Hour Enter PM Peak Hour Exit PM Peak Hour Total AM Pk Hr, Generator, Enter AM Pk Hr, Generator, Exit AM Pk Hr, Generator, Total PM Pk Hr, Generator, Enter PM Pk Hr, Generator, Exit PM Pk Hr, Generator, Total Saturday 2-Way Volume Saturday Peak Hour Enter Saturday Peak Hour Exit Saturday Peak Hour Total Sunday 2-Way Volume Sunday Peak Hour Enter Sunday Peak Hour Exit Sunday Peak Hour Total Note: A zero indicates no data available. The above rates were calculated from these equations: 24-Hr. 2-Way Volume: LN(T) =.77LN(X) , R^2 = AM Peak Hr. Total: LN(T) =.8LN(X) R^2 = 0.83, 0.88 Enter, 0.12 Exit 4-6 PM Peak Hr. Total: T = 1.12(X) R^2 = 0.82, 0.17 Enter, 0.83 Exit AM Gen Pk Hr. Total: LN(T) =.8LN(X) R^2 = 0.83, 0.88 Enter, 0.12 Exit PM Gen Pk Hr. Total: T = 1.12(X) R^2 = 0.82, 0.17 Enter, 0.83 Exit Sat. 2-Way Volume: T = 2.14(X) , R^2 = 0.66 Sat. Pk Hr. Total: LN(T) =.81LN(X) R^2 = 0.59, 0.54 Enter, 0.46 Exit Sun. 2-Way Volume: LN(T) =.86LN(X) +.31, R^2 = 0.5 Sun. Pk Hr. Total: LN(T) =.61LN(X) R^2 = 0.56, 0.58 Enter, 0.42 Exit Source: Institute of Transportation Engineers Trip Generation, 8th Edition, TRIP GENERATION BY MICROTRANS
201 Mission Farms Mixed-Use Development Summary of Trip Generation Calculation For Th.Sq.Ft. GLA of Specialty Retail Center July 11, 2012 Average Standard Adjustment Driveway Rate Deviation Factor Volume Avg. Weekday 2-Way Volume AM Peak Hour Enter AM Peak Hour Exit AM Peak Hour Total PM Peak Hour Enter PM Peak Hour Exit PM Peak Hour Total AM Pk Hr, Generator, Enter AM Pk Hr, Generator, Exit AM Pk Hr, Generator, Total PM Pk Hr, Generator, Enter PM Pk Hr, Generator, Exit PM Pk Hr, Generator, Total Saturday 2-Way Volume Saturday Peak Hour Enter Saturday Peak Hour Exit Saturday Peak Hour Total Sunday 2-Way Volume Sunday Peak Hour Enter Sunday Peak Hour Exit Sunday Peak Hour Total Note: A zero indicates no data available. Source: Institute of Transportation Engineers Trip Generation, 8th Edition, TRIP GENERATION BY MICROTRANS
202 Mission Farms Mixed-Use Development Summary of Trip Generation Rates For Th.Sq.Ft. GLA of Specialty Retail Center July 11, 2012 Avg. Min. Max. No. Trip Trip Trip Std. of Rate Rate Rate Dev. Studies Avg. Weekday 2-Way Volume AM Peak Hour Enter AM Peak Hour Exit AM Peak Hour Total PM Peak Hour Enter PM Peak Hour Exit PM Peak Hour Total AM Pk Hr, Generator, Enter AM Pk Hr, Generator, Exit AM Pk Hr, Generator, Total PM Pk Hr, Generator, Enter PM Pk Hr, Generator, Exit PM Pk Hr, Generator, Total Saturday 2-Way Volume Saturday Peak Hour Enter Saturday Peak Hour Exit Saturday Peak Hour Total Sunday 2-Way Volume Sunday Peak Hour Enter Sunday Peak Hour Exit Sunday Peak Hour Total Note: A zero indicates no data available. Source: Institute of Transportation Engineers Trip Generation, 8th Edition, TRIP GENERATION BY MICROTRANS
203 Mission Farms Mixed-Use Development Summary of Trip Generation Calculation For 2 Drive-In Lanes of Drive-in Bank July 11, 2012 Average Standard Adjustment Driveway Rate Deviation Factor Volume Avg. Weekday 2-Way Volume AM Peak Hour Enter AM Peak Hour Exit AM Peak Hour Total PM Peak Hour Enter PM Peak Hour Exit PM Peak Hour Total AM Pk Hr, Generator, Enter AM Pk Hr, Generator, Exit AM Pk Hr, Generator, Total PM Pk Hr, Generator, Enter PM Pk Hr, Generator, Exit PM Pk Hr, Generator, Total Saturday 2-Way Volume Saturday Peak Hour Enter Saturday Peak Hour Exit Saturday Peak Hour Total Sunday 2-Way Volume Sunday Peak Hour Enter Sunday Peak Hour Exit Sunday Peak Hour Total Note: A zero indicates no data available. Source: Institute of Transportation Engineers Trip Generation, 8th Edition, TRIP GENERATION BY MICROTRANS
204 Mission Farms Mixed-Use Development Summary of Trip Generation Rates For 2 Drive-In Lanes of Drive-in Bank July 11, 2012 Avg. Min. Max. No. Trip Trip Trip Std. of Rate Rate Rate Dev. Studies Avg. Weekday 2-Way Volume AM Peak Hour Enter AM Peak Hour Exit AM Peak Hour Total PM Peak Hour Enter PM Peak Hour Exit PM Peak Hour Total AM Pk Hr, Generator, Enter AM Pk Hr, Generator, Exit AM Pk Hr, Generator, Total PM Pk Hr, Generator, Enter PM Pk Hr, Generator, Exit PM Pk Hr, Generator, Total Saturday 2-Way Volume Saturday Peak Hour Enter Saturday Peak Hour Exit Saturday Peak Hour Total Sunday 2-Way Volume Sunday Peak Hour Enter Sunday Peak Hour Exit Sunday Peak Hour Total Note: A zero indicates no data available. Source: Institute of Transportation Engineers Trip Generation, 8th Edition, TRIP GENERATION BY MICROTRANS
205 Mission Farms Mixed-Use Development Summary of Trip Generation Calculation For Th.Sq.Ft. GFA of Quality Restaurant July 11, 2012 Average Standard Adjustment Driveway Rate Deviation Factor Volume Avg. Weekday 2-Way Volume AM Peak Hour Enter AM Peak Hour Exit AM Peak Hour Total PM Peak Hour Enter PM Peak Hour Exit PM Peak Hour Total AM Pk Hr, Generator, Enter AM Pk Hr, Generator, Exit AM Pk Hr, Generator, Total PM Pk Hr, Generator, Enter PM Pk Hr, Generator, Exit PM Pk Hr, Generator, Total Saturday 2-Way Volume Saturday Peak Hour Enter Saturday Peak Hour Exit Saturday Peak Hour Total Sunday 2-Way Volume Sunday Peak Hour Enter Sunday Peak Hour Exit Sunday Peak Hour Total Note: A zero indicates no data available. Source: Institute of Transportation Engineers Trip Generation, 8th Edition, TRIP GENERATION BY MICROTRANS
206 Mission Farms Mixed-Use Development Summary of Trip Generation Rates For Th.Sq.Ft. GFA of Quality Restaurant July 11, 2012 Avg. Min. Max. No. Trip Trip Trip Std. of Rate Rate Rate Dev. Studies Avg. Weekday 2-Way Volume AM Peak Hour Enter AM Peak Hour Exit AM Peak Hour Total PM Peak Hour Enter PM Peak Hour Exit PM Peak Hour Total AM Pk Hr, Generator, Enter AM Pk Hr, Generator, Exit AM Pk Hr, Generator, Total PM Pk Hr, Generator, Enter PM Pk Hr, Generator, Exit PM Pk Hr, Generator, Total Saturday 2-Way Volume Saturday Peak Hour Enter Saturday Peak Hour Exit Saturday Peak Hour Total Sunday 2-Way Volume Sunday Peak Hour Enter Sunday Peak Hour Exit Sunday Peak Hour Total Note: A zero indicates no data available. Source: Institute of Transportation Engineers Trip Generation, 8th Edition, TRIP GENERATION BY MICROTRANS
207 Mission Farms Mixed-Use Development Summary of Trip Generation Calculation For Th.Sq.Ft. GFA of Quality Restaurant July 11, 2012 Average Standard Adjustment Driveway Rate Deviation Factor Volume Avg. Weekday 2-Way Volume AM Peak Hour Enter AM Peak Hour Exit AM Peak Hour Total PM Peak Hour Enter PM Peak Hour Exit PM Peak Hour Total AM Pk Hr, Generator, Enter AM Pk Hr, Generator, Exit AM Pk Hr, Generator, Total PM Pk Hr, Generator, Enter PM Pk Hr, Generator, Exit PM Pk Hr, Generator, Total Saturday 2-Way Volume Saturday Peak Hour Enter Saturday Peak Hour Exit Saturday Peak Hour Total Sunday 2-Way Volume Sunday Peak Hour Enter Sunday Peak Hour Exit Sunday Peak Hour Total Note: A zero indicates no data available. Source: Institute of Transportation Engineers Trip Generation, 8th Edition, TRIP GENERATION BY MICROTRANS
208 Mission Farms Mixed-Use Development Summary of Trip Generation Rates For Th.Sq.Ft. GFA of Quality Restaurant July 11, 2012 Avg. Min. Max. No. Trip Trip Trip Std. of Rate Rate Rate Dev. Studies Avg. Weekday 2-Way Volume AM Peak Hour Enter AM Peak Hour Exit AM Peak Hour Total PM Peak Hour Enter PM Peak Hour Exit PM Peak Hour Total AM Pk Hr, Generator, Enter AM Pk Hr, Generator, Exit AM Pk Hr, Generator, Total PM Pk Hr, Generator, Enter PM Pk Hr, Generator, Exit PM Pk Hr, Generator, Total Saturday 2-Way Volume Saturday Peak Hour Enter Saturday Peak Hour Exit Saturday Peak Hour Total Sunday 2-Way Volume Sunday Peak Hour Enter Sunday Peak Hour Exit Sunday Peak Hour Total Note: A zero indicates no data available. Source: Institute of Transportation Engineers Trip Generation, 8th Edition, TRIP GENERATION BY MICROTRANS
209 Mission Farms Mixed-Use Development Summary of Trip Generation Calculation For Th.Sq.Ft. GFA of Quality Restaurant July 11, 2012 Average Standard Adjustment Driveway Rate Deviation Factor Volume Avg. Weekday 2-Way Volume AM Peak Hour Enter AM Peak Hour Exit AM Peak Hour Total PM Peak Hour Enter PM Peak Hour Exit PM Peak Hour Total AM Pk Hr, Generator, Enter AM Pk Hr, Generator, Exit AM Pk Hr, Generator, Total PM Pk Hr, Generator, Enter PM Pk Hr, Generator, Exit PM Pk Hr, Generator, Total Saturday 2-Way Volume Saturday Peak Hour Enter Saturday Peak Hour Exit Saturday Peak Hour Total Sunday 2-Way Volume Sunday Peak Hour Enter Sunday Peak Hour Exit Sunday Peak Hour Total Note: A zero indicates no data available. Source: Institute of Transportation Engineers Trip Generation, 8th Edition, TRIP GENERATION BY MICROTRANS
210 Mission Farms Mixed-Use Development Summary of Trip Generation Rates For Th.Sq.Ft. GFA of Quality Restaurant July 11, 2012 Avg. Min. Max. No. Trip Trip Trip Std. of Rate Rate Rate Dev. Studies Avg. Weekday 2-Way Volume AM Peak Hour Enter AM Peak Hour Exit AM Peak Hour Total PM Peak Hour Enter PM Peak Hour Exit PM Peak Hour Total AM Pk Hr, Generator, Enter AM Pk Hr, Generator, Exit AM Pk Hr, Generator, Total PM Pk Hr, Generator, Enter PM Pk Hr, Generator, Exit PM Pk Hr, Generator, Total Saturday 2-Way Volume Saturday Peak Hour Enter Saturday Peak Hour Exit Saturday Peak Hour Total Sunday 2-Way Volume Sunday Peak Hour Enter Sunday Peak Hour Exit Sunday Peak Hour Total Note: A zero indicates no data available. Source: Institute of Transportation Engineers Trip Generation, 8th Edition, TRIP GENERATION BY MICROTRANS
211 Mission Farms Mixed-Use Development Summary of Trip Generation Calculation For Th.Sq.Ft. GFA of High Turnover (Sit-Down) Restaurant July 11, 2012 Average Standard Adjustment Driveway Rate Deviation Factor Volume Avg. Weekday 2-Way Volume AM Peak Hour Enter AM Peak Hour Exit AM Peak Hour Total PM Peak Hour Enter PM Peak Hour Exit PM Peak Hour Total AM Pk Hr, Generator, Enter AM Pk Hr, Generator, Exit AM Pk Hr, Generator, Total PM Pk Hr, Generator, Enter PM Pk Hr, Generator, Exit PM Pk Hr, Generator, Total Saturday 2-Way Volume Saturday Peak Hour Enter Saturday Peak Hour Exit Saturday Peak Hour Total Sunday 2-Way Volume Sunday Peak Hour Enter Sunday Peak Hour Exit Sunday Peak Hour Total Note: A zero indicates no data available. Source: Institute of Transportation Engineers Trip Generation, 8th Edition, TRIP GENERATION BY MICROTRANS
212 Mission Farms Mixed-Use Development Summary of Trip Generation Rates For Th.Sq.Ft. GFA of High Turnover (Sit-Down) Restaurant July 11, 2012 Avg. Min. Max. No. Trip Trip Trip Std. of Rate Rate Rate Dev. Studies Avg. Weekday 2-Way Volume AM Peak Hour Enter AM Peak Hour Exit AM Peak Hour Total PM Peak Hour Enter PM Peak Hour Exit PM Peak Hour Total AM Pk Hr, Generator, Enter AM Pk Hr, Generator, Exit AM Pk Hr, Generator, Total PM Pk Hr, Generator, Enter PM Pk Hr, Generator, Exit PM Pk Hr, Generator, Total Saturday 2-Way Volume Saturday Peak Hour Enter Saturday Peak Hour Exit Saturday Peak Hour Total Sunday 2-Way Volume Sunday Peak Hour Enter Sunday Peak Hour Exit Sunday Peak Hour Total Note: A zero indicates no data available. Source: Institute of Transportation Engineers Trip Generation, 8th Edition, TRIP GENERATION BY MICROTRANS
213 SITE #2: PARK PLACE
214 Park Place Mixed-Use Development Summary of Trip Generation Calculation For 156 Rooms of Hotel July 14, 2012 Average Standard Adjustment Driveway Rate Deviation Factor Volume Avg. Weekday 2-Way Volume AM Peak Hour Enter AM Peak Hour Exit AM Peak Hour Total PM Peak Hour Enter PM Peak Hour Exit PM Peak Hour Total AM Pk Hr, Generator, Enter AM Pk Hr, Generator, Exit AM Pk Hr, Generator, Total PM Pk Hr, Generator, Enter PM Pk Hr, Generator, Exit PM Pk Hr, Generator, Total Saturday 2-Way Volume Saturday Peak Hour Enter Saturday Peak Hour Exit Saturday Peak Hour Total Sunday 2-Way Volume Sunday Peak Hour Enter Sunday Peak Hour Exit Sunday Peak Hour Total Note: A zero indicates no data available. Source: Institute of Transportation Engineers Trip Generation, 8th Edition, TRIP GENERATION BY MICROTRANS
215 Park Place Mixed-Use Development Summary of Trip Generation Rates For 156 Rooms of Hotel July 14, 2012 Avg. Min. Max. No. Trip Trip Trip Std. of Rate Rate Rate Dev. Studies Avg. Weekday 2-Way Volume AM Peak Hour Enter AM Peak Hour Exit AM Peak Hour Total PM Peak Hour Enter PM Peak Hour Exit PM Peak Hour Total AM Pk Hr, Generator, Enter AM Pk Hr, Generator, Exit AM Pk Hr, Generator, Total PM Pk Hr, Generator, Enter PM Pk Hr, Generator, Exit PM Pk Hr, Generator, Total Saturday 2-Way Volume Saturday Peak Hour Enter Saturday Peak Hour Exit Saturday Peak Hour Total Sunday 2-Way Volume Sunday Peak Hour Enter Sunday Peak Hour Exit Sunday Peak Hour Total Note: A zero indicates no data available. Source: Institute of Transportation Engineers Trip Generation, 8th Edition, TRIP GENERATION BY MICROTRANS
216 Park Place Mixed-Use Development Summary of Trip Generation Calculation For 156 Rooms of Hotel July 14, 2012 Average Standard Adjustment Driveway Rate Deviation Factor Volume Avg. Weekday 2-Way Volume AM Peak Hour Enter AM Peak Hour Exit AM Peak Hour Total PM Peak Hour Enter PM Peak Hour Exit PM Peak Hour Total AM Pk Hr, Generator, Enter AM Pk Hr, Generator, Exit AM Pk Hr, Generator, Total PM Pk Hr, Generator, Enter PM Pk Hr, Generator, Exit PM Pk Hr, Generator, Total Saturday 2-Way Volume Saturday Peak Hour Enter Saturday Peak Hour Exit Saturday Peak Hour Total Sunday 2-Way Volume Sunday Peak Hour Enter Sunday Peak Hour Exit Sunday Peak Hour Total Note: A zero indicates no data available. The above rates were calculated from these equations: 24-Hr. 2-Way Volume: T = 8.95(X) , R^2 = AM Peak Hr. Total: LN(T) = 1.24LN(X) + -2 R^2 = 0.75, 0.61 Enter, 0.39 Exit 4-6 PM Peak Hr. Total: 0 R^2 = 0, 0 Enter, 0 Exit AM Gen Pk Hr. Total: LN(T) =.87LN(X) +.02 R^2 = 0.54, 0.55 Enter, 0.45 Exit PM Gen Pk Hr. Total: LN(T) = 1LN(X) R^2 = 0.64, 0.58 Enter, 0.42 Exit Sat. 2-Way Volume: T = 9.62(X) , R^2 = 0.93 Sat. Pk Hr. Total: T =.69(X) R^2 = 0.8, 0.56 Enter, 0.44 Exit Sun. 2-Way Volume: LN(T) = 1.34LN(X) , R^2 = 0.94 Sun. Pk Hr. Total: T =.7(X) R^2 = 0.87, 0.46 Enter, 0.54 Exit Source: Institute of Transportation Engineers Trip Generation, 8th Edition, TRIP GENERATION BY MICROTRANS
217 Park Place Mixed-Use Development Summary of Trip Generation Calculation For Th.Sq.Ft. GFA of Health/Fitness Club July 15, 2012 Average Standard Adjustment Driveway Rate Deviation Factor Volume Avg. Weekday 2-Way Volume AM Peak Hour Enter AM Peak Hour Exit AM Peak Hour Total PM Peak Hour Enter PM Peak Hour Exit PM Peak Hour Total AM Pk Hr, Generator, Enter AM Pk Hr, Generator, Exit AM Pk Hr, Generator, Total PM Pk Hr, Generator, Enter PM Pk Hr, Generator, Exit PM Pk Hr, Generator, Total Saturday 2-Way Volume Saturday Peak Hour Enter Saturday Peak Hour Exit Saturday Peak Hour Total Sunday 2-Way Volume Sunday Peak Hour Enter Sunday Peak Hour Exit Sunday Peak Hour Total Note: A zero indicates no data available. Source: Institute of Transportation Engineers Trip Generation, 8th Edition, TRIP GENERATION BY MICROTRANS
218 Park Place Mixed-Use Development Summary of Trip Generation Rates For Th.Sq.Ft. GFA of Health/Fitness Club July 15, 2012 Avg. Min. Max. No. Trip Trip Trip Std. of Rate Rate Rate Dev. Studies Avg. Weekday 2-Way Volume AM Peak Hour Enter AM Peak Hour Exit AM Peak Hour Total PM Peak Hour Enter PM Peak Hour Exit PM Peak Hour Total AM Pk Hr, Generator, Enter AM Pk Hr, Generator, Exit AM Pk Hr, Generator, Total PM Pk Hr, Generator, Enter PM Pk Hr, Generator, Exit PM Pk Hr, Generator, Total Saturday 2-Way Volume Saturday Peak Hour Enter Saturday Peak Hour Exit Saturday Peak Hour Total Sunday 2-Way Volume Sunday Peak Hour Enter Sunday Peak Hour Exit Sunday Peak Hour Total Note: A zero indicates no data available. Source: Institute of Transportation Engineers Trip Generation, 8th Edition, TRIP GENERATION BY MICROTRANS
219 Park Place Mixed-Use Development Summary of Trip Generation Calculation For Th.Sq.Ft. GFA of Health/Fitness Club July 15, 2012 Average Standard Adjustment Driveway Rate Deviation Factor Volume Avg. Weekday 2-Way Volume AM Peak Hour Enter AM Peak Hour Exit AM Peak Hour Total PM Peak Hour Enter PM Peak Hour Exit PM Peak Hour Total AM Pk Hr, Generator, Enter AM Pk Hr, Generator, Exit AM Pk Hr, Generator, Total PM Pk Hr, Generator, Enter PM Pk Hr, Generator, Exit PM Pk Hr, Generator, Total Saturday 2-Way Volume Saturday Peak Hour Enter Saturday Peak Hour Exit Saturday Peak Hour Total Sunday 2-Way Volume Sunday Peak Hour Enter Sunday Peak Hour Exit Sunday Peak Hour Total Note: A zero indicates no data available. The above rates were calculated from these equations: 24-Hr. 2-Way Volume: 0, R^2 = AM Peak Hr. Total: 0 R^2 = 0, 0 Enter, 0 Exit 4-6 PM Peak Hr. Total: LN(T) =.95LN(X) R^2 = 0.83, 0.57 Enter, 0.43 Exit AM Gen Pk Hr. Total: 0 R^2 = 0, 0 Enter, 0 Exit PM Gen Pk Hr. Total: 0 R^2 = 0, 0 Enter, 0 Exit Sat. 2-Way Volume: 0, R^2 = 0 Sat. Pk Hr. Total: 0 R^2 = 0, 0 Enter, 0 Exit Sun. 2-Way Volume: 0, R^2 = 0 Sun. Pk Hr. Total: 0 R^2 = 0, 0 Enter, 0 Exit Source: Institute of Transportation Engineers Trip Generation, 8th Edition, TRIP GENERATION BY MICROTRANS
220 Park Place Mixed-Use Development Summary of Trip Generation Calculation For Th.Sq.Ft. GFA of General Office Building July 15, 2012 Average Standard Adjustment Driveway Rate Deviation Factor Volume Avg. Weekday 2-Way Volume AM Peak Hour Enter AM Peak Hour Exit AM Peak Hour Total PM Peak Hour Enter PM Peak Hour Exit PM Peak Hour Total AM Pk Hr, Generator, Enter AM Pk Hr, Generator, Exit AM Pk Hr, Generator, Total PM Pk Hr, Generator, Enter PM Pk Hr, Generator, Exit PM Pk Hr, Generator, Total Saturday 2-Way Volume Saturday Peak Hour Enter Saturday Peak Hour Exit Saturday Peak Hour Total Sunday 2-Way Volume Sunday Peak Hour Enter Sunday Peak Hour Exit Sunday Peak Hour Total Note: A zero indicates no data available. Source: Institute of Transportation Engineers Trip Generation, 8th Edition, TRIP GENERATION BY MICROTRANS
221 Park Place Mixed-Use Development Summary of Trip Generation Rates For Th.Sq.Ft. GFA of General Office Building July 15, 2012 Avg. Min. Max. No. Trip Trip Trip Std. of Rate Rate Rate Dev. Studies Avg. Weekday 2-Way Volume AM Peak Hour Enter AM Peak Hour Exit AM Peak Hour Total PM Peak Hour Enter PM Peak Hour Exit PM Peak Hour Total AM Pk Hr, Generator, Enter AM Pk Hr, Generator, Exit AM Pk Hr, Generator, Total PM Pk Hr, Generator, Enter PM Pk Hr, Generator, Exit PM Pk Hr, Generator, Total Saturday 2-Way Volume Saturday Peak Hour Enter Saturday Peak Hour Exit Saturday Peak Hour Total Sunday 2-Way Volume Sunday Peak Hour Enter Sunday Peak Hour Exit Sunday Peak Hour Total Note: A zero indicates no data available. Source: Institute of Transportation Engineers Trip Generation, 8th Edition, TRIP GENERATION BY MICROTRANS
222 Park Place Mixed-Use Development Summary of Trip Generation Calculation For Th.Sq.Ft. GFA of General Office Building July 15, 2012 Average Standard Adjustment Driveway Rate Deviation Factor Volume Avg. Weekday 2-Way Volume AM Peak Hour Enter AM Peak Hour Exit AM Peak Hour Total PM Peak Hour Enter PM Peak Hour Exit PM Peak Hour Total AM Pk Hr, Generator, Enter AM Pk Hr, Generator, Exit AM Pk Hr, Generator, Total PM Pk Hr, Generator, Enter PM Pk Hr, Generator, Exit PM Pk Hr, Generator, Total Saturday 2-Way Volume Saturday Peak Hour Enter Saturday Peak Hour Exit Saturday Peak Hour Total Sunday 2-Way Volume Sunday Peak Hour Enter Sunday Peak Hour Exit Sunday Peak Hour Total Note: A zero indicates no data available. The above rates were calculated from these equations: 24-Hr. 2-Way Volume: LN(T) =.77LN(X) , R^2 = AM Peak Hr. Total: LN(T) =.8LN(X) R^2 = 0.83, 0.88 Enter, 0.12 Exit 4-6 PM Peak Hr. Total: T = 1.12(X) R^2 = 0.82, 0.17 Enter, 0.83 Exit AM Gen Pk Hr. Total: LN(T) =.8LN(X) R^2 = 0.83, 0.88 Enter, 0.12 Exit PM Gen Pk Hr. Total: T = 1.12(X) R^2 = 0.82, 0.17 Enter, 0.83 Exit Sat. 2-Way Volume: T = 2.14(X) , R^2 = 0.66 Sat. Pk Hr. Total: LN(T) =.81LN(X) R^2 = 0.59, 0.54 Enter, 0.46 Exit Sun. 2-Way Volume: LN(T) =.86LN(X) +.31, R^2 = 0.5 Sun. Pk Hr. Total: LN(T) =.61LN(X) R^2 = 0.56, 0.58 Enter, 0.42 Exit Source: Institute of Transportation Engineers Trip Generation, 8th Edition, TRIP GENERATION BY MICROTRANS
223 Park Place Mixed-Use Development Summary of Trip Generation Calculation For Th.Sq.Ft. GLA of Specialty Retail Center July 15, 2012 Average Standard Adjustment Driveway Rate Deviation Factor Volume Avg. Weekday 2-Way Volume AM Peak Hour Enter AM Peak Hour Exit AM Peak Hour Total PM Peak Hour Enter PM Peak Hour Exit PM Peak Hour Total AM Pk Hr, Generator, Enter AM Pk Hr, Generator, Exit AM Pk Hr, Generator, Total PM Pk Hr, Generator, Enter PM Pk Hr, Generator, Exit PM Pk Hr, Generator, Total Saturday 2-Way Volume Saturday Peak Hour Enter Saturday Peak Hour Exit Saturday Peak Hour Total Sunday 2-Way Volume Sunday Peak Hour Enter Sunday Peak Hour Exit Sunday Peak Hour Total Note: A zero indicates no data available. Source: Institute of Transportation Engineers Trip Generation, 8th Edition, TRIP GENERATION BY MICROTRANS
224 Park Place Mixed-Use Development Summary of Trip Generation Rates For Th.Sq.Ft. GLA of Specialty Retail Center July 15, 2012 Avg. Min. Max. No. Trip Trip Trip Std. of Rate Rate Rate Dev. Studies Avg. Weekday 2-Way Volume AM Peak Hour Enter AM Peak Hour Exit AM Peak Hour Total PM Peak Hour Enter PM Peak Hour Exit PM Peak Hour Total AM Pk Hr, Generator, Enter AM Pk Hr, Generator, Exit AM Pk Hr, Generator, Total PM Pk Hr, Generator, Enter PM Pk Hr, Generator, Exit PM Pk Hr, Generator, Total Saturday 2-Way Volume Saturday Peak Hour Enter Saturday Peak Hour Exit Saturday Peak Hour Total Sunday 2-Way Volume Sunday Peak Hour Enter Sunday Peak Hour Exit Sunday Peak Hour Total Note: A zero indicates no data available. Source: Institute of Transportation Engineers Trip Generation, 8th Edition, TRIP GENERATION BY MICROTRANS
225 Park Place Mixed-Use Development Summary of Trip Generation Calculation For Th.Sq.Ft. GLA of Specialty Retail Center July 15, 2012 Average Standard Adjustment Driveway Rate Deviation Factor Volume Avg. Weekday 2-Way Volume AM Peak Hour Enter AM Peak Hour Exit AM Peak Hour Total PM Peak Hour Enter PM Peak Hour Exit PM Peak Hour Total AM Pk Hr, Generator, Enter AM Pk Hr, Generator, Exit AM Pk Hr, Generator, Total PM Pk Hr, Generator, Enter PM Pk Hr, Generator, Exit PM Pk Hr, Generator, Total Saturday 2-Way Volume Saturday Peak Hour Enter Saturday Peak Hour Exit Saturday Peak Hour Total Sunday 2-Way Volume Sunday Peak Hour Enter Sunday Peak Hour Exit Sunday Peak Hour Total Note: A zero indicates no data available. The above rates were calculated from these equations: 24-Hr. 2-Way Volume: T = 42.78(X) , R^2 = AM Peak Hr. Total: 0 R^2 = 0, 0 Enter, 0 Exit 4-6 PM Peak Hr. Total: T = 2.4(X) R^2 = 0.98, 0.44 Enter, 0.56 Exit AM Gen Pk Hr. Total: T = 4.91(X) R^2 = 0.9, 0.48 Enter, 0.52 Exit PM Gen Pk Hr. Total: 0 R^2 = 0, 0 Enter, 0 Exit Sat. 2-Way Volume: 0, R^2 = 0 Sat. Pk Hr. Total: 0 R^2 = 0, 0 Enter, 0 Exit Sun. 2-Way Volume: 0, R^2 = 0 Sun. Pk Hr. Total: 0 R^2 = 0, 0 Enter, 0 Exit Source: Institute of Transportation Engineers Trip Generation, 8th Edition, TRIP GENERATION BY MICROTRANS
226 Park Place Mixed-Use Development Summary of Trip Generation Calculation For Th.Sq.Ft. GFA of High Turnover (Sit-Down) Restaurant July 15, 2012 Average Standard Adjustment Driveway Rate Deviation Factor Volume Avg. Weekday 2-Way Volume AM Peak Hour Enter AM Peak Hour Exit AM Peak Hour Total PM Peak Hour Enter PM Peak Hour Exit PM Peak Hour Total AM Pk Hr, Generator, Enter AM Pk Hr, Generator, Exit AM Pk Hr, Generator, Total PM Pk Hr, Generator, Enter PM Pk Hr, Generator, Exit PM Pk Hr, Generator, Total Saturday 2-Way Volume Saturday Peak Hour Enter Saturday Peak Hour Exit Saturday Peak Hour Total Sunday 2-Way Volume Sunday Peak Hour Enter Sunday Peak Hour Exit Sunday Peak Hour Total Note: A zero indicates no data available. Source: Institute of Transportation Engineers Trip Generation, 8th Edition, TRIP GENERATION BY MICROTRANS
227 Park Place Mixed-Use Development Summary of Trip Generation Rates For Th.Sq.Ft. GFA of High Turnover (Sit-Down) Restaurant July 15, 2012 Avg. Min. Max. No. Trip Trip Trip Std. of Rate Rate Rate Dev. Studies Avg. Weekday 2-Way Volume AM Peak Hour Enter AM Peak Hour Exit AM Peak Hour Total PM Peak Hour Enter PM Peak Hour Exit PM Peak Hour Total AM Pk Hr, Generator, Enter AM Pk Hr, Generator, Exit AM Pk Hr, Generator, Total PM Pk Hr, Generator, Enter PM Pk Hr, Generator, Exit PM Pk Hr, Generator, Total Saturday 2-Way Volume Saturday Peak Hour Enter Saturday Peak Hour Exit Saturday Peak Hour Total Sunday 2-Way Volume Sunday Peak Hour Enter Sunday Peak Hour Exit Sunday Peak Hour Total Note: A zero indicates no data available. Source: Institute of Transportation Engineers Trip Generation, 8th Edition, TRIP GENERATION BY MICROTRANS
228 Park Place Mixed-Use Development Summary of Trip Generation Calculation For Th.Sq.Ft. GFA of High Turnover (Sit-Down) Restaurant July 15, 2012 Average Standard Adjustment Driveway Rate Deviation Factor Volume Avg. Weekday 2-Way Volume AM Peak Hour Enter AM Peak Hour Exit AM Peak Hour Total PM Peak Hour Enter PM Peak Hour Exit PM Peak Hour Total AM Pk Hr, Generator, Enter AM Pk Hr, Generator, Exit AM Pk Hr, Generator, Total PM Pk Hr, Generator, Enter PM Pk Hr, Generator, Exit PM Pk Hr, Generator, Total Saturday 2-Way Volume Saturday Peak Hour Enter Saturday Peak Hour Exit Saturday Peak Hour Total Sunday 2-Way Volume Sunday Peak Hour Enter Sunday Peak Hour Exit Sunday Peak Hour Total Note: A zero indicates no data available. Source: Institute of Transportation Engineers Trip Generation, 8th Edition, TRIP GENERATION BY MICROTRANS
229 Park Place Mixed-Use Development Summary of Trip Generation Rates For Th.Sq.Ft. GFA of High Turnover (Sit-Down) Restaurant July 15, 2012 Avg. Min. Max. No. Trip Trip Trip Std. of Rate Rate Rate Dev. Studies Avg. Weekday 2-Way Volume AM Peak Hour Enter AM Peak Hour Exit AM Peak Hour Total PM Peak Hour Enter PM Peak Hour Exit PM Peak Hour Total AM Pk Hr, Generator, Enter AM Pk Hr, Generator, Exit AM Pk Hr, Generator, Total PM Pk Hr, Generator, Enter PM Pk Hr, Generator, Exit PM Pk Hr, Generator, Total Saturday 2-Way Volume Saturday Peak Hour Enter Saturday Peak Hour Exit Saturday Peak Hour Total Sunday 2-Way Volume Sunday Peak Hour Enter Sunday Peak Hour Exit Sunday Peak Hour Total Note: A zero indicates no data available. Source: Institute of Transportation Engineers Trip Generation, 8th Edition, TRIP GENERATION BY MICROTRANS
230 Park Place Mixed-Use Development Summary of Trip Generation Calculation For Th.Sq.Ft. GFA of Quality Restaurant July 15, 2012 Average Standard Adjustment Driveway Rate Deviation Factor Volume Avg. Weekday 2-Way Volume AM Peak Hour Enter AM Peak Hour Exit AM Peak Hour Total PM Peak Hour Enter PM Peak Hour Exit PM Peak Hour Total AM Pk Hr, Generator, Enter AM Pk Hr, Generator, Exit AM Pk Hr, Generator, Total PM Pk Hr, Generator, Enter PM Pk Hr, Generator, Exit PM Pk Hr, Generator, Total Saturday 2-Way Volume Saturday Peak Hour Enter Saturday Peak Hour Exit Saturday Peak Hour Total Sunday 2-Way Volume Sunday Peak Hour Enter Sunday Peak Hour Exit Sunday Peak Hour Total Note: A zero indicates no data available. Source: Institute of Transportation Engineers Trip Generation, 8th Edition, TRIP GENERATION BY MICROTRANS
231 Park Place Mixed-Use Development Summary of Trip Generation Rates For Th.Sq.Ft. GFA of Quality Restaurant July 15, 2012 Avg. Min. Max. No. Trip Trip Trip Std. of Rate Rate Rate Dev. Studies Avg. Weekday 2-Way Volume AM Peak Hour Enter AM Peak Hour Exit AM Peak Hour Total PM Peak Hour Enter PM Peak Hour Exit PM Peak Hour Total AM Pk Hr, Generator, Enter AM Pk Hr, Generator, Exit AM Pk Hr, Generator, Total PM Pk Hr, Generator, Enter PM Pk Hr, Generator, Exit PM Pk Hr, Generator, Total Saturday 2-Way Volume Saturday Peak Hour Enter Saturday Peak Hour Exit Saturday Peak Hour Total Sunday 2-Way Volume Sunday Peak Hour Enter Sunday Peak Hour Exit Sunday Peak Hour Total Note: A zero indicates no data available. Source: Institute of Transportation Engineers Trip Generation, 8th Edition, TRIP GENERATION BY MICROTRANS
232 Park Place Mixed-Use Development Summary of Trip Generation Calculation For Th.Sq.Ft. GFA of Quality Restaurant July 15, 2012 Average Standard Adjustment Driveway Rate Deviation Factor Volume Avg. Weekday 2-Way Volume AM Peak Hour Enter AM Peak Hour Exit AM Peak Hour Total PM Peak Hour Enter PM Peak Hour Exit PM Peak Hour Total AM Pk Hr, Generator, Enter AM Pk Hr, Generator, Exit AM Pk Hr, Generator, Total PM Pk Hr, Generator, Enter PM Pk Hr, Generator, Exit PM Pk Hr, Generator, Total Saturday 2-Way Volume Saturday Peak Hour Enter Saturday Peak Hour Exit Saturday Peak Hour Total Sunday 2-Way Volume Sunday Peak Hour Enter Sunday Peak Hour Exit Sunday Peak Hour Total Note: A zero indicates no data available. Source: Institute of Transportation Engineers Trip Generation, 8th Edition, TRIP GENERATION BY MICROTRANS
233 Park Place Mixed-Use Development Summary of Trip Generation Rates For Th.Sq.Ft. GFA of Quality Restaurant July 15, 2012 Avg. Min. Max. No. Trip Trip Trip Std. of Rate Rate Rate Dev. Studies Avg. Weekday 2-Way Volume AM Peak Hour Enter AM Peak Hour Exit AM Peak Hour Total PM Peak Hour Enter PM Peak Hour Exit PM Peak Hour Total AM Pk Hr, Generator, Enter AM Pk Hr, Generator, Exit AM Pk Hr, Generator, Total PM Pk Hr, Generator, Enter PM Pk Hr, Generator, Exit PM Pk Hr, Generator, Total Saturday 2-Way Volume Saturday Peak Hour Enter Saturday Peak Hour Exit Saturday Peak Hour Total Sunday 2-Way Volume Sunday Peak Hour Enter Sunday Peak Hour Exit Sunday Peak Hour Total Note: A zero indicates no data available. Source: Institute of Transportation Engineers Trip Generation, 8th Edition, TRIP GENERATION BY MICROTRANS
234 Park Place Mixed-Use Development Summary of Trip Generation Calculation For Th.Sq.Ft. GFA of Quality Restaurant July 15, 2012 Average Standard Adjustment Driveway Rate Deviation Factor Volume Avg. Weekday 2-Way Volume AM Peak Hour Enter AM Peak Hour Exit AM Peak Hour Total PM Peak Hour Enter PM Peak Hour Exit PM Peak Hour Total AM Pk Hr, Generator, Enter AM Pk Hr, Generator, Exit AM Pk Hr, Generator, Total PM Pk Hr, Generator, Enter PM Pk Hr, Generator, Exit PM Pk Hr, Generator, Total Saturday 2-Way Volume Saturday Peak Hour Enter Saturday Peak Hour Exit Saturday Peak Hour Total Sunday 2-Way Volume Sunday Peak Hour Enter Sunday Peak Hour Exit Sunday Peak Hour Total Note: A zero indicates no data available. Source: Institute of Transportation Engineers Trip Generation, 8th Edition, TRIP GENERATION BY MICROTRANS
235 Park Place Mixed-Use Development Summary of Trip Generation Rates For Th.Sq.Ft. GFA of Quality Restaurant July 15, 2012 Avg. Min. Max. No. Trip Trip Trip Std. of Rate Rate Rate Dev. Studies Avg. Weekday 2-Way Volume AM Peak Hour Enter AM Peak Hour Exit AM Peak Hour Total PM Peak Hour Enter PM Peak Hour Exit PM Peak Hour Total AM Pk Hr, Generator, Enter AM Pk Hr, Generator, Exit AM Pk Hr, Generator, Total PM Pk Hr, Generator, Enter PM Pk Hr, Generator, Exit PM Pk Hr, Generator, Total Saturday 2-Way Volume Saturday Peak Hour Enter Saturday Peak Hour Exit Saturday Peak Hour Total Sunday 2-Way Volume Sunday Peak Hour Enter Sunday Peak Hour Exit Sunday Peak Hour Total Note: A zero indicates no data available. Source: Institute of Transportation Engineers Trip Generation, 8th Edition, TRIP GENERATION BY MICROTRANS
236 Park Place Mixed-Use Development Summary of Trip Generation Calculation For Th.Sq.Ft. GFA of Quality Restaurant July 15, 2012 Average Standard Adjustment Driveway Rate Deviation Factor Volume Avg. Weekday 2-Way Volume AM Peak Hour Enter AM Peak Hour Exit AM Peak Hour Total PM Peak Hour Enter PM Peak Hour Exit PM Peak Hour Total AM Pk Hr, Generator, Enter AM Pk Hr, Generator, Exit AM Pk Hr, Generator, Total PM Pk Hr, Generator, Enter PM Pk Hr, Generator, Exit PM Pk Hr, Generator, Total Saturday 2-Way Volume Saturday Peak Hour Enter Saturday Peak Hour Exit Saturday Peak Hour Total Sunday 2-Way Volume Sunday Peak Hour Enter Sunday Peak Hour Exit Sunday Peak Hour Total Note: A zero indicates no data available. Source: Institute of Transportation Engineers Trip Generation, 8th Edition, TRIP GENERATION BY MICROTRANS
237 Park Place Mixed-Use Development Summary of Trip Generation Rates For Th.Sq.Ft. GFA of Quality Restaurant July 15, 2012 Avg. Min. Max. No. Trip Trip Trip Std. of Rate Rate Rate Dev. Studies Avg. Weekday 2-Way Volume AM Peak Hour Enter AM Peak Hour Exit AM Peak Hour Total PM Peak Hour Enter PM Peak Hour Exit PM Peak Hour Total AM Pk Hr, Generator, Enter AM Pk Hr, Generator, Exit AM Pk Hr, Generator, Total PM Pk Hr, Generator, Enter PM Pk Hr, Generator, Exit PM Pk Hr, Generator, Total Saturday 2-Way Volume Saturday Peak Hour Enter Saturday Peak Hour Exit Saturday Peak Hour Total Sunday 2-Way Volume Sunday Peak Hour Enter Sunday Peak Hour Exit Sunday Peak Hour Total Note: A zero indicates no data available. Source: Institute of Transportation Engineers Trip Generation, 8th Edition, TRIP GENERATION BY MICROTRANS
238 Park Place Mixed-Use Development Summary of Trip Generation Calculation For Th.Sq.Ft. GFA of Quality Restaurant July 15, 2012 Average Standard Adjustment Driveway Rate Deviation Factor Volume Avg. Weekday 2-Way Volume AM Peak Hour Enter AM Peak Hour Exit AM Peak Hour Total PM Peak Hour Enter PM Peak Hour Exit PM Peak Hour Total AM Pk Hr, Generator, Enter AM Pk Hr, Generator, Exit AM Pk Hr, Generator, Total PM Pk Hr, Generator, Enter PM Pk Hr, Generator, Exit PM Pk Hr, Generator, Total Saturday 2-Way Volume Saturday Peak Hour Enter Saturday Peak Hour Exit Saturday Peak Hour Total Sunday 2-Way Volume Sunday Peak Hour Enter Sunday Peak Hour Exit Sunday Peak Hour Total Note: A zero indicates no data available. Source: Institute of Transportation Engineers Trip Generation, 8th Edition, TRIP GENERATION BY MICROTRANS
239 Park Place Mixed-Use Development Summary of Trip Generation Rates For Th.Sq.Ft. GFA of Quality Restaurant July 15, 2012 Avg. Min. Max. No. Trip Trip Trip Std. of Rate Rate Rate Dev. Studies Avg. Weekday 2-Way Volume AM Peak Hour Enter AM Peak Hour Exit AM Peak Hour Total PM Peak Hour Enter PM Peak Hour Exit PM Peak Hour Total AM Pk Hr, Generator, Enter AM Pk Hr, Generator, Exit AM Pk Hr, Generator, Total PM Pk Hr, Generator, Enter PM Pk Hr, Generator, Exit PM Pk Hr, Generator, Total Saturday 2-Way Volume Saturday Peak Hour Enter Saturday Peak Hour Exit Saturday Peak Hour Total Sunday 2-Way Volume Sunday Peak Hour Enter Sunday Peak Hour Exit Sunday Peak Hour Total Note: A zero indicates no data available. Source: Institute of Transportation Engineers Trip Generation, 8th Edition, TRIP GENERATION BY MICROTRANS
240 Park Place Mixed-Use Development Summary of Trip Generation Calculation For Th.Sq.Ft. GFA of Quality Restaurant July 15, 2012 Average Standard Adjustment Driveway Rate Deviation Factor Volume Avg. Weekday 2-Way Volume AM Peak Hour Enter AM Peak Hour Exit AM Peak Hour Total PM Peak Hour Enter PM Peak Hour Exit PM Peak Hour Total AM Pk Hr, Generator, Enter AM Pk Hr, Generator, Exit AM Pk Hr, Generator, Total PM Pk Hr, Generator, Enter PM Pk Hr, Generator, Exit PM Pk Hr, Generator, Total Saturday 2-Way Volume Saturday Peak Hour Enter Saturday Peak Hour Exit Saturday Peak Hour Total Sunday 2-Way Volume Sunday Peak Hour Enter Sunday Peak Hour Exit Sunday Peak Hour Total Note: A zero indicates no data available. Source: Institute of Transportation Engineers Trip Generation, 8th Edition, TRIP GENERATION BY MICROTRANS
241 Park Place Mixed-Use Development Summary of Trip Generation Rates For Th.Sq.Ft. GFA of Quality Restaurant July 15, 2012 Avg. Min. Max. No. Trip Trip Trip Std. of Rate Rate Rate Dev. Studies Avg. Weekday 2-Way Volume AM Peak Hour Enter AM Peak Hour Exit AM Peak Hour Total PM Peak Hour Enter PM Peak Hour Exit PM Peak Hour Total AM Pk Hr, Generator, Enter AM Pk Hr, Generator, Exit AM Pk Hr, Generator, Total PM Pk Hr, Generator, Enter PM Pk Hr, Generator, Exit PM Pk Hr, Generator, Total Saturday 2-Way Volume Saturday Peak Hour Enter Saturday Peak Hour Exit Saturday Peak Hour Total Sunday 2-Way Volume Sunday Peak Hour Enter Sunday Peak Hour Exit Sunday Peak Hour Total Note: A zero indicates no data available. Source: Institute of Transportation Engineers Trip Generation, 8th Edition, TRIP GENERATION BY MICROTRANS
242 SITE #3: METCALF95 COMPLEX
243 Metcalf95 Mixed-Use Development Summary of Trip Generation Calculation For Th.Sq.Ft. GFA of General Office Building July 23, 2012 Average Standard Adjustment Driveway Rate Deviation Factor Volume Avg. Weekday 2-Way Volume AM Peak Hour Enter AM Peak Hour Exit AM Peak Hour Total PM Peak Hour Enter PM Peak Hour Exit PM Peak Hour Total AM Pk Hr, Generator, Enter AM Pk Hr, Generator, Exit AM Pk Hr, Generator, Total PM Pk Hr, Generator, Enter PM Pk Hr, Generator, Exit PM Pk Hr, Generator, Total Saturday 2-Way Volume Saturday Peak Hour Enter Saturday Peak Hour Exit Saturday Peak Hour Total Sunday 2-Way Volume Sunday Peak Hour Enter Sunday Peak Hour Exit Sunday Peak Hour Total Note: A zero indicates no data available. Source: Institute of Transportation Engineers Trip Generation, 8th Edition, TRIP GENERATION BY MICROTRANS
244 Metcalf95 Mixed-Use Development Summary of Trip Generation Calculation For Th.Sq.Ft. GFA of General Office Building July 23, 2012 Average Standard Adjustment Driveway Rate Deviation Factor Volume Avg. Weekday 2-Way Volume AM Peak Hour Enter AM Peak Hour Exit AM Peak Hour Total PM Peak Hour Enter PM Peak Hour Exit PM Peak Hour Total AM Pk Hr, Generator, Enter AM Pk Hr, Generator, Exit AM Pk Hr, Generator, Total PM Pk Hr, Generator, Enter PM Pk Hr, Generator, Exit PM Pk Hr, Generator, Total Saturday 2-Way Volume Saturday Peak Hour Enter Saturday Peak Hour Exit Saturday Peak Hour Total Sunday 2-Way Volume Sunday Peak Hour Enter Sunday Peak Hour Exit Sunday Peak Hour Total Note: A zero indicates no data available. The above rates were calculated from these equations: 24-Hr. 2-Way Volume: LN(T) =.77LN(X) , R^2 = AM Peak Hr. Total: LN(T) =.8LN(X) R^2 = 0.83, 0.88 Enter, 0.12 Exit 4-6 PM Peak Hr. Total: T = 1.12(X) R^2 = 0.82, 0.17 Enter, 0.83 Exit AM Gen Pk Hr. Total: LN(T) =.8LN(X) R^2 = 0.83, 0.88 Enter, 0.12 Exit PM Gen Pk Hr. Total: T = 1.12(X) R^2 = 0.82, 0.17 Enter, 0.83 Exit Sat. 2-Way Volume: T = 2.14(X) , R^2 = 0.66 Sat. Pk Hr. Total: LN(T) =.81LN(X) R^2 = 0.59, 0.54 Enter, 0.46 Exit Sun. 2-Way Volume: LN(T) =.86LN(X) +.31, R^2 = 0.5 Sun. Pk Hr. Total: LN(T) =.61LN(X) R^2 = 0.56, 0.58 Enter, 0.42 Exit Source: Institute of Transportation Engineers Trip Generation, 8th Edition, TRIP GENERATION BY MICROTRANS
245 Metcalf95 Mixed-Use Development Summary of Trip Generation Rates For Th.Sq.Ft. GFA of General Office Building July 23, 2012 Avg. Min. Max. No. Trip Trip Trip Std. of Rate Rate Rate Dev. Studies Avg. Weekday 2-Way Volume AM Peak Hour Enter AM Peak Hour Exit AM Peak Hour Total PM Peak Hour Enter PM Peak Hour Exit PM Peak Hour Total AM Pk Hr, Generator, Enter AM Pk Hr, Generator, Exit AM Pk Hr, Generator, Total PM Pk Hr, Generator, Enter PM Pk Hr, Generator, Exit PM Pk Hr, Generator, Total Saturday 2-Way Volume Saturday Peak Hour Enter Saturday Peak Hour Exit Saturday Peak Hour Total Sunday 2-Way Volume Sunday Peak Hour Enter Sunday Peak Hour Exit Sunday Peak Hour Total Note: A zero indicates no data available. Source: Institute of Transportation Engineers Trip Generation, 8th Edition, TRIP GENERATION BY MICROTRANS
246 Metcalf95 Mixed-Use Development Summary of Trip Generation Calculation For Th.Sq.Ft. GLA of Specialty Retail Center July 23, 2012 Average Standard Adjustment Driveway Rate Deviation Factor Volume Avg. Weekday 2-Way Volume AM Peak Hour Enter AM Peak Hour Exit AM Peak Hour Total PM Peak Hour Enter PM Peak Hour Exit PM Peak Hour Total AM Pk Hr, Generator, Enter AM Pk Hr, Generator, Exit AM Pk Hr, Generator, Total PM Pk Hr, Generator, Enter PM Pk Hr, Generator, Exit PM Pk Hr, Generator, Total Saturday 2-Way Volume Saturday Peak Hour Enter Saturday Peak Hour Exit Saturday Peak Hour Total Sunday 2-Way Volume Sunday Peak Hour Enter Sunday Peak Hour Exit Sunday Peak Hour Total Note: A zero indicates no data available. Source: Institute of Transportation Engineers Trip Generation, 8th Edition, TRIP GENERATION BY MICROTRANS
247 Metcalf95 Mixed-Use Development Summary of Trip Generation Rates For Th.Sq.Ft. GLA of Specialty Retail Center July 23, 2012 Avg. Min. Max. No. Trip Trip Trip Std. of Rate Rate Rate Dev. Studies Avg. Weekday 2-Way Volume AM Peak Hour Enter AM Peak Hour Exit AM Peak Hour Total PM Peak Hour Enter PM Peak Hour Exit PM Peak Hour Total AM Pk Hr, Generator, Enter AM Pk Hr, Generator, Exit AM Pk Hr, Generator, Total PM Pk Hr, Generator, Enter PM Pk Hr, Generator, Exit PM Pk Hr, Generator, Total Saturday 2-Way Volume Saturday Peak Hour Enter Saturday Peak Hour Exit Saturday Peak Hour Total Sunday 2-Way Volume Sunday Peak Hour Enter Sunday Peak Hour Exit Sunday Peak Hour Total Note: A zero indicates no data available. Source: Institute of Transportation Engineers Trip Generation, 8th Edition, TRIP GENERATION BY MICROTRANS
248 Metcalf95 Mixed-Use Development Summary of Trip Generation Calculation For Th.Sq.Ft. GLA of Specialty Retail Center July 23, 2012 Average Standard Adjustment Driveway Rate Deviation Factor Volume Avg. Weekday 2-Way Volume AM Peak Hour Enter AM Peak Hour Exit AM Peak Hour Total PM Peak Hour Enter PM Peak Hour Exit PM Peak Hour Total AM Pk Hr, Generator, Enter AM Pk Hr, Generator, Exit AM Pk Hr, Generator, Total PM Pk Hr, Generator, Enter PM Pk Hr, Generator, Exit PM Pk Hr, Generator, Total Saturday 2-Way Volume Saturday Peak Hour Enter Saturday Peak Hour Exit Saturday Peak Hour Total Sunday 2-Way Volume Sunday Peak Hour Enter Sunday Peak Hour Exit Sunday Peak Hour Total Note: A zero indicates no data available. The above rates were calculated from these equations: 24-Hr. 2-Way Volume: T = 42.78(X) , R^2 = AM Peak Hr. Total: 0 R^2 = 0, 0 Enter, 0 Exit 4-6 PM Peak Hr. Total: T = 2.4(X) R^2 = 0.98, 0.44 Enter, 0.56 Exit AM Gen Pk Hr. Total: T = 4.91(X) R^2 = 0.9, 0.48 Enter, 0.52 Exit PM Gen Pk Hr. Total: 0 R^2 = 0, 0 Enter, 0 Exit Sat. 2-Way Volume: 0, R^2 = 0 Sat. Pk Hr. Total: 0 R^2 = 0, 0 Enter, 0 Exit Sun. 2-Way Volume: 0, R^2 = 0 Sun. Pk Hr. Total: 0 R^2 = 0, 0 Enter, 0 Exit Source: Institute of Transportation Engineers Trip Generation, 8th Edition, TRIP GENERATION BY MICROTRANS
249 Metcalf95 Mixed-Use Development Summary of Trip Generation Calculation For Th.Sq.Ft. GFA of High Turnover (Sit-Down) Restaurant July 23, 2012 Average Standard Adjustment Driveway Rate Deviation Factor Volume Avg. Weekday 2-Way Volume AM Peak Hour Enter AM Peak Hour Exit AM Peak Hour Total PM Peak Hour Enter PM Peak Hour Exit PM Peak Hour Total AM Pk Hr, Generator, Enter AM Pk Hr, Generator, Exit AM Pk Hr, Generator, Total PM Pk Hr, Generator, Enter PM Pk Hr, Generator, Exit PM Pk Hr, Generator, Total Saturday 2-Way Volume Saturday Peak Hour Enter Saturday Peak Hour Exit Saturday Peak Hour Total Sunday 2-Way Volume Sunday Peak Hour Enter Sunday Peak Hour Exit Sunday Peak Hour Total Note: A zero indicates no data available. Source: Institute of Transportation Engineers Trip Generation, 8th Edition, TRIP GENERATION BY MICROTRANS
250 Metcalf95 Mixed-Use Development Summary of Trip Generation Rates For Th.Sq.Ft. GFA of High Turnover (Sit-Down) Restaurant July 23, 2012 Avg. Min. Max. No. Trip Trip Trip Std. of Rate Rate Rate Dev. Studies Avg. Weekday 2-Way Volume AM Peak Hour Enter AM Peak Hour Exit AM Peak Hour Total PM Peak Hour Enter PM Peak Hour Exit PM Peak Hour Total AM Pk Hr, Generator, Enter AM Pk Hr, Generator, Exit AM Pk Hr, Generator, Total PM Pk Hr, Generator, Enter PM Pk Hr, Generator, Exit PM Pk Hr, Generator, Total Saturday 2-Way Volume Saturday Peak Hour Enter Saturday Peak Hour Exit Saturday Peak Hour Total Sunday 2-Way Volume Sunday Peak Hour Enter Sunday Peak Hour Exit Sunday Peak Hour Total Note: A zero indicates no data available. Source: Institute of Transportation Engineers Trip Generation, 8th Edition, TRIP GENERATION BY MICROTRANS
251 Metcalf95 Mixed-Use Development Summary of Trip Generation Calculation For Th.Sq.Ft. GFA of High Turnover (Sit-Down) Restaurant July 23, 2012 Average Standard Adjustment Driveway Rate Deviation Factor Volume Avg. Weekday 2-Way Volume AM Peak Hour Enter AM Peak Hour Exit AM Peak Hour Total PM Peak Hour Enter PM Peak Hour Exit PM Peak Hour Total AM Pk Hr, Generator, Enter AM Pk Hr, Generator, Exit AM Pk Hr, Generator, Total PM Pk Hr, Generator, Enter PM Pk Hr, Generator, Exit PM Pk Hr, Generator, Total Saturday 2-Way Volume Saturday Peak Hour Enter Saturday Peak Hour Exit Saturday Peak Hour Total Sunday 2-Way Volume Sunday Peak Hour Enter Sunday Peak Hour Exit Sunday Peak Hour Total Note: A zero indicates no data available. Source: Institute of Transportation Engineers Trip Generation, 8th Edition, TRIP GENERATION BY MICROTRANS
252 Metcalf95 Mixed-Use Development Summary of Trip Generation Rates For Th.Sq.Ft. GFA of High Turnover (Sit-Down) Restaurant July 23, 2012 Avg. Min. Max. No. Trip Trip Trip Std. of Rate Rate Rate Dev. Studies Avg. Weekday 2-Way Volume AM Peak Hour Enter AM Peak Hour Exit AM Peak Hour Total PM Peak Hour Enter PM Peak Hour Exit PM Peak Hour Total AM Pk Hr, Generator, Enter AM Pk Hr, Generator, Exit AM Pk Hr, Generator, Total PM Pk Hr, Generator, Enter PM Pk Hr, Generator, Exit PM Pk Hr, Generator, Total Saturday 2-Way Volume Saturday Peak Hour Enter Saturday Peak Hour Exit Saturday Peak Hour Total Sunday 2-Way Volume Sunday Peak Hour Enter Sunday Peak Hour Exit Sunday Peak Hour Total Note: A zero indicates no data available. Source: Institute of Transportation Engineers Trip Generation, 8th Edition, TRIP GENERATION BY MICROTRANS
253 Metcalf95 Mixed-Use Development Summary of Trip Generation Calculation For Th.Sq.Ft. GFA of High Turnover (Sit-Down) Restaurant July 23, 2012 Average Standard Adjustment Driveway Rate Deviation Factor Volume Avg. Weekday 2-Way Volume AM Peak Hour Enter AM Peak Hour Exit AM Peak Hour Total PM Peak Hour Enter PM Peak Hour Exit PM Peak Hour Total AM Pk Hr, Generator, Enter AM Pk Hr, Generator, Exit AM Pk Hr, Generator, Total PM Pk Hr, Generator, Enter PM Pk Hr, Generator, Exit PM Pk Hr, Generator, Total Saturday 2-Way Volume Saturday Peak Hour Enter Saturday Peak Hour Exit Saturday Peak Hour Total Sunday 2-Way Volume Sunday Peak Hour Enter Sunday Peak Hour Exit Sunday Peak Hour Total Note: A zero indicates no data available. Source: Institute of Transportation Engineers Trip Generation, 8th Edition, TRIP GENERATION BY MICROTRANS
254 Metcalf95 Mixed-Use Development Summary of Trip Generation Rates For Th.Sq.Ft. GFA of High Turnover (Sit-Down) Restaurant July 23, 2012 Avg. Min. Max. No. Trip Trip Trip Std. of Rate Rate Rate Dev. Studies Avg. Weekday 2-Way Volume AM Peak Hour Enter AM Peak Hour Exit AM Peak Hour Total PM Peak Hour Enter PM Peak Hour Exit PM Peak Hour Total AM Pk Hr, Generator, Enter AM Pk Hr, Generator, Exit AM Pk Hr, Generator, Total PM Pk Hr, Generator, Enter PM Pk Hr, Generator, Exit PM Pk Hr, Generator, Total Saturday 2-Way Volume Saturday Peak Hour Enter Saturday Peak Hour Exit Saturday Peak Hour Total Sunday 2-Way Volume Sunday Peak Hour Enter Sunday Peak Hour Exit Sunday Peak Hour Total Note: A zero indicates no data available. Source: Institute of Transportation Engineers Trip Generation, 8th Edition, TRIP GENERATION BY MICROTRANS
255 APPENDIX D CORRESPONDENCE LETTER ADDRESSED TO LOCAL AGENCIES, REQUESTING IDENTIFICATION OF CANDIDATE MIXED-USE DEVELOPMENT SITES WITHIN THEIR JURISDICTIONS
256 The University of Kansas Transportation Research Institute Transportation Center March 17 th, 2011 Dear Colleagues As a Principal Investigator, I am conducting a research project on trip generation behavior of mixed-use developments in Kansas and would need your help on this. The project is a K-TRAN project sponsored by KDOT and is titled Establishment of Local Trip Generation Rates or Equations for Mixed-Use Developments in Kansas. The fundamental part of the scope of services for this study involves field data collection at a number of existing Mixed-Use/Multi-Use developments, which will be used as test sites to develop our model. To locate potential candidate test sites, I would need your input in identifying such sites in your jurisdiction, if any. Preliminary investigation and literature review indicate that site selection is critical in achieving representative and consistent trip generation rates. To select appropriate test sites, a number of criteria should be followed. As you identify some of the existing Mixed-Use/Multi-Use development sites in your jurisdiction, please keep the following points in mind: A multi-use development, as defined by ITE Trip Generation Handbook, is typically a single real-estate project that consists of two (2) or more ITE Land Use classifications between which trips can be made without using the off-site road system. These land use classifications include residential, office, shopping/retail, restaurant, entertainment and hotel/motel. Multi-use developments are commonly found ranging in size from 100,000 square feet to 2 million square feet. Site should be fully developed, operational and mature. o The development should have reasonably full occupancy (i.e. at 85 th percent) and appear to be economically healthy. o The development should be mature (i.e. at least two years old) and located in a mature area so it represents the ultimate characteristics of a successful development. o There should be minimal to no on-site construction or adjacent roadway construction W. 15 th Street Room #2160 Learned Hall Lawrence, Kansas Phone: (785) Fax: (785) mgivechi@ku.edu
257 The driveways serving the multi-use site should not serve any adjacent property (i.e. no shared driveways with the adjacent property). The selected multi-use site should have a minimal presence of through trips (i.e. external trips that pass through the site without stopping). What is NOT a multi-use development o CBD o Suburban activity centers o Existing ITE land use classification with potential for a mix of land uses, such as Shopping center Office park with retail Office building with retail Hotel with limited retail and restaurant space If there are no sites in your jurisdiction that meet all the above-mentioned criteria and/or pin pointing them becomes a difficult task, having a list of sites that meet some of these criteria can also provide us with some valuable information for our analysis. Therefore, any information that can guide us in the right direction is appreciated! Thank you for taking time out of your busy schedule to assist me with this research project. I am hoping that the results will be conclusive so it can be used by transportation professionals in our region as local data, and furthermore can be submitted to ITE for consideration in their trip generation publications nation-wide. If you have any questions or concerns, please do not hesitate to contact me. If this letter is sent to you in error, please forward to appropriate party. Thank you! Respectfully Mehrdad Givechi, PE, PTOE, Research Engineer Transportation Research Institute The University of Kansas 1530 W. 15th Street, 2160A Learned Hall Lawrence, KS Phone: Fax: mgivechi@ku.edu
258 Atchison Douglas County Garden City Gardner Great bend Hays Hutchinson Johnson County Kansas City Lansing Lawrence Leavenworth Leawood Lenexa Manhattan McPherson Miami County Mission Newton Olathe Ottawa Overland Park Prairie Village Salina Sedgwick County Shawnee Topeka Wichita List of Local Agencies Contacted (in alphabetic order)

259
MAPPING THE RAINFALL EVENT FOR STORMWATER QUALITY CONTROL
 Report No. K-TRAN: KU-03-1 FINAL REPORT MAPPING THE RAINFALL EVENT FOR STORMWATER QUALITY CONTROL C. Bryan Young The University of Kansas Lawrence, Kansas JULY 2006 K-TRAN A COOPERATIVE TRANSPORTATION
Trip Generation Characteristics of Super Convenience Market Gasoline Pump Stores
 Trip Generation Characteristics of Super Convenience Market Gasoline Pump Stores This article presents the findings of a study that investigated trip generation characteristics of a particular chain of
Trip Generation Study: A 7-Eleven Gas Station with a Convenience Store Land Use Code: 945
 Trip Generation Study: A 7-Eleven Gas Station with a Convenience Store Land Use Code: 945 Introduction The Brigham Young University Institute of Transportation Engineers student chapter (BYU ITE) completed
MEMORANDUM. Trip Generation Analysis
 MEMORANDUM To: RMC Architects From: Matthew Palmer, PE Subject: Trip Generation, Parking Analysis & Level of Service Project: Port of Everett, GTC #13-053 Date: August 25, 2014 The trip generation and
City of Hermosa Beach Beach Access and Parking Study. Submitted by. 600 Wilshire Blvd., Suite 1050 Los Angeles, CA
 City of Hermosa Beach Beach Access and Parking Study Submitted by 600 Wilshire Blvd., Suite 1050 Los Angeles, CA 90017 213.261.3050 January 2015 TABLE OF CONTENTS Introduction to the Beach Access and Parking
California Urban Infill Trip Generation Study. Jim Daisa, P.E.
 California Urban Infill Trip Generation Study Jim Daisa, P.E. What We Did in the Study Develop trip generation rates for land uses in urban areas of California Establish a California urban land use trip
Traffic Impact Study
 Traffic Impact Study Statham DRI One University Parkway Prepared for: Barrow County Prepared by: October 2012 Table of Contents Executive Summary i Section 1. Introduction 1 Project Description 1 Methodology
COUNCIL POLICY MANUAL
 COUNCIL POLICY MANUAL SECTION: PUBLIC WORKS SUBJECT: SNOW & ICE CONTROL POLICY 2012/2013 GOAL: Pages: 1 of 10 Approval Date: Dec. 3, 2012 Res. # 1001/2012 To annually identify the winter maintenance costs
April 10, Mr. Curt Van De Walle, City Manager City of Castle Hills 209 Lemonwood Drive Castle Hills, Texas 78213
 Mr. Curt Van De Walle, City Manager City of Castle Hills 209 Lemonwood Drive Castle Hills, Texas 78213 Subject: Revised Castle Hills BASIS Charter School Traffic Impact Analysis Review City of Castle Hills,
NATHAN HALE HIGH SCHOOL PARKING AND TRAFFIC ANALYSIS. Table of Contents
 Parking and Traffic Analysis Seattle, WA Prepared for: URS Corporation 1501 4th Avenue, Suite 1400 Seattle, WA 98101-1616 Prepared by: Mirai Transportation Planning & Engineering 11410 NE 122nd Way, Suite
ALTA VISTA COMMERCIAL/ RESIDENTIAL PROJECT
 ALTA VISTA COMMERCIAL/ RESIDENTIAL PROJECT TRAFFIC IMPACT ANALYSIS Prepared For: Paul Conzelman SC Development 2151 Michelson Drive, Suite 140 Irvine, CA 92612 Prepared By: 2030 Main Street, Suite 1200
Focused Traffic Analysis for the One Lincoln Park Project
 September 15, 2015 Mr. Bill Johnson Coldwell Banker 511 Sir Francis Drake Boulevard Greenbrae, CA 94904 Focused Traffic Analysis for the One Lincoln Park Project Dear Mr. Johnson; As requested, W-Trans
CVS Derwood. Local Area Transportation Review
 CVS Derwood Montgomery County, Maryland May 27, 2016 Local Area Transportation Review Prepared for: JC Bar Properties, Inc. Steve Fleming, PE 415 Fallowfield Road, Suite 301 Camp Hill, Pennsylvania 17011
January 12, Mr. Ryan Granger TMGB Wilson, LLC 2221 Health Drive SW, Suite 2200 Wyoming, Michigan 49519
 January 12, 2018 Mr. Ryan Granger TMGB Wilson, LLC 2221 Health Drive SW, Suite 2200 Wyoming, Michigan 49519 Re: Proposed Reserve at Rivertown Mixed-Use Development Updated Trip Generation and Site Driveway
MEMORANDUM. The study area of the analysis was discussed with City staff and includes the following intersections:
 MEMORANDUM DATE: JULY 6, 2012 TO: FROM: RE: CC: MELANIE KNIGHT BRAD BYVELDS/ JENNIFER LUONG 1050 SOMERSET STREET PRELIMINARY TRAFFIC ANALYSIS OUR FILE NO. 111152 NEIL MALHOTRA The purpose of this memo
The Urbana Free Library Parking and Transportation Study
 CHAMPAIGN COUNTY REGIONAL PLANNING COMMISSION The Urbana Free Library Parking and Transportation Study Final Report 7/18/2013 Champaign Urbana Urbanized Area Transportation Study (CUUATS) TABLE OF CONTENTS
Trip and Parking Generation Study of Orem Fitness Center-Abstract
 Trip and Parking Generation Study of Orem Fitness Center-Abstract The Brigham Young University Institute of Transportation Engineers student chapter (BYU ITE) completed a trip and parking generation study
Technical Memorandum #2 Future Conditions
 Technical Memorandum #2 Future Conditions To: Dan Farnsworth Transportation Planner Fargo-Moorhead Metro Council of Governments From: Rick Gunderson, PE Josh Hinds PE, PTOE Houston Engineering, Inc. Subject:
WOODRUFF ROAD CORRIDOR ORIGIN-DESTINATION ANALYSIS
 2018 WOODRUFF ROAD CORRIDOR ORIGIN-DESTINATION ANALYSIS Introduction Woodruff Road is the main road to and through the commercial area in Greenville, South Carolina. Businesses along the corridor have
Market Street PDP. Nassau County, Florida. Transportation Impact Analysis. VHB/Vanasse Hangen Brustlin, Inc. Nassau County Growth Management
 Transportation Impact Analysis Market Street PDP Nassau County, Florida Submitted to Nassau County Growth Management Prepared for TerraPointe Services, Inc. Prepared by VHB/Vanasse Hangen Brustlin, Inc.
WEBER ROAD RESIDENTIAL DEVELOPMENT Single Family Residential Project
 WEBER ROAD RESIDENTIAL DEVELOPMENT Single Family Residential Project WEBER ROAD RESIDENTIAL DEVELOPMENT TRAFFIC IMPACT STUDY TABLE OF CONTENTS 1.0 Executive Summary Page 2.0 Introduction 2.1 DEVELOPMENT
JEP John E. Jack Pflum, P.E. Consulting Engineering 7541 Hosbrook Road, Cincinnati, OH Telephone:
 JEP John E. Jack Pflum, P.E. Consulting Engineering 7541 Hosbrook Road, Cincinnati, OH 45243 Email: jackpflum1@gmail.com Telephone: 513.919.7814 MEMORANDUM REPORT Traffic Impact Analysis Proposed Soccer
Date: April 3, 2018 Revised May 15, Project #: Re: Burlington Mall Retail Collection Transportation Evaluation
 To: Chuck Schneider Burlington S&S, LLC 225 West Washington Street Indianapolis, IN 46204 From: Patrick Dunford, P.E. Senior Project Manager Date: April 3, 2018 Revised May 15, 2018 Project #: 13482.01
Neighborhood Locations and Amenities
 University of Maryland School of Architecture, Planning and Preservation Fall, 2014 Neighborhood Locations and Amenities Authors: Cole Greene Jacob Johnson Maha Tariq Under the Supervision of: Dr. Chao
MADISON, WI STONE HOUSE DEVELOPMENT 1000 E. WASHINGTON AVENUE REDEVELOPMENT TRANSPORTATION STUDY DECEMBER 14, 2015
 MADISON, WI STONE HOUSE DEVELOPMENT 1000 E. WASHINGTON AVENUE REDEVELOPMENT TRANSPORTATION STUDY DECEMBER 14, 2015 TABLE OF CONTENTS... 3 Proposed Development... 3 Methodology... 3 Phase 1 Development...
Forecasts for the Reston/Dulles Rail Corridor and Route 28 Corridor 2010 to 2050
 George Mason University Center for Regional Analysis Forecasts for the Reston/Dulles Rail Corridor and Route 28 Corridor 21 to 25 Prepared for the Fairfax County Department of Planning and Zoning Lisa
Parking Regulations Dundas Street West, from Bathurst Street to Dovercourt Road
 STAFF REPORT ACTION REQUIRED Parking Regulations Dundas Street West, from Bathurst Street to Dovercourt Road Date: October 28, 2008 To: From: Toronto and East York Community Council Director, Transportation
CONGLETON INDUSTRIAL PARK LT 6 EX W 300' & E 350' LT 7 BLK 1, a subdivision of land in the City of Overland Park, Johnson County, Kansas.
 NOTICE OF PUBLIC HEARING CITY PLANNING COMMISSION CITY OF OVERLAND PARK, KANSAS Notice is hereby given that the City Planning Commission of Overland Park, Kansas, will hold a public hearing Monday, July
Appendix C Final Methods and Assumptions for Forecasting Traffic Volumes
 Fairview Ave. and Main St. Improvements and Local Streets Plan Appendices Ada County Highway District Appendix C Final Methods and Assumptions for Forecasting Traffic Volumes January 3, 207 Appendices
Date: June 19, 2013 Meeting Date: July 5, Consideration of the City of Vancouver s Regional Context Statement
 Section E 1.5 To: From: Regional Planning and Agriculture Committee Lee-Ann Garnett, Senior Regional Planner Planning, Policy and Environment Department Date: June 19, 2013 Meeting Date: July 5, 2013 Subject:
APPENDIX I: Traffic Forecasting Model and Assumptions
 APPENDIX I: Traffic Forecasting Model and Assumptions Appendix I reports on the assumptions and traffic model specifications that were developed to support the Reaffirmation of the 2040 Long Range Plan.
PLAZA MEXICO RESIDENCES
 PLAZA MEXICO RESIDENCES TRAFFIC STUDY PREPARED FOR: 3000 E. IMPERIAL, LLC. 6940 Beach Boulevard, D-501 Buena Park, California 90621 PREPARED BY: OCTOBER 5, 2017 translutions the transportatio n solutions
DOWNTOWN SUB-AREA. Final Parking Study. Prepared for: City of Bellingham. March Prepared by:
 Final Parking Study DOWNTOWN SUB-AREA Prepared for: City of Bellingham March 2013 Prepared by: 11730 118 th Avenue NE, Suite 600 Kirkland, WA 98034-7120 Phone: 425-821-3665 Fax: 425-825-8434 www.transpogroup.com
HALFF 16196? TRAFFIC MANAGEMENT PLAN. Richardson ISD Aikin Elementary School Dallas, Texas North Bowser Road Richardson, Texas 75081
 30280 16196? TRAFFIC MANAGEMENT PLAN Exhibit 572B Aikin Elementary School Planned Development District No. 572 Approved City Plan Commission October20, 2016 July 12, 2016 Prepared for HALFF AVO 31586 PHO1
2129 NORTH MAIN STREET HOTE PROJECT ULI SHARED PARKING STUDY City of Santa Ana, California
 2129 NORTH MAIN STREET HOTE PROJECT ULI SHARED PARKING STUDY City of Santa Ana, California Prepared for: NET DEVELOPMENT COMPANY 3130 Airway Avenue Costa Mesa, CA 92626 Prepared by: RK ENGINEERING GROUP,
Town of Barnstable. Department of Public Work. Snow and Ice Control Operations Plan
 Town of Barnstable Department of Public Work Snow and Ice Control Operations Plan I. Mission: The mission of the Department of Public Works is to remove accumulations of snow and ice from town, county
DRAFT. Evaluation of Joint Sealant Materials, US-36, Doniphan County, Kansas. Report No. FHWA-KS-08-2
 Report No. FHWA-KS-08-2 final REPORT Evaluation of Joint Sealant Materials, US-36, Doniphan County, Kansas Rodney A. Montney, P.E. Robert F. Heinen John Wojakowski, P.E. Kansas Department of Transportation
REQUEST FOR PROPOSALS
 REQUEST FOR PROPOSALS 10782 Wattsburg Road Erie, PA 16509 The WATTSBURG AREA SCHOOL DISTRICT invites qualified vendors to submit proposals for CONTRACTED SNOW REMOVAL MANDATORY PRE-SUBMISSION MEETING All
INVITATION TO NEGOTIATE DOWNTOWN DEVELOPMENT OF CITY- OWNED SITES WITH PRIVATE SECTOR INVESTMENT PARTICIPATION
 INVITATION TO NEGOTIATE DOWNTOWN DEVELOPMENT OF CITY- OWNED SITES WITH PRIVATE SECTOR INVESTMENT PARTICIPATION John Zobler, City Manager March 10, 2015 Review of Needs, Wants & Desires 2 2004 Downtown
6711 LEE HIGHWAY TRAFFIC IMPACT STUDY ARLINGTON, VIRGINIA
 6711 TRAFFIC IMPACT STUDY ARLINGTON, VIRGINIA Prepared for: NVR, Inc. Prepared by: Wells + Associates, Inc. Michael J. Workosky, PTP, TOPS, TSOS John J. Andrus William L. Zeid, PE 703.917.6620 May 4, 2017
SNOW CONTROL OPERATIONS
 SNOW CONTROL OPERATIONS PUBLIC WORKS TEAM STREET MAINTENANCE DIVISION SNOW CONTROL OPERATIONS Standard Operating Procedures for Snow Removal Operations. 1. Plowing operations will be initiated when snow
ZONING. 195 Attachment 1
 ZONING 195 Attachment 1 Use Regulation Schedule Town of Chelmsford [Amended 10-16-2000 ATM by Art. 20; 5-3-2001 ATM by Art. 17; 10-15-2001 ATM by Art. 22; 4-29-2002 ATM by Art. 22; 10-24-2002 ATM by Art.
Monroe County: Key West and Lower Keys
 FDOT PROJECT UPDATES June 15-21, 2015 Monroe County: Key West and Lower Keys Monroe County projects website: www.fdotmonroe.com Opt Out: If you no longer wish to receive these weekly notifications, please
TRAFFIC IMPACT STUDY. Platte Canyon Villas Arapahoe County, Colorado (Arapahoe County Case Number: Z16-001) For
 For") TRAFFIC IMPACT STUDY For Platte Canyon Villas Arapahoe County, Colorado (Arapahoe County Case Number: Z16-001) February 2015 Revised: August 2015 April 2016 July 2016 September 2016 Prepared for: KB Home
TRAFFIC IMPACT STUDY For Platte Canyon Villas Arapahoe County, Colorado (Arapahoe County Case Number: Z16-001) February 2015 Revised: August 2015 April 2016 July 2016 September 2016 Prepared for: KB Home
Winning Farm of Winchester
 Winning Farm of Winchester Planning Board Presentation Winning Farm of Winchester 12.9 acres of undeveloped forest on the former Winning Farm site Located north of Thornberry Road in the northwestern corner
PW 001 SNOW REMOVAL AND SANDING FOR ROADWAYS AND SIDEWALKS October 6, 2014 (#223-14) Original October 19, 2015; October 15, 2018 Public Works
 Original October 19, 2015; October 15, 2018 Public Works") Policy Statement: The Village of Kitscoty will provide snow and ice control on municipal streets and sidewalks according to determined priorities. Purpose: To provide direction and information to employees
Policy Statement: The Village of Kitscoty will provide snow and ice control on municipal streets and sidewalks according to determined priorities. Purpose: To provide direction and information to employees
CITY OF NEW LONDON WINTER ROAD & SIDEWALK MAINTENANCE POLICY
 CITY OF NEW LONDON WINTER ROAD & SIDEWALK MAINTENANCE POLICY GENERAL The purpose of this policy is to set up acceptable procedures and policies for the winter maintenance of public areas in the City of
CUSTER COUNTY SNOW REMOVAL PROCEDURES
 CUSER COUNY SNOW REMOVAL PROCEDURES Prioritization of Plow Routes County-maintained roads are plowed based upon the following prioritization criteria: 1. Arterial Roadways and School Bus routes: Arterial
Trip Generation Model Development for Albany
 Trip Generation Model Development for Albany Hui (Clare) Yu Department for Planning and Infrastructure Email: hui.yu@dpi.wa.gov.au and Peter Lawrence Department for Planning and Infrastructure Email: lawrence.peter@dpi.wa.gov.au
BROOKINGS May
 Appendix 1. Technical Methodology This study combines detailed data on transit systems, demographics, and employment to determine the accessibility of jobs via transit within and across the country s 100
HORIZON 2030: Land Use & Transportation November 2005
 PROJECTS Land Use An important component of the Horizon transportation planning process involved reviewing the area s comprehensive land use plans to ensure consistency between them and the longrange transportation
SNOW REMOVAL - REQUEST FOR PROPOSAL. Snow Removal/Clearing and Sanding/Salting for Winter Fundy Ocean Research Center for Energy
 Fundy Ocean Research Center for Energy SNOW REMOVAL - REQUEST FOR PROPOSAL Snow Removal/Clearing and Sanding/Salting for Winter 2016-17 Sites 1. FORCE Sub-Station Driveway (portion of Old Black Rock Road),
Texas Transportation Institute The Texas A&M University System College Station, Texas
 1. Report No. FHWA/TX-03/4150-1 4. Title and Subtitle ANALYSIS OF TXDOT THICKNESS MEASUREMENT PROCEDURES FOR THERMOPLASTIC PAVEMENT MARKINGS Technical Report Documentation Page 2. Government Accession
Economic Activity Economic A ctivity
 5 Economic Economic Activity Activity ECONOMIC ACTIVITY 5.1 EMPLOYMENT... 5-7 5.1.1 OBJECTIVE... 5-7 5.1.2 POLICIES... 5-7 5.2 PROTECTING THE AREA OF EMPLOYMENT... 5-9 5.2.1 OBJECTIVE... 5-9 5.2.2 POLICIES...
City of Camrose Winter Road Maintenance Policy
 City of Camrose Winter Road Maintenance Policy The purpose of this policy is to outline the level of service that the City of Camrose delivers regarding the maintenance of roads in winter conditions. 1.
RE: Existing and Future Parking Demand Analysis St. Joseph Center Expansion
 HAND DELIVERED December 12, 2003 Mr. James S. Bancroft Chair, Board of Directors St. Joseph Center 204 Hampton Drive Venice, California 90291-8633 RE: Existing and Future Parking Demand Analysis St. Joseph
SNOW CONTROL OPERATIONS 2017 PUBLIC SERVICES DEPARTMENT MAINTENANCE DIVISION
 SNOW CONTROL OPERATIONS 2017 PUBLIC SERVICES DEPARTMENT MAINTENANCE DIVISION 1 SNOW CONTROL OPERATIONS The following are the standard operating procedures f snow removal operations. 1. Plowing operations
The Sunland Park flyover ramp is set to close the week of March 19 until early summer
 March 2, 2018 The Sunland Park flyover ramp is set to close the week of March 19 until early summer GO 10 is targeting the week of March 19 to close the Sunland Park Drive flyover entrance ramp to I 10
Case Special Exception request for Planned Unit Development (PUD) The Vineyards
 The Vineyards") Case 1627 Applicant: Developer: Request: Location: Pointe South Land Trust Contact Information: Jimmy Garrett 901-271-3642 N/A Special Exception request for Planned Unit Development (PUD) The Vineyards
Case 1627 Applicant: Developer: Request: Location: Pointe South Land Trust Contact Information: Jimmy Garrett 901-271-3642 N/A Special Exception request for Planned Unit Development (PUD) The Vineyards
Attachment E: CADP Design Shadow Analysis
 Attachment E: CADP Design Shadow Analysis June 6, 2016 TO: Don Lewis San Francisco Planning Department 1650 Mission Street, Suite 400 San Francisco, CA 94103 SUBJECT: 2060 Folsom Street 17 th & Folsom
KAISER SOUTH NORTHERN VIRGINIA HUB TRAFFIC IMPACT STUDY PRINCE WILLIAM COUNTY, VIRGINIA TABLE OF CONTENTS. Section 2 BACKGROUND INFORMATION 12
 KAISER SOUTH NORTHERN VIRGINIA HUB TRAFFIC IMPACT STUDY PRINCE WILLIAM COUNTY, VIRGINIA TABLE OF CONTENTS Page EXECUTIVE SUMMARY 1 Purpose of Report and Study Objectives... 1 Site Location and Study Area...
2014 Data Collection Project ITE Western District
 2014 Data Collection Project ITE Western District Project Completed By: Oregon State University OSU ITE Student Chapter 101 Kearney Hall Corvallis, OR 97331 Student Coordinator: Sarah McCrea (OSU ITE Student
Snow and Ice Removal
 Policy # 6.6 Procedure # - Replaces 5.10 & 5.10A Revises - Date Approved February 10, 2014 Method of Approval Resolution #17 1. PRINCIPLES The City of Dauphin desires to maintain the City streets, lanes,
930 Old Northern Rd & 4 Post Office Rd, Glenorie
 Proposed Mixed Use Development 930 Old Northern & 4, Glenorie TRAFFIC AND PARKING ASSESSMENT REPORT 13 December 2016 Ref 16264 Suite 6, 20 Young Street, Neutral Bay NSW 2089 - PO Box 1868, Neutral Bay
Snow and Ice Control POLICY NO. P-01/2015. CITY OF AIRDRIE Snow and Ice Control Policy
 Page 1 CITY OF AIRDRIE Snow and Ice Control Effective Date: Approved By: Approved On: March 17, 2015 City Council March 16, 2015 Revision Date: Resolution #: ------ PURPOSE: The City of Airdrie is responsible
Border Crossing Freight Delay Data Collection and Analysis World Trade Bridge Laredo International Bridge 4 Laredo, Texas
 Border Crossing Freight Delay Data Collection and Analysis World Trade Bridge Laredo International Bridge 4 Laredo, Texas The border crossing freight delay data collection and analysis project was conducted
Appendixx C Travel Demand Model Development and Forecasting Lubbock Outer Route Study June 2014
 Appendix C Travel Demand Model Development and Forecasting Lubbock Outer Route Study June 2014 CONTENTS List of Figures-... 3 List of Tables... 4 Introduction... 1 Application of the Lubbock Travel Demand
Guidelines on Using California Land Use/Transportation Planning Tools
 Guidelines on Using California Land Use/Transportation Planning Tools 1. Selecting Ds Analysis Modules Appropriate to a Region In almost all cases, the appropriate Ds Analysis Module to use for analysis
QUANTIFICATION OF THE NATURAL VARIATION IN TRAFFIC FLOW ON SELECTED NATIONAL ROADS IN SOUTH AFRICA
 QUANTIFICATION OF THE NATURAL VARIATION IN TRAFFIC FLOW ON SELECTED NATIONAL ROADS IN SOUTH AFRICA F DE JONGH and M BRUWER* AECOM, Waterside Place, Tygerwaterfront, Carl Cronje Drive, Cape Town, South
Data Collection. Lecture Notes in Transportation Systems Engineering. Prof. Tom V. Mathew. 1 Overview 1
 Data Collection Lecture Notes in Transportation Systems Engineering Prof. Tom V. Mathew Contents 1 Overview 1 2 Survey design 2 2.1 Information needed................................. 2 2.2 Study area.....................................
Dunn County Snow Removal Policy
 Dunn County Snow Removal Policy OVERVIEW With the advent of another winter season in the northern plains comes the possibility of snow, freezing rain and slippery roadways, and area resident s concern
FINAL REPORT EVALUATION REVIEW OF TVA'S LOAD FORECAST RISK
 Memorandum from the Office of the Inspector General Robert Irvin, WT 9C-K FINAL REPORT EVALUATION 2012-14507 REVIEW OF TVA'S LOAD FORECAST RISK As part of a series of reviews to evaluate the Tennessee
City of Saginaw Right of Way Division Snow and Ice Removal Policy January 18, 2016
 Snow and Ice Removal Policy January 18, 2016 It is the policy of the to provide snowplowing and ice removal services in order to: Provide safe traveling conditions for motorists and pedestrians Assist
APPENDIX IV MODELLING
 APPENDIX IV MODELLING Kingston Transportation Master Plan Final Report, July 2004 Appendix IV: Modelling i TABLE OF CONTENTS Page 1.0 INTRODUCTION... 1 2.0 OBJECTIVE... 1 3.0 URBAN TRANSPORTATION MODELLING
City of Laramie, Wyoming SNOW AND ICE POLICY
 City of Laramie, Wyoming SNOW AND ICE POLICY 11/02/89; rev 10/15/2007 I. INTRODUCTION The intention of this Policy is to set reasonable goals and general practices as a guide for the conduct of snow and
VALIDATING THE RELATIONSHIP BETWEEN URBAN FORM AND TRAVEL BEHAVIOR WITH VEHICLE MILES TRAVELLED. A Thesis RAJANESH KAKUMANI
 VALIDATING THE RELATIONSHIP BETWEEN URBAN FORM AND TRAVEL BEHAVIOR WITH VEHICLE MILES TRAVELLED A Thesis by RAJANESH KAKUMANI Submitted to the Office of Graduate Studies of Texas A&M University in partial
CITY OF MINOT SNOW REMOVAL PLAN October 2018
 CITY OF MINOT SNOW REMOVAL PLAN October 2018 1.0 GENERAL This plan has been written to provide information regarding snow removal procedures and policies. The plan provides guidance, while maintaining
FHWA/IN/JTRP-2008/1. Final Report. Jon D. Fricker Maria Martchouk
 FHWA/IN/JTRP-2008/1 Final Report ORIGIN-DESTINATION TOOLS FOR DISTRICT OFFICES Jon D. Fricker Maria Martchouk August 2009 Final Report FHWA/IN/JTRP-2008/1 Origin-Destination Tools for District Offices
SUBJECT: SUMMARY OF FINDINGS. October 29, Mr. Carter Redish Carter Group Architects, Inc S. El Camino Real, Suite F San Clemente, CA 92672
 October 29, 2018 Mr. Carter Redish Carter Group Architects, Inc. 1810 S. El Camino Real, Suite F San Clemente, CA 92672 SUBJECT: CANYON STEEL FOCUSED TRAFFIC IMPACT ANALYSIS Dear Mr. Carter Redish: Urban
Appendix I: Traffic Study
 City of Fontana Sierra Lakes Commerce Center Draft EIR Appendix I: Traffic Study FirstCarbon Solutions H:\Client (PN JN)\0144\01440050\EIR\1 ADEIR\01440050 Sec99 99 Appendix Dividers.doc THIS PAGE INTENTIONALLY
National Register of Historic Places Registration Form
 United States Department of the Interior National Park Service National Register of Historic Places Registration Form This form is for use in nominating or requesting determinations for individual properties
CITY OF MINOT SNOW REMOVAL PLAN November 2017
 CITY OF MINOT SNOW REMOVAL PLAN November 2017 1.0 GENERAL This plan has been written to provide information regarding snow removal procedures and policies. The plan provides guidance, while maintaining
Appendix C Traffic Study
 Final Environmental Impact Statement Appendix C Traffic Study Schofield Generating Station Project, Hawaii October 2015 C-1 Final Environmental Impact Statement This page intentionally left blank. Schofield
Creating a Pavement Management System Using GIS
 Christopher Castruita PPD 631 Prof. Barry Waite & Prof. Bonnie Shrewsbury Creating a Pavement Management System Using GIS Problem Definition As is the case with many cities, the city of La Cañada Flintridge
Engineer's Report. Main Street Business Area. Festoon Lighting and Sidewalk Cleaning Assessment District (Fiscal Year )
") Engineer's Report for the Main Street Business Area Festoon Lighting and Sidewalk Cleaning Assessment District (Fiscal Year 2008-09) Prepared under the provisions of the Benefit Assessment Act of 1982
Engineer's Report for the Main Street Business Area Festoon Lighting and Sidewalk Cleaning Assessment District (Fiscal Year 2008-09) Prepared under the provisions of the Benefit Assessment Act of 1982
PLANNING COMMISSION AGENDA
 COUNTY OF IMPERIAL COMMISSIONERS: Chairman: Rudy Schaffner Dennis Bergh Norm Niver Vice Chairman: Carson Kalin Sergio Cabanas Russell Roben Max Castillo Carlton A. Hargrave Ernesto Medina JIM MINNICK,
Attachment A. Page 1 of 15
 Page 1 of 15 EXECUTIVE SUMMARY The purpose of this study was to conduct a parking market rate analysis of pay parking facilities surrounding the Manchester area. The market rate analysis was conducted
SNOW REMOVAL GUIDE. City Of Orange Township. Public Works Snow Removal Hotline: (973) My Orange Hotline: (973)
 My Orange Hotline: (973)") Mayor Dwayne D. Warren, Esq. And The Orange Municipal Council MOVING ORANGE FORWARD City Of Orange Township SNOW REMOVAL GUIDE Public Works Snow Removal Hotline: (973) 266-4030 My Orange Hotline: (973)
Mayor Dwayne D. Warren, Esq. And The Orange Municipal Council MOVING ORANGE FORWARD City Of Orange Township SNOW REMOVAL GUIDE Public Works Snow Removal Hotline: (973) 266-4030 My Orange Hotline: (973)
REQUEST FOR PROPOSALS CLOSING DATE:
 Request for Proposals 110 Westlake Drive City of West Lake Hills 110 Westlake Drive REQUEST FOR PROPOSALS CLOSING DATE: Tuesday, October 23, 2018 City of West Lake Hills Request for Proposals 1 I. INTRODUCTION
Project Appraisal Guidelines
 Project Appraisal Guidelines Unit 16.2 Expansion Factors for Short Period Traffic Counts August 2012 Project Appraisal Guidelines Unit 16.2 Expansion Factors for Short Period Traffic Counts Version Date
I. M. Schoeman North West University, South Africa. Abstract
 Urban Transport XX 607 Land use and transportation integration within the greater area of the North West University (Potchefstroom Campus), South Africa: problems, prospects and solutions I. M. Schoeman
TREASURE COAST REGIONAL PLANNING COUNCIL M E M O R A N D U M. To: Council Members AGENDA ITEM 4B10
 TREASURE COAST REGIONAL PLANNING COUNCIL M E M O R A N D U M To: Council Members AGENDA ITEM 4B10 From: Date: Subject: Staff December 14, 2018 Council Meeting Local Government Comprehensive Plan Review
An online data and consulting resource of THE UNIVERSITY OF TOLEDO THE JACK FORD URBAN AFFAIRS CENTER
 An online data and consulting resource of THE JACK FORD URBAN AFFAIRS CENTER THE CENTER FOR GEOGRAPHIC INFORMATION SCIENCE AND APPLIED GEOGRAPHICS DEPARTMENT OF GEOGRAPHY AND PLANNING THE UNIVERSITY OF
Travel Demand Management Plan
 Travel Demand Management Plan Tryg s & Apartment Building 8 West Lake Street Minneapolis, MN AUTHORIZED PROPERTY REPRESENTATIVE: By Dated: Mr. Johnny Carlson Trammell Crow Chicago Development, Inc. 5 South
Re: Draft OPA 320 Recommended Amendments to Various Neighbourhood Policies Statutory Public Meeting to be held on Monday 16 November 2015
 PG8.5.5 ANALOGICA George S. Belza Partner 9 Madeline Road Toronto, Ontario Canada M2N 2S7 T: 416 223 9584 F: 416 223 5665 E: belana@axxent.ca E-Mailed to: pgmc@toronto.ca Wednesday 04 November 2015 Planning
Jordan Harrison, Planner III, San Francisco Recreation and Park Department
 Date November 18, 2015 To: Through: From: Subject: Recreation and Park Commission Philip A. Ginsburg, General Manager Dawn Kamalanathan, Director, Capital & Planning Division Jordan Harrison, Planner III,
Falling Weight Deflectometer vs Laboratory Determined Resilient Modulus (Slab Curling Study)
") FWD-RU6701 Falling Weight Deflectometer vs Laboratory Determined Resilient Modulus (Slab Curling Study) FINAL REPORT December 2005 Submitted by Dr. Sameh Zaghloul, P.E., P.Eng.* Managing Senior Principal
FWD-RU6701 Falling Weight Deflectometer vs Laboratory Determined Resilient Modulus (Slab Curling Study) FINAL REPORT December 2005 Submitted by Dr. Sameh Zaghloul, P.E., P.Eng.* Managing Senior Principal
Information for File # MMJ; Trunk Highway (TH) 7 / Louisiana Ave. Interchange Project
 7 / Louisiana Ave. Interchange Project") Information for File # 2013-00531-MMJ; Trunk Highway (TH) 7 / Louisiana Ave. Interchange Project Applicant: City of St. Louis Park Corps Contact: Melissa Jenny Address: U.S. Army Corps of Engineers Attn:
Information for File # 2013-00531-MMJ; Trunk Highway (TH) 7 / Louisiana Ave. Interchange Project Applicant: City of St. Louis Park Corps Contact: Melissa Jenny Address: U.S. Army Corps of Engineers Attn:
CITY OF PAPILLION PLANNING COMMISSION STAFF REPORT MAY 27, 2015 AGENDA 2015 ANNEXATION MISC
 PLANNING COMMISSION STAFF REPORT MAY 27, 2015 AGENDA 2015 ANNEXATION MISC-15-0005 I. GENERAL INFORMATION A. APPLICANT: City of Papillion 122 East Third St. Papillion, NE 68046 B. LEGAL DESCRIPTION: See
Subject: Desert Palisades Specific Plan - Tram Way Access Sight Distance
 Endo Engineering Traffic Engineering Air Quality Studies Noise Assessments July 13, 2015 Mr. Ed Freeman Pinnacle View, LLC P.O. Box 1754 Lake Oswego, OR 97035-0579 Subject: Desert Palisades Specific Plan