Section II: Assessing Chart Performance. (Jim Benneyan)
|
|
|
- Ruby McGee
- 6 years ago
- Views:
Transcription
1 Section II: Assessing Chart Performance (Jim Benneyan) 1
2 Learning Objectives Understand concepts of chart performance Two types of errors o Type 1: Call an in-control process out-of-control o Type 2: Call an unstable process stable Calculation and interpretation 2 o Probability point outside limits o Operation Characteristic (OC) Curves o Time until detection o Average run length (ARL) curves

3 What is the objective? 1. Do we want to Improve, detect changes (good & bad) Not 2. Do we want to do this Fast 3. Do we want to Slow Rarely make wrong conclusion Err a lot
4 Most important charts in SPC?
5 Testing over time Test 1 Test 3 Long term median Test 2 Where, if any, true improvements? Unlikely to detect improvement immediately: 1. RL is a statistical fact often takes a while 2. Intervention tuning and effect lags
6 Important process changes? Mean increases or decreases Percentage rate changes Counts rate changes Variance changes Concept sketch Are small or large changes more important to detect faster?
7 Average Run Length Control chart performance Sensitivity-Specificity Concept Interpretation. Poor design Specificity vs sensitivity (type 1 vs type 2 error) Narrow tall curve = Better! Good design True any statistical method Faster detection and / or with higher probability Out of control In-control Out of control ARL = Average run length Difference (out control) No difference (in control) Difference (out control) = Mean time until a signal of change
8 Probability of Signall In-control VAP rate Interpretation which better? 1.0 OC Curve Comparison 0.8 n = rule 2 rule 1 g-ma-min VAP Rate
9 True State of Process Out of Control In control Types of Errors Decision from the data point In control Out of Control Good Type I Error α Risk Type II Error β Risk Good
10
11 Example: Medical Records Audit We have been auditing records for a particular type of error (defect) for the past 24 months. We select 200 records at random each month and review them for the defect. The following control chart shows our observations
12 Proportion Control chart for Defect Rate P Chart of Errors 0.07 UCL= _ P= LCL= Month
13 Type 1 Error - Concept Probability call in-control process out-of-control If process unchanged (rate =.03188; 3.18 defects per 100 records) Probability point outside limits =? Probability of exceeding 3σ (for normal distribution) is Probability outside either limit = P(X < LCL) + P(X > UCL) = =.0027 (Note for later: 1/ ) This seems pretty good balance

14 Type 2 Error - Concept Probability call out-of-control process in-control Suppose Process has changed (to what? Matters!) Probability point outside limits =? Call the amount of the change and p a the new defect rate Suppose defect rate increased to = p a = p + = 0.05 Then Probability outside either limit = P(X < LCL) + P(X > UCL) =? = 1 - below
15 Calculation for p chart type 1 Upper 3 σ Control Limit is calculated as follows: UCL = + 3* If P = then the UCL is Similarly UCL for np chart (n = 200) is P (X > UCL) = P(X > 13.82) =.0053 P(X < LCL) = P(X < 0) = 0 P( false alarm ) = =.0053
16 P(X<=13) What if process has changed (type 2)? Much the same - Calculate probability point outside limit But use new defect rate (p a = p + ) New Defect rate P(X 13) Plot OOC defect rates Operating Characteristic Curve (OCC) In control defect rate Process unchanged True P Is this good? OOC defect rates
17 P(X<=13) Ideal OC Curve 1.0 Operating Characteristic Curve (OCC) Perfect detection Curve n=200 Never false alarm Ideal Curve True P Not possible! But steeper and taller is better.
18 Average Run Length (ARL) More practical meaning Remember we are monitoring process over time more than just this one point many points! If process shifts to a new level (P a ), it may not be detected on the very next point. (usually not!) How many points (run length) until shift is detected? This is the Average Run Length (ARL). Mean time until detection key concept!
19 ARL Calculation Call: = P(point outside limits) ARL = 1/. This is 1 minus value of OC curve vertical axis Easy to translate OC curve into ARL curve just take inverse, ARL = 1/(1-vertical value) Theory: o Each plotted point is a Bernoulli( ) trial with parameter o RL = number of points (BT s) until first one outside limits o Therefore RL ~ geometric( ) random variable o Expected value of geometric RV = 1/
20 Average Run Length For above example New Defect rate P(X UCL) ARL Average Run Length vs True P (% with defect) OK to never detect? Some detection delays ok True P Critical detection region
21 Your turn 1. For your earlier control chart, suppose the process remains the same. a. Compute the type 1 error: b. Compute the ARL:
22 Your turn 2. Suppose the process defect rate increases by 25% of its current p-bar value. For this one value of p a, a. Compute the type 2 error: b. Compute the ARL:
23 Section III: Improving performance (Victoria Jordan) 23
24 Learning Objectives Sample size selection, Simple rules Supplementary rules pros and cons EWMA and CUSUM charts - advantages and disadvantages 24
25 Improving SPC Performance How do we improve the power of the chart? 25
26 4 options (improving performance) X 1. Add within limit run rules. o Use caution. Lots of bad advice 2. Increase sample size o See following guidelines and reference 3. Use more powerful chart o EWMA, CUSUM, others 4. Use rare event charts 5. Other tricks, advanced topics
27 Option 1. Unnatural variation run rules 1. Any point outside either control limit 2. 8 consecutive points on same side of center line (CL) 3. 4 of 5 consecutive pts outside CL ± 1 SD (same side) Unlikely consecutive to occur values by chance within alone CL ± if 1 the SD process has not improved (or worsened) 5. 2 of 3 consecutive pts outside of CL ± 2 SD (same side) Likelihood of 14 consecutive of 8 heads points coin on tosses same in side a row of CL consecutive points exhibiting either an increasing or decreasing trend Black: Recommended So: If they occur, implies the process has changed 8. Cyclic or periodic behavior Note: Slight variations exist in different publications White: Variation reduction Grey: Inflates false signal rate (not recommended)
28 Run Rule Comments 1. Often recommended. 2. User beware also changes the Type I risk. 3. Assuming run rules are independent of each other (and this is not the case): If each rule is set at the equivalent of 3σ (Probability of Type I error is ), The with 8 run rules in play, the combined Probability of Type I is 1-(1-α) 8 = 1-( ) 8 = This is about 2.3 σ instead of 3σ. Total rules ~5% false alarm rate (ARL !!)
29 Run Rule Impact p charts Better sensitivity But higher false alarm rate Buyer beware!
30 Option 2: Improving sample sizes Different rules of thumb Rule 1: np and p charts: n p / 5 (p = defect rate) c and u charts: n / 5 ( = average) xbar charts: (see paper)
31 Rule 1. Reasonable bell-shape Binomial charts Poisson charts (CL 5) 33
32 Improving the Power (Ability to Detect a Process Change) For Attribute Charts (np, p, c, u): Add run rules. But, this will increase the Type I risk (false alarms) Increase sample size. General rule to use Normal approximation (Shewhart charts) is: np 5 for p-charts c 10 for u-charts May need to increase from there
33
34 Jan2006 Feb2006 Mar2006 Apr2006 May2006 Jun2006 Jul2006 Aug2006 Sep2006 Oct2006 Nov2006 Dec2006 Jan2007 Feb2007 Mar2007 Apr2007 May2007 Jun2007 Jul2007 Aug2007 Sep2007 Oct2007 Nov2007 Dec2007 Jan2008 Feb2008 Mar2008 Apr2008 May2008 Jun2008 Jul2008 Aug2008 Rate Drug Events 5.0? no data? u-chart: Events per 1000 Cases UCL= CL= LCL= Month

35 Effect of Sample Size on Performance Note that as sample size increases, the curve moves closer to the Ideal state larger samples are better
36 Sample Size Calculation - Example If SCIP bundle compliance averages 50% and is being tracked weekly on a p-chart, what sample size is suggested for the chart? What if compliance improves to 95%? Will that be enough to ensure a powerful chart?
37 Rule 2 and 3 2. Not a lot of zeros (P(X=0) >.05) p and np charts: c and u charts: 3. LCL > 0 p and np charts: 40 c and u charts:
38 Results for p charts
39 Results for u charts
40 Sample size look-up table See reference paper
41 Improving the Power (Ability to Detect a Process Change) For Variables Charts (X, R; X, s; X, MR): Add run rules. But, this will increase the Type I risk (false alarms) Increase sample size. Use X,R or X,s instead of X, MR (not always possible in healthcare must have rational subgroups) Increase the frequency of sampling (daily instead of weekly)
42 Similar Effect of Sample Size on X-bar charts
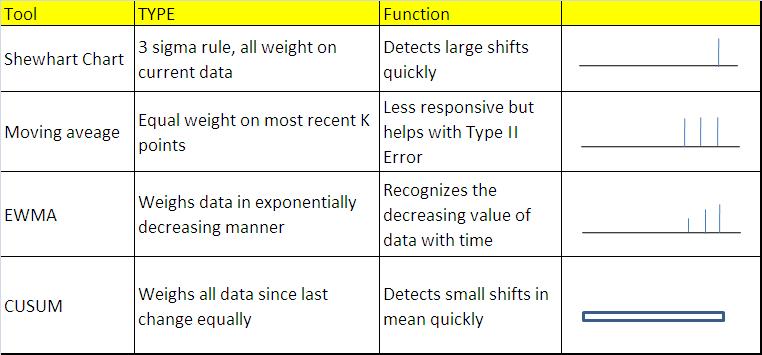
43 Option 3: More advanced SPC charts Exponentially weighted moving average (EWMA) Cumulative sum (CUSUM) Both combine past data, essentially forming large samples Advantages: More power (for small shifts) since Shewhart charts are weak here and past data amplifies small signals in the data Filter out noise to help see trends Disadvantages: Less power (for large shifts) since past data dilutes recent large signals in the data Can smooth out important noise
44 What they look like Opioid abuse rates Healthcare Systems Engineering Northeastern University 2010
: 99-109 Healthcare Systems Engineering www.coe.neu.")
45 Comparison Shewhart p chart (Opioid abuse rates) EWMA p chart (same data) Cusum p chart (same data, more later) Benneyan J, Butler S, Villapiano A, Katz N, Duffy M, Budman S (2011), A Statistical Process Control Approach to Prescription Medication and Opioid Abuse Surveillance, Journal of Addiction Medicine, 5(2): Healthcare Systems Engineering Northeastern University 2010
46 Performance Shewhart EWMA s Shift in p
47 EWMA charts how they are computed (see flip chart)
48 EWMA charts how they are computed (see flip chart)
49 Exercise Modify your earlier Shewhart p chart in Excel to be a EWMA p chart


50 CUSUM charts what they look like The mean shifted at point 50 from 100 to
51 CUSUM charts concept Useful in detecting small shifts in the mean. The idea is to look at difference between target and actual observations. In stable process, these differences should be randomly distributed about zero. If we add them up as we go, the sum should also fluctuate around zero. If the mean shifts, the sum will begin to get larger in magnitude and signal a change. 54 Math: beyond scope & time. See references
52 Univariate SPC Recap
53 Section V: Measurement Systems (J.B. and V.J.) 56
54 Table Exercise At your table Write on piece of paper the information from the following slide. Do not compare with your neighbor (yet) 57
55 Day 1 Count the number of F s Finished files are the result of years of scientific study combined with the experience of years 58

56 Day 2 Count the number of F s It is easy to miss the finer points in life. Folks are frequently guilty of falling into this trap 59
57 Day 3 Count the number of F s The necessity of training hands for firstclass farms in the fatherly handling of friendly farm livestock is foremost in the minds of farm owners. The forefathers of the farm owners trained the farm hands for the first-class farms in the 60 fatherly handling of livestock.
58 Day 4 Count the number of F s The owners of the farms feel they should carry on with the family tradition of training farm hands in the fatherly handling of farm stock because they feel it is the basis of good future farming. 61
59 Ferquency Sample 1 results Suppose F = Patient fall Average = St dev = 62 6 Number of Falls per Period
60 Ferquency Sample 2 results Average = St dev = 63 5 Number of Falls per Period
61 Ferquency Sample 3 results Average = St dev = Number of Falls per Period
62 Ferquency Sample 4 results Average = St dev = Number of Falls per Period
63 Summary Sample n X-bar s 2 R -hat 1 n 1 = x 1 = s 2 1 = R 1 = ^ 1 = 2 n 2 = x 2 = s 2 2 = R 2 = ^ 2 = 3 n 3 = x 3 = s 2 3 = R 3 = ^ 3 = 4 n 4 = x 4 = s 2 4 = R 4 = ^ 4 = Average x = s 2 = ^ -bar= 66
64 Some comments Some easier to see or miss than others Human factors rules the day No process variation within an item (exact) All within-item variation is 100% due to measurement system error True number each day =? True process variation day-to-day =? 67

65 68 A1c Example
66 Table Discussions Discuss 1. Where these concepts apply in your work environments 2. Strategies for reducing measurement error 3. Strategies for dealing with existence of measurement error (if can t be eliminated) 69
67 Assessing and Considering Measurement Error When the instrument reads sugar level of blood, is it correct? Is hand hygiene compliance correct? When someone reviews a medical record and determines the information to be coded, is it correct? What do we mean by correct?
68 Measurement Error - Definitions True Value - the value that IS correct (but is unknown) Resolution - the smallest increment that is measured. Bias average distance between observed value and the true value Accuracy Measure of bias; Is the instrument measuring close to the true value on average? Precision Variability in the measurement instrument
69 Two Types of Measurement Error Accuracy bias Precision variability
70 Example Is the measurement system accurate or precise if the true value = and repeated measurements of the same sample are: , 140.5, 130.0, 109.5, , 139.9, 140.1, 139.8, , 120.1, 119.9, 120.0,
71 Quantifying Measurement Error Observed Value = True Value + Measurement Error Var(OV) = Var(TV + E) 2 = P 2 + E 2 74 How to estimate E 2?
72 Two Components of Precision Variability due to Repeatability, RPT Differences in measurements on one sample for the same measurer (technician, nurse, instrument) over and over. Variability due to Reproducibility, RPD Differences in measurements on one sample between measurers.
73 Quantifying Measurement Error E 2 = RPT 2 + RPD 2 76
74 Estimate of Measurement Error Sample n X-bar s 2 R -hat 1 n 1 = x 1 = s 2 1 = R 1 = ^ 1 = 2 n 2 = x 2 = s 2 2 = R 2 = ^ 2 = 3 n 3 = x 3 = s 2 3 = R 3 = ^ 3 = 4 n 4 = x 4 = s 2 4 = R 4 = ^ 4 = Average x = s 2 = ^ -bar= 77
75 Four Types of Gage Studies Gage R&R (Tabular Form) Short Term (X-bar, R Chart) Long Term (X-bar, s chart) ANOVA
76 Measurement Error Present in all processes Adds to the total variability measured Can often be quantified If larger, can lead to wrong decisions 80
First Semester Dr. Abed Schokry SQC Chapter 9: Cumulative Sum and Exponential Weighted Moving Average Control Charts
 Department of Industrial Engineering First Semester 2014-2015 Dr. Abed Schokry SQC Chapter 9: Cumulative Sum and Exponential Weighted Moving Average Control Charts Learning Outcomes After completing this
Normalizing the I Control Chart
 Percent of Count Trade Deficit Normalizing the I Control Chart Dr. Wayne Taylor 80 Chart of Count 30 70 60 50 40 18 30 T E 20 10 0 D A C B E Defect Type Percent within all data. Version: September 30,
Selection of Variable Selecting the right variable for a control chart means understanding the difference between discrete and continuous data.
 Statistical Process Control, or SPC, is a collection of tools that allow a Quality Engineer to ensure that their process is in control, using statistics. Benefit of SPC The primary benefit of a control
Monitoring Platelet Issues - a novel approach CUSUM. Clive Hyam Blood Stocks Management Scheme London
 Monitoring Platelet Issues - a novel approach CUSUM Clive Hyam Blood Stocks Management Scheme London Overview of Presentation What s driving the need to better understand platelet issues Potential tools
Quality Control & Statistical Process Control (SPC)
") Quality Control & Statistical Process Control (SPC) DR. RON FRICKER PROFESSOR & HEAD, DEPARTMENT OF STATISTICS DATAWORKS CONFERENCE, MARCH 22, 2018 Agenda Some Terminology & Background SPC Methods & Philosophy
Quality Control & Statistical Process Control (SPC) DR. RON FRICKER PROFESSOR & HEAD, DEPARTMENT OF STATISTICS DATAWORKS CONFERENCE, MARCH 22, 2018 Agenda Some Terminology & Background SPC Methods & Philosophy
GAMINGRE 8/1/ of 7
 FYE 09/30/92 JULY 92 0.00 254,550.00 0.00 0 0 0 0 0 0 0 0 0 254,550.00 0.00 0.00 0.00 0.00 254,550.00 AUG 10,616,710.31 5,299.95 845,656.83 84,565.68 61,084.86 23,480.82 339,734.73 135,893.89 67,946.95
Percent
 Data Entry Spreadsheet to Create a C Chart Date Observations Mean UCL +3s LCL -3s +2s -2s +1s -1s CHART --> 01/01/00 2.00 3.00 8.20 0.00 6.46 0.00 4.73 0.00 01/02/00-3.00 8.20 0.00 6.46 0.00 4.73 0.00
Improve Forecasts: Use Defect Signals
 Improve Forecasts: Use Defect Signals Paul Below paul.below@qsm.com Quantitative Software Management, Inc. Introduction Large development and integration project testing phases can extend over many months
BUSI 460 Suggested Answers to Selected Review and Discussion Questions Lesson 7
 BUSI 460 Suggested Answers to Selected Review and Discussion Questions Lesson 7 1. The definitions follow: (a) Time series: Time series data, also known as a data series, consists of observations on a
2.830J / 6.780J / ESD.63J Control of Manufacturing Processes (SMA 6303) Spring 2008
 Spring 2008") MIT OpenCourseWare http://ocw.mit.edu 2.830J / 6.780J / ESD.63J Control of Processes (SMA 6303) Spring 2008 For information about citing these materials or our Terms of Use, visit: http://ocw.mit.edu/terms.
MIT OpenCourseWare http://ocw.mit.edu 2.830J / 6.780J / ESD.63J Control of Processes (SMA 6303) Spring 2008 For information about citing these materials or our Terms of Use, visit: http://ocw.mit.edu/terms.
arxiv: v1 [stat.me] 14 Jan 2019
![arxiv: v1 [stat.me] 14 Jan 2019](/thumbs/93/114174698.jpg "arxiv: v1 [stat.me] 14 Jan 2019") arxiv:1901.04443v1 [stat.me] 14 Jan 2019 An Approach to Statistical Process Control that is New, Nonparametric, Simple, and Powerful W.J. Conover, Texas Tech University, Lubbock, Texas V. G. Tercero-Gómez,Tecnológico
arxiv:1901.04443v1 [stat.me] 14 Jan 2019 An Approach to Statistical Process Control that is New, Nonparametric, Simple, and Powerful W.J. Conover, Texas Tech University, Lubbock, Texas V. G. Tercero-Gómez,Tecnológico
Process Behavior Analysis Understanding Variation
 Process Behavior Analysis Understanding Variation Steven J Mazzuca ASQ 2015-11-11 Why Process Behavior Analysis? Every day we waste valuable resources because we misunderstand or misinterpret what our
Statistical quality control (SQC)
") Statistical quality control (SQC) The application of statistical techniques to measure and evaluate the quality of a product, service, or process. Two basic categories: I. Statistical process control (SPC):
Statistical quality control (SQC) The application of statistical techniques to measure and evaluate the quality of a product, service, or process. Two basic categories: I. Statistical process control (SPC):
Time Series Analysis
 Time Series Analysis A time series is a sequence of observations made: 1) over a continuous time interval, 2) of successive measurements across that interval, 3) using equal spacing between consecutive
2.1 Inductive Reasoning Ojectives: I CAN use patterns to make conjectures. I CAN disprove geometric conjectures using counterexamples.
 2.1 Inductive Reasoning Ojectives: I CAN use patterns to make conjectures. I CAN disprove geometric conjectures using counterexamples. 1 Inductive Reasoning Most learning occurs through inductive reasoning,
spc Statistical process control Key Quality characteristic :Forecast Error for demand
 spc Statistical process control Key Quality characteristic :Forecast Error for demand BENEFITS of SPC Monitors and provides feedback for keeping processes in control. Triggers when a problem occurs Differentiates
Descriptive Statistics-I. Dr Mahmoud Alhussami
 Descriptive Statistics-I Dr Mahmoud Alhussami Biostatistics What is the biostatistics? A branch of applied math. that deals with collecting, organizing and interpreting data using well-defined procedures.
On Efficient Memory-Type Control Charts for Monitoring out of Control Signals in a Process Using Diabetic Data
 Biomedical Statistics and Informatics 017; (4): 138-144 http://www.sciencepublishinggroup.com/j/bsi doi: 10.11648/j.bsi.017004.1 On Efficient Memory-Type Control Charts for Monitoring out of Control Signals
Faculty of Science and Technology MASTER S THESIS
 Faculty of Science and Technology MASTER S THESIS Study program/ Specialization: Spring semester, 20... Open / Restricted access Writer: Faculty supervisor: (Writer s signature) External supervisor(s):
Control of Manufacturing Processes
 Control of Manufacturing Processes Subject 2.830 Spring 2004 Lecture #8 Hypothesis Testing and Shewhart Charts March 2, 2004 3/2/04 Lecture 8 D.E. Hardt, all rights reserved 1 Applying Statistics to Manufacturing:
A Theoretically Appropriate Poisson Process Monitor
 International Journal of Performability Engineering, Vol. 8, No. 4, July, 2012, pp. 457-461. RAMS Consultants Printed in India A Theoretically Appropriate Poisson Process Monitor RYAN BLACK and JUSTIN
Quality. Statistical Process Control: Control Charts Process Capability DEG/FHC 1
 Quality Statistical Process Control: Control Charts Process Capability DEG/FHC 1 SPC Traditional view: Statistical Process Control (SPC) is a statistical method of separating variation resulting from special
Smoothed Prediction of the Onset of Tree Stem Radius Increase Based on Temperature Patterns
 Smoothed Prediction of the Onset of Tree Stem Radius Increase Based on Temperature Patterns Mikko Korpela 1 Harri Mäkinen 2 Mika Sulkava 1 Pekka Nöjd 2 Jaakko Hollmén 1 1 Helsinki
The science of learning from data.
 STATISTICS (PART 1) The science of learning from data. Numerical facts Collection of methods for planning experiments, obtaining data and organizing, analyzing, interpreting and drawing the conclusions
THE DETECTION OF SHIFTS IN AUTOCORRELATED PROCESSES WITH MR AND EWMA CHARTS
 THE DETECTION OF SHIFTS IN AUTOCORRELATED PROCESSES WITH MR AND EWMA CHARTS Karin Kandananond, kandananond@hotmail.com Faculty of Industrial Technology, Rajabhat University Valaya-Alongkorn, Prathumthani,
YACT (Yet Another Climate Tool)? The SPI Explorer
? The SPI Explorer") YACT (Yet Another Climate Tool)? The SPI Explorer Mike Crimmins Assoc. Professor/Extension Specialist Dept. of Soil, Water, & Environmental Science The University of Arizona Yes, another climate tool for
YACT (Yet Another Climate Tool)? The SPI Explorer Mike Crimmins Assoc. Professor/Extension Specialist Dept. of Soil, Water, & Environmental Science The University of Arizona Yes, another climate tool for
Computing & Telecommunications Services
 Computing & Telecommunications Services Monthly Report September 214 CaTS Help Desk (937) 775-4827 1-888-775-4827 25 Library Annex helpdesk@wright.edu www.wright.edu/cats/ Table of Contents HEAT Ticket
Unit Two Descriptive Biostatistics. Dr Mahmoud Alhussami
 Unit Two Descriptive Biostatistics Dr Mahmoud Alhussami Descriptive Biostatistics The best way to work with data is to summarize and organize them. Numbers that have not been summarized and organized are
Computing & Telecommunications Services Monthly Report January CaTS Help Desk. Wright State University (937)
") January 215 Monthly Report Computing & Telecommunications Services Monthly Report January 215 CaTS Help Desk (937) 775-4827 1-888-775-4827 25 Library Annex helpdesk@wright.edu www.wright.edu/cats/ Last
January 215 Monthly Report Computing & Telecommunications Services Monthly Report January 215 CaTS Help Desk (937) 775-4827 1-888-775-4827 25 Library Annex helpdesk@wright.edu www.wright.edu/cats/ Last
2.830J / 6.780J / ESD.63J Control of Manufacturing Processes (SMA 6303) Spring 2008
 Spring 2008") MIT OpenCourseWare http://ocw.mit.edu 2.830J / 6.780J / ESD.63J Control of Processes (SMA 6303) Spring 2008 For information about citing these materials or our Terms of Use, visit: http://ocw.mit.edu/term
MIT OpenCourseWare http://ocw.mit.edu 2.830J / 6.780J / ESD.63J Control of Processes (SMA 6303) Spring 2008 For information about citing these materials or our Terms of Use, visit: http://ocw.mit.edu/term
STATISTICS AND PRINTING: APPLICATIONS OF SPC AND DOE TO THE WEB OFFSET PRINTING INDUSTRY. A Project. Presented. to the Faculty of
 STATISTICS AND PRINTING: APPLICATIONS OF SPC AND DOE TO THE WEB OFFSET PRINTING INDUSTRY A Project Presented to the Faculty of California State University, Dominguez Hills In Partial Fulfillment of the
Statistical Models for Rainfall with Applications to Index Insura
 Statistical Models for Rainfall with Applications to April 21, 2008 Overview The idea: Insure farmers against the risk of crop failure, like drought, instead of crop failure itself. It reduces moral hazard
ECE-580-DOE : Statistical Process Control and Design of Experiments Steve Brainerd 27 Distributions:
 Distributions ECE-580-DOE : Statistical Process Control and Design of Experiments Steve Brainerd 27 Distributions: 1/29/03 Other Distributions Steve Brainerd 1 Distributions ECE-580-DOE : Statistical Process
Zero-Inflated Models in Statistical Process Control
 Chapter 6 Zero-Inflated Models in Statistical Process Control 6.0 Introduction In statistical process control Poisson distribution and binomial distribution play important role. There are situations wherein
Jayalath Ekanayake Jonas Tappolet Harald Gall Abraham Bernstein. Time variance and defect prediction in software projects: additional figures
 Jayalath Ekanayake Jonas Tappolet Harald Gall Abraham Bernstein TECHNICAL REPORT No. IFI-2.4 Time variance and defect prediction in software projects: additional figures 2 University of Zurich Department
REPORT ON LABOUR FORECASTING FOR CONSTRUCTION
 REPORT ON LABOUR FORECASTING FOR CONSTRUCTION For: Project: XYZ Local Authority New Sample Project Contact us: Construction Skills & Whole Life Consultants Limited Dundee University Incubator James Lindsay
Technical note on seasonal adjustment for M0
 Technical note on seasonal adjustment for M0 July 1, 2013 Contents 1 M0 2 2 Steps in the seasonal adjustment procedure 3 2.1 Pre-adjustment analysis............................... 3 2.2 Seasonal adjustment.................................
In Centre, Online Classroom Live and Online Classroom Programme Prices
 In Centre, and Online Classroom Programme Prices In Centre Online Classroom Foundation Certificate Bookkeeping Transactions 430 325 300 Bookkeeping Controls 320 245 225 Elements of Costing 320 245 225
Surveillance of Infectious Disease Data using Cumulative Sum Methods
 Surveillance of Infectious Disease Data using Cumulative Sum Methods 1 Michael Höhle 2 Leonhard Held 1 1 Institute of Social and Preventive Medicine University of Zurich 2 Department of Statistics University
Performance of Number-Between g-type Statistical Control Charts for Monitoring Adverse Events
 To Appear in Health Care Management Science, 200 Performance of Number-Between g-type Statistical Control Charts for Monitoring Adverse Events Last Revised: August 9, 2000 James C. Benneyan * 334 Snell
Statistical Process Control
 Statistical Process Control Outline Statistical Process Control (SPC) Process Capability Acceptance Sampling 2 Learning Objectives When you complete this supplement you should be able to : S6.1 Explain
Lecture 12: Quality Control I: Control of Location
 Lecture 12: Quality Control I: Control of Location 10 October 2005 This lecture and the next will be about quality control methods. There are two reasons for this. First, it s intrinsically important for
A FACILITY MANAGER S INTRODUCTION TO WEATHER CORRECTION FOR UTILITY BILL TRACKING. John Avina, Director Abraxas Energy Consulting
 A FACILITY MANAGER S INTRODUCTION TO WEATHER CORRECTION FOR UTILITY BILL TRACKING John Avina, Director Abraxas Energy Consulting ABSTRACT Utility bill tracking is at the heart of an effective energy management
Our Experience With Westgard Rules
 Our Experience With Westgard Rules Statistical Process Control Wikipedia Is a method of quality control which uses statistical methods. SPC is applied in order to monitor and control a process. Monitoring
Part 3: Parametric Models
 Part 3: Parametric Models Matthew Sperrin and Juhyun Park August 19, 2008 1 Introduction There are three main objectives to this section: 1. To introduce the concepts of probability and random variables.
Your World is not Red or Green. Good Practice in Data Display and Dashboard Design
 Your World is not Red or Green Good Practice in Data Display and Dashboard Design References Tufte, E. R. (2). The visual display of quantitative information (2nd Ed.). Cheshire, CT: Graphics Press. Few,
The Levey-Jennings Chart. How to get the most out of your measurement system
 Quality Digest Daily, February 1, 2016 Manuscript 290 How to get the most out of your measurement system Donald J. Wheeler The Levey-Jennings chart was created in the 1950s to answer questions about the
= observed volume on day l for bin j = base volume in jth bin, and = residual error, assumed independent with mean zero.
 QB research September 4, 06 Page -Minute Bin Volume Forecast Model Overview In response to strong client demand, Quantitative Brokers (QB) has developed a new algorithm called Closer that specifically
Mr. XYZ. Stock Market Trading and Investment Astrology Report. Report Duration: 12 months. Type: Both Stocks and Option. Date: Apr 12, 2011
 Mr. XYZ Stock Market Trading and Investment Astrology Report Report Duration: 12 months Type: Both Stocks and Option Date: Apr 12, 2011 KT Astrologer Website: http://www.softwareandfinance.com/magazine/astrology/kt_astrologer.php
(Ch 3.4.1, 3.4.2, 4.1, 4.2, 4.3)
") 3 Probability Distributions (Ch 3.4.1, 3.4.2, 4.1, 4.2, 4.3) Probability Distribution Functions Probability distribution function (pdf): Function for mapping random variables to real numbers. Discrete
3 Probability Distributions (Ch 3.4.1, 3.4.2, 4.1, 4.2, 4.3) Probability Distribution Functions Probability distribution function (pdf): Function for mapping random variables to real numbers. Discrete
Change Point Estimation of the Process Fraction Non-conforming with a Linear Trend in Statistical Process Control
 Change Point Estimation of the Process Fraction Non-conforming with a Linear Trend in Statistical Process Control F. Zandi a,*, M. A. Nayeri b, S. T. A. Niaki c, & M. Fathi d a Department of Industrial
1 Normal Distribution.
 Normal Distribution.. Introduction A Bernoulli trial is simple random experiment that ends in success or failure. A Bernoulli trial can be used to make a new random experiment by repeating the Bernoulli
Discrete probability distributions
 Discrete probability s BSAD 30 Dave Novak Fall 08 Source: Anderson et al., 05 Quantitative Methods for Business th edition some slides are directly from J. Loucks 03 Cengage Learning Covered so far Chapter
Power Functions for. Process Behavior Charts
 Power Functions for Process Behavior Charts Donald J. Wheeler and Rip Stauffer Every data set contains noise (random, meaningless variation). Some data sets contain signals (nonrandom, meaningful variation).
TOPIC: Descriptive Statistics Single Variable
 TOPIC: Descriptive Statistics Single Variable I. Numerical data summary measurements A. Measures of Location. Measures of central tendency Mean; Median; Mode. Quantiles - measures of noncentral tendency
2.830J / 6.780J / ESD.63J Control of Manufacturing Processes (SMA 6303) Spring 2008
 Spring 2008") MIT OpenCourseWare http://ocw.mit.edu 2.830J / 6.780J / ESD.63J Control of Manufacturing Processes (SMA 6303) Spring 2008 For information about citing these materials or our Terms of Use, visit: http://ocw.mit.edu/terms.
MIT OpenCourseWare http://ocw.mit.edu 2.830J / 6.780J / ESD.63J Control of Manufacturing Processes (SMA 6303) Spring 2008 For information about citing these materials or our Terms of Use, visit: http://ocw.mit.edu/terms.
Continuous-Valued Probability Review
 CS 6323 Continuous-Valued Probability Review Prof. Gregory Provan Department of Computer Science University College Cork 2 Overview Review of discrete distributions Continuous distributions 3 Discrete
Statistics for IT Managers
 Statistics for IT Managers 95-796, Fall 2012 Module 2: Hypothesis Testing and Statistical Inference (5 lectures) Reading: Statistics for Business and Economics, Ch. 5-7 Confidence intervals Given the sample
Technical note on seasonal adjustment for Capital goods imports
 Technical note on seasonal adjustment for Capital goods imports July 1, 2013 Contents 1 Capital goods imports 2 1.1 Additive versus multiplicative seasonality..................... 2 2 Steps in the seasonal
Probability and Probability Distributions. Dr. Mohammed Alahmed
 Probability and Probability Distributions 1 Probability and Probability Distributions Usually we want to do more with data than just describing them! We might want to test certain specific inferences about
FEB DASHBOARD FEB JAN FEB MAR APR MAY JUN JUL AUG SEP OCT NOV DEC
 Positive Response Compliance 215 Compliant 215 Non-Compliant 216 Compliant 216 Non-Compliant 1% 87% 96% 86% 96% 88% 89% 89% 88% 86% 92% 93% 94% 96% 94% 8% 6% 4% 2% 13% 4% 14% 4% 12% 11% 11% 12% JAN MAR
Practice Problems Section Problems
 Practice Problems Section 4-4-3 4-4 4-5 4-6 4-7 4-8 4-10 Supplemental Problems 4-1 to 4-9 4-13, 14, 15, 17, 19, 0 4-3, 34, 36, 38 4-47, 49, 5, 54, 55 4-59, 60, 63 4-66, 68, 69, 70, 74 4-79, 81, 84 4-85,
Dates and Prices ICAEW - Manchester In Centre Programme Prices
 Dates and Prices ICAEW - Manchester - 2019 In Centre Programme Prices Certificate Level GBP ( ) Intensive Accounting 690 Assurance 615 Law 615 Business, Technology and Finance 615 Mangement Information
Approximating the step change point of the process fraction nonconforming using genetic algorithm to optimize the likelihood function
 Journal of Industrial and Systems Engineering Vol. 7, No., pp 8-28 Autumn 204 Approximating the step change point of the process fraction nonconforming using genetic algorithm to optimize the likelihood
TOPIC 12: RANDOM VARIABLES AND THEIR DISTRIBUTIONS
 TOPIC : RANDOM VARIABLES AND THEIR DISTRIBUTIONS In the last section we compared the length of the longest run in the data for various players to our expectations for the longest run in data generated
MATH 250 / SPRING 2011 SAMPLE QUESTIONS / SET 3
 MATH 250 / SPRING 2011 SAMPLE QUESTIONS / SET 3 1. A four engine plane can fly if at least two engines work. a) If the engines operate independently and each malfunctions with probability q, what is the
REGIONAL TRAINING COURSE ON METHODS AND TOOLS TO IDENTIFY SOURCES OF AIR POLLUTION
 REGIONAL TRAINING COURSE ON METHODS AND TOOLS TO IDENTIFY SOURCES OF AIR POLLUTION IAEA RER 1013: Supporting Air Quality Management Source apportionment by Positive Matrix Factorization Marta Almeida Email:
Confirmation Sample Control Charts
 Confirmation Sample Control Charts Stefan H. Steiner Dept. of Statistics and Actuarial Sciences University of Waterloo Waterloo, NL 3G1 Canada Control charts such as X and R charts are widely used in industry
Probability Distribution. Stat Camp for the MBA Program. Debbon Air Seat Release
 Stat Camp for the MBA Program Daniel Solow Lecture 3 Random Variables and Distributions 136 Probability Distribution Recall that a random variable is a quantity of interest whose value is uncertain and
Lecture 3. Discrete Random Variables
 Math 408 - Mathematical Statistics Lecture 3. Discrete Random Variables January 23, 2013 Konstantin Zuev (USC) Math 408, Lecture 3 January 23, 2013 1 / 14 Agenda Random Variable: Motivation and Definition
Monitoring and data filtering II. Dan Jensen IPH, KU
 Monitoring and data filtering II Dan Jensen IPH, KU Outline Introduction to Dynamic Linear Models (DLM) - Conceptual introduction - Difference between the Classical methods and DLM - A very simple DLM
How are adding integers and subtracting integers related? Work with a partner. Use integer counters to find 4 2. Remove 2 positive counters.
 . How are adding integers and subtracting integers related? ACTIVITY: Work with a partner. Use integer counters to find 4. Start with 4 positive counters. Remove positive counters. What is the total number
16.400/453J Human Factors Engineering. Design of Experiments II
 J Human Factors Engineering Design of Experiments II Review Experiment Design and Descriptive Statistics Research question, independent and dependent variables, histograms, box plots, etc. Inferential
Unit 4 Probability. Dr Mahmoud Alhussami
 Unit 4 Probability Dr Mahmoud Alhussami Probability Probability theory developed from the study of games of chance like dice and cards. A process like flipping a coin, rolling a die or drawing a card from
CUMULATIVE SUM CHARTS FOR HIGH YIELD PROCESSES
 Statistica Sinica 11(2001), 791-805 CUMULATIVE SUM CHARTS FOR HIGH YIELD PROCESSES T. C. Chang and F. F. Gan Infineon Technologies Melaka and National University of Singapore Abstract: The cumulative sum
Continuous Improvement Toolkit. Probability Distributions. Continuous Improvement Toolkit.
 Continuous Improvement Toolkit Probability Distributions The Continuous Improvement Map Managing Risk FMEA Understanding Performance** Check Sheets Data Collection PDPC RAID Log* Risk Analysis* Benchmarking***
Chapter 3 ANALYSIS OF RESPONSE PROFILES
 Chapter 3 ANALYSIS OF RESPONSE PROFILES 78 31 Introduction In this chapter we present a method for analysing longitudinal data that imposes minimal structure or restrictions on the mean responses over
Discrete Distributions
 A simplest example of random experiment is a coin-tossing, formally called Bernoulli trial. It happens to be the case that many useful distributions are built upon this simplest form of experiment, whose
Common Discrete Distributions
 Common Discrete Distributions Statistics 104 Autumn 2004 Taken from Statistics 110 Lecture Notes Copyright c 2004 by Mark E. Irwin Common Discrete Distributions There are a wide range of popular discrete
Lecture Prepared By: Mohammad Kamrul Arefin Lecturer, School of Business, North South University
 Lecture 15 20 Prepared By: Mohammad Kamrul Arefin Lecturer, School of Business, North South University Modeling for Time Series Forecasting Forecasting is a necessary input to planning, whether in business,
Sampling and Sample Size. Shawn Cole Harvard Business School
 Sampling and Sample Size Shawn Cole Harvard Business School Calculating Sample Size Effect Size Power Significance Level Variance ICC EffectSize 2 ( ) 1 σ = t( 1 κ ) + tα * * 1+ ρ( m 1) P N ( 1 P) Proportion
z and t tests for the mean of a normal distribution Confidence intervals for the mean Binomial tests
 z and t tests for the mean of a normal distribution Confidence intervals for the mean Binomial tests Chapters 3.5.1 3.5.2, 3.3.2 Prof. Tesler Math 283 Fall 2018 Prof. Tesler z and t tests for mean Math
Objective Experiments Glossary of Statistical Terms
 Objective Experiments Glossary of Statistical Terms This glossary is intended to provide friendly definitions for terms used commonly in engineering and science. It is not intended to be absolutely precise.
assumption identically change method. 1. Introduction1 .iust.ac.ir/ ABSTRACT identifying KEYWORDS estimation, Correlation,
 International Journal Industrial Engineering & Production Research (207) December 207, Volume 28, Number 4 pp. 367-376 DOI: 0.22068/ijiepr.28.4.367 http://ijiepr..iust.ac.ir/ Change-Point Estimation High-Yiel
Probability Distribution
 Economic Risk and Decision Analysis for Oil and Gas Industry CE81.98 School of Engineering and Technology Asian Institute of Technology January Semester Presented by Dr. Thitisak Boonpramote Department
Applied Statistics I
 Applied Statistics I (IMT224β/AMT224β) Department of Mathematics University of Ruhuna A.W.L. Pubudu Thilan Department of Mathematics University of Ruhuna Applied Statistics I(IMT224β/AMT224β) 1/158 Chapter
Scarborough Tide Gauge
 Tide Gauge Location OS: 504898E 488622N WGS84: Latitude: 54 16' 56.990"N Longitude: 00 23' 25.0279"W Instrument Valeport 740 (Druck Pressure Transducer) Benchmarks Benchmark Description TGBM = 4.18m above
SCIENCE & TECHNOLOGY
 Pertanika J. Sci. & Technol. 24 (1): 177-189 (2016) SCIENCE & TECHNOLOGY Journal homepage: http://www.pertanika.upm.edu.my/ A Comparative Study of the Group Runs and Side Sensitive Group Runs Control Charts
EXAM. Exam #1. Math 3342 Summer II, July 21, 2000 ANSWERS
 EXAM Exam # Math 3342 Summer II, 2 July 2, 2 ANSWERS i pts. Problem. Consider the following data: 7, 8, 9, 2,, 7, 2, 3. Find the first quartile, the median, and the third quartile. Make a box and whisker
PHP2510: Principles of Biostatistics & Data Analysis. Lecture X: Hypothesis testing. PHP 2510 Lec 10: Hypothesis testing 1
 PHP2510: Principles of Biostatistics & Data Analysis Lecture X: Hypothesis testing PHP 2510 Lec 10: Hypothesis testing 1 In previous lectures we have encountered problems of estimating an unknown population
ORF 245 Fundamentals of Statistics Chapter 9 Hypothesis Testing
 ORF 245 Fundamentals of Statistics Chapter 9 Hypothesis Testing Robert Vanderbei Fall 2014 Slides last edited on November 24, 2014 http://www.princeton.edu/ rvdb Coin Tossing Example Consider two coins.
(Ch 3.4.1, 3.4.2, 4.1, 4.2, 4.3)
") 3 Probability Distributions (Ch 3.4.1, 3.4.2, 4.1, 4.2, 4.3) Probability Distribution Functions Probability distribution function (pdf): Function for mapping random variables to real numbers. Discrete
3 Probability Distributions (Ch 3.4.1, 3.4.2, 4.1, 4.2, 4.3) Probability Distribution Functions Probability distribution function (pdf): Function for mapping random variables to real numbers. Discrete
ISyE 512 Chapter 7. Control Charts for Attributes. Instructor: Prof. Kaibo Liu. Department of Industrial and Systems Engineering UW-Madison
 ISyE 512 Chapter 7 Control Charts for Attributes Instructor: Prof. Kaibo Liu Department of Industrial and Systems Engineering UW-Madison Email: kliu8@wisc.edu Office: Room 3017 (Mechanical Engineering
Statistical Process Control
 Chapter 3 Statistical Process Control 3.1 Introduction Operations managers are responsible for developing and maintaining the production processes that deliver quality products and services. Once the production
Sections 01, 02, & 04 (Bressoud and Ehren) 9 October, 2015
 9 October, 2015") Math 135, Applied Calculus First Midterm Exam Sections 01, 02, & 04 (Bressoud and Ehren) 9 October, 2015 This exam is worth 100 points. Show your work. Partial credit will be given for partially correct
Math 135, Applied Calculus First Midterm Exam Sections 01, 02, & 04 (Bressoud and Ehren) 9 October, 2015 This exam is worth 100 points. Show your work. Partial credit will be given for partially correct
ECE 510 Lecture 6 Confidence Limits. Scott Johnson Glenn Shirley
 ECE 510 Lecture 6 Confidence Limits Scott Johnson Glenn Shirley Concepts 28 Jan 2013 S.C.Johnson, C.G.Shirley 2 Statistical Inference Population True ( population ) value = parameter Sample Sample value
Introduction to Supervised Learning. Performance Evaluation
 Introduction to Supervised Learning Performance Evaluation Marcelo S. Lauretto Escola de Artes, Ciências e Humanidades, Universidade de São Paulo marcelolauretto@usp.br Lima - Peru Performance Evaluation
Chapter 3 Probability Distribution
 Chapter 3 Probability Distribution Probability Distributions A probability function is a function which assigns probabilities to the values of a random variable. Individual probability values may be denoted
Lower Tuolumne River Accretion (La Grange to Modesto) Estimated daily flows ( ) for the Operations Model Don Pedro Project Relicensing
 Estimated daily flows ( ) for the Operations Model Don Pedro Project Relicensing") Lower Tuolumne River Accretion (La Grange to Modesto) Estimated daily flows (1970-2010) for the Operations Model Don Pedro Project Relicensing 1.0 Objective Using available data, develop a daily time series
Lower Tuolumne River Accretion (La Grange to Modesto) Estimated daily flows (1970-2010) for the Operations Model Don Pedro Project Relicensing 1.0 Objective Using available data, develop a daily time series
Design and Implementation of CUSUM Exceedance Control Charts for Unknown Location
 Design and Implementation of CUSUM Exceedance Control Charts for Unknown Location MARIEN A. GRAHAM Department of Statistics University of Pretoria South Africa marien.graham@up.ac.za S. CHAKRABORTI Department