*Department Statistics and Operations Research (UPC) ** Department of Economics and Economic History (UAB)
|
|
|
- Terence Phillips
- 6 years ago
- Views:
Transcription
1 Wind power: Exploratory space-time analysis with M. P. Muñoz*, J. A. Sànchez*, M. Gasulla*, M. D. Márquez** *Department Statistics and Operations Research (UPC) ** Department of Economics and Economic History (UAB) 1 Outline 1. Introduction & Objectives 2. Exploratory Data Analysis 3. ECF: Empirical-Correlation Function 4. EOF: Empirical Orthogonal Function 5. Conclusions 2 2
2 Motivation o Knowing the speed and wind direction and its evolution is very important in wind generation planning Statistical models suitable for generation planning take into account the space time components of the wind, These components are highly related to each other and to other meteorological variables 3 3 Evolution of speed and wind direction Statistical models: Space time components of the wind Wind generation planning Pressure Temperature 4 4
3 Objectives Visualize the spatiotemporal relationships between the variables involved in the problem using the functions we have programmed in R as well as other functions already implemented in R libraries Descriptive techniques: - graphical representations of speed and wind direction - correlation between different space-time variable - autocorrelation functions implemented in several space and time lags - EOF: empirical orthogonal functions
4 Data description: Data from Hirlam model Period 01/01/2009 to 31/12/2009 Frequency 3 hours Missingdata 01/06/2009 and02/06/2009 Temporal reference system Modeling UTC(~ GMT) Daily Analysis at 00:00 and forecasting at 3, 6, 9, 12, 15, 18, and 21 hours Coordinates LON = W4 o 30 : W6 o 30 LAT = N35 o 3 : N36 o 5 7 Data description: North Component (315 o -45 o ) East Component (45 o -135 o ) South Component (135 o -225 o ) West Component (225 o -315 o ) 8
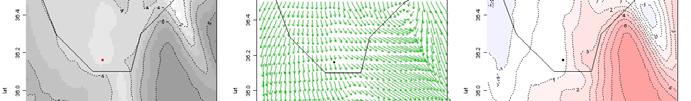

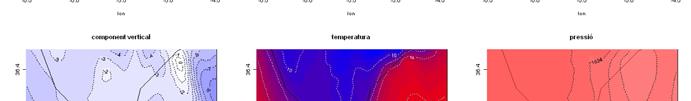
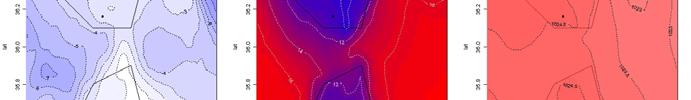
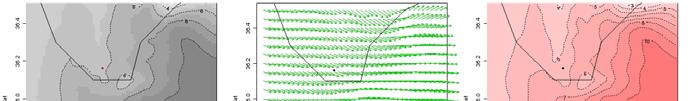
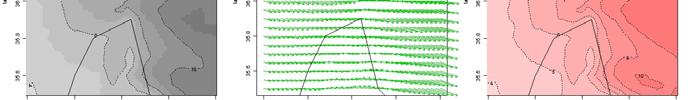
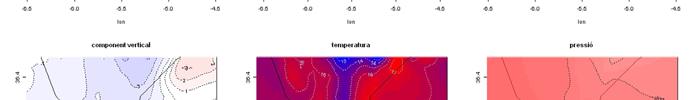
5 R packages:akima, fields and maps Wind speed, Temperature and Pressure 3.00h 2009/01/14 9 R packages:akima, fields and maps Wind speed, Temperature and Pressure 12.00h 2009/02/


6 Marginal plots: Space (1-D)/Time Plots 1 Method for illustrating the wave propagation of climate variables. For example, wind, temperature, Bidimensional plot : x-axis contains time; y-axis represents latitude or longitude They help to find patterns, anomalies, Visual evidence of climate variable behavior 1 Cressie, N., Wikle, C.K Statistics for Spatio-Temporal Data. Wiley R code: Our implementation Wind: From March 9 to Mach , wind direction (lat) ranged around 100º C: East wind (Levante) 12 12
 ranged around")


7 R code: Our implementation Wind: From March 9 to March , wind direction (lon) ranged around 100º C: East wind (Levante) R code: Our implementation speed-direction speed peed sp Wind (yearly) Highest wind speeds when the wind direction ranges around 100º C: East wind (Levante) 14 14
,, Z( s, t))' The empirical lag- spatial covariance matrix is Cˆ (")
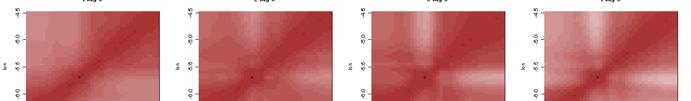
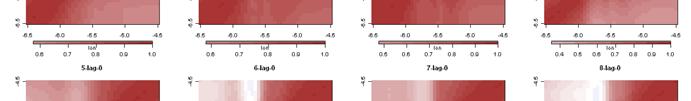
8 R package: WindRose Speed and direction The same conclusion as in the previous slide Empirical Correlation Function 1 Procedure for detecting spatio-temporal correlations between of climate variables as for example wind It is convenient to present graphically these matrices The space-time observations are Z t ( Z( s1, t),, Z( s, t))' The empirical lag- spatial covariance matrix is Cˆ ( ) Z 1 T T ( Z m ˆ )( Z t Z t t 1 Where the empirical spatial mean is Where s is for space and t for time ˆ Z )', 1 ˆ T Z Z t T t 1 The empirical lag- spatial correlation matrix is Rˆ ( ) ˆ 1/ 2 ( ) ˆ 1/ 2 Z DZ CZ DZ ˆ and (0 D diag( ) 0,1,, T 1 1 Cressie, N., Wikle, C.K Statistics for Spatio-Temporal p Data. Wiley ˆ ˆ ) Z C Z 16 16


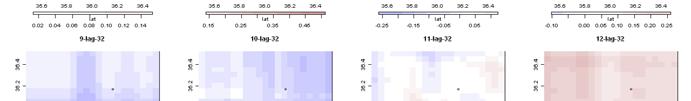
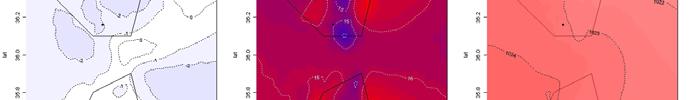
9 R our: Own implementation Empirical correlation (lat) at lag 0, for the twelve months R code: Our implementation Empirical correlation (lat) at lag 32, for the twelve months 18 18
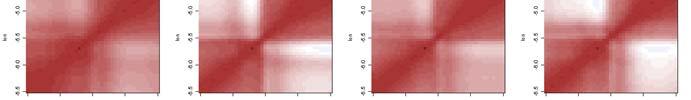
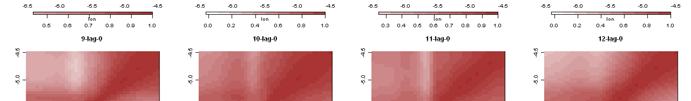

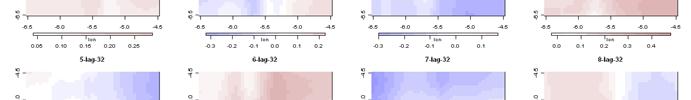
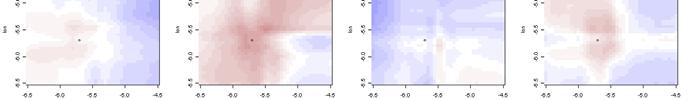
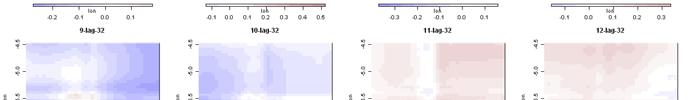
10 R code: Our implementation Empirical correlation (lon) at lag 0, for the twelve months R code: Our implementation Empirical correlation (lon) at lag 32, for the twelve months 20
11 Spatio-temporal Kriging :00: :06: :12: :18: :25: :31: :37: :44: R packages: sp, mapdata, maps, maptools, rgdal, xts, gstat, spacetime :50: :56: :03: :09: :15: :22: :28: :34:44 6 Procedure for space-time interpolation from a sample (x in 5 the plot ) Variable: wind speed 4 Date: 2009/03/01. Hours: 20 hours, starting at 0:00 and finishing at 21: :41: :47: :53: :00: EOF: Empirical Orthogonal Function EOF is the geophysicist s i terminology for the eigenvectors in the classical eigenvalue/eigenvector decomposition of a covariance matrix 1,2 Reduce the dimensionality (space or time component) in a large spatio-temporal data set. EOF identifies structures in the space dimension 3 Useful to forecast space-time superficies as for example wind or sea surface temperatures 1 Cressie, N., Wikle, C.K Statistics for Spatio-Temporal p Data. Wiley 2 Pebesma, E Classes and methods for spatio-temporal data in R: the spacetime package (cran.r-project.org) 3 Le,N.D., Zidek, J.V Statistical analysis of environmental space-time processes. Springer 22 22
12 EOF applied to wind speed 66 time series (one in each point), observations every 3 hours for 2 years 36.5 N X21.41 X21.37 X21.33 X21.29 X21.25 X21.21 X21.17 X21.13 X21.9 X21.5 X21.1 X17.41 X17.37 X17.33 X17.29 X17.25 X17.21 X17.17 X17.13 X17.9 X17.5 X17.1 X13.41 X13.37 X13.33 X13.29 X13.25 X13.21 X13.17 X13.13 X13.9 X13.5 X13.1 X9.41 X9.37 X9.33 X9.29 X9.25 X9.21 X9.17 X9.13 X9.9 X9.5 X9.1 X5.41 X5.37 X5.33 X5.29 X5.25 X5.21 X5.17 X5.13 X5.9 X5.5 X N X1.41 X1.37 X1.33 X1.29 X1.25 X1.21 X1.17 X1.13 X1.9 X1.5 X W 6 W 5.5 W 5 W 4.5 W This plot shows the wind speed at 66 points during 6 days (from Aug/07/2009 to Aug/12/2009). Each row has the 8 observations at day. Wind Speed 6.5 W6 W5.5 W5 W4.5 W 6.5 W6 W5.5 W5 W4.5 W 6.5 W6 W5.5 W5 W4.5 W 6.5 W6 W5.5 W5 W4.5 W :00: :00: :00: :00: :00: :00: :00: :00: :00: :00: :00: :00: :00: :00: :00: :00: :00: :00: :00: :00: :00: :00: :00: :00: :00: :00: :00: :00: :00: :00: :00: :00: :00: :00: :00: :00: :00: :00: :00: :00: :00: :00: W6 W5.5 W5 W4.5 W 6.5 W6 W5.5 W5 W4.5 W 6.5 W6 W5.5 W5 W4.5 W 6.5 W6 W5.5 W5 W4.5 W :00: :00: :00: :00: :00: :00:
13 Spatial EOF EOF's EOF1 6.5 W 6 W 5.5 W 5 W 4.5 W EOF2 The first six EOF EOF3 EOF The first component clearly separates land / sea and the second west / east 0 EOF5 EOF W 6 W 5.5 W 5 W 4.5 W Temporal EOF First EOF Second EOF EOF EOF ene 01 00:00 sep 01 00:00 may 01 00:00 dic 01 00:00 ene 01 00:00 sep 01 00:00 may 01 00:00 dic 01 00:00 Third EOF Fourth EOF EOF EOF ene 01 00:00 sep 01 00:00 may 01 00:00 dic 01 00:00 ene 01 00:00 sep 01 00:00 may 01 00:00 dic 01 00:00 Fifth EOF Sixth EOF EOF EOF ene 01 00:00 sep 01 00:00 may 01 00:00 dic 01 00:00 ene 01 00:00 sep 01 00:00 may 01 00:00 dic 01 00:
14 Conclusions The relationships detected by the exploratory space time analysis are very useful in the statistical models, obtaining more accurate models The forecast of future wind values will be more accurate. ate The accuracy achieved in predicting wind speed and direction will have a positive impact on the quality of wind generation forecasts. The presented techniques will be useful for diagnosing the quality of fit for the estimated models
SPATIO-TEMPORAL REGRESSION MODELS FOR DEFORESTATION IN THE BRAZILIAN AMAZON
 SPATIO-TEMPORAL REGRESSION MODELS FOR DEFORESTATION IN THE BRAZILIAN AMAZON Giovana M. de Espindola a, Edzer Pebesma b,c1, Gilberto Câmara a a National institute for space research (INPE), Brazil b Institute
Hierarchical Modeling for Spatio-temporal Data
 Hierarchical Modeling for Spatio-temporal Data Sudipto Banerjee 1 and Andrew O. Finley 2 1 Biostatistics, School of Public Health, University of Minnesota, Minneapolis, Minnesota, U.S.A. 2 Department of
Flexible Spatio-temporal smoothing with array methods
 Int. Statistical Inst.: Proc. 58th World Statistical Congress, 2011, Dublin (Session IPS046) p.849 Flexible Spatio-temporal smoothing with array methods Dae-Jin Lee CSIRO, Mathematics, Informatics and
JMA s Seasonal Prediction of South Asian Climate for Summer 2018
 JMA s Seasonal Prediction of South Asian Climate for Summer 2018 Atsushi Minami Tokyo Climate Center (TCC) Japan Meteorological Agency (JMA) Contents Outline of JMA s Seasonal Ensemble Prediction System
SIMULATION AND PREDICTION OF SUMMER MONSOON CLIMATE OVER THE INDOCHINA PENINSULA BY RSM
 2017 ACTS Workshop on Extreme Weather Forecast and Water Resources Management SIMULATION AND PREDICTION OF SUMMER MONSOON CLIMATE OVER THE INDOCHINA PENINSULA BY RSM Presenter: Nguyen Ngoc Bich Phuong
Geostatistical Modeling for Large Data Sets: Low-rank methods
 Geostatistical Modeling for Large Data Sets: Low-rank methods Whitney Huang, Kelly-Ann Dixon Hamil, and Zizhuang Wu Department of Statistics Purdue University February 22, 2016 Outline Motivation Low-rank
Standardized Anomaly Model Output Statistics Over Complex Terrain.
 Standardized Anomaly Model Output Statistics Over Complex Terrain Reto.Stauffer@uibk.ac.at Outline statistical ensemble postprocessing introduction to SAMOS new snow amount forecasts in Tyrol sub-seasonal
Principal Component Analysis of Sea Surface Temperature via Singular Value Decomposition
 Principal Component Analysis of Sea Surface Temperature via Singular Value Decomposition SYDE 312 Final Project Ziyad Mir, 20333385 Jennifer Blight, 20347163 Faculty of Engineering Department of Systems
E = UV W (9.1) = I Q > V W
 = I Q > V W") 91 9. EOFs, SVD A common statistical tool in oceanography, meteorology and climate research are the so-called empirical orthogonal functions (EOFs). Anyone, in any scientific field, working with large
91 9. EOFs, SVD A common statistical tool in oceanography, meteorology and climate research are the so-called empirical orthogonal functions (EOFs). Anyone, in any scientific field, working with large
Spatio-temporal analysis and interpolation of PM10 measurements in Europe for 2009
 Spatio-temporal analysis and interpolation of PM10 measurements in Europe for 2009 ETC/ACM Technical Paper 2012/8 March 2013 revised version Benedikt Gräler, Mirjam Rehr, Lydia Gerharz, Edzer Pebesma The
The Maritime Continent as a Prediction Barrier
 The Maritime Continent as a Prediction Barrier for the MJO Augustin Vintzileos EMC/NCEP SAIC Points to take back home. Forecast of the MJO is at, average, skillful for lead times of up to circa 2 weeks.
Influence of the Western Pacific Subtropical High on summertime ozone variability in East China
 Influence of the Western Pacific Subtropical High on summertime ozone variability in East China Zijian Zhao 1 and Yuxuan Wang 1,2 1 Dept. Earth System Sciences, Tsinghua University, China 2 Dept. Earth
On Sampling Errors in Empirical Orthogonal Functions
 3704 J O U R N A L O F C L I M A T E VOLUME 18 On Sampling Errors in Empirical Orthogonal Functions ROBERTA QUADRELLI, CHRISTOPHER S. BRETHERTON, AND JOHN M. WALLACE University of Washington, Seattle,
Gridded monthly temperature fields for Croatia for the period
 Gridded monthly temperature fields for Croatia for the 1981 2010 period comparison with the similar global and European products Melita Perčec Tadid melita.percec.tadic@cirus.dhz.hr Meteorological and
Atmospheric circulation analysis for seasonal forecasting
 Training Seminar on Application of Seasonal Forecast GPV Data to Seasonal Forecast Products 18 21 January 2011 Tokyo, Japan Atmospheric circulation analysis for seasonal forecasting Shotaro Tanaka Climate
SPATIO-TEMPORAL METHODS IN CLIMATOLOGY. Christopher K. Wikle Department of Statistics, University of Missouri Columbia, USA
 SPATIO-TEMPORAL METHODS IN CLIMATOLOGY Christopher K. Wikle Department of Statistics, University of Missouri Columbia, USA Keywords: Data assimilation, Empirical orthogonal function, Principal oscillation
A Gaussian state-space model for wind fields in the North-East Atlantic
 A Gaussian state-space model for wind fields in the North-East Atlantic Julie BESSAC - Université de Rennes 1 with Pierre AILLIOT and Valï 1 rie MONBET 2 Juillet 2013 Plan Motivations 1 Motivations 2 Context
Cross-covariance Functions for Tangent Vector Fields on the Sphere
 Cross-covariance Functions for Tangent Vector Fields on the Sphere Minjie Fan 1 Tomoko Matsuo 2 1 Department of Statistics University of California, Davis 2 Cooperative Institute for Research in Environmental
2. Outline of the MRI-EPS
 2. Outline of the MRI-EPS The MRI-EPS includes BGM cycle system running on the MRI supercomputer system, which is developed by using the operational one-month forecasting system by the Climate Prediction
DATA ASSIMILATION FOR FLOOD FORECASTING
 DATA ASSIMILATION FOR FLOOD FORECASTING Arnold Heemin Delft University of Technology 09/16/14 1 Data assimilation is the incorporation of measurement into a numerical model to improve the model results
Space-time data. Simple space-time analyses. PM10 in space. PM10 in time
 Space-time data Observations taken over space and over time Z(s, t): indexed by space, s, and time, t Here, consider geostatistical/time data Z(s, t) exists for all locations and all times May consider
Wind Resource Modelling using the Markov Transition Probability Matrix Method
 Twelfth LACCEI Latin American and Caribbean Conference for Engineering and Technology (LACCEI 214) Excellence in Engineering To Enhance a Country s Productivity July 22-24, 214 Guayaquil, Ecuador. Wind
Estimation of non-stationary spatial covariance structure
 Estimation of non-stationary spatial covariance structure DAVID J NOTT Department of Statistics, University of New South Wales, Sydney 2052, Australia djn@mathsunsweduau WILLIAM T M DUNSMUIR Division of
Effects Of Aerosols On Indian Summer Monsoon Rainfall During El Niño
 International Workshop on Atmospheric Composition and the Asian Summer Monsoon Bangkok 8th-10th June 2015 Effects Of On Indian Summer Monsoon Rainfall During El Niño Suvarna Fadnavis, CHAITRI ROY, Ashok
Lecture 14 Bayesian Models for Spatio-Temporal Data
 Lecture 14 Bayesian Models for Spatio-Temporal Data Dennis Sun Stats 253 August 13, 2014 Outline of Lecture 1 Recap of Bayesian Models 2 Empirical Bayes 3 Case 1: Long-Lead Forecasting of Sea Surface Temperatures
BAYESIAN PROCESSOR OF ENSEMBLE (BPE): PRIOR DISTRIBUTION FUNCTION
: PRIOR DISTRIBUTION FUNCTION") BAYESIAN PROCESSOR OF ENSEMBLE (BPE): PRIOR DISTRIBUTION FUNCTION Parametric Models and Estimation Procedures Tested on Temperature Data By Roman Krzysztofowicz and Nah Youn Lee University of Virginia
BAYESIAN PROCESSOR OF ENSEMBLE (BPE): PRIOR DISTRIBUTION FUNCTION Parametric Models and Estimation Procedures Tested on Temperature Data By Roman Krzysztofowicz and Nah Youn Lee University of Virginia
URBAN HEAT ISLAND IN SEOUL
 URBAN HEAT ISLAND IN SEOUL Jong-Jin Baik *, Yeon-Hee Kim ** *Seoul National University; ** Meteorological Research Institute/KMA, Korea Abstract The spatial and temporal structure of the urban heat island
Refractivity Data Fusion
 DISTRIBUTION STATEMENT A. Approved for public release; distribution is unlimited. Refractivity Data Fusion Ted Rogers Peter Gerstoft and Caglar Yardim SPAWAR Systems Center, Pacific University of California,
Predictive spatio-temporal models for spatially sparse environmental data. Umeå University
 Seminar p.1/28 Predictive spatio-temporal models for spatially sparse environmental data Xavier de Luna and Marc G. Genton xavier.deluna@stat.umu.se and genton@stat.ncsu.edu http://www.stat.umu.se/egna/xdl/index.html
Winter Forecast for GPC Tokyo. Shotaro TANAKA Tokyo Climate Center (TCC) Japan Meteorological Agency (JMA)
 Japan Meteorological Agency (JMA)") Winter Forecast for 2013 2014 GPC Tokyo Shotaro TANAKA Tokyo Climate Center (TCC) Japan Meteorological Agency (JMA) NEACOF 5, October 29 November 1, 2013 1 Outline 1. Numerical prediction 2. Interannual
Winter Forecast for 2013 2014 GPC Tokyo Shotaro TANAKA Tokyo Climate Center (TCC) Japan Meteorological Agency (JMA) NEACOF 5, October 29 November 1, 2013 1 Outline 1. Numerical prediction 2. Interannual
Spatial Statistics 2013, S2.2 6 th June Institute for Geoinformatics University of Münster.
 Spatial Statistics 2013, S2.2 6 th June 2013 Institute for Geoinformatics University of Münster http://ifgi.uni-muenster.de/graeler Vine Vine 1 Spatial/spatio-temporal data Typically, spatial/spatio-temporal
Atmospheric QBO and ENSO indices with high vertical resolution from GNSS RO
 Atmospheric QBO and ENSO indices with high vertical resolution from GNSS RO H. Wilhelmsen, F. Ladstädter, B. Scherllin-Pirscher, A.K.Steiner Wegener Center for Climate and Global Change University of Graz,
Weathernews Looks Back at 2015: A Year of Storms. Powerful Typhoons Occurred with Changing Patterns in El Niño Years
 NEWS RELEASE January 27th, 2016 Weathernews Looks Back at 2015: A Year of Storms Powerful Typhoons Occurred with Changing Patterns in El Niño Years Weathernews Inc. (Chiba, Japan; Chihito Kusabiraki/CEO)
Gridding of precipitation and air temperature observations in Belgium. Michel Journée Royal Meteorological Institute of Belgium (RMI)
") Gridding of precipitation and air temperature observations in Belgium Michel Journée Royal Meteorological Institute of Belgium (RMI) Gridding of meteorological data A variety of hydrologic, ecological,
Gridding of precipitation and air temperature observations in Belgium Michel Journée Royal Meteorological Institute of Belgium (RMI) Gridding of meteorological data A variety of hydrologic, ecological,
Genesis Parameters, Genesis Thresholds, and Mid-Level Humidity
 Genesis Parameters, Genesis Thresholds, and Mid-Level Humidity Michael G. McGauley and David S. Nolan Rosenstiel School of Marine and Atmospheric Science University of Miami Miami, Florida, USA This work
particular regional weather extremes
 SUPPLEMENTARY INFORMATION DOI: 1.138/NCLIMATE2271 Amplified mid-latitude planetary waves favour particular regional weather extremes particular regional weather extremes James A Screen and Ian Simmonds
Roger S. Bivand Edzer J. Pebesma Virgilio Gömez-Rubio. Applied Spatial Data Analysis with R. 4:1 Springer
 Roger S. Bivand Edzer J. Pebesma Virgilio Gömez-Rubio Applied Spatial Data Analysis with R 4:1 Springer Contents Preface VII 1 Hello World: Introducing Spatial Data 1 1.1 Applied Spatial Data Analysis
SIO 211B, Rudnick, adapted from Davis 1
 SIO 211B, Rudnick, adapted from Davis 1 XVII.Empirical orthogonal functions Often in oceanography we collect large data sets that are time series at a group of locations. Moored current meter arrays do
Parameter Estimation in the Spatio-Temporal Mixed Effects Model Analysis of Massive Spatio-Temporal Data Sets
 Parameter Estimation in the Spatio-Temporal Mixed Effects Model Analysis of Massive Spatio-Temporal Data Sets Matthias Katzfuß Advisor: Dr. Noel Cressie Department of Statistics The Ohio State University
The increasing intensity of the strongest tropical cyclones
 The increasing intensity of the strongest tropical cyclones James B. Elsner Department of Geography, Florida State University Tallahassee, Florida Corresponding author address: Dept. of Geography, The
Package ProbForecastGOP
 Type Package Package ProbForecastGOP February 19, 2015 Title Probabilistic weather forecast using the GOP method Version 1.3.2 Date 2010-05-31 Author Veronica J. Berrocal , Yulia
Kriging by Example: Regression of oceanographic data. Paris Perdikaris. Brown University, Division of Applied Mathematics
 Kriging by Example: Regression of oceanographic data Paris Perdikaris Brown University, Division of Applied Mathematics! January, 0 Sea Grant College Program Massachusetts Institute of Technology Cambridge,
Modelling Dependence in Space and Time with Vine Copulas
 Modelling Dependence in Space and Time with Vine Copulas Benedikt Gräler, Edzer Pebesma Abstract We utilize the concept of Vine Copulas to build multi-dimensional copulas out of bivariate ones, as bivariate
Empirical Orthogonal Function (EOF) (Lorenz, 1956) Hotelling, H., 1935: The most predictable criterion. J. Ed. Phych., 26,
 (Lorenz, 1956) Hotelling, H., 1935: The most predictable criterion. J. Ed. Phych., 26,") Principal Component Analysis (PCA) or Empirical Orthogonal Function (EOF) (Lorenz, 1956) Hotelling, H., 1935: The most predictable criterion. J. Ed. Phych., 26, 139-142. (from Jackson, 1991 and Graham,1996
Principal Component Analysis (PCA) or Empirical Orthogonal Function (EOF) (Lorenz, 1956) Hotelling, H., 1935: The most predictable criterion. J. Ed. Phych., 26, 139-142. (from Jackson, 1991 and Graham,1996
High-Resolution MPAS Simulations for Analysis of Climate Change Effects on Weather Extremes
 High-Resolution MPAS Simulations for Analysis of Climate Change Effects on Weather Extremes ALLISON MICHAELIS, GARY LACKMANN, & WALT ROBINSON Department of Marine, Earth, and Atmospheric Sciences, North
Gabriel Kuhn, Shiraj Khan, Auroop R Ganguly* Oak Ridge National Laboratory, Oak Ridge, TN
 13 December, 2006 New approaches for extreme value analysis in large-scale geospatialtemporal data with applications to observed and climate-model simulated precipitation in South America Gabriel Kuhn,
SEA ICE PREDICTION NETWORK (SIPN) Pan-Arctic Sea Ice Outlook Core Contributions June 2015 Report
 Pan-Arctic Sea Ice Outlook Core Contributions June 2015 Report") SEA ICE PREDICTION NETWORK (SIPN) Pan-Arctic Sea Ice Outlook Core Contributions June 2015 Report *REQUIRED 1. *Contributor Name(s)/Group how you would like your contribution to be labeled in the report
SEA ICE PREDICTION NETWORK (SIPN) Pan-Arctic Sea Ice Outlook Core Contributions June 2015 Report *REQUIRED 1. *Contributor Name(s)/Group how you would like your contribution to be labeled in the report
An Introduction to Spatial Statistics. Chunfeng Huang Department of Statistics, Indiana University
 An Introduction to Spatial Statistics Chunfeng Huang Department of Statistics, Indiana University Microwave Sounding Unit (MSU) Anomalies (Monthly): 1979-2006. Iron Ore (Cressie, 1986) Raw percent data
Interannual variation of MODIS NDVI in Lake Taihu and its relation to climate in submerged macrophyte region
 Yale-NUIST Center on Atmospheric Environment Interannual variation of MODIS NDVI in Lake Taihu and its relation to climate in submerged macrophyte region ZhangZhen 2015.07.10 1 Outline Introduction Data
Structure in Data. A major objective in data analysis is to identify interesting features or structure in the data.
 Structure in Data A major objective in data analysis is to identify interesting features or structure in the data. The graphical methods are very useful in discovering structure. There are basically two
Clustering Techniques and their applications at ECMWF
 Clustering Techniques and their applications at ECMWF Laura Ferranti European Centre for Medium-Range Weather Forecasts Training Course NWP-PR: Clustering techniques and their applications at ECMWF 1/32
Paper Review: NONSTATIONARY COVARIANCE MODELS FOR GLOBAL DATA
 Paper Review: NONSTATIONARY COVARIANCE MODELS FOR GLOBAL DATA BY MIKYOUNG JUN AND MICHAEL L. STEIN Presented by Sungkyu Jung April, 2009 Outline 1 Introduction 2 Covariance Models 3 Application: Level
The Improvement of JMA Operational Wave Models
 The Improvement of JMA Operational Wave Models Toshiharu Tauchi Nadao Kohno * Mika Kimura Japan Meteorological Agency * (also) Meteorological Research Institute, JMA 10 th International Workshop on Wave
Empirical climate models of coupled tropical atmosphere-ocean dynamics!
 Empirical climate models of coupled tropical atmosphere-ocean dynamics! Matt Newman CIRES/CDC and NOAA/ESRL/PSD Work done by Prashant Sardeshmukh, Cécile Penland, Mike Alexander, Jamie Scott, and me Outline
A description of these quick prepbufrobs_assim text files is given below.
 The 20 th Century Reanalysis (20CR) Project Ensemble Filter data assimilation system produces ASCII text files containing the surface and sea level pressure observations used in the assimilation, essential
statistical methods for tailoring seasonal climate forecasts Andrew W. Robertson, IRI
 statistical methods for tailoring seasonal climate forecasts Andrew W. Robertson, IRI tailored seasonal forecasts why do we make probabilistic forecasts? to reduce our uncertainty about the (unknown) future
Bayesian Dynamic Modeling for Space-time Data in R
 Bayesian Dynamic Modeling for Space-time Data in R Andrew O. Finley and Sudipto Banerjee September 5, 2014 We make use of several libraries in the following example session, including: ˆ library(fields)
Orbit comparison for Jason-2 mission between GFZ and CNES (POE-D)
") Orbit comparison for Jason-2 mission between GFZ and CNES (POE-D) The GFZ orbit is referred to as GFZ in the following study The CNES orbit is referred to as SL_cci Lionel Zawadzki, Michael Ablain (CLS)
Orbit comparison for Jason-2 mission between GFZ and CNES (POE-D) The GFZ orbit is referred to as GFZ in the following study The CNES orbit is referred to as SL_cci Lionel Zawadzki, Michael Ablain (CLS)
Hedonic Housing Prices in Corsica: A hierarchical spatiotemporal approach WORKSHOP: THEORY AND PRACTICE OF SPDE MODELS AND INLA
 Hedonic Housing Prices in Corsica: A hierarchical spatiotemporal approach WORKSHOP: THEORY AND PRACTICE OF SPDE MODELS AND INLA LING Yuheng 1 30 Oct. 2018 1 PhD student in Economics - University of Corsica
June 1989 T. Nitta and S. Yamada 375. Recent Warming of Tropical Sea Surface Temperature and Its. Relationship to the Northern Hemisphere Circulation
 June 1989 T. Nitta and S. Yamada 375 Recent Warming of Tropical Sea Surface Temperature and Its Relationship to the Northern Hemisphere Circulation By Tsuyoshi Nitta and Shingo Yamada Long-Range Forecast
EMPIRICAL ORTHOGONAL FUNCTION (EOF) ANALYSIS OF PRECIPITATION OVER GHANA
 ANALYSIS OF PRECIPITATION OVER GHANA") International Journal of Statistics: Advances in Theory and Applications Vol. 1, Issue 2, 2017, Pages 121-141 Published Online on September 14, 2017 2017 Jyoti Academic Press http://jyotiacademicpress.org
International Journal of Statistics: Advances in Theory and Applications Vol. 1, Issue 2, 2017, Pages 121-141 Published Online on September 14, 2017 2017 Jyoti Academic Press http://jyotiacademicpress.org
Uncertainty Estimates of the EOF-Derived North Atlantic Oscillation
 1290 J O U R N A L O F C L I M A T E VOLUME 27 Uncertainty Estimates of the EOF-Derived North Atlantic Oscillation YI-HUI WANG AND GUDRUN MAGNUSDOTTIR Department of Earth System Science, University of
On the impact of the assimilation of ASAR wave spectra in the wave model MFWAM
 On the impact of the assimilation of ASAR wave spectra in the wave model MFWAM Lotfi Aouf, Jean-Michel Lefèvre Météo-France, Toulouse SEASAR 2012, 4 th International workshop on Advances in SAR oceanography,
Spatio-temporal modelling of daily air temperature in Catalonia
 Spatio-temporal modelling of daily air temperature in Catalonia M. Saez 1,, M.A. Barceló 1,, A. Tobias 3, D. Varga 1,4 and R. Ocaña-Riola 5 1 Research Group on Statistics, Applied Economics and Health
Principal Component Analysis-I Geog 210C Introduction to Spatial Data Analysis. Chris Funk. Lecture 17
 Principal Component Analysis-I Geog 210C Introduction to Spatial Data Analysis Chris Funk Lecture 17 Outline Filters and Rotations Generating co-varying random fields Translating co-varying fields into
SIO 210: Data analysis
 SIO 210: Data analysis 1. Sampling and error 2. Basic statistical concepts 3. Time series analysis 4. Mapping 5. Filtering 6. Space-time data 7. Water mass analysis 10/8/18 Reading: DPO Chapter 6 Look
SIO 210: Data analysis methods L. Talley, Fall Sampling and error 2. Basic statistical concepts 3. Time series analysis
 SIO 210: Data analysis methods L. Talley, Fall 2016 1. Sampling and error 2. Basic statistical concepts 3. Time series analysis 4. Mapping 5. Filtering 6. Space-time data 7. Water mass analysis Reading:
Analysis of Rainfall and Other Weather Parameters under Climatic Variability of Parbhani ( )
") International Journal of Current Microbiology and Applied Sciences ISSN: 2319-7706 Volume 7 Number 06 (2018) Journal homepage: http://www.ijcmas.com Original Research Article https://doi.org/10.20546/ijcmas.2018.706.295
International Journal of Current Microbiology and Applied Sciences ISSN: 2319-7706 Volume 7 Number 06 (2018) Journal homepage: http://www.ijcmas.com Original Research Article https://doi.org/10.20546/ijcmas.2018.706.295
Vine Copulas. Spatial Copula Workshop 2014 September 22, Institute for Geoinformatics University of Münster.
 Spatial Workshop 2014 September 22, 2014 Institute for Geoinformatics University of Münster http://ifgi.uni-muenster.de/graeler 1 spatio-temporal data Typically, spatio-temporal data is given at a set
Finding Climate Indices and Dipoles Using Data Mining
 Finding Climate Indices and Dipoles Using Data Mining Michael Steinbach, Computer Science Contributors: Jaya Kawale, Stefan Liess, Arjun Kumar, Karsten Steinhauser, Dominic Ormsby, Vipin Kumar Climate
Bayesian dynamic modeling for large space-time weather datasets using Gaussian predictive processes
 Bayesian dynamic modeling for large space-time weather datasets using Gaussian predictive processes Andrew O. Finley 1 and Sudipto Banerjee 2 1 Department of Forestry & Department of Geography, Michigan
A Framework for Daily Spatio-Temporal Stochastic Weather Simulation
 A Framework for Daily Spatio-Temporal Stochastic Weather Simulation, Rick Katz, Balaji Rajagopalan Geophysical Statistics Project Institute for Mathematics Applied to Geosciences National Center for Atmospheric
The forecast skill horizon
 The forecast skill horizon Roberto Buizza, Martin Leutbecher, Franco Molteni, Alan Thorpe and Frederic Vitart European Centre for Medium-Range Weather Forecasts WWOSC 2014 (Montreal, Aug 2014) Roberto
The ECMWF coupled data assimilation system
 The ECMWF coupled data assimilation system Patrick Laloyaux Acknowledgments: Magdalena Balmaseda, Kristian Mogensen, Peter Janssen, Dick Dee August 21, 214 Patrick Laloyaux (ECMWF) CERA August 21, 214
HYSPLIT RESULTS: HYSPLIT:-
 HYSPLIT RESULTS: HYSPLIT:- Lagrangian particle models compute trajectories of a large number of so-called particles to describe the transport and diffusion of tracers in the atmosphere. The main advantage
Global Ocean Monitoring: Recent Evolution, Current Status, and Predictions
 Global Ocean Monitoring: Recent Evolution, Current Status, and Predictions Prepared by Climate Prediction Center, NCEP November 6, 2009 http://www.cpc.ncep.noaa.gov/products/godas/ This project to deliver
My research interests
 My research interests Peter F. Craigmile http://www.stat.osu.edu/~pfc/ Stat 8010 Department of Statistics The Ohio State University 22 January 2016 1 Being a graduate student Notes on the PhD Degree by
Findings from a Search for R Spatial Analysis Support. Donald L. Schrupp Wildlife Ecologist Colorado Division of Wildlife (Retired)
") Findings from a Search for R Spatial Analysis Support Donald L. Schrupp Wildlife Ecologist Colorado Division of Wildlife (Retired) Findings from a Search for R Spatial Analysis Support === Approach Steps
Findings from a Search for R Spatial Analysis Support Donald L. Schrupp Wildlife Ecologist Colorado Division of Wildlife (Retired) Findings from a Search for R Spatial Analysis Support === Approach Steps
Statistical Forecast of the 2001 Western Wildfire Season Using Principal Components Regression. Experimental Long-Lead Forecast Bulletin
 Statistical Forecast of the 2001 Western Wildfire Season Using Principal Components Regression contributed by Anthony L. Westerling 1, Daniel R. Cayan 1,2, Alexander Gershunov 1, Michael D. Dettinger 2
Changes of storm surge and typhoon intensities under the future global warming conditions Storm Surge Congress 2010
 Changes of storm surge and typhoon intensities under the future global warming conditions Storm Surge Congress 2010 Il-Ju Moon & S. M. Oh Jeju (Cheju) National University, Korea Tropical Cyclone (TC) and
Baroclinic anomalies associated with the Southern Hemisphere Annular Mode: Roles of synoptic and low-frequency eddies
 GEOPHYSICAL RESEARCH LETTERS, VOL. 4, 361 366, doi:1.1/grl.5396, 13 Baroclinic anomalies associated with the Southern Hemisphere Annular Mode: Roles of synoptic and low-frequency eddies Yu Nie, 1 Yang
Creating surface temperature datasets to meet 21st Century challenges
 1 2 3 4 5 6 7 8 9 10 11 12 13 14 15 16 17 18 19 20 21 22 23 24 25 26 27 28 Creating surface temperature datasets to meet 21st Century challenges Met Office Hadley Centre, Exeter, UK 7th-9th September 2010
Bayesian hierarchical modelling for data assimilation of past observations and numerical model forecasts
 Bayesian hierarchical modelling for data assimilation of past observations and numerical model forecasts Stan Yip Exeter Climate Systems, University of Exeter c.y.yip@ex.ac.uk Joint work with Sujit Sahu
PRODUCING PROBABILITY MAPS TO ASSESS RISK OF EXCEEDING CRITICAL THRESHOLD VALUE OF SOIL EC USING GEOSTATISTICAL APPROACH
 PRODUCING PROBABILITY MAPS TO ASSESS RISK OF EXCEEDING CRITICAL THRESHOLD VALUE OF SOIL EC USING GEOSTATISTICAL APPROACH SURESH TRIPATHI Geostatistical Society of India Assumptions and Geostatistical Variogram
Interpolation of daily mean air temperature data via spatial and non-spatial copulas
 Interpolation of daily mean air temperature data via spatial and non-spatial copulas F. Alidoost, A. Stein f.alidoost@utwente.nl 6 July 2017 Research problem 2 Assessing near-real time crop and irrigation
2015/16 Winter Monsoon in East Asia
 8 Apr 2016, FOCRAII-12, Guangzhou, China 2015/16 Winter Monsoon in East Asia Hirotaka SATO Tokyo Climate Center Japan Meteorological Agency 1 Outline 1. Overview of 2015/16 winter monsoon in East Asia
A geostatistical method for the analysis and prediction of air quality time series: application to the Aburrá Valley region
 A geostatistical method for the analysis and prediction of air quality time series: application to the Aburrá Valley region Master s Thesis for the Study Program Environmental Planning and Engineering
Experiments of clustering for central European area specially in extreme weather situations. István Ihász. Hungarian Meteorological Service
 Experiments of clustering for central European area specially in extreme weather situations István Ihász Hungarian Meteorological Service 1 1. ECMWF clustering 2. Clustering for central European area Forecasters
Met Éireann Climatological Note No. 15 Long-term rainfall averages for Ireland,
 Met Éireann Climatological Note No. 15 Long-term rainfall averages for Ireland, 1981-2010 Séamus Walsh Glasnevin Hill, Dublin 9 2016 Disclaimer Although every effort has been made to ensure the accuracy
Fig.3.1 Dispersion of an isolated source at 45N using propagating zonal harmonics. The wave speeds are derived from a multiyear 500 mb height daily
 Fig.3.1 Dispersion of an isolated source at 45N using propagating zonal harmonics. The wave speeds are derived from a multiyear 500 mb height daily data set in January. The four panels show the result
Verification of the Seasonal Forecast for the 2005/06 Winter
 Verification of the Seasonal Forecast for the 2005/06 Winter Shingo Yamada Tokyo Climate Center Japan Meteorological Agency 2006/11/02 7 th Joint Meeting on EAWM Contents 1. Verification of the Seasonal
Classic Time Series Analysis
 Classic Time Series Analysis Concepts and Definitions Let Y be a random number with PDF f Y t ~f,t Define t =E[Y t ] m(t) is known as the trend Define the autocovariance t, s =COV [Y t,y s ] =E[ Y t t
The ProbForecastGOP Package
 The ProbForecastGOP Package April 24, 2006 Title Probabilistic Weather Field Forecast using the GOP method Version 1.3 Author Yulia Gel, Adrian E. Raftery, Tilmann Gneiting, Veronica J. Berrocal Description
Accuracy of near real time updates in wind power forecasting with regard to different weather regimes
 Accuracy of near real time updates in wind power forecasting with regard to different weather regimes Nadja Saleck 1, Florian Bertsch 2, Lüder von Bremen 1, Detlev Heinemann 1 1 ForWind, University of
Long Term Renewables Forecast Hauser Plads 10, 4 DK-1127 Copenhagen K Denmark
 Area: Germany Client: xxx Issued: 08:00 UTC 26.08.2016 Next update: 02.09.2016 Overview During 27-29 Aug a low pressure is passing south of UK towards southern Scandinavia and the connected fronts are
ENSO Outlook by JMA. Hiroyuki Sugimoto. El Niño Monitoring and Prediction Group Climate Prediction Division Japan Meteorological Agency
 ENSO Outlook by JMA Hiroyuki Sugimoto El Niño Monitoring and Prediction Group Climate Prediction Division Outline 1. ENSO impacts on the climate 2. Current Conditions 3. Prediction by JMA/MRI-CGCM 4. Summary
From El Nino to Atlantic Nino: pathways as seen in the QuikScat winds
 From El Nino to Atlantic Nino: pathways as seen in the QuikScat winds Rong Fu 1, Lei Huang 1, Hui Wang 2 Presented by Nicole Smith-Downey 1 1 Jackson School of Geosciences, The University of Texas at Austin
István Ihász, Hungarian Meteorological Service, Budapest, Hungary
 Experiences using VarEPS products at the Hungarian Meteorological Service István Ihász, Hungarian Meteorological Service, Budapest, Hungary 1 Introduction ECMWF 15 day Variable Resolution Ensemble Prediction
Exploring spectral wave climate variability using a weather type approach
 13 TH INTERNATIONAL WORKSHOP ON WAVE HINDCASTING Exploring spectral wave climate variability using a weather type approach Antonio Espejo, Fernando J. Méndez, Iñigo J. Losada, Paula Camus Environmental
Spatial Interpolation of Mean Yearly Precipitation using Universal Kriging
 Developments in Statistics Andrej Mrvar and Anuška Ferligoj (Editors) Metodološki zvezki, 17, Ljubljana: FDV, 22 Spatial Interpolation of Mean Yearly Precipitation using Universal Kriging Damijana Kastelec