WITHIN-PARTICIPANT EXPERIMENTAL DESIGNS
|
|
|
- Michael Johnston
- 5 years ago
- Views:
Transcription
1 1 WITHIN-PARTICIPANT EXPERIMENTAL DESIGNS I. Single-factor designs: the model is: yij i j ij ij where: yij score for person j under treatment level i (i = 1,..., I; j = 1,..., n) overall mean βi treatment effect for treatment i (where βi = i ) j subject effect for subject j (where j = j ) βij interaction of treatment and subject ij random error we will only deal with the case where factor B is fixed and the subjects factor is random; we assume that βi is constant, βi = 0, j is independent N(0, 2 ), ij is independent N(0, 2 ), βij is N(0, [(I1)/I]β 2 ) with iβij = 0, and the j, βij, and ij are independent of each other; in addition to the previous assumptions, it is also assumed that the variance/covariance matrix of the observations is circular (which implies that the variances of all pairwise difference scores are equal in the population); (a) ANOVA table: SS df MS 2 2 Factor B ( y y ) n ( y y ) (I1) SSB/df i j i i i 2 2 Subjects (S) ( y y ) I ( y y ) (n1) SSS/df i j j j j 2 Interaction (B*S) ( y y y y ) (I1)(n1) SS(B*S)/df i j ij i j Total ( y y ) 2 y 2 ni y 2 I n 1 i j ij i j ij
2 2 the expected mean squares are: 2 2 E[MSB] E[MSS] n i E[MS(B *S)] 2 2 to test H0: βi = 0 vs. H1: βi 0 use the fact that under H0 MSB ~ F MS(BS) 1, 1 n1 (b) Comparisons among treatment means: to conduct comparisons among the treatment means, use any of the tests described for one-way between-participants designs, except that MS(BS) is substituted for MSE; to construct a 100(1-α)% confidence interval for some contrast ˆ use the following formula: / 2 1 MS( B S) ( c ) 1)( n 1) n 2 ˆ t ( I i if the homogeneity of variance assumption is in doubt, the error term may be computed from only those observations which are used in the comparison of interest (in the case of pairwise comparisons, this corresponds to the use of paired t-tests); (c) Trend analysis: again, the discussion of one-way between-participants designs is applicable, except that MS(BS) is used instead of MSE;
3 3 (d) Effect size measures: (i) standardized mean difference effect size : same as in the single-factor between-participants case; (ii) proportion of total variance effect sizes: 2 ˆ SSB SS total ( I 1)( MSB MS( B* S)) ˆ2 SS total ( I 1)( MSB MS( B* S)) ˆ 2 SS MSS total (e) ANOVA assumptions: in order for the statistical tests to be valid, it is critical that the variance/covariance matrix of the observations be circular (which implies that the variance of the difference between any two scores is a constant); tests for this assumption are available; alternatively, one may use (i) a conservative adjustment to the F-test (i.e., the significance of the F-ratio is evaluated based on F1, (n-1) instead of F(I-1), (I-1)(n-1)), or (ii) the Greenhouse-Geisser and Huynh-Feldt adjusted degrees of freedom tests based on estimates of the sphericity parameter; Note: repeated-measures data can also be analyzed using multivariate analysis of variance (MANOVA); because it requires less restrictive assumptions, MANOVA is often regarded as the preferred method of analysis (see Iacobucci 1994 for an overview);
4 4 II. Multi-factor designs: distinguish the following two cases: (i) pure within-participant designs: all factors included in the design are within-participant factors; (ii) mixed between-/within-participants designs: both between- and withinparticipants factors are included in the design; here we will only deal with the mixed two-factor design, with factor A being the (fixed) between-participants factor and factor B being the (fixed) within-participant (or repeatedmeasures) factor; the model is: y ijk i k j ij jk ijk where: yijk score of person k for level i of factor A and level j of factor B (i = 1,..., I; j = 1,..., J, k = 1,..., n) overall mean i effect of factor A k effect for subject k j effect of factor B ij interaction effect of factors A and B jk interaction effect of factor B and the subjects factor ijk random error in addition to the usual assumptions, it is assumed that the J x J variance/covariance matrices are homogeneous over all levels of factors A and that the pooled covariance matrix is circular;
5 5 (a) ANOVA table: SS df MS 2 2 Factor A ( y y ) nj ( y y ) (I1) SSA/df i j k i i i S(A) ( y y ) 2 J ( y y ) 2 I (n1) SS[S(A)]/df i j k ik i ik i i k 2 2 Factor B ( y y ) ni ( y y ) (J1) SSB/df i j k j j j 2 A*B n ( y y y y ) (IJ) SS[A*B]/df i j ij i j 2 B*S(A) ( y y y y ) I (J(n ) SS[B*S(A)]/df i j k ijk ij ik i Total ( y y ) y ni J y i j k ijk ijk i j k I J n 1 SST the expected mean squares are: 2 E[MSA] J 2 n J i 1 E[MSS(A)] J j E[MSB] n J E[MS(A *B)] n E[MS(B*S(A))] ij 1 J 1
6 6 to test H0: i = 0 use the fact that under H0 MSA MSS(A) ~ F, ) 1 n 1 to test H0: j = 0 and H0: ij = 0 use the fact that under H0 MSB MS[B*S(A)] ~, F J J n MS AB MS[B*S(A)] ~ F J, J n (b) Comparisons among treatment means and trend analysis: the analysis is similar to the two-factor between-participants design, except that the error terms have to be chosen appropriately; in general, the appropriate error term is the one used in the overall ANOVA for the particular factor under consideration (see, for example, Winer et al. 1991, pp. 526 ff. for details): y y y y y i y y y y y i' j j' ij ij ij i' j ij' i' j' MSS A MS BS A MS MS B S A MS pooled pooled SSS A SS BSA I(n 1) I(J 1)(n 1) to construct confidence intervals for contrasts, use the following formula involving the relevant contrast weights (cij) and the number of respondents whose data were averaged (nij), the appropriate error term (MS) as shown above, and the corresponding degrees of freedom (df): 2 / 2 cij ˆ t MS( )( ) df n ij if the homogeneity of variance assumption is in doubt, the error term may be computed from only those observations which are used in the comparison of interest;
7 7 (c) Effect size measures: (i) standardized mean difference effect size : same as before; (ii) proportion of total variance effect sizes (where N is the total number of respondents participating in the experiment): ˆ 2 A SSA SS total ˆ 2 B SSB SS total ˆ 2 A*B SS(A*B) SS total ˆ 2 A SS total ( I 1)( MSA MSS( A)) MSS( A) N MS( B* S( A)) ( J 1)( MSB MS( B* S( A)) ˆ 2 B SS MSS( A) N MS( B* S( A)) total ˆ 2 A* B ( I 1)( J 1)( MS( A* B) MS( B* S( A)) SS MSS( A) N MS( B* S( A)) total (d) Assumptions: in addition to the usual assumptions, two further assumptions have to be met for the tests of the within-participant effects to be valid: the variance/covariance matrices have to be homogeneous over all levels of factor A, and the pooled covariance matrix has to be circular; tests for these assumptions are available; alternatively, either (i) a conservative adjustment to the F-test can be employed: for H0: j = 0 the critical value for F is F1, I(n1) for H0: ij = 0 the critical value is F(I1), I(n1) or (ii) the Greenhouse-Geisser and Huynh-Feldt adjusted-df tests can be used;
8 8 Note: repeated-measures data can also be analyzed using multivariate analysis of variance (MANOVA); because it requires less restrictive assumptions, MANOVA is often regarded as the preferred method of analysis (see Iacobucci 1994 for an overview); Note: the most flexible approach to analyzing repeated-measures data is based on mixed models; mixed models can be estimated with PROC MIXED within SAS; although within-participant designs have several advantages (esp. gains in power), they have to be used with care because of the possibility of context effects (cf. Greenwald 1976): practice sensitization carry-over
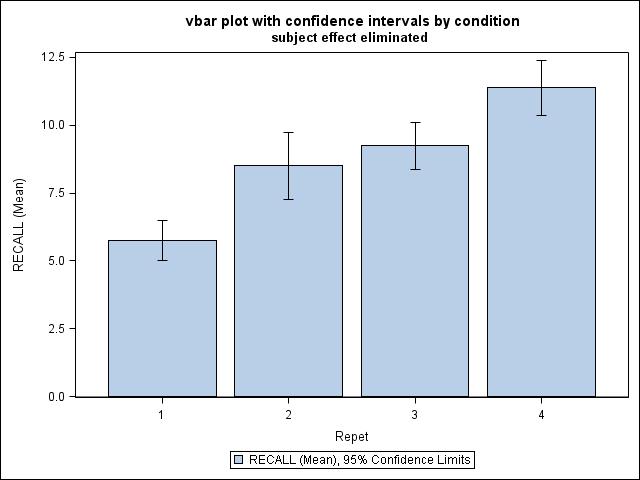
9 9 Single-factor design: DATA ANOVAW; INPUT SUBJ Interference RECALL1-RECALL4; CARDS; ; proc ttest data=anovaw ci=none; paired RECALL1*RECALL2 RECALL1*RECALL3 RECALL1*RECALL4 RECALL2*RECALL3 RECALL2*RECALL4 RECALL3*RECALL4; run; [pp ] PROC GLM data=anovaw; MODEL RECALL1-RECALL4 = / NOUNI; REPEATED Repet 4 contrast (1) / MSTAT=EXACT SUMMARY PRINTE; run; [pp ] DATA ANOVAL; INPUT SUBJ DO Repet=1 TO 4; INPUT OUTPUT; END; CARDS; ;
10 10 PROC GLM data=anoval; CLASS Repet SUBJ; MODEL RECALL = Repet SUBJ Repet*SUBJ; TEST H=Repet E=Repet*SUBJ; LSMEANS Repet / T PDIFF TDIFF CL E=Repet*SUBJ; run; [pp ] PROC STANDARD M=0 DATA=ANOVAL OUT=ANOVALMC; VAR RECALL; BY SUBJ; DATA ANOVALMC; SET ANOVALMC; RECALL=RECALL ; proc sgplot data=anovalmc; title "vbar plot with confidence intervals by condition"; title2 "subject effect eliminated "; vbar Repet / response=recall stat=mean limitstat=clm; run; [p. 17] proc mixed data=anoval method=reml; class repet subj; model recall = repet / s ; repeated / subject=subj type=cs r; run; [p. 18] quit;
11 11 The TTEST Procedure Difference: RECALL1 - RECALL2 N Mean Std Dev Std Err Minimum Maximum Mean 95% CL Mean DF t Value Pr > t Difference: RECALL1 - RECALL3 N Mean Std Dev Std Err Minimum Maximum Mean 95% CL Mean DF t Value Pr > t Difference: RECALL1 - RECALL4 N Mean Std Dev Std Err Minimum Maximum Mean 95% CL Mean DF t Value Pr > t <.0001
12 12 Difference: RECALL2 - RECALL3 N Mean Std Dev Std Err Minimum Maximum Mean 95% CL Mean DF t Value Pr > t Difference: RECALL2 - RECALL4 N Mean Std Dev Std Err Minimum Maximum Mean 95% CL Mean DF t Value Pr > t Difference: RECALL3 - RECALL4 N Mean Std Dev Std Err Minimum Maximum Mean 95% CL Mean DF t Value Pr > t
13 13 The GLM Procedure Repeated Measures Analysis of Variance Sphericity Tests Mauchly's Variables DF Criterion Chi-Square Pr > ChiSq Transformed Variates Orthogonal Components MANOVA Tests for the Hypothesis of no Repet Effect H = Type III SSCP Matrix for Repet E = Error SSCP Matrix S=1 M=0.5 N=1.5 Statistic Value P-Value Wilks' Lambda <.0001 Pillai's Trace <.0001 Hotelling-Lawley Trace <.0001 Roy's Greatest Root <.0001 The GLM Procedure Repeated Measures Analysis of Variance Univariate Tests of Hypotheses for Within Subject Effects Repet <.0001 Error(Repet) Adj Pr > F Source G - G H - F Repet <.0001 <.0001 Error(Repet) Greenhouse-Geisser Epsilon Huynh-Feldt Epsilon
14 14 The GLM Procedure Repeated Measures Analysis of Variance Analysis of Variance of Contrast Variables Repet_N represents the contrast between the nth level of Repet and the 1st Contrast Variable: Repet_2 Mean Error Contrast Variable: Repet_3 Mean Error Contrast Variable: Repet_4 Mean <.0001 Error
15 15 The GLM Procedure Dependent Variable: RECALL Sum of Source DF Squares Mean Square F Value Pr > F Model Error Corrected Total R-Square Coeff Var Root MSE RECALL Mean Source DF Type I SS Mean Square F Value Pr > F Repet SUBJ Repet*SUBJ Repet SUBJ Repet*SUBJ Tests of Hypotheses Using the Type III MS for Repet*SUBJ as an Error Term Repet <.0001
16 16 The GLM Procedure Least Squares Means Standard Errors and Probabilities Calculated Using the Type III MS for Repet*SUBJ as an Error Term RECALL LSMEAN Repet LSMEAN Number Least Squares Means for Effect Repet t for H0: LSMean(i)=LSMean(j) / Pr > t Dependent Variable: RECALL i/j <.0001 < < < RECALL Repet LSMEAN 95% Confidence Limits Least Squares Means for Effect Repet Difference Between 95% Confidence Limits for i j Means LSMean(i)-LSMean(j)
17 17
18 18 The Mixed Procedure Covariance Parameter Estimates Cov Parm Subject Estimate CS SUBJ Residual Fit Statistics -2 Res Log Likelihood AIC (smaller is better) AICC (smaller is better) BIC (smaller is better) Null Model Likelihood Ratio Test DF Chi-Square Pr > ChiSq <.0001 Solution for Fixed Effects Standard Effect Repet Estimate Error DF t Value Pr > t Intercept <.0001 Repet <.0001 Repet Repet Repet The Mixed Procedure Type 3 Tests of Fixed Effects Num Den Effect DF DF F Value Pr > F Repet <.0001
19 19 Two-factor design: DATA ANOVAW; INPUT SUBJ Interference RECALL1-RECALL4; CARDS; ; PROC MEANS MEAN VAR; VAR RECALL1-RECALL4; BY Interference; run; [p. 21] PROC GLM data=anovaw; TITLE 'overall analysis'; CLASS Interference; MODEL RECALL1-RECALL4=Interference / NOUNI; REPEATED Repet 4 / MSTAT=EXACT SUMMARY; run; [pp ] PROC GLM data=anovaw; TITLE 'main effect of interference'; CLASS Interference; MODEL RECALL1-RECALL4=Interference / NOUNI; REPEATED Repet 4 / MSTAT=EXACT; CONTRAST 'Low vs. High Interference' Interference -1 1; MANOVA H=INTERFERENCE M=RECALL1+RECALL2+RECALL3+RECALL4 / MSTAT=EXACT SUMMARY; run; [p. 24] PROC GLM data=anovaw; TITLE 'main effect of repetition'; CLASS Interference; MODEL RECALL1-RECALL4=Interference / NOUNI; MANOVA H=INTERCEPT M=RECALL2-RECALL1, RECALL3-RECALL1, RECALL4-RECALL1 / MSTAT=EXACT SUMMARY; /* or REPEATED Repet 4 CONTRAST (1) / MSTAT=EXACT SUMMARY; */ run; [p. 25] PROC GLM data=anovaw; TITLE 'interference by specific repetition contrasts'; CLASS Interference; MODEL RECALL1-RECALL4=Interference / NOUNI; MANOVA H=INTERFERENCE M=RECALL2-RECALL1, RECALL3-RECALL1, RECALL4-RECALL1 / MSTAT=EXACT SUMMARY; run; [p. 26] PROC GLM data=anovaw; TITLE 'repetition by specific interference contrasts'; CLASS Interference; MODEL RECALL1-RECALL4=Interference / NOUNI; CONTRAST 'low vs. high interference' INTERFERENCE -1 1; REPEATED Repet 4; run; [p. 27]
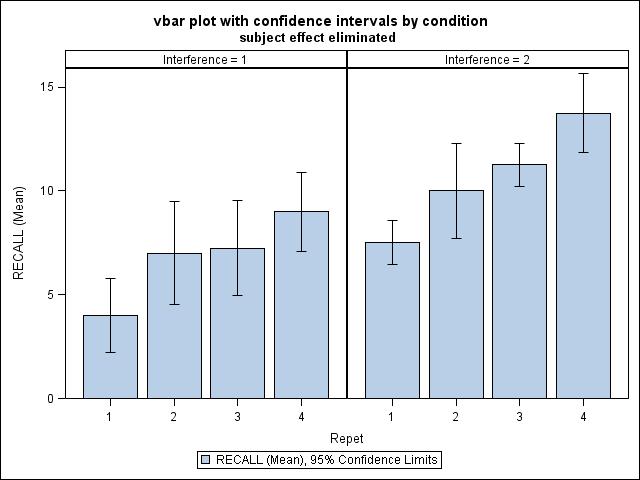
20 20 PROC GLM data=anovaw; TITLE 'specific contrasts for both interference and repetition'; CLASS Interference; MODEL RECALL1-RECALL4=Interference / NOUNI; CONTRAST 'low vs. high interference' INTERFERENCE -1 1; MANOVA H=INTERFERENCE M=RECALL2-RECALL1, RECALL3-RECALL1, RECALL4-RECALL1 / MSTAT=EXACT SUMMARY; LSMEANS Interference / pdiff cl; run; [p. 28] DATA ANOVAL; INPUT SUBJ DO Repet=1 TO 4; INPUT OUTPUT; END; CARDS; etc. ; PROC GLM data=anoval; CLASS Interference Repet SUBJ; MODEL RECALL = Interference SUBJ(Interference) Repet Interference*Repet Repet*SUBJ(Interference); TEST H=Interference E=SUBJ(Interference); TEST H=Repet E=Repet*SUBJ(Interference); TEST H=Interference*Repet E=Repet*SUBJ(Interference); LSMEANS Interference / T TDIFF PDIFF CL E=SUBJ(Interference); LSMEANS Repet / T TDIFF PDIFF CL E=Repet*SUBJ(Interference); LSMEANS Interference*Repet / T TDIFF PDIFF CL E=Repet*SUBJ(Interference); run; [pp ] PROC STANDARD M=0 DATA=ANOVAL OUT=ANOVALMC; VAR RECALL; BY SUBJ; DATA ANOVALMC; SET ANOVALMC; IF Interference=1 THEN RECALL=RECALL ; IF Interference=2 THEN RECALL=RECALL ; proc sgpanel data=anovalmc; title "vbar plot with confidence intervals by condition"; title2 "subject effect eliminated "; panelby Interference; vbar Repet / response=recall stat=mean limitstat=clm; run; [p. 34] proc mixed data=anoval method=reml; class Interference Repet subj; model recall = Interference Repet Interference*Repet / s; repeated / subject=subj type=cs r; run; [p. 35] quit;
21 Interference= The MEANS Procedure Variable Mean Variance ƒƒƒƒƒƒƒƒƒƒƒƒƒƒƒƒƒƒƒƒƒƒƒƒƒƒƒƒƒƒƒƒƒƒƒƒƒƒƒƒ RECALL RECALL RECALL RECALL ƒƒƒƒƒƒƒƒƒƒƒƒƒƒƒƒƒƒƒƒƒƒƒƒƒƒƒƒƒƒƒƒƒƒƒƒƒƒƒƒ Interference= Variable Mean Variance ƒƒƒƒƒƒƒƒƒƒƒƒƒƒƒƒƒƒƒƒƒƒƒƒƒƒƒƒƒƒƒƒƒƒƒƒƒƒƒƒ RECALL RECALL RECALL RECALL
22 22 overall analysis The GLM Procedure Repeated Measures Analysis of Variance Repeated Measures Level Information Dependent Variable RECALL1 RECALL2 RECALL3 RECALL4 Level of Repet MANOVA Tests for the Hypothesis of no Repet Effect H = Type III SSCP Matrix for Repet E = Error SSCP Matrix S=1 M=0.5 N=1 Statistic Value P-Value Wilks' Lambda Pillai's Trace Hotelling-Lawley Trace Roy's Greatest Root MANOVA Tests for the Hypothesis of no Repet*Interference Effect H = Type III SSCP Matrix for Repet*Interference E = Error SSCP Matrix S=1 M=0.5 N=1 Statistic Value P-Value Wilks' Lambda Pillai's Trace Hotelling-Lawley Trace Roy's Greatest Root
23 23 overall analysis The GLM Procedure Repeated Measures Analysis of Variance Tests of Hypotheses for Between Subjects Effects Interference Error The GLM Procedure Repeated Measures Analysis of Variance Univariate Tests of Hypotheses for Within Subject Effects Repet <.0001 Repet*Interference Error(Repet) Adj Pr > F Source G - G H-F-L Repet <.0001 Repet*Interference Error(Repet) Greenhouse-Geisser Epsilon Huynh-Feldt-Lecoutre Epsilon
24 24 main effect of interference The GLM Procedure Multivariate Analysis of Variance M Matrix Describing Transformed Variables RECALL1 RECALL2 RECALL3 RECALL4 MVAR MANOVA Tests for the Hypothesis of No Overall Interference Effect on the Variables Defined by the M Matrix Transformation H = Type III SSCP Matrix for Interference E = Error SSCP Matrix S=1 M=-0.5 N=2 Statistic Value P-Value Wilks' Lambda Pillai's Trace Hotelling-Lawley Trace Roy's Greatest Root MANOVA Tests for the Hypothesis of No Overall Low vs. High Interference Effect on the Variables Defined by the M Matrix Transformation H = Contrast SSCP Matrix for Low vs. High Interference E = Error SSCP Matrix S=1 M=-0.5 N=2 Statistic Value P-Value Wilks' Lambda Pillai's Trace Hotelling-Lawley Trace Roy's Greatest Root The GLM Procedure Multivariate Analysis of Variance Dependent Variable: MVAR1 Interference Error Contrast DF Contrast SS Mean Square F Value Pr > F Low vs. High Interference
25 25 Main effect of repetition The GLM Procedure Multivariate Analysis of Variance M Matrix Describing Transformed Variables RECALL1 RECALL2 RECALL3 RECALL4 MVAR MVAR MVAR Dependent Variable: MVAR1 Intercept Error Dependent Variable: MVAR2 Intercept Error Dependent Variable: MVAR3 Intercept <.0001 Error
26 26 interference by specific repetition contrasts M Matrix Describing Transformed Variables RECALL1 RECALL2 RECALL3 RECALL4 MVAR MVAR MVAR Dependent Variable: MVAR1 Interference Error Dependent Variable: MVAR2 Interference Error Dependent Variable: MVAR3 Interference Error
27 27 repetition by specific interference contrasts MANOVA Test Criteria and Exact F Statistics for the Hypothesis of no Repet*low vs. high interference Effect H = Contrast SSCP Matrix for Repet*low vs. high interference E = Error SSCP Matrix S=1 M=0.5 N=1 Statistic Value F Value Num DF Den DF Pr > F Wilks' Lambda Pillai's Trace Hotelling-Lawley Trace Roy's Greatest Root Contrast DF Contrast SS Mean Square F Value Repet*low vs. high interference Adj Pr > F Contrast Pr > F G - G H-F-L Repet*low vs. high interference
28 28 specific contrasts for both interference and repetition M Matrix Describing Transformed Variables RECALL1 RECALL2 RECALL3 RECALL4 MVAR MVAR MVAR MANOVA Tests for the Hypothesis of No Overall low vs. high interference Effect on the Variables Defined by the M Matrix Transformation H = Contrast SSCP Matrix for low vs. high interference E = Error SSCP Matrix S=1 M=0.5 N=1 Statistic Value P-Value Wilks' Lambda Pillai's Trace Hotelling-Lawley Trace Roy's Greatest Root Dependent Variable: MVAR1 Interference Error Contrast DF Contrast SS Mean Square F Value Pr > F low vs. high interference Dependent Variable: MVAR2 Interference Error Contrast DF Contrast SS Mean Square F Value Pr > F low vs. high interference Dependent Variable: MVAR3 Interference Error Contrast DF Contrast SS Mean Square F Value Pr > F low vs. high interference
29 29 The GLM Procedure Dependent Variable: RECALL Sum of Source DF Squares Mean Square F Value Pr > F Model Error Corrected Total R-Square Coeff Var Root MSE RECALL Mean Source DF Type I SS Mean Square F Value Pr > F Interference SUBJ(Interference) Repet Interference*Repet Repet*SUBJ(Interfer) Interference SUBJ(Interference) Repet Interference*Repet Repet*SUBJ(Interfer) Tests of Hypotheses Using the Type III MS for SUBJ(Interference) as an Error Term Interference Tests of Hypotheses Using the Type III MS for Repet*SUBJ(Interfer) as an Error Term Repet <.0001 Interference*Repet
30 30 The GLM Procedure Least Squares Means Standard Errors and Probabilities Calculated Using the Type III MS for SUBJ(Interference) as an Error Term RECALL H0:LSMean1=LSMean2 Interference LSMEAN t Value Pr > t RECALL Interference LSMEAN 95% Confidence Limits Least Squares Means for Effect Interference Difference Between 95% Confidence Limits for i j Means LSMean(i)-LSMean(j)
31 31 The GLM Procedure Least Squares Means Standard Errors and Probabilities Calculated Using the Type III MS for Repet*SUBJ(Interfer) as an Error Term RECALL LSMEAN Repet LSMEAN Number Least Squares Means for Effect Repet t for H0: LSMean(i)=LSMean(j) / Pr > t Dependent Variable: RECALL i/j <.0001 < < < RECALL Repet LSMEAN 95% Confidence Limits Difference Between 95% Confidence Limits for i j Means LSMean(i)-LSMean(j)
32 32 The GLM Procedure Least Squares Means Standard Errors and Probabilities Calculated Using the Type III MS for Repet*SUBJ(Interfer) as an Error Term RECALL LSMEAN Interference Repet LSMEAN Number Least Squares Means for Effect Interference*Repet t for H0: LSMean(i)=LSMean(j) / Pr > t Dependent Variable: RECALL i/j < <.0001 <.0001 < < < < < < < <.0001 <.0001 < < RECALL Interference Repet LSMEAN 95% Confidence Limits
33 33 Difference Between 95% Confidence Limits for i j Means LSMean(i)-LSMean(j)
34 34
35 35 The Mixed Procedure Covariance Parameter Estimates Cov Parm Subject Estimate CS SUBJ Residual Fit Statistics -2 Res Log Likelihood AIC (smaller is better) AICC (smaller is better) BIC (smaller is better) Null Model Likelihood Ratio Test DF Chi-Square Pr > ChiSq <.0001 Type 3 Tests of Fixed Effects Num Den Effect DF DF F Value Pr > F Interference Repet <.0001 Interference*Repet
ANOVA Longitudinal Models for the Practice Effects Data: via GLM
 Psyc 943 Lecture 25 page 1 ANOVA Longitudinal Models for the Practice Effects Data: via GLM Model 1. Saturated Means Model for Session, E-only Variances Model (BP) Variances Model: NO correlation, EQUAL
Repeated Measures Part 2: Cartoon data
 Repeated Measures Part 2: Cartoon data /*********************** cartoonglm.sas ******************/ options linesize=79 noovp formdlim='_'; title 'Cartoon Data: STA442/1008 F 2005'; proc format; /* value
Analysis of Longitudinal Data: Comparison Between PROC GLM and PROC MIXED. Maribeth Johnson Medical College of Georgia Augusta, GA
 Analysis of Longitudinal Data: Comparison Between PROC GLM and PROC MIXED Maribeth Johnson Medical College of Georgia Augusta, GA Overview Introduction to longitudinal data Describe the data for examples
Covariance Structure Approach to Within-Cases
 Covariance Structure Approach to Within-Cases Remember how the data file grapefruit1.data looks: Store sales1 sales2 sales3 1 62.1 61.3 60.8 2 58.2 57.9 55.1 3 51.6 49.2 46.2 4 53.7 51.5 48.3 5 61.4 58.7
Prepared by: Prof. Dr Bahaman Abu Samah Department of Professional Development and Continuing Education Faculty of Educational Studies Universiti
 Prepared by: Prof. Dr Bahaman Abu Samah Department of Professional Development and Continuing Education Faculty of Educational Studies Universiti Putra Malaysia Serdang Use in experiment, quasi-experiment
T. Mark Beasley One-Way Repeated Measures ANOVA handout
 T. Mark Beasley One-Way Repeated Measures ANOVA handout Profile Analysis Example In the One-Way Repeated Measures ANOVA, two factors represent separate sources of variance. Their interaction presents an
UV Absorbance by Fish Slime
 Data Set 1: UV Absorbance by Fish Slime Statistical Setting This handout describes a repeated-measures ANOVA, with two crossed amongsubjects factors and repeated-measures on a third (within-subjects) factor.
Chapter 9. Multivariate and Within-cases Analysis. 9.1 Multivariate Analysis of Variance
 Chapter 9 Multivariate and Within-cases Analysis 9.1 Multivariate Analysis of Variance Multivariate means more than one response variable at once. Why do it? Primarily because if you do parallel analyses
T-test: means of Spock's judge versus all other judges 1 12:10 Wednesday, January 5, judge1 N Mean Std Dev Std Err Minimum Maximum
 T-test: means of Spock's judge versus all other judges 1 The TTEST Procedure Variable: pcwomen judge1 N Mean Std Dev Std Err Minimum Maximum OTHER 37 29.4919 7.4308 1.2216 16.5000 48.9000 SPOCKS 9 14.6222
4.1 Computing section Example: Bivariate measurements on plants Post hoc analysis... 7
 Master of Applied Statistics ST116: Chemometrics and Multivariate Statistical data Analysis Per Bruun Brockhoff Module 4: Computing 4.1 Computing section.................................. 1 4.1.1 Example:
This is a Randomized Block Design (RBD) with a single factor treatment arrangement (2 levels) which are fixed.
 with a single factor treatment arrangement (2 levels) which are fixed.") EXST3201 Chapter 13c Geaghan Fall 2005: Page 1 Linear Models Y ij = µ + βi + τ j + βτij + εijk This is a Randomized Block Design (RBD) with a single factor treatment arrangement (2 levels) which are fixed.
EXST3201 Chapter 13c Geaghan Fall 2005: Page 1 Linear Models Y ij = µ + βi + τ j + βτij + εijk This is a Randomized Block Design (RBD) with a single factor treatment arrangement (2 levels) which are fixed.
MANOVA is an extension of the univariate ANOVA as it involves more than one Dependent Variable (DV). The following are assumptions for using MANOVA:
. The following are assumptions for using MANOVA:") MULTIVARIATE ANALYSIS OF VARIANCE MANOVA is an extension of the univariate ANOVA as it involves more than one Dependent Variable (DV). The following are assumptions for using MANOVA: 1. Cell sizes : o
MULTIVARIATE ANALYSIS OF VARIANCE MANOVA is an extension of the univariate ANOVA as it involves more than one Dependent Variable (DV). The following are assumptions for using MANOVA: 1. Cell sizes : o
Subject-specific observed profiles of log(fev1) vs age First 50 subjects in Six Cities Study
 vs age First 50 subjects in Six Cities Study") Subject-specific observed profiles of log(fev1) vs age First 50 subjects in Six Cities Study 1.4 0.0-6 7 8 9 10 11 12 13 14 15 16 17 18 19 age Model 1: A simple broken stick model with knot at 14 fit with
Subject-specific observed profiles of log(fev1) vs age First 50 subjects in Six Cities Study 1.4 0.0-6 7 8 9 10 11 12 13 14 15 16 17 18 19 age Model 1: A simple broken stick model with knot at 14 fit with
Chapter 7, continued: MANOVA
 Chapter 7, continued: MANOVA The Multivariate Analysis of Variance (MANOVA) technique extends Hotelling T 2 test that compares two mean vectors to the setting in which there are m 2 groups. We wish to
International Journal of Current Research in Biosciences and Plant Biology ISSN: Volume 2 Number 5 (May-2015) pp
 pp") Original Research Article International Journal of Current Research in Biosciences and Plant Biology ISSN: 349-00 Volume Number (May-01) pp. -19 www.ijcrbp.com Graphical Approaches to Support Mixed Model
Original Research Article International Journal of Current Research in Biosciences and Plant Biology ISSN: 349-00 Volume Number (May-01) pp. -19 www.ijcrbp.com Graphical Approaches to Support Mixed Model
Topic 17 - Single Factor Analysis of Variance. Outline. One-way ANOVA. The Data / Notation. One way ANOVA Cell means model Factor effects model
 Topic 17 - Single Factor Analysis of Variance - Fall 2013 One way ANOVA Cell means model Factor effects model Outline Topic 17 2 One-way ANOVA Response variable Y is continuous Explanatory variable is
Repeated-Measures ANOVA in SPSS Correct data formatting for a repeated-measures ANOVA in SPSS involves having a single line of data for each
 Repeated-Measures ANOVA in SPSS Correct data formatting for a repeated-measures ANOVA in SPSS involves having a single line of data for each participant, with the repeated measures entered as separate
Multivariate analysis of variance and covariance
 Introduction Multivariate analysis of variance and covariance Univariate ANOVA: have observations from several groups, numerical dependent variable. Ask whether dependent variable has same mean for each
GLM Repeated Measures
 GLM Repeated Measures Notation The GLM (general linear model) procedure provides analysis of variance when the same measurement or measurements are made several times on each subject or case (repeated
Application of Ghosh, Grizzle and Sen s Nonparametric Methods in. Longitudinal Studies Using SAS PROC GLM
 Application of Ghosh, Grizzle and Sen s Nonparametric Methods in Longitudinal Studies Using SAS PROC GLM Chan Zeng and Gary O. Zerbe Department of Preventive Medicine and Biometrics University of Colorado
Analysis of Repeated Measures Data of Iraqi Awassi Lambs Using Mixed Model
 American Journal of Applied Scientific Research 01; 1(): 1-6 Published online November 1, 01 (http://www.sciencepublishinggroup.com/j/ajasr) doi: 10.64/j.ajasr.00.13 Analysis of Repeated Measures Data
General Linear Model
 GLM V1 V2 V3 V4 V5 V11 V12 V13 V14 V15 /WSFACTOR=placeholders 2 Polynomial target 5 Polynomial /METHOD=SSTYPE(3) /EMMEANS=TABLES(OVERALL) /EMMEANS=TABLES(placeholders) COMPARE ADJ(SIDAK) /EMMEANS=TABLES(target)
Other hypotheses of interest (cont d)
") Other hypotheses of interest (cont d) In addition to the simple null hypothesis of no treatment effects, we might wish to test other hypothesis of the general form (examples follow): H 0 : C k g β g p
Other hypotheses of interest (cont d) In addition to the simple null hypothesis of no treatment effects, we might wish to test other hypothesis of the general form (examples follow): H 0 : C k g β g p
Chapter 5: Multivariate Analysis and Repeated Measures
 Chapter 5: Multivariate Analysis and Repeated Measures Multivariate -- More than one dependent variable at once. Why do it? Primarily because if you do parallel analyses on lots of outcome measures, the
Topic 20: Single Factor Analysis of Variance
 Topic 20: Single Factor Analysis of Variance Outline Single factor Analysis of Variance One set of treatments Cell means model Factor effects model Link to linear regression using indicator explanatory
Topic 12. The Split-plot Design and its Relatives (continued) Repeated Measures
 Repeated Measures") 12.1 Topic 12. The Split-plot Design and its Relatives (continued) Repeated Measures 12.9 Repeated measures analysis Sometimes researchers make multiple measurements on the same experimental unit. We have
12.1 Topic 12. The Split-plot Design and its Relatives (continued) Repeated Measures 12.9 Repeated measures analysis Sometimes researchers make multiple measurements on the same experimental unit. We have
Multivariate Tests. Mauchly's Test of Sphericity
 General Model Within-Sujects Factors Dependent Variale IDLS IDLF IDHS IDHF IDHCLS IDHCLF Descriptive Statistics IDLS IDLF IDHS IDHF IDHCLS IDHCLF Mean Std. Deviation N.0.70.0.0..8..88.8...97 Multivariate
ANCOVA. Psy 420 Andrew Ainsworth
 ANCOVA Psy 420 Andrew Ainsworth What is ANCOVA? Analysis of covariance an extension of ANOVA in which main effects and interactions are assessed on DV scores after the DV has been adjusted for by the DV
Descriptive Statistics
 *following creates z scores for the ydacl statedp traitdp and rads vars. *specifically adding the /SAVE subcommand to descriptives will create z. *scores for whatever variables are in the command. DESCRIPTIVES
General Linear Model. Notes Output Created Comments Input. 19-Dec :09:44
 GET ILE='G:\lare\Data\Accuracy_Mixed.sav'. DATASET NAME DataSet WINDOW=RONT. GLM Jigsaw Decision BY CMCTools /WSACTOR= Polynomial /METHOD=SSTYPE(3) /PLOT=PROILE(CMCTools*) /EMMEANS=TABLES(CMCTools) COMPARE
SAS Syntax and Output for Data Manipulation: CLDP 944 Example 3a page 1
 CLDP 944 Example 3a page 1 From Between-Person to Within-Person Models for Longitudinal Data The models for this example come from Hoffman (2015) chapter 3 example 3a. We will be examining the extent to
STAT 5200 Handout #23. Repeated Measures Example (Ch. 16)
") Motivating Example: Glucose STAT 500 Handout #3 Repeated Measures Example (Ch. 16) An experiment is conducted to evaluate the effects of three diets on the serum glucose levels of human subjects. Twelve
Motivating Example: Glucose STAT 500 Handout #3 Repeated Measures Example (Ch. 16) An experiment is conducted to evaluate the effects of three diets on the serum glucose levels of human subjects. Twelve
1998, Gregory Carey Repeated Measures ANOVA - 1. REPEATED MEASURES ANOVA (incomplete)
") 1998, Gregory Carey Repeated Measures ANOVA - 1 REPEATED MEASURES ANOVA (incomplete) Repeated measures ANOVA (RM) is a specific type of MANOVA. When the within group covariance matrix has a special form,
1998, Gregory Carey Repeated Measures ANOVA - 1 REPEATED MEASURES ANOVA (incomplete) Repeated measures ANOVA (RM) is a specific type of MANOVA. When the within group covariance matrix has a special form,
Answer to exercise: Blood pressure lowering drugs
 Answer to exercise: Blood pressure lowering drugs The data set bloodpressure.txt contains data from a cross-over trial, involving three different formulations of a drug for lowering of blood pressure:
ANOVA in SPSS. Hugo Quené. opleiding Taalwetenschap Universiteit Utrecht Trans 10, 3512 JK Utrecht.
 ANOVA in SPSS Hugo Quené hugo.quene@let.uu.nl opleiding Taalwetenschap Universiteit Utrecht Trans 10, 3512 JK Utrecht 7 Oct 2005 1 introduction In this example I ll use fictitious data, taken from http://www.ruf.rice.edu/~mickey/psyc339/notes/rmanova.html.
UNIVERSITY OF TORONTO. Faculty of Arts and Science APRIL 2010 EXAMINATIONS STA 303 H1S / STA 1002 HS. Duration - 3 hours. Aids Allowed: Calculator
 UNIVERSITY OF TORONTO Faculty of Arts and Science APRIL 2010 EXAMINATIONS STA 303 H1S / STA 1002 HS Duration - 3 hours Aids Allowed: Calculator LAST NAME: FIRST NAME: STUDENT NUMBER: There are 27 pages
Introduction to SAS proc mixed
 Faculty of Health Sciences Introduction to SAS proc mixed Analysis of repeated measurements, 2017 Julie Forman Department of Biostatistics, University of Copenhagen 2 / 28 Preparing data for analysis The
SAS Commands. General Plan. Output. Construct scatterplot / interaction plot. Run full model
 Topic 23 - Unequal Replication Data Model Outline - Fall 2013 Parameter Estimates Inference Topic 23 2 Example Page 954 Data for Two Factor ANOVA Y is the response variable Factor A has levels i = 1, 2,...,
Multivariate Statistical Analysis
 Multivariate Statistical Analysis Fall 2011 C. L. Williams, Ph.D. Lecture 17 for Applied Multivariate Analysis Outline Multivariate Analysis of Variance 1 Multivariate Analysis of Variance The hypotheses:
Introduction to SAS proc mixed
 Faculty of Health Sciences Introduction to SAS proc mixed Analysis of repeated measurements, 2017 Julie Forman Department of Biostatistics, University of Copenhagen Outline Data in wide and long format
unadjusted model for baseline cholesterol 22:31 Monday, April 19,
 unadjusted model for baseline cholesterol 22:31 Monday, April 19, 2004 1 Class Level Information Class Levels Values TRETGRP 3 3 4 5 SEX 2 0 1 Number of observations 916 unadjusted model for baseline cholesterol
ANOVA approaches to Repeated Measures. repeated measures MANOVA (chapter 3)
") ANOVA approaches to Repeated Measures univariate repeated-measures ANOVA (chapter 2) repeated measures MANOVA (chapter 3) Assumptions Interval measurement and normally distributed errors (homogeneous across
ANOVA approaches to Repeated Measures univariate repeated-measures ANOVA (chapter 2) repeated measures MANOVA (chapter 3) Assumptions Interval measurement and normally distributed errors (homogeneous across
Theorem A: Expectations of Sums of Squares Under the two-way ANOVA model, E(X i X) 2 = (µ i µ) 2 + n 1 n σ2
 2 = (µ i µ) 2 + n 1 n σ2") identity Y ijk Ȳ = (Y ijk Ȳij ) + (Ȳi Ȳ ) + (Ȳ j Ȳ ) + (Ȳij Ȳi Ȳ j + Ȳ ) Theorem A: Expectations of Sums of Squares Under the two-way ANOVA model, (1) E(MSE) = E(SSE/[IJ(K 1)]) = (2) E(MSA) = E(SSA/(I
identity Y ijk Ȳ = (Y ijk Ȳij ) + (Ȳi Ȳ ) + (Ȳ j Ȳ ) + (Ȳij Ȳi Ȳ j + Ȳ ) Theorem A: Expectations of Sums of Squares Under the two-way ANOVA model, (1) E(MSE) = E(SSE/[IJ(K 1)]) = (2) E(MSA) = E(SSA/(I
Repeated Measures Analysis of Variance
 Repeated Measures Analysis of Variance Review Univariate Analysis of Variance Group A Group B Group C Repeated Measures Analysis of Variance Condition A Condition B Condition C Repeated Measures Analysis
Odor attraction CRD Page 1
 Odor attraction CRD Page 1 dm'log;clear;output;clear'; options ps=512 ls=99 nocenter nodate nonumber nolabel FORMCHAR=" ---- + ---+= -/\*"; ODS LISTING; *** Table 23.2 ********************************************;
BIOL 458 BIOMETRY Lab 8 - Nested and Repeated Measures ANOVA
 BIOL 458 BIOMETRY Lab 8 - Nested and Repeated Measures ANOVA PART 1: NESTED ANOVA Nested designs are used when levels of one factor are not represented within all levels of another factor. Often this is
1 DV is normally distributed in the population for each level of the within-subjects factor 2 The population variances of the difference scores
 One-way Prepared by: Prof. Dr Bahaman Abu Samah Department of Professional Development and Continuing Education Faculty of Educational Studies Universiti Putra Malaysia Serdang The purpose is to test the
STAT 401A - Statistical Methods for Research Workers
 STAT 401A - Statistical Methods for Research Workers One-way ANOVA Jarad Niemi (Dr. J) Iowa State University last updated: October 10, 2014 Jarad Niemi (Iowa State) One-way ANOVA October 10, 2014 1 / 39
Topic 23: Diagnostics and Remedies
 Topic 23: Diagnostics and Remedies Outline Diagnostics residual checks ANOVA remedial measures Diagnostics Overview We will take the diagnostics and remedial measures that we learned for regression and
Outline. Topic 20 - Diagnostics and Remedies. Residuals. Overview. Diagnostics Plots Residual checks Formal Tests. STAT Fall 2013
 Topic 20 - Diagnostics and Remedies - Fall 2013 Diagnostics Plots Residual checks Formal Tests Remedial Measures Outline Topic 20 2 General assumptions Overview Normally distributed error terms Independent
Stevens 2. Aufl. S Multivariate Tests c
 Stevens 2. Aufl. S. 200 General Linear Model Between-Subjects Factors 1,00 2,00 3,00 N 11 11 11 Effect a. Exact statistic Pillai's Trace Wilks' Lambda Hotelling's Trace Roy's Largest Root Pillai's Trace
Outline Topic 21 - Two Factor ANOVA
 Outline Topic 21 - Two Factor ANOVA Data Model Parameter Estimates - Fall 2013 Equal Sample Size One replicate per cell Unequal Sample size Topic 21 2 Overview Now have two factors (A and B) Suppose each
Repeated Measures ANOVA Multivariate ANOVA and Their Relationship to Linear Mixed Models
 Repeated Measures ANOVA Multivariate ANOVA and Their Relationship to Linear Mixed Models EPSY 905: Multivariate Analysis Spring 2016 Lecture #12 April 20, 2016 EPSY 905: RM ANOVA, MANOVA, and Mixed Models
Two-factor studies. STAT 525 Chapter 19 and 20. Professor Olga Vitek
 Two-factor studies STAT 525 Chapter 19 and 20 Professor Olga Vitek December 2, 2010 19 Overview Now have two factors (A and B) Suppose each factor has two levels Could analyze as one factor with 4 levels
Multivariate Linear Models
 Multivariate Linear Models Stanley Sawyer Washington University November 7, 2001 1. Introduction. Suppose that we have n observations, each of which has d components. For example, we may have d measurements
dm'log;clear;output;clear'; options ps=512 ls=99 nocenter nodate nonumber nolabel FORMCHAR=" = -/\<>*"; ODS LISTING;
 dm'log;clear;output;clear'; options ps=512 ls=99 nocenter nodate nonumber nolabel FORMCHAR=" ---- + ---+= -/\*"; ODS LISTING; *** Table 23.2 ********************************************; *** Moore, David
MULTIVARIATE ANALYSIS OF VARIANCE
 MULTIVARIATE ANALYSIS OF VARIANCE RAJENDER PARSAD AND L.M. BHAR Indian Agricultural Statistics Research Institute Library Avenue, New Delhi - 0 0 lmb@iasri.res.in. Introduction In many agricultural experiments,
Analysis of variance, multivariate (MANOVA)
") Analysis of variance, multivariate (MANOVA) Abstract: A designed experiment is set up in which the system studied is under the control of an investigator. The individuals, the treatments, the variables
Analysis of variance, multivariate (MANOVA) Abstract: A designed experiment is set up in which the system studied is under the control of an investigator. The individuals, the treatments, the variables
MANOVA MANOVA,$/,,# ANOVA ##$%'*!# 1. $!;' *$,$!;' (''
 14 3! "#!$%# $# $&'('$)!! (Analysis of Variance : ANOVA) *& & "#!# +, ANOVA -& $ $ (+,$ ''$) *$#'$)!!#! (Multivariate Analysis of Variance : MANOVA).*& ANOVA *+,'$)$/*! $#/#-, $(,!0'%1)!', #($!#$ # *&,
SAS Syntax and Output for Data Manipulation:
 CLP 944 Example 5 page 1 Practice with Fixed and Random Effects of Time in Modeling Within-Person Change The models for this example come from Hoffman (2015) chapter 5. We will be examining the extent
General Linear Model (Chapter 4)
") General Linear Model (Chapter 4) Outcome variable is considered continuous Simple linear regression Scatterplots OLS is BLUE under basic assumptions MSE estimates residual variance testing regression coefficients
General Linear Model (Chapter 4) Outcome variable is considered continuous Simple linear regression Scatterplots OLS is BLUE under basic assumptions MSE estimates residual variance testing regression coefficients
Lecture 4. Random Effects in Completely Randomized Design
 Lecture 4. Random Effects in Completely Randomized Design Montgomery: 3.9, 13.1 and 13.7 1 Lecture 4 Page 1 Random Effects vs Fixed Effects Consider factor with numerous possible levels Want to draw inference
In a one-way ANOVA, the total sums of squares among observations is partitioned into two components: Sums of squares represent:
 Activity #10: AxS ANOVA (Repeated subjects design) Resources: optimism.sav So far in MATH 300 and 301, we have studied the following hypothesis testing procedures: 1) Binomial test, sign-test, Fisher s
Applied Multivariate Statistical Modeling Prof. J. Maiti Department of Industrial Engineering and Management Indian Institute of Technology, Kharagpur
 Applied Multivariate Statistical Modeling Prof. J. Maiti Department of Industrial Engineering and Management Indian Institute of Technology, Kharagpur Lecture - 29 Multivariate Linear Regression- Model
Applied Multivariate Analysis
 Department of Mathematics and Statistics, University of Vaasa, Finland Spring 2017 Discriminant Analysis Background 1 Discriminant analysis Background General Setup for the Discriminant Analysis Descriptive
Topic 32: Two-Way Mixed Effects Model
 Topic 3: Two-Way Mixed Effects Model Outline Two-way mixed models Three-way mixed models Data for two-way design Y is the response variable Factor A with levels i = 1 to a Factor B with levels j = 1 to
MIXED MODELS FOR REPEATED (LONGITUDINAL) DATA PART 1 DAVID C. HOWELL 4/26/2010
 DATA PART 1 DAVID C. HOWELL 4/26/2010") MIXED MODELS FOR REPEATED (LONGITUDINAL) DATA PART 1 DAVID C. HOWELL 4/26/2010 FOR THE SECOND PART OF THIS DOCUMENT GO TO www.uvm.edu/~dhowell/methods/supplements/mixed Models Repeated/Mixed Models for
MIXED MODELS FOR REPEATED (LONGITUDINAL) DATA PART 1 DAVID C. HOWELL 4/26/2010 FOR THE SECOND PART OF THIS DOCUMENT GO TO www.uvm.edu/~dhowell/methods/supplements/mixed Models Repeated/Mixed Models for
Multivariate Analysis of Variance
 Chapter 15 Multivariate Analysis of Variance Jolicouer and Mosimann studied the relationship between the size and shape of painted turtles. The table below gives the length, width, and height (all in mm)
MIXED MODELS FOR REPEATED (LONGITUDINAL) DATA PART 2 DAVID C. HOWELL 4/1/2010
 DATA PART 2 DAVID C. HOWELL 4/1/2010") MIXED MODELS FOR REPEATED (LONGITUDINAL) DATA PART 2 DAVID C. HOWELL 4/1/2010 Part 1 of this document can be found at http://www.uvm.edu/~dhowell/methods/supplements/mixed Models for Repeated Measures1.pdf
MIXED MODELS FOR REPEATED (LONGITUDINAL) DATA PART 2 DAVID C. HOWELL 4/1/2010 Part 1 of this document can be found at http://www.uvm.edu/~dhowell/methods/supplements/mixed Models for Repeated Measures1.pdf
Chapter 11. Analysis of Variance (One-Way)
") Chapter 11 Analysis of Variance (One-Way) We now develop a statistical procedure for comparing the means of two or more groups, known as analysis of variance or ANOVA. These groups might be the result
Chapter 11 Analysis of Variance (One-Way) We now develop a statistical procedure for comparing the means of two or more groups, known as analysis of variance or ANOVA. These groups might be the result
Chapter 14: Repeated-measures designs
 Chapter 14: Repeated-measures designs Oliver Twisted Please, Sir, can I have some more sphericity? The following article is adapted from: Field, A. P. (1998). A bluffer s guide to sphericity. Newsletter
STAT 705 Chapters 23 and 24: Two factors, unequal sample sizes; multi-factor ANOVA
 STAT 705 Chapters 23 and 24: Two factors, unequal sample sizes; multi-factor ANOVA Timothy Hanson Department of Statistics, University of South Carolina Stat 705: Data Analysis II 1 / 22 Balanced vs. unbalanced
1 Tomato yield example.
 ST706 - Linear Models II. Spring 2013 Two-way Analysis of Variance examples. Here we illustrate what happens analyzing two way data in proc glm in SAS. Similar issues come up with other software where
data proc sort proc corr run proc reg run proc glm run proc glm run proc glm run proc reg CONMAIN CONINT run proc reg DUMMAIN DUMINT run proc reg
 data one; input id Y group X; I1=0;I2=0;I3=0;if group=1 then I1=1;if group=2 then I2=1;if group=3 then I3=1; IINT1=I1*X;IINT2=I2*X;IINT3=I3*X; *************************************************************************;
IX. Complete Block Designs (CBD s)
") IX. Complete Block Designs (CBD s) A.Background Noise Factors nuisance factors whose values can be controlled within the context of the experiment but not outside the context of the experiment Covariates
IX. Complete Block Designs (CBD s) A.Background Noise Factors nuisance factors whose values can be controlled within the context of the experiment but not outside the context of the experiment Covariates
GLM Repeated-measures designs: One within-subjects factor
 GLM Repeated-measures designs: One within-subjects factor Reading: SPSS dvanced Models 9.0: 2. Repeated Measures Homework: Sums of Squares for Within-Subject Effects Download: glm_withn1.sav (Download
Group comparison test for independent samples
 Group comparison test for independent samples The purpose of the Analysis of Variance (ANOVA) is to test for significant differences between means. Supposing that: samples come from normal populations
Analysis of Variance. ภาว น ศ ร ประภาน ก ล คณะเศรษฐศาสตร มหาว ทยาล ยธรรมศาสตร
 Analysis of Variance ภาว น ศ ร ประภาน ก ล คณะเศรษฐศาสตร มหาว ทยาล ยธรรมศาสตร pawin@econ.tu.ac.th Outline Introduction One Factor Analysis of Variance Two Factor Analysis of Variance ANCOVA MANOVA Introduction
Longitudinal data: simple univariate methods of analysis
 Longitudinal data: simple univariate methods of analysis Danish version by Henrik Stryhn, June 1996 Department of Mathematcis and Physics, KVL Translation (and rewriting) by Ib Skovgaard, March 1998 (the
Descriptions of post-hoc tests
 Experimental Statistics II Page 81 Descriptions of post-hoc tests Post-hoc or Post-ANOVA tests! Once you have found out some treatment(s) are different, how do you determine which one(s) are different?
Topic 28: Unequal Replication in Two-Way ANOVA
 Topic 28: Unequal Replication in Two-Way ANOVA Outline Two-way ANOVA with unequal numbers of observations in the cells Data and model Regression approach Parameter estimates Previous analyses with constant
Statistics for exp. medical researchers Comparison of groups, T-tests and ANOVA
 Faculty of Health Sciences Outline Statistics for exp. medical researchers Comparison of groups, T-tests and ANOVA Lene Theil Skovgaard Sept. 14, 2015 Paired comparisons: tests and confidence intervals
ANALYSES OF NCGS DATA FOR ALCOHOL STATUS CATEGORIES 1 22:46 Sunday, March 2, 2003
 ANALYSES OF NCGS DATA FOR ALCOHOL STATUS CATEGORIES 1 22:46 Sunday, March 2, 2003 The MEANS Procedure DRINKING STATUS=1 Analysis Variable : TRIGL N Mean Std Dev Minimum Maximum 164 151.6219512 95.3801744
N J SS W /df W N - 1
 One-Way ANOVA Source Table ANOVA MODEL: ij = µ* + α j + ε ij H 0 : µ = µ =... = µ j or H 0 : Σα j = 0 Source Sum of Squares df Mean Squares F J Between Groups nj( j * ) J - SS B /(J ) MS B /MS W = ( N
8/28/2017. Repeated-Measures ANOVA. 1. Situation/hypotheses. 2. Test statistic. 3.Distribution. 4. Assumptions
 PSY 5101: Advanced Statistics for Psychological and Behavioral Research 1 Rationale of Repeated Measures ANOVA One-way and two-way Benefits Partitioning Variance Statistical Problems with Repeated- Measures
2 >1. That is, a parallel study design will require
 Cross Over Design Cross over design is commonly used in various type of research for its unique feature of accounting for within subject variability. For studies with short length of treatment time, illness
Multilevel Models in Matrix Form. Lecture 7 July 27, 2011 Advanced Multivariate Statistical Methods ICPSR Summer Session #2
 Multilevel Models in Matrix Form Lecture 7 July 27, 2011 Advanced Multivariate Statistical Methods ICPSR Summer Session #2 Today s Lecture Linear models from a matrix perspective An example of how to do
Multivariate Linear Regression Models
 Multivariate Linear Regression Models Regression analysis is used to predict the value of one or more responses from a set of predictors. It can also be used to estimate the linear association between
Outline. Topic 19 - Inference. The Cell Means Model. Estimates. Inference for Means Differences in cell means Contrasts. STAT Fall 2013
 Topic 19 - Inference - Fall 2013 Outline Inference for Means Differences in cell means Contrasts Multiplicity Topic 19 2 The Cell Means Model Expressed numerically Y ij = µ i + ε ij where µ i is the theoretical
Introduction. Introduction
 Introduction Multivariate procedures in R Peter Dalgaard Department of Biostatistics University of Copenhagen user 2006, Vienna Until version 2.1.0, R had limited support for multivariate tests Repeated
V. Experiments With Two Crossed Treatment Factors
 V. Experiments With Two Crossed Treatment Factors A.The Experimental Design Completely Randomized Design (CRD) Let A be a factor with levels i = 1,,a B be a factor with levels j = 1,,b Y ijt = the response
Lecture 6: Single-classification multivariate ANOVA (k-group( MANOVA)
") Lecture 6: Single-classification multivariate ANOVA (k-group( MANOVA) Rationale and MANOVA test statistics underlying principles MANOVA assumptions Univariate ANOVA Planned and unplanned Multivariate ANOVA
Lecture 6: Single-classification multivariate ANOVA (k-group( MANOVA) Rationale and MANOVA test statistics underlying principles MANOVA assumptions Univariate ANOVA Planned and unplanned Multivariate ANOVA
I L L I N O I S UNIVERSITY OF ILLINOIS AT URBANA-CHAMPAIGN
 Comparisons of Several Multivariate Populations Edps/Soc 584 and Psych 594 Applied Multivariate Statistics Carolyn J Anderson Department of Educational Psychology I L L I N O I S UNIVERSITY OF ILLINOIS
PLS205 Lab 2 January 15, Laboratory Topic 3
 PLS205 Lab 2 January 15, 2015 Laboratory Topic 3 General format of ANOVA in SAS Testing the assumption of homogeneity of variances by "/hovtest" by ANOVA of squared residuals Proc Power for ANOVA One-way
Analysis of variance and regression. April 17, Contents Comparison of several groups One-way ANOVA. Two-way ANOVA Interaction Model checking
 Analysis of variance and regression Contents Comparison of several groups One-way ANOVA April 7, 008 Two-way ANOVA Interaction Model checking ANOVA, April 008 Comparison of or more groups Julie Lyng Forman,
FACTORIALS. Advantages: efficiency & analysis of interactions. Missing data. Predicted EMS Special F tests Satterthwaite linear combination of MS
 FACTORIALS Advantages: efficiency & analysis of interactions PROBLEM Random or mixed trt. New sources of variance Complex EMS and F tests SOLUTION Predicted EMS Special F tests Satterthwaite linear combination
PLS205!! Lab 9!! March 6, Topic 13: Covariance Analysis
 PLS205!! Lab 9!! March 6, 2014 Topic 13: Covariance Analysis Covariable as a tool for increasing precision Carrying out a full ANCOVA Testing ANOVA assumptions Happiness! Covariable as a Tool for Increasing
TWO OR MORE RANDOM EFFECTS. The two-way complete model for two random effects:
 TWO OR MORE RANDOM EFFECTS Example: The factors that influence the breaking strength of a synthetic fiber are being studied. Four production machines and three operators are randomly selected. A two-way
Data Analyses in Multivariate Regression Chii-Dean Joey Lin, SDSU, San Diego, CA
 Data Analyses in Multivariate Regression Chii-Dean Joey Lin, SDSU, San Diego, CA ABSTRACT Regression analysis is one of the most used statistical methodologies. It can be used to describe or predict causal
STAT 501 EXAM I NAME Spring 1999
 STAT 501 EXAM I NAME Spring 1999 Instructions: You may use only your calculator and the attached tables and formula sheet. You can detach the tables and formula sheet from the rest of this exam. Show your