Analysis of Variance. ภาว น ศ ร ประภาน ก ล คณะเศรษฐศาสตร มหาว ทยาล ยธรรมศาสตร
|
|
|
- Dwight Byrd
- 5 years ago
- Views:
Transcription

1 Analysis of Variance ภาว น ศ ร ประภาน ก ล คณะเศรษฐศาสตร มหาว ทยาล ยธรรมศาสตร


2 Outline Introduction One Factor Analysis of Variance Two Factor Analysis of Variance ANCOVA MANOVA
3 Introduction A statistical technique used for making inferences about a multitude of parameters relating to population means. We do this not by analyzing variance, but by analyzing variation One Factor ANOVA: Samples from m populations Hypothesis: All the population means are equal Two Factor ANOVA: Two factors may affect the means Hypothesis: A specified factor does not affect the mean
4 1. ONE FACTOR ANOVA
5 One Factor ANOVA Consider m samples, each of size n Suppose that for i = 1,,m these samples are independent Sample i comes from population i that is normally distributed with mean µ i and variance σ 2 Null hypothesis is: H 0 : μ 1 = μ 2 =... = μ m = μ Against H 1 : Not all means are equal
6 One Factor ANOVA If H 0 is reasonable, then practically there is only one population Suppose we express mean of sample i as µ i = µ + γ i Let Y ij be the j th sample observation from population i, then we have Y ij = µ + γ i + ε ij Thus H 0 can be restated as γ 1 = γ 2 = = γ m = 0
7 One Factor ANOVA The sample data structure is: Population 1: Y 11, Y 12,, Y 1n Population 2: Y 21, Y 22,, Y 2n Population m: Y m1, Y m2,, Y mn The total sample size is N = m*n


8 One Factor ANOVA Assumptions The random errors, ε ij, are: Normally distributed with mean zero Independent of one another Each population has the same variance, σ 2 Note: We can test the validity of these assumptions before performing ANOVA as well
9 One Factor ANOVA Notations: be mean of the sample i Y i We use Y i to estimate µ i Y be mean of the overall sample That is 1 (We use to estimate µ ) Y m i = 1 γ i is estimated by i is estimated by m = Y Y $ γ i = Yi Y ε $ ε i = Yij Yi i
10 Sums of Squares Decomposition If we had only 1 population, we would view the variance as deviations of observations from the overall mean However, we potentially have m distinct populations The deviations can be composed of Deviations of observations from each population mean, Yij μi, and Deviations of population means from the overall mean, μ μ i
11 Sums of Squares Decomposition This can be expressed as: Summed across i and j, we have: 2 2 ij μ = Yij μi + μi μ ( Y ) ( ) = [( Y μ ) + ( μ μ)] ij i i ij μi Yij μi μi μ μi μ = ( Y ) + 2( )( ) + ( ) ( Yij μ) = ( Yij μi ) + n( μi μ) i j i j i 2 2 ( Yij μi ) nγi i j i = +
12 Sums of Squares Decomposition The expression is estimated by: ( ) 2 Yij 2 N Y = ( n 1) Si 2 + nγˆ i 2 ij, i i Where S 2 i = j ( Y ) 2 ij Yi n 1 Or SST = SSE + SSP
13 Variation The TOTAL variation about the common mean, SST, can be decomposed into two portions: A portion due to error, SSE, that represents variation within a population which we are unable to explain further, and A portion due to process, SSP, that represents variation from population to population due to differences in the population means
14 F Statistic To fairly compare the two portions of the total variation, we divide each portion by its degrees of freedom to obtain the corresponding mean squares : MSE = SSE/(N m) MSP = SSP/(m 1) The ratio F calc = MSP/MSE
15 Hypothesis Testing Reject H 0 if: F calc F m 1, N m, α Where α is the significant level Do not reject H 0 : Otherwise
16 Table for One Factor ANOVA In conclusion: SSP = SSE = i i 2 i i 2 i nˆ γ = n( Y Y) ( n 1) S i 2
")

17 Table for One Factor ANOVA Source SS df MS (variation) (variance) Process SSP m -1 MSP F MSP/ MSE Error SSE N - m MSE Total SST N -1
18 One Factor ANOVA Example EXAMPLE 11.1 in Ross (1996) An investigator organized a study of mileages obtainable from three different brands of gasoline. Using 15 identical motors set to run at the same speed, the investigator randomly assigned each brand of gasoline to 5 of the motors. Each motors was then run on 10 gallons of gasoline, with the total mileages obtained as given below
19 One Factor ANOVA Example Gas 1 Gas 2 Gas

20 One Factor ANOVA Example Source SS df MS F (variation) (variance) Process Error 1, Total 2, Y 1
21 2. TWO FACTOR ANOVA
22 Two Factor ANOVA Example EXAMPLE 11.3 in Ross (1996) Four different standardized reading achievement test were administered to each of five students. Their score were as follows:
23 Test No. Two Factor ANOVA Example Student


24 Two Factor ANOVA Example Each value in the set of 20 data points is affected by two factors: The test paper The student who did the test
25 Two Factor ANOVA Suppose there are 2 factors There are m possible levels of factor 1 (Row factor) There are n possible levels of factor 2 (Column factor) Let X ij denote the value of the data obtained when: The first factor is at level i The second factor is at level j
26 Two Factor ANOVA Assume that: All data values are independent Common variance is σ 2 Suppose that the mean value of the data point depends on both factors E[X ij ] = µ + α i + β j µ is grand mean α i is deviation from factor 1 β j is deviation from factor 2
27 Suppose also that Let: Two Factor ANOVA n m i i= 1 j= 1 X ij be the average when factor 1 is i j= 1 = (average the same row) X i n m X ij i= 1 X be the average when factor 2 is j j = m (average the same column) m n Xij i= 1 j= 1 X = be the average of all data values mn α n = β = j 0
28 Two Factor ANOVA We can see that: As well as: EX [ ] i EX [ ] j EX [ ] = μ + α = μ + β = μ i i EX [ X] = α i EX [ X] = β j i i
29 Two Factor ANOVA Then, it is best to estimate these parameters as: ˆ μ = X ˆ α = X ˆ β i j i j X = X X
30 Hypothesis Testing Now there are 2 hypotheses First, there is no row effect H 0 : All α i are 0 H 1 : Not all α i are 0 Second, there is no column effect H 0 : All β j are 0 H 1 : Not all β j are 0
31 Variation Let: SS1 = SS2 = SSE = m n ( X X ) i= 1 n j= 1 m n i m ( X X ) i= 1 j= 1 j 2 2 ( X X X + X ) ij i j 2
32 F Statistic Let: MS1 = SS1/m 1 MS2 = SS2/n 1 MSE = SSE/(m 1)(n 1) F calc1 = MS1/MSE F calc2 = MS2/MSE
33 Hypothesis Testing Reject H 0 for factor 1 if: F calc1 F m 1, (m 1)(n 1), α Where α is the significant level Reject H 0 for factor 2 if: F calc2 F n 1, (m 1)(n 1), α Do not reject H 0 : Otherwise
 Factor 2 (Column) SS df MS")

34 Table of Two Factor ANOVA Source Factor 1 (Row) Factor 2 (Column) SS df MS (variation) (variance) SS1 m 1 MS1 SS2 n 1 MS2 F MS1/ MSE MS2/ MSE Error SSE (m 1)(n 1) MSE
35 Back to the Example Test No. Student
36 Table of Two Factor ANOVA Source Factor 1 (Row) Factor 2 (Column) SS df MS F (variation) (variance) , Error
37 3. ANCOVA
38 Analysis of Covariance The Analysis of Covariance (ANCOVA) is a technique that sits between ANOVA and regression analysis Purposes To increase precision of comparisons between groups by accounting to variation on important variables To adjust comparisons between groups for imbalances in important variables
39 Analysis of Covariance ANCOVA extends ANOVA by including one or more continuous variables that predict the outcome Continuous variables such as these are not part of the main interests, but have an influence on the dependent variables These continuous variables are called covariates
40 Same as ANOVA + Analysis of Covariance Assumptions Independence of the covariate and treatment effect Homogeneity of regression slopes

41 Analysis of Covariance Rough Idea Because the covariate can affect the dependent variable, we adjust for the variation in the covariate between groups using the technique of regression After taking out effects of the covariate, we perform ANOVA on differences of dependent variable between groups

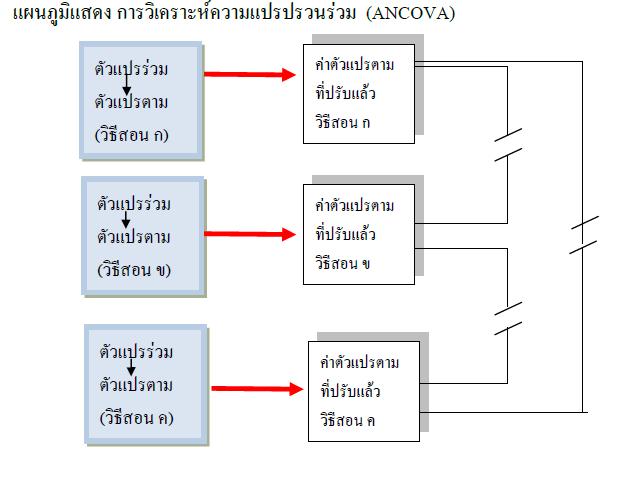
42 Analysis of Covariance Example

 Process")
 m 1 Error SSE")
 MSE (adj.")
43 Table of ANCOVA Source SS df MS F (variation) (variance) Process SSP (adj.) m 1 Error SSE (adj.) N m 1 MSP (adj.) MSE (adj.) MSP/ MSE Total SST (adj.) N 2
44 4. MANOVA
45 Multivariate Analysis of Variance MANOVA is a generalized from of ANOVA, used in cases when there are two or more dependent variables For example, we may conduct a study where we try two different textbooks, and we are interested in the students' improvements in math and physics our hypothesis is that both together are affected by the difference in textbooks
46 Multivariate Analysis of Variance Instead of a univariate F value, we would obtain a multivariate F value (Wilks' lambda) based on a comparison of the error variance/covariance matrix and the effect variance/covariance matrix If the overall multivariate test is significant, we conclude that the respective effect (e.g., textbook) is significant However, our next question would of course be whether only math skills improved, only physics skills improved, or both
47 References Ross, Sheldon M. (1996) Introductory Statistics. McGraw Hill cs/ancova.pdf
Chapter 10: Analysis of variance (ANOVA)
") Chapter 10: Analysis of variance (ANOVA) ANOVA (Analysis of variance) is a collection of techniques for dealing with more general experiments than the previous one-sample or two-sample tests. We first
Chapter 10: Analysis of variance (ANOVA) ANOVA (Analysis of variance) is a collection of techniques for dealing with more general experiments than the previous one-sample or two-sample tests. We first
Summary of Chapter 7 (Sections ) and Chapter 8 (Section 8.1)
 and Chapter 8 (Section 8.1)") Summary of Chapter 7 (Sections 7.2-7.5) and Chapter 8 (Section 8.1) Chapter 7. Tests of Statistical Hypotheses 7.2. Tests about One Mean (1) Test about One Mean Case 1: σ is known. Assume that X N(µ, σ
Summary of Chapter 7 (Sections 7.2-7.5) and Chapter 8 (Section 8.1) Chapter 7. Tests of Statistical Hypotheses 7.2. Tests about One Mean (1) Test about One Mean Case 1: σ is known. Assume that X N(µ, σ
Group comparison test for independent samples
 Group comparison test for independent samples The purpose of the Analysis of Variance (ANOVA) is to test for significant differences between means. Supposing that: samples come from normal populations
Correlation Analysis
 Simple Regression Correlation Analysis Correlation analysis is used to measure strength of the association (linear relationship) between two variables Correlation is only concerned with strength of the
Multiple Regression. Inference for Multiple Regression and A Case Study. IPS Chapters 11.1 and W.H. Freeman and Company
 Multiple Regression Inference for Multiple Regression and A Case Study IPS Chapters 11.1 and 11.2 2009 W.H. Freeman and Company Objectives (IPS Chapters 11.1 and 11.2) Multiple regression Data for multiple
MANOVA is an extension of the univariate ANOVA as it involves more than one Dependent Variable (DV). The following are assumptions for using MANOVA:
. The following are assumptions for using MANOVA:") MULTIVARIATE ANALYSIS OF VARIANCE MANOVA is an extension of the univariate ANOVA as it involves more than one Dependent Variable (DV). The following are assumptions for using MANOVA: 1. Cell sizes : o
MULTIVARIATE ANALYSIS OF VARIANCE MANOVA is an extension of the univariate ANOVA as it involves more than one Dependent Variable (DV). The following are assumptions for using MANOVA: 1. Cell sizes : o
CHAPTER 4 Analysis of Variance. One-way ANOVA Two-way ANOVA i) Two way ANOVA without replication ii) Two way ANOVA with replication
 Two way ANOVA without replication ii) Two way ANOVA with replication") CHAPTER 4 Analysis of Variance One-way ANOVA Two-way ANOVA i) Two way ANOVA without replication ii) Two way ANOVA with replication 1 Introduction In this chapter, expand the idea of hypothesis tests. We
CHAPTER 4 Analysis of Variance One-way ANOVA Two-way ANOVA i) Two way ANOVA without replication ii) Two way ANOVA with replication 1 Introduction In this chapter, expand the idea of hypothesis tests. We
16.3 One-Way ANOVA: The Procedure
 16.3 One-Way ANOVA: The Procedure Tom Lewis Fall Term 2009 Tom Lewis () 16.3 One-Way ANOVA: The Procedure Fall Term 2009 1 / 10 Outline 1 The background 2 Computing formulas 3 The ANOVA Identity 4 Tom
Multivariate Regression (Chapter 10)
") Multivariate Regression (Chapter 10) This week we ll cover multivariate regression and maybe a bit of canonical correlation. Today we ll mostly review univariate multivariate regression. With multivariate
Multivariate Regression (Chapter 10) This week we ll cover multivariate regression and maybe a bit of canonical correlation. Today we ll mostly review univariate multivariate regression. With multivariate
Inferences for Regression
 Inferences for Regression An Example: Body Fat and Waist Size Looking at the relationship between % body fat and waist size (in inches). Here is a scatterplot of our data set: Remembering Regression In
Chapter 12 - Lecture 2 Inferences about regression coefficient
 Chapter 12 - Lecture 2 Inferences about regression coefficient April 19th, 2010 Facts about slope Test Statistic Confidence interval Hypothesis testing Test using ANOVA Table Facts about slope In previous
Notes for Week 13 Analysis of Variance (ANOVA) continued WEEK 13 page 1
 continued WEEK 13 page 1") Notes for Wee 13 Analysis of Variance (ANOVA) continued WEEK 13 page 1 Exam 3 is on Friday May 1. A part of one of the exam problems is on Predictiontervals : When randomly sampling from a normal population
Notes for Wee 13 Analysis of Variance (ANOVA) continued WEEK 13 page 1 Exam 3 is on Friday May 1. A part of one of the exam problems is on Predictiontervals : When randomly sampling from a normal population
Ch 2: Simple Linear Regression
 Ch 2: Simple Linear Regression 1. Simple Linear Regression Model A simple regression model with a single regressor x is y = β 0 + β 1 x + ɛ, where we assume that the error ɛ is independent random component
Inference for Regression Simple Linear Regression
 Inference for Regression Simple Linear Regression IPS Chapter 10.1 2009 W.H. Freeman and Company Objectives (IPS Chapter 10.1) Simple linear regression p Statistical model for linear regression p Estimating
Multiple Linear Regression
 Multiple Linear Regression Simple linear regression tries to fit a simple line between two variables Y and X. If X is linearly related to Y this explains some of the variability in Y. In most cases, there
Inference for Regression Inference about the Regression Model and Using the Regression Line
 Inference for Regression Inference about the Regression Model and Using the Regression Line PBS Chapter 10.1 and 10.2 2009 W.H. Freeman and Company Objectives (PBS Chapter 10.1 and 10.2) Inference about
Simple Linear Regression
 Simple Linear Regression In simple linear regression we are concerned about the relationship between two variables, X and Y. There are two components to such a relationship. 1. The strength of the relationship.
Chapter 4. Regression Models. Learning Objectives
 Chapter 4 Regression Models To accompany Quantitative Analysis for Management, Eleventh Edition, by Render, Stair, and Hanna Power Point slides created by Brian Peterson Learning Objectives After completing
Inference for the Regression Coefficient
 Inference for the Regression Coefficient Recall, b 0 and b 1 are the estimates of the slope β 1 and intercept β 0 of population regression line. We can shows that b 0 and b 1 are the unbiased estimates
One-Way Analysis of Variance: A Guide to Testing Differences Between Multiple Groups
 One-Way Analysis of Variance: A Guide to Testing Differences Between Multiple Groups In analysis of variance, the main research question is whether the sample means are from different populations. The
Introduction to Statistical Inference Lecture 10: ANOVA, Kruskal-Wallis Test
 Introduction to Statistical Inference Lecture 10: ANOVA, Kruskal-Wallis Test la Contents The two sample t-test generalizes into Analysis of Variance. In analysis of variance ANOVA the population consists
STAT 115:Experimental Designs
 STAT 115:Experimental Designs Josefina V. Almeda 2013 Multisample inference: Analysis of Variance 1 Learning Objectives 1. Describe Analysis of Variance (ANOVA) 2. Explain the Rationale of ANOVA 3. Compare
Chapter 11 - Lecture 1 Single Factor ANOVA
 Chapter 11 - Lecture 1 Single Factor ANOVA April 7th, 2010 Means Variance Sum of Squares Review In Chapter 9 we have seen how to make hypothesis testing for one population mean. In Chapter 10 we have seen
Lecture 6: Single-classification multivariate ANOVA (k-group( MANOVA)
") Lecture 6: Single-classification multivariate ANOVA (k-group( MANOVA) Rationale and MANOVA test statistics underlying principles MANOVA assumptions Univariate ANOVA Planned and unplanned Multivariate ANOVA
Lecture 6: Single-classification multivariate ANOVA (k-group( MANOVA) Rationale and MANOVA test statistics underlying principles MANOVA assumptions Univariate ANOVA Planned and unplanned Multivariate ANOVA
LECTURE 6. Introduction to Econometrics. Hypothesis testing & Goodness of fit
 LECTURE 6 Introduction to Econometrics Hypothesis testing & Goodness of fit October 25, 2016 1 / 23 ON TODAY S LECTURE We will explain how multiple hypotheses are tested in a regression model We will define
One-Way Analysis of Variance (ANOVA)
") 1 One-Way Analysis of Variance (ANOVA) One-Way Analysis of Variance (ANOVA) is a method for comparing the means of a populations. This kind of problem arises in two different settings 1. When a independent
1 One-Way Analysis of Variance (ANOVA) One-Way Analysis of Variance (ANOVA) is a method for comparing the means of a populations. This kind of problem arises in two different settings 1. When a independent
Multivariate analysis of variance and covariance
 Introduction Multivariate analysis of variance and covariance Univariate ANOVA: have observations from several groups, numerical dependent variable. Ask whether dependent variable has same mean for each
Unit 10: Simple Linear Regression and Correlation
 Unit 10: Simple Linear Regression and Correlation Statistics 571: Statistical Methods Ramón V. León 6/28/2004 Unit 10 - Stat 571 - Ramón V. León 1 Introductory Remarks Regression analysis is a method for
Tentative solutions TMA4255 Applied Statistics 16 May, 2015
 Norwegian University of Science and Technology Department of Mathematical Sciences Page of 9 Tentative solutions TMA455 Applied Statistics 6 May, 05 Problem Manufacturer of fertilizers a) Are these independent
Factorial designs. Experiments
 Chapter 5: Factorial designs Petter Mostad mostad@chalmers.se Experiments Actively making changes and observing the result, to find causal relationships. Many types of experimental plans Measuring response
Econ 3790: Business and Economics Statistics. Instructor: Yogesh Uppal
 Econ 3790: Business and Economics Statistics Instructor: Yogesh Uppal yuppal@ysu.edu Sampling Distribution of b 1 Expected value of b 1 : Variance of b 1 : E(b 1 ) = 1 Var(b 1 ) = σ 2 /SS x Estimate of
Statistics For Economics & Business
 Statistics For Economics & Business Analysis of Variance In this chapter, you learn: Learning Objectives The basic concepts of experimental design How to use one-way analysis of variance to test for differences
The One-Way Repeated-Measures ANOVA. (For Within-Subjects Designs)
") The One-Way Repeated-Measures ANOVA (For Within-Subjects Designs) Logic of the Repeated-Measures ANOVA The repeated-measures ANOVA extends the analysis of variance to research situations using repeated-measures
The One-Way Repeated-Measures ANOVA (For Within-Subjects Designs) Logic of the Repeated-Measures ANOVA The repeated-measures ANOVA extends the analysis of variance to research situations using repeated-measures
Unit 27 One-Way Analysis of Variance
 Unit 27 One-Way Analysis of Variance Objectives: To perform the hypothesis test in a one-way analysis of variance for comparing more than two population means Recall that a two sample t test is applied
Sociology 6Z03 Review II
 Sociology 6Z03 Review II John Fox McMaster University Fall 2016 John Fox (McMaster University) Sociology 6Z03 Review II Fall 2016 1 / 35 Outline: Review II Probability Part I Sampling Distributions Probability
Sampling distribution of t. 2. Sampling distribution of t. 3. Example: Gas mileage investigation. II. Inferential Statistics (8) t =
 t =") 2. The distribution of t values that would be obtained if a value of t were calculated for each sample mean for all possible random of a given size from a population _ t ratio: (X - µ hyp ) t s x The result
2. The distribution of t values that would be obtained if a value of t were calculated for each sample mean for all possible random of a given size from a population _ t ratio: (X - µ hyp ) t s x The result
ANOVA (Analysis of Variance) output RLS 11/20/2016
 output RLS 11/20/2016") ANOVA (Analysis of Variance) output RLS 11/20/2016 1. Analysis of Variance (ANOVA) The goal of ANOVA is to see if the variation in the data can explain enough to see if there are differences in the means.
ANOVA (Analysis of Variance) output RLS 11/20/2016 1. Analysis of Variance (ANOVA) The goal of ANOVA is to see if the variation in the data can explain enough to see if there are differences in the means.
Prepared by: Prof. Dr Bahaman Abu Samah Department of Professional Development and Continuing Education Faculty of Educational Studies Universiti
 Prepared by: Prof. Dr Bahaman Abu Samah Department of Professional Development and Continuing Education Faculty of Educational Studies Universiti Putra Malaysia Serdang Use in experiment, quasi-experiment
Categorical Predictor Variables
 Categorical Predictor Variables We often wish to use categorical (or qualitative) variables as covariates in a regression model. For binary variables (taking on only 2 values, e.g. sex), it is relatively
DESAIN EKSPERIMEN Analysis of Variances (ANOVA) Semester Genap 2017/2018 Jurusan Teknik Industri Universitas Brawijaya
 Semester Genap 2017/2018 Jurusan Teknik Industri Universitas Brawijaya") DESAIN EKSPERIMEN Analysis of Variances (ANOVA) Semester Jurusan Teknik Industri Universitas Brawijaya Outline Introduction The Analysis of Variance Models for the Data Post-ANOVA Comparison of Means Sample
DESAIN EKSPERIMEN Analysis of Variances (ANOVA) Semester Jurusan Teknik Industri Universitas Brawijaya Outline Introduction The Analysis of Variance Models for the Data Post-ANOVA Comparison of Means Sample
SIMPLE REGRESSION ANALYSIS. Business Statistics
 SIMPLE REGRESSION ANALYSIS Business Statistics CONTENTS Ordinary least squares (recap for some) Statistical formulation of the regression model Assessing the regression model Testing the regression coefficients
Confidence Intervals, Testing and ANOVA Summary
 Confidence Intervals, Testing and ANOVA Summary 1 One Sample Tests 1.1 One Sample z test: Mean (σ known) Let X 1,, X n a r.s. from N(µ, σ) or n > 30. Let The test statistic is H 0 : µ = µ 0. z = x µ 0
Econ 3790: Business and Economic Statistics. Instructor: Yogesh Uppal
 Econ 3790: Business and Economic Statistics Instructor: Yogesh Uppal Email: yuppal@ysu.edu Chapter 13, Part A: Analysis of Variance and Experimental Design Introduction to Analysis of Variance Analysis
The Multiple Regression Model
 Multiple Regression The Multiple Regression Model Idea: Examine the linear relationship between 1 dependent (Y) & or more independent variables (X i ) Multiple Regression Model with k Independent Variables:
1-Way ANOVA MATH 143. Spring Department of Mathematics and Statistics Calvin College
 1-Way ANOVA MATH 143 Department of Mathematics and Statistics Calvin College Spring 2010 The basic ANOVA situation Two variables: 1 Categorical, 1 Quantitative Main Question: Do the (means of) the quantitative
ECON 450 Development Economics
 ECON 450 Development Economics Statistics Background University of Illinois at Urbana-Champaign Summer 2017 Outline 1 Introduction 2 3 4 5 Introduction Regression analysis is one of the most important
Inference for Regression
 Inference for Regression Section 9.4 Cathy Poliak, Ph.D. cathy@math.uh.edu Office in Fleming 11c Department of Mathematics University of Houston Lecture 13b - 3339 Cathy Poliak, Ph.D. cathy@math.uh.edu
Math 628 In-class Exam 2 04/03/2013
 Math 628 In-class Exam 2 04/03/2013 Name: KU ID: Note: Show ALL work clearly in the space provided. In order to receive full credit on a problem, solution methods must be complete, logical and understandable.
Formal Statement of Simple Linear Regression Model
 Formal Statement of Simple Linear Regression Model Y i = β 0 + β 1 X i + ɛ i Y i value of the response variable in the i th trial β 0 and β 1 are parameters X i is a known constant, the value of the predictor
ANCOVA. Psy 420 Andrew Ainsworth
 ANCOVA Psy 420 Andrew Ainsworth What is ANCOVA? Analysis of covariance an extension of ANOVA in which main effects and interactions are assessed on DV scores after the DV has been adjusted for by the DV
Chapter 4: Regression Models
 Sales volume of company 1 Textbook: pp. 129-164 Chapter 4: Regression Models Money spent on advertising 2 Learning Objectives After completing this chapter, students will be able to: Identify variables,
Ch 3: Multiple Linear Regression
 Ch 3: Multiple Linear Regression 1. Multiple Linear Regression Model Multiple regression model has more than one regressor. For example, we have one response variable and two regressor variables: 1. delivery
STATS Analysis of variance: ANOVA
 STATS 1060 Analysis of variance: ANOVA READINGS: Chapters 28 of your text book (DeVeaux, Vellman and Bock); on-line notes for ANOVA; on-line practice problems for ANOVA NOTICE: You should print a copy
Chap The McGraw-Hill Companies, Inc. All rights reserved.
 11 pter11 Chap Analysis of Variance Overview of ANOVA Multiple Comparisons Tests for Homogeneity of Variances Two-Factor ANOVA Without Replication General Linear Model Experimental Design: An Overview
20.1. Balanced One-Way Classification Cell means parametrization: ε 1. ε I. + ˆɛ 2 ij =
 20. ONE-WAY ANALYSIS OF VARIANCE 1 20.1. Balanced One-Way Classification Cell means parametrization: Y ij = µ i + ε ij, i = 1,..., I; j = 1,..., J, ε ij N(0, σ 2 ), In matrix form, Y = Xβ + ε, or 1 Y J
Simple Linear Regression: One Quantitative IV
 Simple Linear Regression: One Quantitative IV Linear regression is frequently used to explain variation observed in a dependent variable (DV) with theoretically linked independent variables (IV). For example,
Simple Linear Regression
 9-1 l Chapter 9 l Simple Linear Regression 9.1 Simple Linear Regression 9.2 Scatter Diagram 9.3 Graphical Method for Determining Regression 9.4 Least Square Method 9.5 Correlation Coefficient and Coefficient
One-way ANOVA. Experimental Design. One-way ANOVA
 Method to compare more than two samples simultaneously without inflating Type I Error rate (α) Simplicity Few assumptions Adequate for highly complex hypothesis testing 09/30/12 1 Outline of this class
Concordia University (5+5)Q 1.
Q 1.") (5+5)Q 1. Concordia University Department of Mathematics and Statistics Course Number Section Statistics 360/1 40 Examination Date Time Pages Mid Term Test May 26, 2004 Two Hours 3 Instructor Course Examiner
(5+5)Q 1. Concordia University Department of Mathematics and Statistics Course Number Section Statistics 360/1 40 Examination Date Time Pages Mid Term Test May 26, 2004 Two Hours 3 Instructor Course Examiner
Statistics for Managers using Microsoft Excel 6 th Edition
 Statistics for Managers using Microsoft Excel 6 th Edition Chapter 13 Simple Linear Regression 13-1 Learning Objectives In this chapter, you learn: How to use regression analysis to predict the value of
Regression Models. Chapter 4. Introduction. Introduction. Introduction
 Chapter 4 Regression Models Quantitative Analysis for Management, Tenth Edition, by Render, Stair, and Hanna 008 Prentice-Hall, Inc. Introduction Regression analysis is a very valuable tool for a manager
Econ 3790: Statistics Business and Economics. Instructor: Yogesh Uppal
 Econ 3790: Statistics Business and Economics Instructor: Yogesh Uppal Email: yuppal@ysu.edu Chapter 14 Covariance and Simple Correlation Coefficient Simple Linear Regression Covariance Covariance between
Chapter 14 Student Lecture Notes Department of Quantitative Methods & Information Systems. Business Statistics. Chapter 14 Multiple Regression
 Chapter 14 Student Lecture Notes 14-1 Department of Quantitative Methods & Information Systems Business Statistics Chapter 14 Multiple Regression QMIS 0 Dr. Mohammad Zainal Chapter Goals After completing
STAT Chapter 10: Analysis of Variance
 STAT 515 -- Chapter 10: Analysis of Variance Designed Experiment A study in which the researcher controls the levels of one or more variables to determine their effect on the variable of interest (called
STA121: Applied Regression Analysis
 STA121: Applied Regression Analysis Linear Regression Analysis - Chapters 3 and 4 in Dielman Artin Department of Statistical Science September 15, 2009 Outline 1 Simple Linear Regression Analysis 2 Using
Applied Multivariate and Longitudinal Data Analysis
 Applied Multivariate and Longitudinal Data Analysis Chapter 2: Inference about the mean vector(s) II Ana-Maria Staicu SAS Hall 5220; 919-515-0644; astaicu@ncsu.edu 1 1 Compare Means from More Than Two
STAT Chapter 11: Regression
 STAT 515 -- Chapter 11: Regression Mostly we have studied the behavior of a single random variable. Often, however, we gather data on two random variables. We wish to determine: Is there a relationship
Chapter 14 Simple Linear Regression (A)
") Chapter 14 Simple Linear Regression (A) 1. Characteristics Managerial decisions often are based on the relationship between two or more variables. can be used to develop an equation showing how the variables
Chapter 14 Simple Linear Regression (A) 1. Characteristics Managerial decisions often are based on the relationship between two or more variables. can be used to develop an equation showing how the variables
22s:152 Applied Linear Regression. Take random samples from each of m populations.
 22s:152 Applied Linear Regression Chapter 8: ANOVA NOTE: We will meet in the lab on Monday October 10. One-way ANOVA Focuses on testing for differences among group means. Take random samples from each
Chapter 7, continued: MANOVA
 Chapter 7, continued: MANOVA The Multivariate Analysis of Variance (MANOVA) technique extends Hotelling T 2 test that compares two mean vectors to the setting in which there are m 2 groups. We wish to
Lec 1: An Introduction to ANOVA
 Ying Li Stockholm University October 31, 2011 Three end-aisle displays Which is the best? Design of the Experiment Identify the stores of the similar size and type. The displays are randomly assigned to
Multilevel Models in Matrix Form. Lecture 7 July 27, 2011 Advanced Multivariate Statistical Methods ICPSR Summer Session #2
 Multilevel Models in Matrix Form Lecture 7 July 27, 2011 Advanced Multivariate Statistical Methods ICPSR Summer Session #2 Today s Lecture Linear models from a matrix perspective An example of how to do
Analysis of Variance (ANOVA)
") Analysis of Variance ANOVA) Compare several means Radu Trîmbiţaş 1 Analysis of Variance for a One-Way Layout 1.1 One-way ANOVA Analysis of Variance for a One-Way Layout procedure for one-way layout Suppose
Analysis of Variance ANOVA) Compare several means Radu Trîmbiţaş 1 Analysis of Variance for a One-Way Layout 1.1 One-way ANOVA Analysis of Variance for a One-Way Layout procedure for one-way layout Suppose
ANOVA CIVL 7012/8012
 ANOVA CIVL 7012/8012 ANOVA ANOVA = Analysis of Variance A statistical method used to compare means among various datasets (2 or more samples) Can provide summary of any regression analysis in a table called
The One-Way Independent-Samples ANOVA. (For Between-Subjects Designs)
") The One-Way Independent-Samples ANOVA (For Between-Subjects Designs) Computations for the ANOVA In computing the terms required for the F-statistic, we won t explicitly compute any sample variances or
The One-Way Independent-Samples ANOVA (For Between-Subjects Designs) Computations for the ANOVA In computing the terms required for the F-statistic, we won t explicitly compute any sample variances or
22s:152 Applied Linear Regression. There are a couple commonly used models for a one-way ANOVA with m groups. Chapter 8: ANOVA
 22s:152 Applied Linear Regression Chapter 8: ANOVA NOTE: We will meet in the lab on Monday October 10. One-way ANOVA Focuses on testing for differences among group means. Take random samples from each
Unit 12: Analysis of Single Factor Experiments
 Unit 12: Analysis of Single Factor Experiments Statistics 571: Statistical Methods Ramón V. León 7/16/2004 Unit 12 - Stat 571 - Ramón V. León 1 Introduction Chapter 8: How to compare two treatments. Chapter
Deciphering Math Notation. Billy Skorupski Associate Professor, School of Education
 Deciphering Math Notation Billy Skorupski Associate Professor, School of Education Agenda General overview of data, variables Greek and Roman characters in math and statistics Parameters vs. Statistics
Chapter 11 - Lecture 1 Single Factor ANOVA
 April 5, 2013 Chapter 9 : hypothesis testing for one population mean. Chapter 10: hypothesis testing for two population means. What comes next? Chapter 9 : hypothesis testing for one population mean. Chapter
Lecture 10 Multiple Linear Regression
 Lecture 10 Multiple Linear Regression STAT 512 Spring 2011 Background Reading KNNL: 6.1-6.5 10-1 Topic Overview Multiple Linear Regression Model 10-2 Data for Multiple Regression Y i is the response variable
The legacy of Sir Ronald A. Fisher. Fisher s three fundamental principles: local control, replication, and randomization.
 1 Chapter 1: Research Design Principles The legacy of Sir Ronald A. Fisher. Fisher s three fundamental principles: local control, replication, and randomization. 2 Chapter 2: Completely Randomized Design
ECO220Y Simple Regression: Testing the Slope
 ECO220Y Simple Regression: Testing the Slope Readings: Chapter 18 (Sections 18.3-18.5) Winter 2012 Lecture 19 (Winter 2012) Simple Regression Lecture 19 1 / 32 Simple Regression Model y i = β 0 + β 1 x
We need to define some concepts that are used in experiments.
 Chapter 0 Analysis of Variance (a.k.a. Designing and Analysing Experiments) Section 0. Introduction In Chapter we mentioned some different ways in which we could get data: Surveys, Observational Studies,
MULTIPLE REGRESSION ANALYSIS AND OTHER ISSUES. Business Statistics
 MULTIPLE REGRESSION ANALYSIS AND OTHER ISSUES Business Statistics CONTENTS Multiple regression Dummy regressors Assumptions of regression analysis Predicting with regression analysis Old exam question
In a one-way ANOVA, the total sums of squares among observations is partitioned into two components: Sums of squares represent:
 Activity #10: AxS ANOVA (Repeated subjects design) Resources: optimism.sav So far in MATH 300 and 301, we have studied the following hypothesis testing procedures: 1) Binomial test, sign-test, Fisher s
Analysis of Variance and Co-variance. By Manza Ramesh
 Analysis of Variance and Co-variance By Manza Ramesh Contents Analysis of Variance (ANOVA) What is ANOVA? The Basic Principle of ANOVA ANOVA Technique Setting up Analysis of Variance Table Short-cut Method
DESAIN EKSPERIMEN BLOCKING FACTORS. Semester Genap 2017/2018 Jurusan Teknik Industri Universitas Brawijaya
 DESAIN EKSPERIMEN BLOCKING FACTORS Semester Genap Jurusan Teknik Industri Universitas Brawijaya Outline The Randomized Complete Block Design The Latin Square Design The Graeco-Latin Square Design Balanced
WITHIN-PARTICIPANT EXPERIMENTAL DESIGNS
 1 WITHIN-PARTICIPANT EXPERIMENTAL DESIGNS I. Single-factor designs: the model is: yij i j ij ij where: yij score for person j under treatment level i (i = 1,..., I; j = 1,..., n) overall mean βi treatment
Chapter 4: Randomized Blocks and Latin Squares
 Chapter 4: Randomized Blocks and Latin Squares 1 Design of Engineering Experiments The Blocking Principle Blocking and nuisance factors The randomized complete block design or the RCBD Extension of the
Week 12 Hypothesis Testing, Part II Comparing Two Populations
 Week 12 Hypothesis Testing, Part II Week 12 Hypothesis Testing, Part II Week 12 Objectives 1 The principle of Analysis of Variance is introduced and used to derive the F-test for testing the model utility
One-Way ANOVA. Some examples of when ANOVA would be appropriate include:
 One-Way ANOVA 1. Purpose Analysis of variance (ANOVA) is used when one wishes to determine whether two or more groups (e.g., classes A, B, and C) differ on some outcome of interest (e.g., an achievement
ANCOVA. Lecture 9 Andrew Ainsworth
 ANCOVA Lecture 9 Andrew Ainsworth What is ANCOVA? Analysis of covariance an extension of ANOVA in which main effects and interactions are assessed on DV scores after the DV has been adjusted for by the
Example 1 describes the results from analyzing these data for three groups and two variables contained in test file manova1.tf3.
 Simfit Tutorials and worked examples for simulation, curve fitting, statistical analysis, and plotting. http://www.simfit.org.uk MANOVA examples From the main SimFIT menu choose [Statistcs], [Multivariate],
Analysis of Variance
 Statistical Techniques II EXST7015 Analysis of Variance 15a_ANOVA_Introduction 1 Design The simplest model for Analysis of Variance (ANOVA) is the CRD, the Completely Randomized Design This model is also
Predictive Analytics : QM901.1x Prof U Dinesh Kumar, IIMB. All Rights Reserved, Indian Institute of Management Bangalore
 What is Multiple Linear Regression Several independent variables may influence the change in response variable we are trying to study. When several independent variables are included in the equation, the
A discussion on multiple regression models
 A discussion on multiple regression models In our previous discussion of simple linear regression, we focused on a model in which one independent or explanatory variable X was used to predict the value
n i n T Note: You can use the fact that t(.975; 10) = 2.228, t(.95; 10) = 1.813, t(.975; 12) = 2.179, t(.95; 12) =
 = 2.228, t(.95; 10) = 1.813, t(.975; 12) = 2.179, t(.95; 12) =") MAT 3378 3X Midterm Examination (Solutions) 1. An experiment with a completely randomized design was run to determine whether four specific firing temperatures affect the density of a certain type of brick.
MAT 3378 3X Midterm Examination (Solutions) 1. An experiment with a completely randomized design was run to determine whether four specific firing temperatures affect the density of a certain type of brick.
Business Statistics. Chapter 14 Introduction to Linear Regression and Correlation Analysis QMIS 220. Dr. Mohammad Zainal
 Department of Quantitative Methods & Information Systems Business Statistics Chapter 14 Introduction to Linear Regression and Correlation Analysis QMIS 220 Dr. Mohammad Zainal Chapter Goals After completing
QUEEN MARY, UNIVERSITY OF LONDON
 QUEEN MARY, UNIVERSITY OF LONDON MTH634 Statistical Modelling II Solutions to Exercise Sheet 4 Octobe07. We can write (y i. y.. ) (yi. y i.y.. +y.. ) yi. y.. S T. ( Ti T i G n Ti G n y i. +y.. ) G n T
Hypothesis Testing hypothesis testing approach
 Hypothesis Testing In this case, we d be trying to form an inference about that neighborhood: Do people there shop more often those people who are members of the larger population To ascertain this, we