ANOVA CIVL 7012/8012
|
|
|
- Darrell Austin
- 6 years ago
- Views:
Transcription
1 ANOVA CIVL 7012/8012
2 ANOVA ANOVA = Analysis of Variance A statistical method used to compare means among various datasets (2 or more samples) Can provide summary of any regression analysis in a table called ANOVA Table Developed by statistician and evolutionary biologist Ronald Fisher in 1921
3 ANOVA Table Basic Information contains Estimates of Variance Estimates used to answer Inferential questions of regression analysis Analysis of Variance and regression analysis are closely related Usually employed in comparisons involving several population means
4 Why the name, ANOVA Why Not ANOME, where ME=Means Although means are compared, but Comparisons are made using estimates of variances The ANOVA test statistics used are actually ratios of estimates of variance
5 ANOVA vs. REGRESSION Independent Variables ANOVA: must be treated as nominal REGRESSION: can be of any mixture (nominal, ordinal, interval) ANOVA is a special case of regression analysis For multivariable analysis or regression, the technique is called Analysis of Covariance (ANACOVA)
6 FACTORS AND LEVELS Assume a nominal (categorical) variable with k categories: Then number of dummy variables = k 1 These (k 1) variables collectively describe the basic nominal variable The basic nominal variable is called FACTOR The different categories of the FACTOR are referred to as its LEVELS
7 FIXED AND RANDOM FACTORS RANDOM FACTOR Whose LEVELs may be regarded as a sample from some large population of levels Example, Subjects, Litters, Observers, Days, Weeks FIXED FACTOR Whose LEVELs are the only ones of interest Example, Gender, Age, Marital Status, Education BOTH: locations, treatments, drugs, exposures
8 Types of ANOVA Several types depending on experimental designs and situations for which they have been developed One way (one factor, fixed effects) Two way (two factors, random effects) Two way with repeated measures (two factors, random effects) Fully nested (hierarchical factors) Kruskal-Wallis (non-parametric one way) Friedman (non-parametric two way)
9 THE PROBLEM (One Way ANOVA) To Determine whether the population means are all equal or not. Given k means (denoted as μ 1, μ 2,, μ k ), the basic null hypothesis of interest is: H 0 : μ 1 = μ 2 = = μ k The Alternate hypothesis is given by: H A : "The k population means are not all equal"
10 Assumptions (One Way ANOVA) All populations involved follow normal distribution Variance of the dependent variable is the same in each population Random samples have been selected from each populations or groups Each experimental unit sampled has been recorded with a specified dependent variable value
11 ANOVA Table Source Between groups/ Treatment groups/model Within Groups/Error Degrees of freedom (df) Sum of Squares (SS) Total N 1 SSY Mean Square (MS) k 1 SST MST = SST k 1 N k SSE MSE = SSE N k F-value/F MST MSE k = number of population means N = Total number of observations SST = Sum of squares between groups SSE = Sum of squares within groups/ Residual sum of squares/error sum of Squares SSY = Total sum of squares MST = Mean square Treatment/Mean Square between groups MSE = Mean square Error
12 Partition of Variance Y Y i Y i (amount unexplained by regression) Y i Y i തY Y = തY Y i = መβ 0 + መβ 1 X i Y i തY Y i തY (total amount unexplained) (amount explained by regression) Y = መβ 0 + መβ 1 X X i X
13 Partition of Variance (Cont.) Total unexplained variation Variation in all observations In other words, OR, = Variation due to regression = Variation between each observation and its group mean + Unexplained residual variation + Variation between each group mean and the overall mean SSY = SST + SSE k n i k k n i (Y ij തY) 2 = n i (Y i തY) 2 + (Y ij തY i ) 2 i=1 j=1 i=1 i=1 j=1
14 F Statistics For a one-way ANOVA, the test statistic is equal to the ratio of MST and MSE This ratio is known to follow an F distribution The test statistics is calculated as, F = MST MSE If F (observed) > F (Critical) Reject Null hypothesis If F (observed) F (Critical) Fail to reject Null hypothesis
15 F Distribution F distribution table is used to find the critical value Required: Degrees of freedom of Numerator (MST) Degrees of freedom of Denominator (MSE) Value of alpha (0.05, 0.1, ) Table C.7 (Textbook page )
16 EXAMPLE Suppose the National Transportation Safety Board (NTSB) wants to examine the safety of compact cars and full-size cars. It collects a sample of three for each of the treatments (cars types). Using the hypothetical data provided below, test whether the mean pressure applied to the driver s head during a crash test is equal for each types of car. Use α = 5% Compact cars Full size cars
17 EXAMPLE (Cont.) Step 1 State the null and alternate hypothesis H 0 : μ 1 = μ 2 H A : Atleast one mean pressure is not ststistically equal Step 2 Calculate the appropriate test statistic (Find sum of squares, mean squares) and critical value and then compare Example shown in Excel file (example_anova.xlsx)

18 Example-1: Complete ANOVA Table
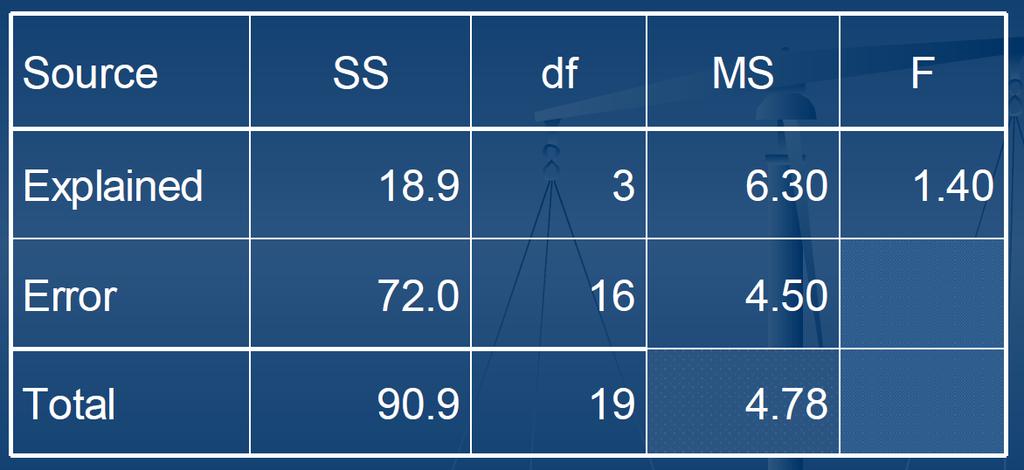
19 Example-1: Answer

20 Example-2: Complete ANOVA Table
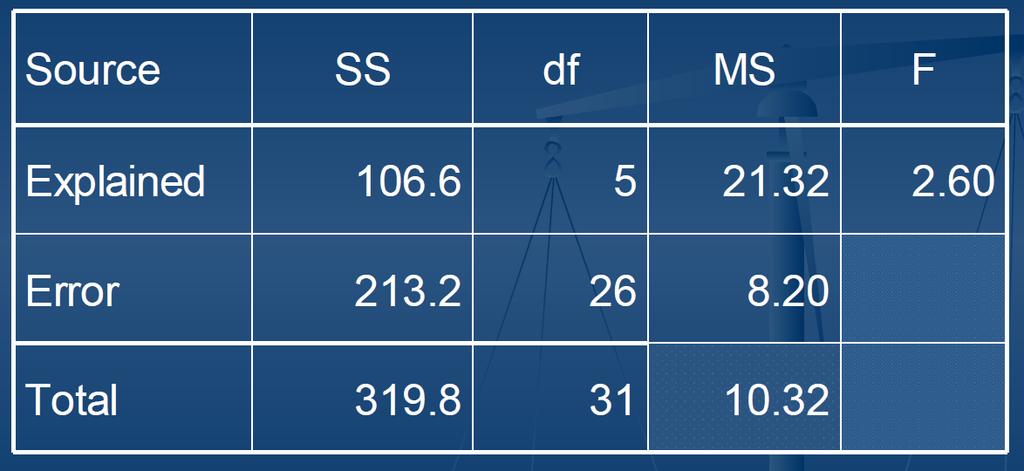
21 Example-2: Solution

22 Example-3 N=20
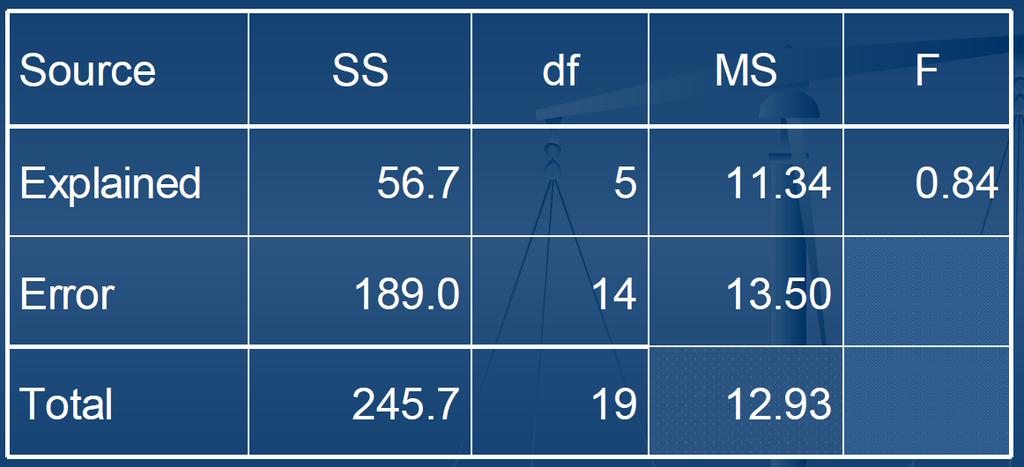
23 Example-3: Solution
Summary of Chapter 7 (Sections ) and Chapter 8 (Section 8.1)
 and Chapter 8 (Section 8.1)") Summary of Chapter 7 (Sections 7.2-7.5) and Chapter 8 (Section 8.1) Chapter 7. Tests of Statistical Hypotheses 7.2. Tests about One Mean (1) Test about One Mean Case 1: σ is known. Assume that X N(µ, σ
Summary of Chapter 7 (Sections 7.2-7.5) and Chapter 8 (Section 8.1) Chapter 7. Tests of Statistical Hypotheses 7.2. Tests about One Mean (1) Test about One Mean Case 1: σ is known. Assume that X N(µ, σ
One-Way Analysis of Variance: A Guide to Testing Differences Between Multiple Groups
 One-Way Analysis of Variance: A Guide to Testing Differences Between Multiple Groups In analysis of variance, the main research question is whether the sample means are from different populations. The
SIMPLE REGRESSION ANALYSIS. Business Statistics
 SIMPLE REGRESSION ANALYSIS Business Statistics CONTENTS Ordinary least squares (recap for some) Statistical formulation of the regression model Assessing the regression model Testing the regression coefficients
Econ 3790: Business and Economic Statistics. Instructor: Yogesh Uppal
 Econ 3790: Business and Economic Statistics Instructor: Yogesh Uppal Email: yuppal@ysu.edu Chapter 13, Part A: Analysis of Variance and Experimental Design Introduction to Analysis of Variance Analysis
CHAPTER 4 Analysis of Variance. One-way ANOVA Two-way ANOVA i) Two way ANOVA without replication ii) Two way ANOVA with replication
 Two way ANOVA without replication ii) Two way ANOVA with replication") CHAPTER 4 Analysis of Variance One-way ANOVA Two-way ANOVA i) Two way ANOVA without replication ii) Two way ANOVA with replication 1 Introduction In this chapter, expand the idea of hypothesis tests. We
CHAPTER 4 Analysis of Variance One-way ANOVA Two-way ANOVA i) Two way ANOVA without replication ii) Two way ANOVA with replication 1 Introduction In this chapter, expand the idea of hypothesis tests. We
CHI SQUARE ANALYSIS 8/18/2011 HYPOTHESIS TESTS SO FAR PARAMETRIC VS. NON-PARAMETRIC
 CHI SQUARE ANALYSIS I N T R O D U C T I O N T O N O N - P A R A M E T R I C A N A L Y S E S HYPOTHESIS TESTS SO FAR We ve discussed One-sample t-test Dependent Sample t-tests Independent Samples t-tests
STAT Chapter 10: Analysis of Variance
 STAT 515 -- Chapter 10: Analysis of Variance Designed Experiment A study in which the researcher controls the levels of one or more variables to determine their effect on the variable of interest (called
Categorical Predictor Variables
 Categorical Predictor Variables We often wish to use categorical (or qualitative) variables as covariates in a regression model. For binary variables (taking on only 2 values, e.g. sex), it is relatively
Lecture 7: Hypothesis Testing and ANOVA
 Lecture 7: Hypothesis Testing and ANOVA Goals Overview of key elements of hypothesis testing Review of common one and two sample tests Introduction to ANOVA Hypothesis Testing The intent of hypothesis
Statistics Introductory Correlation
 Statistics Introductory Correlation Session 10 oscardavid.barrerarodriguez@sciencespo.fr April 9, 2018 Outline 1 Statistics are not used only to describe central tendency and variability for a single variable.
Variance Decomposition and Goodness of Fit
 Variance Decomposition and Goodness of Fit 1. Example: Monthly Earnings and Years of Education In this tutorial, we will focus on an example that explores the relationship between total monthly earnings
Analysis of Variance. Read Chapter 14 and Sections to review one-way ANOVA.
 Analysis of Variance Read Chapter 14 and Sections 15.1-15.2 to review one-way ANOVA. Design of an experiment the process of planning an experiment to insure that an appropriate analysis is possible. Some
The legacy of Sir Ronald A. Fisher. Fisher s three fundamental principles: local control, replication, and randomization.
 1 Chapter 1: Research Design Principles The legacy of Sir Ronald A. Fisher. Fisher s three fundamental principles: local control, replication, and randomization. 2 Chapter 2: Completely Randomized Design
Analysis of Variance: Part 1
 Analysis of Variance: Part 1 Oneway ANOVA When there are more than two means Each time two means are compared the probability (Type I error) =α. When there are more than two means Each time two means are
STAT 115:Experimental Designs
 STAT 115:Experimental Designs Josefina V. Almeda 2013 Multisample inference: Analysis of Variance 1 Learning Objectives 1. Describe Analysis of Variance (ANOVA) 2. Explain the Rationale of ANOVA 3. Compare
Chap The McGraw-Hill Companies, Inc. All rights reserved.
 11 pter11 Chap Analysis of Variance Overview of ANOVA Multiple Comparisons Tests for Homogeneity of Variances Two-Factor ANOVA Without Replication General Linear Model Experimental Design: An Overview
22s:152 Applied Linear Regression. Take random samples from each of m populations.
 22s:152 Applied Linear Regression Chapter 8: ANOVA NOTE: We will meet in the lab on Monday October 10. One-way ANOVA Focuses on testing for differences among group means. Take random samples from each
Lecture 6 Multiple Linear Regression, cont.
 Lecture 6 Multiple Linear Regression, cont. BIOST 515 January 22, 2004 BIOST 515, Lecture 6 Testing general linear hypotheses Suppose we are interested in testing linear combinations of the regression
STA441: Spring Multiple Regression. This slide show is a free open source document. See the last slide for copyright information.
 STA441: Spring 2018 Multiple Regression This slide show is a free open source document. See the last slide for copyright information. 1 Least Squares Plane 2 Statistical MODEL There are p-1 explanatory
Ch 2: Simple Linear Regression
 Ch 2: Simple Linear Regression 1. Simple Linear Regression Model A simple regression model with a single regressor x is y = β 0 + β 1 x + ɛ, where we assume that the error ɛ is independent random component
Much of the material we will be covering for a while has to do with designing an experimental study that concerns some phenomenon of interest.
 Experimental Design: Much of the material we will be covering for a while has to do with designing an experimental study that concerns some phenomenon of interest We wish to use our subjects in the best
22s:152 Applied Linear Regression. There are a couple commonly used models for a one-way ANOVA with m groups. Chapter 8: ANOVA
 22s:152 Applied Linear Regression Chapter 8: ANOVA NOTE: We will meet in the lab on Monday October 10. One-way ANOVA Focuses on testing for differences among group means. Take random samples from each
Predictive Analytics : QM901.1x Prof U Dinesh Kumar, IIMB. All Rights Reserved, Indian Institute of Management Bangalore
 What is Multiple Linear Regression Several independent variables may influence the change in response variable we are trying to study. When several independent variables are included in the equation, the
16.3 One-Way ANOVA: The Procedure
 16.3 One-Way ANOVA: The Procedure Tom Lewis Fall Term 2009 Tom Lewis () 16.3 One-Way ANOVA: The Procedure Fall Term 2009 1 / 10 Outline 1 The background 2 Computing formulas 3 The ANOVA Identity 4 Tom
20.0 Experimental Design
 20.0 Experimental Design Answer Questions 1 Philosophy One-Way ANOVA Egg Sample Multiple Comparisons 20.1 Philosophy Experiments are often expensive and/or dangerous. One wants to use good techniques that
Finding Relationships Among Variables
 Finding Relationships Among Variables BUS 230: Business and Economic Research and Communication 1 Goals Specific goals: Re-familiarize ourselves with basic statistics ideas: sampling distributions, hypothesis
Variance Decomposition in Regression James M. Murray, Ph.D. University of Wisconsin - La Crosse Updated: October 04, 2017
 Variance Decomposition in Regression James M. Murray, Ph.D. University of Wisconsin - La Crosse Updated: October 04, 2017 PDF file location: http://www.murraylax.org/rtutorials/regression_anovatable.pdf
Chapter 10: Analysis of variance (ANOVA)
") Chapter 10: Analysis of variance (ANOVA) ANOVA (Analysis of variance) is a collection of techniques for dealing with more general experiments than the previous one-sample or two-sample tests. We first
Chapter 10: Analysis of variance (ANOVA) ANOVA (Analysis of variance) is a collection of techniques for dealing with more general experiments than the previous one-sample or two-sample tests. We first
Textbook Examples of. SPSS Procedure
 Textbook s of IBM SPSS Procedures Each SPSS procedure listed below has its own section in the textbook. These sections include a purpose statement that describes the statistical test, identification of
Wolf River. Lecture 15 - ANOVA. Exploratory analysis. Wolf River - Data. Sta102 / BME102. October 22, 2014
 Wolf River Lecture 15 - Sta102 / BME102 Colin Rundel October 22, 2014 The Wolf River in Tennessee flows past an abandoned site once used by the pesticide industry for dumping wastes, including chlordane
Correlation and the Analysis of Variance Approach to Simple Linear Regression
 Correlation and the Analysis of Variance Approach to Simple Linear Regression Biometry 755 Spring 2009 Correlation and the Analysis of Variance Approach to Simple Linear Regression p. 1/35 Correlation
Chapter 11 - Lecture 1 Single Factor ANOVA
 April 5, 2013 Chapter 9 : hypothesis testing for one population mean. Chapter 10: hypothesis testing for two population means. What comes next? Chapter 9 : hypothesis testing for one population mean. Chapter
Sleep data, two drugs Ch13.xls
 Model Based Statistics in Biology. Part IV. The General Linear Mixed Model.. Chapter 13.3 Fixed*Random Effects (Paired t-test) ReCap. Part I (Chapters 1,2,3,4), Part II (Ch 5, 6, 7) ReCap Part III (Ch
Parametric versus Nonparametric Statistics-when to use them and which is more powerful? Dr Mahmoud Alhussami
 Parametric versus Nonparametric Statistics-when to use them and which is more powerful? Dr Mahmoud Alhussami Parametric Assumptions The observations must be independent. Dependent variable should be continuous
Inferences for Regression
 Inferences for Regression An Example: Body Fat and Waist Size Looking at the relationship between % body fat and waist size (in inches). Here is a scatterplot of our data set: Remembering Regression In
1 Introduction to One-way ANOVA
 Review Source: Chapter 10 - Analysis of Variance (ANOVA). Example Data Source: Example problem 10.1 (dataset: exp10-1.mtw) Link to Data: http://www.auburn.edu/~carpedm/courses/stat3610/textbookdata/minitab/
Wolf River. Lecture 15 - ANOVA. Exploratory analysis. Wolf River - Data. Sta102 / BME102. October 26, 2015
 Wolf River Lecture 15 - Sta102 / BME102 Colin Rundel October 26, 2015 The Wolf River in Tennessee flows past an abandoned site once used by the pesticide industry for dumping wastes, including chlordane
One-Way Analysis of Variance (ANOVA) Paul K. Strode, Ph.D.
 Paul K. Strode, Ph.D.") One-Way Analysis of Variance (ANOVA) Paul K. Strode, Ph.D. Purpose While the T-test is useful to compare the means of two samples, many biology experiments involve the parallel measurement of three or
One-Way Analysis of Variance (ANOVA) Paul K. Strode, Ph.D. Purpose While the T-test is useful to compare the means of two samples, many biology experiments involve the parallel measurement of three or
The One-Way Repeated-Measures ANOVA. (For Within-Subjects Designs)
") The One-Way Repeated-Measures ANOVA (For Within-Subjects Designs) Logic of the Repeated-Measures ANOVA The repeated-measures ANOVA extends the analysis of variance to research situations using repeated-measures
The One-Way Repeated-Measures ANOVA (For Within-Subjects Designs) Logic of the Repeated-Measures ANOVA The repeated-measures ANOVA extends the analysis of variance to research situations using repeated-measures
ANOVA: Analysis of Variation
 ANOVA: Analysis of Variation The basic ANOVA situation Two variables: 1 Categorical, 1 Quantitative Main Question: Do the (means of) the quantitative variables depend on which group (given by categorical
Inference for the Regression Coefficient
 Inference for the Regression Coefficient Recall, b 0 and b 1 are the estimates of the slope β 1 and intercept β 0 of population regression line. We can shows that b 0 and b 1 are the unbiased estimates
Inference for Regression Simple Linear Regression
 Inference for Regression Simple Linear Regression IPS Chapter 10.1 2009 W.H. Freeman and Company Objectives (IPS Chapter 10.1) Simple linear regression p Statistical model for linear regression p Estimating
Chapter 4. Regression Models. Learning Objectives
 Chapter 4 Regression Models To accompany Quantitative Analysis for Management, Eleventh Edition, by Render, Stair, and Hanna Power Point slides created by Brian Peterson Learning Objectives After completing
Chapter 4: Regression Models
 Sales volume of company 1 Textbook: pp. 129-164 Chapter 4: Regression Models Money spent on advertising 2 Learning Objectives After completing this chapter, students will be able to: Identify variables,
Hypothesis Testing hypothesis testing approach
 Hypothesis Testing In this case, we d be trying to form an inference about that neighborhood: Do people there shop more often those people who are members of the larger population To ascertain this, we
Sampling distribution of t. 2. Sampling distribution of t. 3. Example: Gas mileage investigation. II. Inferential Statistics (8) t =
 t =") 2. The distribution of t values that would be obtained if a value of t were calculated for each sample mean for all possible random of a given size from a population _ t ratio: (X - µ hyp ) t s x The result
2. The distribution of t values that would be obtained if a value of t were calculated for each sample mean for all possible random of a given size from a population _ t ratio: (X - µ hyp ) t s x The result
CHAPTER 17 CHI-SQUARE AND OTHER NONPARAMETRIC TESTS FROM: PAGANO, R. R. (2007)
") FROM: PAGANO, R. R. (007) I. INTRODUCTION: DISTINCTION BETWEEN PARAMETRIC AND NON-PARAMETRIC TESTS Statistical inference tests are often classified as to whether they are parametric or nonparametric Parameter
FROM: PAGANO, R. R. (007) I. INTRODUCTION: DISTINCTION BETWEEN PARAMETRIC AND NON-PARAMETRIC TESTS Statistical inference tests are often classified as to whether they are parametric or nonparametric Parameter
Chapter 14 Student Lecture Notes Department of Quantitative Methods & Information Systems. Business Statistics. Chapter 14 Multiple Regression
 Chapter 14 Student Lecture Notes 14-1 Department of Quantitative Methods & Information Systems Business Statistics Chapter 14 Multiple Regression QMIS 0 Dr. Mohammad Zainal Chapter Goals After completing
One-Way Analysis of Variance. With regression, we related two quantitative, typically continuous variables.
 One-Way Analysis of Variance With regression, we related two quantitative, typically continuous variables. Often we wish to relate a quantitative response variable with a qualitative (or simply discrete)
Notes for Week 13 Analysis of Variance (ANOVA) continued WEEK 13 page 1
 continued WEEK 13 page 1") Notes for Wee 13 Analysis of Variance (ANOVA) continued WEEK 13 page 1 Exam 3 is on Friday May 1. A part of one of the exam problems is on Predictiontervals : When randomly sampling from a normal population
Notes for Wee 13 Analysis of Variance (ANOVA) continued WEEK 13 page 1 Exam 3 is on Friday May 1. A part of one of the exam problems is on Predictiontervals : When randomly sampling from a normal population
McGill University. Faculty of Science MATH 204 PRINCIPLES OF STATISTICS II. Final Examination
 McGill University Faculty of Science MATH 204 PRINCIPLES OF STATISTICS II Final Examination Date: 20th April 2009 Time: 9am-2pm Examiner: Dr David A Stephens Associate Examiner: Dr Russell Steele Please
In a one-way ANOVA, the total sums of squares among observations is partitioned into two components: Sums of squares represent:
 Activity #10: AxS ANOVA (Repeated subjects design) Resources: optimism.sav So far in MATH 300 and 301, we have studied the following hypothesis testing procedures: 1) Binomial test, sign-test, Fisher s
Correlation. A statistics method to measure the relationship between two variables. Three characteristics
 Correlation Correlation A statistics method to measure the relationship between two variables Three characteristics Direction of the relationship Form of the relationship Strength/Consistency Direction
Announcements. Unit 4: Inference for numerical variables Lecture 4: ANOVA. Data. Statistics 104
 Announcements Announcements Unit 4: Inference for numerical variables Lecture 4: Statistics 104 Go to Sakai s to pick a time for a one-on-one meeting. Mine Çetinkaya-Rundel June 6, 2013 Statistics 104
Draft Proof - Do not copy, post, or distribute. Chapter Learning Objectives REGRESSION AND CORRELATION THE SCATTER DIAGRAM
 1 REGRESSION AND CORRELATION As we learned in Chapter 9 ( Bivariate Tables ), the differential access to the Internet is real and persistent. Celeste Campos-Castillo s (015) research confirmed the impact
STAT 350 Final (new Material) Review Problems Key Spring 2016
 Review Problems Key Spring 2016") 1. The editor of a statistics textbook would like to plan for the next edition. A key variable is the number of pages that will be in the final version. Text files are prepared by the authors using LaTeX,
1. The editor of a statistics textbook would like to plan for the next edition. A key variable is the number of pages that will be in the final version. Text files are prepared by the authors using LaTeX,
One-way ANOVA. Experimental Design. One-way ANOVA
 Method to compare more than two samples simultaneously without inflating Type I Error rate (α) Simplicity Few assumptions Adequate for highly complex hypothesis testing 09/30/12 1 Outline of this class
The Multiple Regression Model
 Multiple Regression The Multiple Regression Model Idea: Examine the linear relationship between 1 dependent (Y) & or more independent variables (X i ) Multiple Regression Model with k Independent Variables:
Lecture 9: Linear Regression
 Lecture 9: Linear Regression Goals Develop basic concepts of linear regression from a probabilistic framework Estimating parameters and hypothesis testing with linear models Linear regression in R Regression
1-Way ANOVA MATH 143. Spring Department of Mathematics and Statistics Calvin College
 1-Way ANOVA MATH 143 Department of Mathematics and Statistics Calvin College Spring 2010 The basic ANOVA situation Two variables: 1 Categorical, 1 Quantitative Main Question: Do the (means of) the quantitative
Glossary. The ISI glossary of statistical terms provides definitions in a number of different languages:
 Glossary The ISI glossary of statistical terms provides definitions in a number of different languages: http://isi.cbs.nl/glossary/index.htm Adjusted r 2 Adjusted R squared measures the proportion of the
Correlation 1. December 4, HMS, 2017, v1.1
 Correlation 1 December 4, 2017 1 HMS, 2017, v1.1 Chapter References Diez: Chapter 7 Navidi, Chapter 7 I don t expect you to learn the proofs what will follow. Chapter References 2 Correlation The sample
Simple Linear Regression: One Qualitative IV
 Simple Linear Regression: One Qualitative IV 1. Purpose As noted before regression is used both to explain and predict variation in DVs, and adding to the equation categorical variables extends regression
Statistics and Quantitative Analysis U4320
 Statistics and Quantitative Analysis U3 Lecture 13: Explaining Variation Prof. Sharyn O Halloran Explaining Variation: Adjusted R (cont) Definition of Adjusted R So we'd like a measure like R, but one
A discussion on multiple regression models
 A discussion on multiple regression models In our previous discussion of simple linear regression, we focused on a model in which one independent or explanatory variable X was used to predict the value
Exam details. Final Review Session. Things to Review
 Exam details Final Review Session Short answer, similar to book problems Formulae and tables will be given You CAN use a calculator Date and Time: Dec. 7, 006, 1-1:30 pm Location: Osborne Centre, Unit
" M A #M B. Standard deviation of the population (Greek lowercase letter sigma) σ 2
 σ 2") Notation and Equations for Final Exam Symbol Definition X The variable we measure in a scientific study n The size of the sample N The size of the population M The mean of the sample µ The mean of the
Notation and Equations for Final Exam Symbol Definition X The variable we measure in a scientific study n The size of the sample N The size of the population M The mean of the sample µ The mean of the
Regression Analysis. BUS 735: Business Decision Making and Research. Learn how to detect relationships between ordinal and categorical variables.
 Regression Analysis BUS 735: Business Decision Making and Research 1 Goals of this section Specific goals Learn how to detect relationships between ordinal and categorical variables. Learn how to estimate
Chapter 10. Design of Experiments and Analysis of Variance
 Chapter 10 Design of Experiments and Analysis of Variance Elements of a Designed Experiment Response variable Also called the dependent variable Factors (quantitative and qualitative) Also called the independent
Week 14 Comparing k(> 2) Populations
 Populations") Week 14 Comparing k(> 2) Populations Week 14 Objectives Methods associated with testing for the equality of k(> 2) means or proportions are presented. Post-testing concepts and analysis are introduced.
Week 14 Comparing k(> 2) Populations Week 14 Objectives Methods associated with testing for the equality of k(> 2) means or proportions are presented. Post-testing concepts and analysis are introduced.
PubH 7405: REGRESSION ANALYSIS. MLR: INFERENCES, Part I
 PubH 7405: REGRESSION ANALYSIS MLR: INFERENCES, Part I TESTING HYPOTHESES Once we have fitted a multiple linear regression model and obtained estimates for the various parameters of interest, we want to
DETAILED CONTENTS PART I INTRODUCTION AND DESCRIPTIVE STATISTICS. 1. Introduction to Statistics
 DETAILED CONTENTS About the Author Preface to the Instructor To the Student How to Use SPSS With This Book PART I INTRODUCTION AND DESCRIPTIVE STATISTICS 1. Introduction to Statistics 1.1 Descriptive and
Analysis of Variance
 Statistical Techniques II EXST7015 Analysis of Variance 15a_ANOVA_Introduction 1 Design The simplest model for Analysis of Variance (ANOVA) is the CRD, the Completely Randomized Design This model is also
STAT 135 Lab 9 Multiple Testing, One-Way ANOVA and Kruskal-Wallis
 STAT 135 Lab 9 Multiple Testing, One-Way ANOVA and Kruskal-Wallis Rebecca Barter April 6, 2015 Multiple Testing Multiple Testing Recall that when we were doing two sample t-tests, we were testing the equality
DESAIN EKSPERIMEN Analysis of Variances (ANOVA) Semester Genap 2017/2018 Jurusan Teknik Industri Universitas Brawijaya
 Semester Genap 2017/2018 Jurusan Teknik Industri Universitas Brawijaya") DESAIN EKSPERIMEN Analysis of Variances (ANOVA) Semester Jurusan Teknik Industri Universitas Brawijaya Outline Introduction The Analysis of Variance Models for the Data Post-ANOVA Comparison of Means Sample
DESAIN EKSPERIMEN Analysis of Variances (ANOVA) Semester Jurusan Teknik Industri Universitas Brawijaya Outline Introduction The Analysis of Variance Models for the Data Post-ANOVA Comparison of Means Sample
Multiple Linear Regression
 Multiple Linear Regression ST 430/514 Recall: a regression model describes how a dependent variable (or response) Y is affected, on average, by one or more independent variables (or factors, or covariates).
Basic Business Statistics, 10/e
 Chapter 4 4- Basic Business Statistics th Edition Chapter 4 Introduction to Multiple Regression Basic Business Statistics, e 9 Prentice-Hall, Inc. Chap 4- Learning Objectives In this chapter, you learn:
Statistics for Managers Using Microsoft Excel Chapter 10 ANOVA and Other C-Sample Tests With Numerical Data
 Statistics for Managers Using Microsoft Excel Chapter 10 ANOVA and Other C-Sample Tests With Numerical Data 1999 Prentice-Hall, Inc. Chap. 10-1 Chapter Topics The Completely Randomized Model: One-Factor
Unit 27 One-Way Analysis of Variance
 Unit 27 One-Way Analysis of Variance Objectives: To perform the hypothesis test in a one-way analysis of variance for comparing more than two population means Recall that a two sample t test is applied
ANOVA: Analysis of Variance
 ANOVA: Analysis of Variance Marc H. Mehlman marcmehlman@yahoo.com University of New Haven The analysis of variance is (not a mathematical theorem but) a simple method of arranging arithmetical facts so
Assignment #7. Chapter 12: 18, 24 Chapter 13: 28. Due next Friday Nov. 20 th by 2pm in your TA s homework box
 Assignment #7 Chapter 12: 18, 24 Chapter 13: 28 Due next Friday Nov. 20 th by 2pm in your TA s homework box Lab Report Posted on web-site Dates Rough draft due to TAs homework box on Monday Nov. 16 th
Analysis of Variance
 Analysis of Variance Chapter 12 McGraw-Hill/Irwin Copyright 2013 by The McGraw-Hill Companies, Inc. All rights reserved. Learning Objectives LO 12-1 List the characteristics of the F distribution and locate
ANOVA: Analysis of Variance
 ANOVA: Analysis of Variance Marc H. Mehlman marcmehlman@yahoo.com University of New Haven The analysis of variance is (not a mathematical theorem but) a simple method of arranging arithmetical facts so
Analysis of Variance. ภาว น ศ ร ประภาน ก ล คณะเศรษฐศาสตร มหาว ทยาล ยธรรมศาสตร
 Analysis of Variance ภาว น ศ ร ประภาน ก ล คณะเศรษฐศาสตร มหาว ทยาล ยธรรมศาสตร pawin@econ.tu.ac.th Outline Introduction One Factor Analysis of Variance Two Factor Analysis of Variance ANCOVA MANOVA Introduction
Can you tell the relationship between students SAT scores and their college grades?
 Correlation One Challenge Can you tell the relationship between students SAT scores and their college grades? A: The higher SAT scores are, the better GPA may be. B: The higher SAT scores are, the lower
What Is ANOVA? Comparing Groups. One-way ANOVA. One way ANOVA (the F ratio test)
") What Is ANOVA? One-way ANOVA ANOVA ANalysis Of VAriance ANOVA compares the means of several groups. The groups are sometimes called "treatments" First textbook presentation in 95. Group Group σ µ µ σ µ
What Is ANOVA? One-way ANOVA ANOVA ANalysis Of VAriance ANOVA compares the means of several groups. The groups are sometimes called "treatments" First textbook presentation in 95. Group Group σ µ µ σ µ
ANOVA (Analysis of Variance) output RLS 11/20/2016
 output RLS 11/20/2016") ANOVA (Analysis of Variance) output RLS 11/20/2016 1. Analysis of Variance (ANOVA) The goal of ANOVA is to see if the variation in the data can explain enough to see if there are differences in the means.
ANOVA (Analysis of Variance) output RLS 11/20/2016 1. Analysis of Variance (ANOVA) The goal of ANOVA is to see if the variation in the data can explain enough to see if there are differences in the means.
ST430 Exam 2 Solutions
 ST430 Exam 2 Solutions Date: November 9, 2015 Name: Guideline: You may use one-page (front and back of a standard A4 paper) of notes. No laptop or textbook are permitted but you may use a calculator. Giving
Analysis of variance
 Analysis of variance Tron Anders Moger 3.0.007 Comparing more than two groups Up to now we have studied situations with One observation per subject One group Two groups Two or more observations per subject
LECTURE 6. Introduction to Econometrics. Hypothesis testing & Goodness of fit
 LECTURE 6 Introduction to Econometrics Hypothesis testing & Goodness of fit October 25, 2016 1 / 23 ON TODAY S LECTURE We will explain how multiple hypotheses are tested in a regression model We will define
Workshop Research Methods and Statistical Analysis
 Workshop Research Methods and Statistical Analysis Session 2 Data Analysis Sandra Poeschl 08.04.2013 Page 1 Research process Research Question State of Research / Theoretical Background Design Data Collection
Types of Statistical Tests DR. MIKE MARRAPODI
 Types of Statistical Tests DR. MIKE MARRAPODI Tests t tests ANOVA Correlation Regression Multivariate Techniques Non-parametric t tests One sample t test Independent t test Paired sample t test One sample
Regression Models. Chapter 4. Introduction. Introduction. Introduction
 Chapter 4 Regression Models Quantitative Analysis for Management, Tenth Edition, by Render, Stair, and Hanna 008 Prentice-Hall, Inc. Introduction Regression analysis is a very valuable tool for a manager
Comparing Several Means: ANOVA
 Comparing Several Means: ANOVA Understand the basic principles of ANOVA Why it is done? What it tells us? Theory of one way independent ANOVA Following up an ANOVA: Planned contrasts/comparisons Choosing
Introduction to Statistical Inference Lecture 10: ANOVA, Kruskal-Wallis Test
 Introduction to Statistical Inference Lecture 10: ANOVA, Kruskal-Wallis Test la Contents The two sample t-test generalizes into Analysis of Variance. In analysis of variance ANOVA the population consists
Department of Economics. Business Statistics. Chapter 12 Chi-square test of independence & Analysis of Variance ECON 509. Dr.
 Department of Economics Business Statistics Chapter 1 Chi-square test of independence & Analysis of Variance ECON 509 Dr. Mohammad Zainal Chapter Goals After completing this chapter, you should be able
Review of the General Linear Model
 Review of the General Linear Model EPSY 905: Multivariate Analysis Online Lecture #2 Learning Objectives Types of distributions: Ø Conditional distributions The General Linear Model Ø Regression Ø Analysis
One-Way Analysis of Variance (ANOVA)
") 1 One-Way Analysis of Variance (ANOVA) One-Way Analysis of Variance (ANOVA) is a method for comparing the means of a populations. This kind of problem arises in two different settings 1. When a independent
1 One-Way Analysis of Variance (ANOVA) One-Way Analysis of Variance (ANOVA) is a method for comparing the means of a populations. This kind of problem arises in two different settings 1. When a independent
10 One-way analysis of variance (ANOVA)
") 10 One-way analysis of variance (ANOVA) A factor is in an experiment; its values are. A one-way analysis of variance (ANOVA) tests H 0 : µ 1 = = µ I, where I is the for one factor, against H A : at least
10 One-way analysis of variance (ANOVA) A factor is in an experiment; its values are. A one-way analysis of variance (ANOVA) tests H 0 : µ 1 = = µ I, where I is the for one factor, against H A : at least
Linear regression. We have that the estimated mean in linear regression is. ˆµ Y X=x = ˆβ 0 + ˆβ 1 x. The standard error of ˆµ Y X=x is.
 Linear regression We have that the estimated mean in linear regression is The standard error of ˆµ Y X=x is where x = 1 n s.e.(ˆµ Y X=x ) = σ ˆµ Y X=x = ˆβ 0 + ˆβ 1 x. 1 n + (x x)2 i (x i x) 2 i x i. The