Analysis of Variance
|
|
|
- Bryce Simon
- 5 years ago
- Views:
Transcription

1 Analysis of Variance Chapter 12 McGraw-Hill/Irwin Copyright 2013 by The McGraw-Hill Companies, Inc. All rights reserved.
2 Learning Objectives LO 12-1 List the characteristics of the F distribution and locate values in an F table. LO 12-2 Perform a test of hypothesis to determine whether the variances of two populations are equal. LO 12-3 Describe the ANOVA approach for testing differences in sample means. LO 12-4 Organize data into appropriate ANOVA tables for analysis. LO 12-5 Conduct a test of hypothesis among three or more treatment means and describe the results. LO 12-6 Develop confidence intervals for the difference in treatment means and interpret the results. 12-2
3 The F Distribution LO 12-1 List the characteristics of the F distribution and locate values in an F table. It was named to honor Sir Ronald Fisher, one of the founders of modern-day statistics. Uses of the F distribution Test whether two-samples are from populations having equal variances. Compare several population means simultaneously. The test is called analysis of variance (ANOVA). In both of these situations, the populations must follow a normal distribution, and the data must be at least interval-scale. 12-3

4 LO 12-1 Characteristics of F Distribution 1. There is a family of F distributions. A member of the family is determined by two parameters: d.f. in the numerator and d.f. in the denominator. 2. The distribution is continuous, positive, and is positively skewed. 3. Asymptotic. 12-4
5 LO 12-2 Perform a test of hypothesis to determine whether the variances of two populations are equal. Comparing Two Population Variances The F distribution is used to test the hypothesis that the variance of one normal population equals the variance of another normal population. Examples: Two Barth shearing machines are set to produce steel bars of the same length. The bars, therefore, should have the same mean length. We want to ensure that in addition to having the same mean length they also have similar variation. The mean rate of return on two types of common stock may be the same, but there may be more variation in the rate of return in one than the other. A sample of 10 technology and 10 utility stocks shows the same mean rate of return, but there is likely more variation in the Internet stocks. A study by the marketing department for a large newspaper found that men and women spent about the same amount of time per day reading the paper. However, the same report indicated there was nearly twice as much variation in time spent per day among the men than the women. 12-5

6 LO 12-2 Test for Equal Variances 12-6


7 LO 12-2 Test for Equal Variances Example Lammers Limos offers limousine service from the city hall in Toledo, Ohio, to Metro Airport in Detroit. The president of the company is considering two routes. One is via U.S. 25 and the other via I-75. He wants to study the time it takes to drive to the airport using each route and then compare the results. He collected the following sample data, which is reported in minutes. Using the.10 significance level, is there a difference in the variation in the driving times for the two routes? 12-7
8 LO 12-2 Test for Equal Variances Example Step 1: The hypotheses are: H 0 : σ 1 2 = σ 2 2 H 1 : σ 1 2 σ 2 2 Step 2: The significance level is Step 3: The test statistic is the F distribution. 12-8

9 LO 12-2 Test for Equal Variances Example Step 4: State the decision rule. Reject H 0 if computed F > critical F 12-9
10 LO 12-2 Test for Equal Variances Example Step 5: Compute the sample standard deviations (manual method)
.")
11 LO 12-2 Test for Equal Variances Example Step 5: Compute the sample standard deviations (using Excel). =STDEV(B3:B9) =STDEV(C3:C10) 12-11
12 LO 12-2 Test for Equal Variances Example Step 5: Compute the value of F
13 LO 12-2 Test for Equal Variances Example Step 6: Apply the decision rule: Reject H 0 if computed F > critical F F 5 6 The decision is to reject the null hypothesis, because the computed F value (4.23) is larger than the critical value (3.87). We conclude that there is a difference in the variation of the travel times along the two routes


14 LO 12-2 Test for Equal Variances Excel Example Data > Data Analysis > F-Test Two-Sample for Variances 12-14
15 LO 12-3 Describe the ANOVA approach for testing differences in sample means. Comparing Means of Two or More Populations The F distribution is also used for testing whether two or more sample means came from the same or equal populations. Assumptions: The sampled populations follow the normal distribution. The populations have equal standard deviations. The samples are randomly selected and are independent

16 LO 12-5 Conduct a test of hypothesis among three or more treatment means and describe the results. Comparing Means of Two or More Populations The null hypothesis is that the population means are all the same. The alternative hypothesis is that at least one of the means is different. The test statistic is the F distribution. The hypothesis setup and decision rule: H 0 : µ 1 = µ 2 = = µ k H 1 : The means are not all equal Reject H 0 if computed F > critical F significance level d.f. numerator = k 1 d.f. denominator = n k 12-16
17 LO 12-5 Analysis of Variance F-statistic If there are k populations being sampled, the numerator degrees of freedom is k 1. If there are a total of n observations, the denominator degrees of freedom is n k. The test statistic is computed by: F SST SSE k n 1 k 12-17


18 Comparing Means of Two or More Populations Illustrative Example LO 12-5 Joyce Kuhlman manages a regional financial center. She wishes to compare the productivity, as measured by the number of customers served, among three employees. Four days are randomly selected and the number of customers served by each employee is recorded

19 Comparing Means of Two or More Populations Example LO 12-5 Recently a group of four major carriers joined in hiring Brunner Marketing Research, Inc., to survey recent passengers regarding their level of satisfaction with a recent flight. The survey included questions on ticketing, boarding, in-flight service, baggage handling, pilot communication, and so forth. Twenty-five questions offered a range of possible answers: excellent, good, fair, or poor. A response of excellent was given a score of 4, good a 3, fair a 2, and poor a 1. These responses were then totaled, so the total score was an indication of the satisfaction with the flight. Brunner Marketing Research, Inc., randomly selected and surveyed passengers from the four airlines. Is there a difference in the mean satisfaction level among the four airlines? Use the.01 significance level
20 Comparing Means of Two or More Populations Example LO 12-5 Step 1: State the null and alternate hypotheses. H 0 : µ N = µ W = µ P = µ B H 1 : The means are not all equal Reject H 0 if computed F > critical F Step 2: State the level of significance. The.01 significance level is stated in the problem
21 Comparing Means of Two or More Populations Example LO 12-5 Step 3: Find the appropriate test statistic. Because we are comparing means of more than two groups, use the F-statistic. Step 4: State the decision rule. Reject H 0 if computed F > critical F Parameters for Critical F significance level = 0.01 d.f. numerator = k 1 = 4 1 = 3 d.f. denominator = n k = 22 4 =

22 Comparing Means of Two or More Populations Example LO


23 Comparing Means of Two or More Populations Example LO 12-4 Step 5: Compute the value of F and make a decision


24 Comparing Means of Two or More Populations Example LO


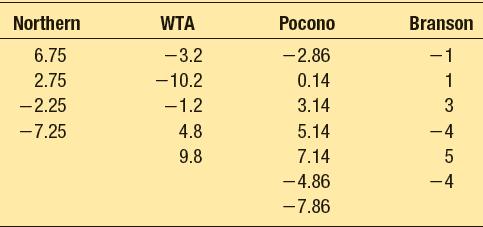
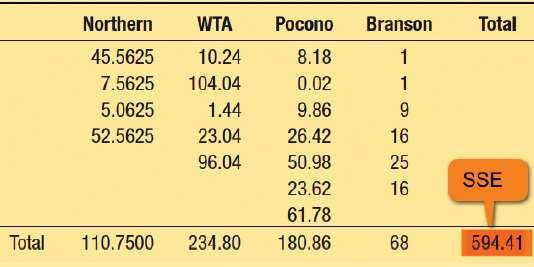
25 LO 12-4 Computing SS Total and SSE 12-25
26 LO 12-4 Computing SST 12-26
27 LO 12-4 Setting Up the ANOVA Table Decision Rule: Reject H 0 if computed F > critical F Computed F = 8.99 Critical F = 5.09 Conclude: Reject the null hypothesis (H 0 : means are all equal) 12-27

28 LO 12-5 Excel Data > Data Analysis > ANOVA: Single Factor 12-28

29 LO 12-6 Develop confidence intervals for the difference in treatment means and interpret the results. Confidence Interval for the Difference Between Two Means When we reject the null hypothesis that the means are equal, we may want to know which treatment means differ. One of the simplest procedures is through the use of confidence intervals. 1 1 X1 X 2 t MSE n n 1 2 Where: 12-29
30 LO 12-6 Confidence Interval for the Difference Between Two Means Example From the previous example, develop a 95% confidence interval for the difference in the mean ratings between Northern and Branson. Can we conclude that there is a difference between the two airlines ratings? 12-30
31 LO 12-6 Confidence Interval for the Difference Between Two Means Example ( x N x ) t ( ) (10.46,26.04) B MSE 1 1 n N n B The 95% confidence interval ranges from up to Conclusion: Both endpoints are positive. Interpretation: Conclude these treatment means differ significantly

32 LO 12-6 Finding t Value for 95% Confidence Level, d.f. =
33 Confidence Interval for the Difference Between Two Means Minitab Output LO 12-6 From the previous example, develop a 95% confidence interval for the difference in the mean between American and US Airways. Can we conclude that there is a difference between the two airlines ratings? Approximate results can also be obtained directly from the Minitab output
Hypothesis Tests and Estimation for Population Variances. Copyright 2014 Pearson Education, Inc.
 Hypothesis Tests and Estimation for Population Variances 11-1 Learning Outcomes Outcome 1. Formulate and carry out hypothesis tests for a single population variance. Outcome 2. Develop and interpret confidence
Inference for the Regression Coefficient
 Inference for the Regression Coefficient Recall, b 0 and b 1 are the estimates of the slope β 1 and intercept β 0 of population regression line. We can shows that b 0 and b 1 are the unbiased estimates
CHAPTER 4 Analysis of Variance. One-way ANOVA Two-way ANOVA i) Two way ANOVA without replication ii) Two way ANOVA with replication
 Two way ANOVA without replication ii) Two way ANOVA with replication") CHAPTER 4 Analysis of Variance One-way ANOVA Two-way ANOVA i) Two way ANOVA without replication ii) Two way ANOVA with replication 1 Introduction In this chapter, expand the idea of hypothesis tests. We
CHAPTER 4 Analysis of Variance One-way ANOVA Two-way ANOVA i) Two way ANOVA without replication ii) Two way ANOVA with replication 1 Introduction In this chapter, expand the idea of hypothesis tests. We
Discrete Probability Distributions
 Discrete Probability Distributions Chapter 6 McGraw-Hill/Irwin Copyright 2012 by The McGraw-Hill Companies, Inc. All rights reserved. LO5 Describe and compute probabilities for a binomial distribution.
Econ 3790: Business and Economic Statistics. Instructor: Yogesh Uppal
 Econ 3790: Business and Economic Statistics Instructor: Yogesh Uppal Email: yuppal@ysu.edu Chapter 13, Part A: Analysis of Variance and Experimental Design Introduction to Analysis of Variance Analysis
Notes for Week 13 Analysis of Variance (ANOVA) continued WEEK 13 page 1
 continued WEEK 13 page 1") Notes for Wee 13 Analysis of Variance (ANOVA) continued WEEK 13 page 1 Exam 3 is on Friday May 1. A part of one of the exam problems is on Predictiontervals : When randomly sampling from a normal population
Notes for Wee 13 Analysis of Variance (ANOVA) continued WEEK 13 page 1 Exam 3 is on Friday May 1. A part of one of the exam problems is on Predictiontervals : When randomly sampling from a normal population
Chapter 14 Student Lecture Notes Department of Quantitative Methods & Information Systems. Business Statistics. Chapter 14 Multiple Regression
 Chapter 14 Student Lecture Notes 14-1 Department of Quantitative Methods & Information Systems Business Statistics Chapter 14 Multiple Regression QMIS 0 Dr. Mohammad Zainal Chapter Goals After completing
Introduction to Business Statistics QM 220 Chapter 12
 Department of Quantitative Methods & Information Systems Introduction to Business Statistics QM 220 Chapter 12 Dr. Mohammad Zainal 12.1 The F distribution We already covered this topic in Ch. 10 QM-220,
Inferences for Regression
 Inferences for Regression An Example: Body Fat and Waist Size Looking at the relationship between % body fat and waist size (in inches). Here is a scatterplot of our data set: Remembering Regression In
Basic Business Statistics, 10/e
 Chapter 4 4- Basic Business Statistics th Edition Chapter 4 Introduction to Multiple Regression Basic Business Statistics, e 9 Prentice-Hall, Inc. Chap 4- Learning Objectives In this chapter, you learn:
Department of Economics. Business Statistics. Chapter 12 Chi-square test of independence & Analysis of Variance ECON 509. Dr.
 Department of Economics Business Statistics Chapter 1 Chi-square test of independence & Analysis of Variance ECON 509 Dr. Mohammad Zainal Chapter Goals After completing this chapter, you should be able
Chapter 8 Student Lecture Notes 8-1. Department of Economics. Business Statistics. Chapter 12 Chi-square test of independence & Analysis of Variance
 Chapter 8 Student Lecture Notes 8-1 Department of Economics Business Statistics Chapter 1 Chi-square test of independence & Analysis of Variance ECON 509 Dr. Mohammad Zainal Chapter Goals After completing
Business Statistics. Chapter 14 Introduction to Linear Regression and Correlation Analysis QMIS 220. Dr. Mohammad Zainal
 Department of Quantitative Methods & Information Systems Business Statistics Chapter 14 Introduction to Linear Regression and Correlation Analysis QMIS 220 Dr. Mohammad Zainal Chapter Goals After completing
Chapter 8. Inferences Based on a Two Samples Confidence Intervals and Tests of Hypothesis
 Chapter 8 Inferences Based on a Two Samples Confidence Intervals and Tests of Hypothesis Copyright 2018, 2014, and 2011 Pearson Education, Inc. Slide - 1 Content 1. Identifying the Target Parameter 2.
Statistics for Managers using Microsoft Excel 6 th Edition
 Statistics for Managers using Microsoft Excel 6 th Edition Chapter 13 Simple Linear Regression 13-1 Learning Objectives In this chapter, you learn: How to use regression analysis to predict the value of
Chap The McGraw-Hill Companies, Inc. All rights reserved.
 11 pter11 Chap Analysis of Variance Overview of ANOVA Multiple Comparisons Tests for Homogeneity of Variances Two-Factor ANOVA Without Replication General Linear Model Experimental Design: An Overview
Chapter 4. Regression Models. Learning Objectives
 Chapter 4 Regression Models To accompany Quantitative Analysis for Management, Eleventh Edition, by Render, Stair, and Hanna Power Point slides created by Brian Peterson Learning Objectives After completing
Correlation Analysis
 Simple Regression Correlation Analysis Correlation analysis is used to measure strength of the association (linear relationship) between two variables Correlation is only concerned with strength of the
One-Way Analysis of Variance: A Guide to Testing Differences Between Multiple Groups
 One-Way Analysis of Variance: A Guide to Testing Differences Between Multiple Groups In analysis of variance, the main research question is whether the sample means are from different populations. The
The legacy of Sir Ronald A. Fisher. Fisher s three fundamental principles: local control, replication, and randomization.
 1 Chapter 1: Research Design Principles The legacy of Sir Ronald A. Fisher. Fisher s three fundamental principles: local control, replication, and randomization. 2 Chapter 2: Completely Randomized Design
Analysis of Covariance. The following example illustrates a case where the covariate is affected by the treatments.
 Analysis of Covariance In some experiments, the experimental units (subjects) are nonhomogeneous or there is variation in the experimental conditions that are not due to the treatments. For example, a
Lecture 14. Analysis of Variance * Correlation and Regression. The McGraw-Hill Companies, Inc., 2000
 Lecture 14 Analysis of Variance * Correlation and Regression Outline Analysis of Variance (ANOVA) 11-1 Introduction 11-2 Scatter Plots 11-3 Correlation 11-4 Regression Outline 11-5 Coefficient of Determination
Lecture 14. Outline. Outline. Analysis of Variance * Correlation and Regression Analysis of Variance (ANOVA)
") Outline Lecture 14 Analysis of Variance * Correlation and Regression Analysis of Variance (ANOVA) 11-1 Introduction 11- Scatter Plots 11-3 Correlation 11-4 Regression Outline 11-5 Coefficient of Determination
Outline Lecture 14 Analysis of Variance * Correlation and Regression Analysis of Variance (ANOVA) 11-1 Introduction 11- Scatter Plots 11-3 Correlation 11-4 Regression Outline 11-5 Coefficient of Determination
Ch 13 & 14 - Regression Analysis
 Ch 3 & 4 - Regression Analysis Simple Regression Model I. Multiple Choice:. A simple regression is a regression model that contains a. only one independent variable b. only one dependent variable c. more
Statistics For Economics & Business
 Statistics For Economics & Business Analysis of Variance In this chapter, you learn: Learning Objectives The basic concepts of experimental design How to use one-way analysis of variance to test for differences
Chapter 15: Analysis of Variance
 Chapter 5: Analysis of Variance 5. Introduction In this chapter, we introduced the analysis of variance technique, which deals with problems whose objective is to compare two or more populations of quantitative
Linear Regression and Correlation
 Linear Regression and Correlation Chapter 13 McGraw-Hill/Irwin Copyright 2010 by The McGraw-Hill Companies, Inc. All rights reserved. GOALS 1. Understand and interpret the terms dependent and independent
Discrete Probability Distributions
 Discrete Probability Distributions Chapter 06 McGraw-Hill/Irwin Copyright 2013 by The McGraw-Hill Companies, Inc. All rights reserved. LEARNING OBJECTIVES LO 6-1 Identify the characteristics of a probability
Ch 2: Simple Linear Regression
 Ch 2: Simple Linear Regression 1. Simple Linear Regression Model A simple regression model with a single regressor x is y = β 0 + β 1 x + ɛ, where we assume that the error ɛ is independent random component
Sampling distribution of t. 2. Sampling distribution of t. 3. Example: Gas mileage investigation. II. Inferential Statistics (8) t =
 t =") 2. The distribution of t values that would be obtained if a value of t were calculated for each sample mean for all possible random of a given size from a population _ t ratio: (X - µ hyp ) t s x The result
2. The distribution of t values that would be obtained if a value of t were calculated for each sample mean for all possible random of a given size from a population _ t ratio: (X - µ hyp ) t s x The result
Unit 27 One-Way Analysis of Variance
 Unit 27 One-Way Analysis of Variance Objectives: To perform the hypothesis test in a one-way analysis of variance for comparing more than two population means Recall that a two sample t test is applied
One-way ANOVA. Experimental Design. One-way ANOVA
 Method to compare more than two samples simultaneously without inflating Type I Error rate (α) Simplicity Few assumptions Adequate for highly complex hypothesis testing 09/30/12 1 Outline of this class
16.3 One-Way ANOVA: The Procedure
 16.3 One-Way ANOVA: The Procedure Tom Lewis Fall Term 2009 Tom Lewis () 16.3 One-Way ANOVA: The Procedure Fall Term 2009 1 / 10 Outline 1 The background 2 Computing formulas 3 The ANOVA Identity 4 Tom
Lecture notes 13: ANOVA (a.k.a. Analysis of Variance)
") Lecture notes 13: ANOVA (a.k.a. Analysis of Variance) Outline: Testing for a difference in means Notation Sums of squares Mean squares The F distribution The ANOVA table Part II: multiple comparisons Worked
Lecture notes 13: ANOVA (a.k.a. Analysis of Variance) Outline: Testing for a difference in means Notation Sums of squares Mean squares The F distribution The ANOVA table Part II: multiple comparisons Worked
The One-Way Repeated-Measures ANOVA. (For Within-Subjects Designs)
") The One-Way Repeated-Measures ANOVA (For Within-Subjects Designs) Logic of the Repeated-Measures ANOVA The repeated-measures ANOVA extends the analysis of variance to research situations using repeated-measures
The One-Way Repeated-Measures ANOVA (For Within-Subjects Designs) Logic of the Repeated-Measures ANOVA The repeated-measures ANOVA extends the analysis of variance to research situations using repeated-measures
2011 Pearson Education, Inc
 Statistics for Business and Economics Chapter 7 Inferences Based on Two Samples: Confidence Intervals & Tests of Hypotheses Content 1. Identifying the Target Parameter 2. Comparing Two Population Means:
Summary of Chapter 7 (Sections ) and Chapter 8 (Section 8.1)
 and Chapter 8 (Section 8.1)") Summary of Chapter 7 (Sections 7.2-7.5) and Chapter 8 (Section 8.1) Chapter 7. Tests of Statistical Hypotheses 7.2. Tests about One Mean (1) Test about One Mean Case 1: σ is known. Assume that X N(µ, σ
Summary of Chapter 7 (Sections 7.2-7.5) and Chapter 8 (Section 8.1) Chapter 7. Tests of Statistical Hypotheses 7.2. Tests about One Mean (1) Test about One Mean Case 1: σ is known. Assume that X N(µ, σ
Chapter 12 - Lecture 2 Inferences about regression coefficient
 Chapter 12 - Lecture 2 Inferences about regression coefficient April 19th, 2010 Facts about slope Test Statistic Confidence interval Hypothesis testing Test using ANOVA Table Facts about slope In previous
7.2 One-Sample Correlation ( = a) Introduction. Correlation analysis measures the strength and direction of association between
 Introduction. Correlation analysis measures the strength and direction of association between") 7.2 One-Sample Correlation ( = a) Introduction Correlation analysis measures the strength and direction of association between variables. In this chapter we will test whether the population correlation
7.2 One-Sample Correlation ( = a) Introduction Correlation analysis measures the strength and direction of association between variables. In this chapter we will test whether the population correlation
20.0 Experimental Design
 20.0 Experimental Design Answer Questions 1 Philosophy One-Way ANOVA Egg Sample Multiple Comparisons 20.1 Philosophy Experiments are often expensive and/or dangerous. One wants to use good techniques that
Ch 11- One Way Analysis of Variance
 Multiple Choice Questions Ch 11- One Way Analysis of Variance Use the following to solve questions 1 &. Suppose n = 8 and there are 4 groups, how many between groups (samples) degrees of freedom are there?
The simple linear regression model discussed in Chapter 13 was written as
 1519T_c14 03/27/2006 07:28 AM Page 614 Chapter Jose Luis Pelaez Inc/Blend Images/Getty Images, Inc./Getty Images, Inc. 14 Multiple Regression 14.1 Multiple Regression Analysis 14.2 Assumptions of the Multiple
EX1. One way ANOVA: miles versus Plug. a) What are the hypotheses to be tested? b) What are df 1 and df 2? Verify by hand. , y 3
 What are the hypotheses to be tested? b) What are df 1 and df 2? Verify by hand. , y 3") EX. Chapter 8 Examples In an experiment to investigate the performance of four different brands of spark plugs intended for the use on a motorcycle, plugs of each brand were tested and the number of miles
EX. Chapter 8 Examples In an experiment to investigate the performance of four different brands of spark plugs intended for the use on a motorcycle, plugs of each brand were tested and the number of miles
CHAPTER 13: F PROBABILITY DISTRIBUTION
 CHAPTER 13: F PROBABILITY DISTRIBUTION continuous probability distribution skewed to the right variable values on horizontal axis are 0 area under the curve represents probability horizontal asymptote
Analysis Of Variance Compiled by T.O. Antwi-Asare, U.G
 Analysis Of Variance Compiled by T.O. Antwi-Asare, U.G 1 ANOVA Analysis of variance compares two or more population means of interval data. Specifically, we are interested in determining whether differences
Salt Lake Community College MATH 1040 Final Exam Fall Semester 2011 Form E
 Salt Lake Community College MATH 1040 Final Exam Fall Semester 011 Form E Name Instructor Time Limit: 10 minutes Any hand-held calculator may be used. Computers, cell phones, or other communication devices
Ch 3: Multiple Linear Regression
 Ch 3: Multiple Linear Regression 1. Multiple Linear Regression Model Multiple regression model has more than one regressor. For example, we have one response variable and two regressor variables: 1. delivery
One-Way Analysis of Variance (ANOVA) Paul K. Strode, Ph.D.
 Paul K. Strode, Ph.D.") One-Way Analysis of Variance (ANOVA) Paul K. Strode, Ph.D. Purpose While the T-test is useful to compare the means of two samples, many biology experiments involve the parallel measurement of three or
One-Way Analysis of Variance (ANOVA) Paul K. Strode, Ph.D. Purpose While the T-test is useful to compare the means of two samples, many biology experiments involve the parallel measurement of three or
CHAPTER 13: F PROBABILITY DISTRIBUTION
 CHAPTER 13: F PROBABILITY DISTRIBUTION continuous probability distribution skewed to the right variable values on horizontal axis are 0 area under the curve represents probability horizontal asymptote
While you wait: Enter the following in your calculator. Find the mean and sample variation of each group. Bluman, Chapter 12 1
 While you wait: Enter the following in your calculator. Find the mean and sample variation of each group. Bluman, Chapter 12 1 Chapter 12 Analysis of Variance McGraw-Hill, Bluman, 7th ed., Chapter 12 2
An inferential procedure to use sample data to understand a population Procedures
 Hypothesis Test An inferential procedure to use sample data to understand a population Procedures Hypotheses, the alpha value, the critical region (z-scores), statistics, conclusion Two types of errors
STAT Chapter 10: Analysis of Variance
 STAT 515 -- Chapter 10: Analysis of Variance Designed Experiment A study in which the researcher controls the levels of one or more variables to determine their effect on the variable of interest (called
LI EAR REGRESSIO A D CORRELATIO
 CHAPTER 6 LI EAR REGRESSIO A D CORRELATIO Page Contents 6.1 Introduction 10 6. Curve Fitting 10 6.3 Fitting a Simple Linear Regression Line 103 6.4 Linear Correlation Analysis 107 6.5 Spearman s Rank Correlation
Chapter 10. Design of Experiments and Analysis of Variance
 Chapter 10 Design of Experiments and Analysis of Variance Elements of a Designed Experiment Response variable Also called the dependent variable Factors (quantitative and qualitative) Also called the independent
AMS7: WEEK 7. CLASS 1. More on Hypothesis Testing Monday May 11th, 2015
 AMS7: WEEK 7. CLASS 1 More on Hypothesis Testing Monday May 11th, 2015 Testing a Claim about a Standard Deviation or a Variance We want to test claims about or 2 Example: Newborn babies from mothers taking
ANOVA CIVL 7012/8012
 ANOVA CIVL 7012/8012 ANOVA ANOVA = Analysis of Variance A statistical method used to compare means among various datasets (2 or more samples) Can provide summary of any regression analysis in a table called
Problem Set 4 - Solutions
 Problem Set 4 - Solutions Econ-310, Spring 004 8. a. If we wish to test the research hypothesis that the mean GHQ score for all unemployed men exceeds 10, we test: H 0 : µ 10 H a : µ > 10 This is a one-tailed
Chapter Seven: Multi-Sample Methods 1/52
 Chapter Seven: Multi-Sample Methods 1/52 7.1 Introduction 2/52 Introduction The independent samples t test and the independent samples Z test for a difference between proportions are designed to analyze
Chapter 11 - Lecture 1 Single Factor ANOVA
 April 5, 2013 Chapter 9 : hypothesis testing for one population mean. Chapter 10: hypothesis testing for two population means. What comes next? Chapter 9 : hypothesis testing for one population mean. Chapter
Statistik för bioteknik sf2911 Föreläsning 15: Variansanalys
 Statistik för bioteknik sf2911 Föreläsning 15: Variansanalys 14.12.2017 Learning Outcomes The problem of multiple comparisons One-way Analysis of Variance (= ANOVA) ANOVA table F-distribution Nationalencyklopedin
T.I.H.E. IT 233 Statistics and Probability: Sem. 1: 2013 ESTIMATION AND HYPOTHESIS TESTING OF TWO POPULATIONS
 ESTIMATION AND HYPOTHESIS TESTING OF TWO POPULATIONS In our work on hypothesis testing, we used the value of a sample statistic to challenge an accepted value of a population parameter. We focused only
Chapter 16. Simple Linear Regression and Correlation
 Chapter 16 Simple Linear Regression and Correlation 16.1 Regression Analysis Our problem objective is to analyze the relationship between interval variables; regression analysis is the first tool we will
Basic Business Statistics 6 th Edition
 Basic Business Statistics 6 th Edition Chapter 12 Simple Linear Regression Learning Objectives In this chapter, you learn: How to use regression analysis to predict the value of a dependent variable based
Note: k = the # of conditions n = # of data points in a condition N = total # of data points
 The ANOVA for2 Dependent Groups -- Analysis of 2-Within (or Matched)-Group Data with a Quantitative Response Variable Application: This statistic has two applications that can appear very different, but
Mathematics for Economics MA course
 Mathematics for Economics MA course Simple Linear Regression Dr. Seetha Bandara Simple Regression Simple linear regression is a statistical method that allows us to summarize and study relationships between
Sampling, Confidence Interval and Hypothesis Testing
 Sampling, Confidence Interval and Hypothesis Testing Christopher Grigoriou Executive MBA HEC Lausanne 2007-2008 1 Sampling : Careful with convenience samples! World War II: A statistical study to decide
Six Sigma Black Belt Study Guides
 Six Sigma Black Belt Study Guides 1 www.pmtutor.org Powered by POeT Solvers Limited. Analyze Correlation and Regression Analysis 2 www.pmtutor.org Powered by POeT Solvers Limited. Variables and relationships
ANOVA - analysis of variance - used to compare the means of several populations.
 12.1 One-Way Analysis of Variance ANOVA - analysis of variance - used to compare the means of several populations. Assumptions for One-Way ANOVA: 1. Independent samples are taken using a randomized design.
ANOVA: Analysis of Variation
 ANOVA: Analysis of Variation The basic ANOVA situation Two variables: 1 Categorical, 1 Quantitative Main Question: Do the (means of) the quantitative variables depend on which group (given by categorical
DISTRIBUTIONS USED IN STATISTICAL WORK
 DISTRIBUTIONS USED IN STATISTICAL WORK In one of the classic introductory statistics books used in Education and Psychology (Glass and Stanley, 1970, Prentice-Hall) there was an excellent chapter on different
Table of z values and probabilities for the standard normal distribution. z is the first column plus the top row. Each cell shows P(X z).
.") Table of z values and probabilities for the standard normal distribution. z is the first column plus the top row. Each cell shows P(X z). For example P(X.04) =.8508. For z < 0 subtract the value from,
Table of z values and probabilities for the standard normal distribution. z is the first column plus the top row. Each cell shows P(X z). For example P(X.04) =.8508. For z < 0 subtract the value from,
PLSC PRACTICE TEST ONE
 PLSC 724 - PRACTICE TEST ONE 1. Discuss briefly the relationship between the shape of the normal curve and the variance. 2. What is the relationship between a statistic and a parameter? 3. How is the α
Multiple Regression. Inference for Multiple Regression and A Case Study. IPS Chapters 11.1 and W.H. Freeman and Company
 Multiple Regression Inference for Multiple Regression and A Case Study IPS Chapters 11.1 and 11.2 2009 W.H. Freeman and Company Objectives (IPS Chapters 11.1 and 11.2) Multiple regression Data for multiple
Sociology 6Z03 Review II
 Sociology 6Z03 Review II John Fox McMaster University Fall 2016 John Fox (McMaster University) Sociology 6Z03 Review II Fall 2016 1 / 35 Outline: Review II Probability Part I Sampling Distributions Probability
Sample Problems for the Final Exam
 Sample Problems for the Final Exam 1. Hydraulic landing assemblies coming from an aircraft rework facility are each inspected for defects. Historical records indicate that 8% have defects in shafts only,
Marketing Research Session 10 Hypothesis Testing with Simple Random samples (Chapter 12)
") Marketing Research Session 10 Hypothesis Testing with Simple Random samples (Chapter 12) Remember: Z.05 = 1.645, Z.01 = 2.33 We will only cover one-sided hypothesis testing (cases 12.3, 12.4.2, 12.5.2,
Marketing Research Session 10 Hypothesis Testing with Simple Random samples (Chapter 12) Remember: Z.05 = 1.645, Z.01 = 2.33 We will only cover one-sided hypothesis testing (cases 12.3, 12.4.2, 12.5.2,
UNIVERSITY OF TORONTO SCARBOROUGH Department of Computer and Mathematical Sciences Midterm Test, October 2013
 UNIVERSITY OF TORONTO SCARBOROUGH Department of Computer and Mathematical Sciences Midterm Test, October 2013 STAC67H3 Regression Analysis Duration: One hour and fifty minutes Last Name: First Name: Student
Statistics for Managers Using Microsoft Excel Chapter 10 ANOVA and Other C-Sample Tests With Numerical Data
 Statistics for Managers Using Microsoft Excel Chapter 10 ANOVA and Other C-Sample Tests With Numerical Data 1999 Prentice-Hall, Inc. Chap. 10-1 Chapter Topics The Completely Randomized Model: One-Factor
In a one-way ANOVA, the total sums of squares among observations is partitioned into two components: Sums of squares represent:
 Activity #10: AxS ANOVA (Repeated subjects design) Resources: optimism.sav So far in MATH 300 and 301, we have studied the following hypothesis testing procedures: 1) Binomial test, sign-test, Fisher s
Econ 3790: Business and Economics Statistics. Instructor: Yogesh Uppal
 Econ 3790: Business and Economics Statistics Instructor: Yogesh Uppal yuppal@ysu.edu Sampling Distribution of b 1 Expected value of b 1 : Variance of b 1 : E(b 1 ) = 1 Var(b 1 ) = σ 2 /SS x Estimate of
Chapter 20 Comparing Groups
 Chapter 20 Comparing Groups Comparing Proportions Example Researchers want to test the effect of a new anti-anxiety medication. In clinical testing, 64 of 200 people taking the medicine reported symptoms
Difference in two or more average scores in different groups
 ANOVAs Analysis of Variance (ANOVA) Difference in two or more average scores in different groups Each participant tested once Same outcome tested in each group Simplest is one-way ANOVA (one variable as
Institute of Actuaries of India
 Institute of Actuaries of India Subject CT3 Probability & Mathematical Statistics May 2011 Examinations INDICATIVE SOLUTION Introduction The indicative solution has been written by the Examiners with the
Inference for Regression Simple Linear Regression
 Inference for Regression Simple Linear Regression IPS Chapter 10.1 2009 W.H. Freeman and Company Objectives (IPS Chapter 10.1) Simple linear regression p Statistical model for linear regression p Estimating
CHAPTER 10 ONE-WAY ANALYSIS OF VARIANCE. It would be very unusual for all the research one might conduct to be restricted to
 CHAPTER 10 ONE-WAY ANALYSIS OF VARIANCE It would be very unusual for all the research one might conduct to be restricted to comparisons of only two samples. Respondents and various groups are seldom divided
Pooled Variance t Test
 Pooled Variance t Test Tests means of independent populations having equal variances Parametric test procedure Assumptions Both populations are normally distributed If not normal, can be approximated by
Regression Models. Chapter 4. Introduction. Introduction. Introduction
 Chapter 4 Regression Models Quantitative Analysis for Management, Tenth Edition, by Render, Stair, and Hanna 008 Prentice-Hall, Inc. Introduction Regression analysis is a very valuable tool for a manager
Chapter 3 Multiple Regression Complete Example
 Department of Quantitative Methods & Information Systems ECON 504 Chapter 3 Multiple Regression Complete Example Spring 2013 Dr. Mohammad Zainal Review Goals After completing this lecture, you should be
1-Way ANOVA MATH 143. Spring Department of Mathematics and Statistics Calvin College
 1-Way ANOVA MATH 143 Department of Mathematics and Statistics Calvin College Spring 2010 The basic ANOVA situation Two variables: 1 Categorical, 1 Quantitative Main Question: Do the (means of) the quantitative
This document contains 3 sets of practice problems.
 P RACTICE PROBLEMS This document contains 3 sets of practice problems. Correlation: 3 problems Regression: 4 problems ANOVA: 8 problems You should print a copy of these practice problems and bring them
Multiple comparisons - subsequent inferences for two-way ANOVA
 1 Multiple comparisons - subsequent inferences for two-way ANOVA the kinds of inferences to be made after the F tests of a two-way ANOVA depend on the results if none of the F tests lead to rejection of
ANOVA: Comparing More Than Two Means
 ANOVA: Comparing More Than Two Means Chapter 11 Cathy Poliak, Ph.D. cathy@math.uh.edu Office Fleming 11c Department of Mathematics University of Houston Lecture 25-3339 Cathy Poliak, Ph.D. cathy@math.uh.edu
In ANOVA the response variable is numerical and the explanatory variables are categorical.
 1 ANOVA ANOVA means ANalysis Of VAriance. The ANOVA is a tool for studying the influence of one or more qualitative variables on the mean of a numerical variable in a population. In ANOVA the response
STAT Exam Jam Solutions. Contents
 s Contents 1 First Day 2 Question 1: PDFs, CDFs, and Finding E(X), V (X).......................... 2 Question 2: Bayesian Inference...................................... 3 Question 3: Binomial to Normal
One-Way Analysis of Variance (ANOVA)
") 1 One-Way Analysis of Variance (ANOVA) One-Way Analysis of Variance (ANOVA) is a method for comparing the means of a populations. This kind of problem arises in two different settings 1. When a independent
1 One-Way Analysis of Variance (ANOVA) One-Way Analysis of Variance (ANOVA) is a method for comparing the means of a populations. This kind of problem arises in two different settings 1. When a independent
ANOVA: Comparing More Than Two Means
 1 ANOVA: Comparing More Than Two Means 10.1 ANOVA: The Completely Randomized Design Elements of a Designed Experiment Before we begin any calculations, we need to discuss some terminology. To make this
STAT 115:Experimental Designs
 STAT 115:Experimental Designs Josefina V. Almeda 2013 Multisample inference: Analysis of Variance 1 Learning Objectives 1. Describe Analysis of Variance (ANOVA) 2. Explain the Rationale of ANOVA 3. Compare
1. What does the alternate hypothesis ask for a one-way between-subjects analysis of variance?
 1. What does the alternate hypothesis ask for a one-way between-subjects analysis of variance? 2. What is the difference between between-group variability and within-group variability? 3. What does between-group
DESAIN EKSPERIMEN Analysis of Variances (ANOVA) Semester Genap 2017/2018 Jurusan Teknik Industri Universitas Brawijaya
 Semester Genap 2017/2018 Jurusan Teknik Industri Universitas Brawijaya") DESAIN EKSPERIMEN Analysis of Variances (ANOVA) Semester Jurusan Teknik Industri Universitas Brawijaya Outline Introduction The Analysis of Variance Models for the Data Post-ANOVA Comparison of Means Sample
DESAIN EKSPERIMEN Analysis of Variances (ANOVA) Semester Jurusan Teknik Industri Universitas Brawijaya Outline Introduction The Analysis of Variance Models for the Data Post-ANOVA Comparison of Means Sample
Inference for Regression Inference about the Regression Model and Using the Regression Line
 Inference for Regression Inference about the Regression Model and Using the Regression Line PBS Chapter 10.1 and 10.2 2009 W.H. Freeman and Company Objectives (PBS Chapter 10.1 and 10.2) Inference about