University of Minnesota St. Anthony Falls Hyd.rauJ.ic Laboratory. Project Report No. 174 MODEL STUDY OF TEE VAN LARE OVERFLOW DISTRIBUTION STRUCTURE
|
|
|
- Gwendoline Hodges
- 5 years ago
- Views:
Transcription
1 University of Minnesota St. Anthony Falls Hyd.rauJ.ic Laboratory Project Report No. 174 MODEL STUDY OF TEE VAN LARE OVERFLOW DISTRIBUTION STRUCTURE by John M. Killen a:nd.,_. Charles C. s. Song Prepared for O'Brien a:nd Gere Engineers Syracuse, New York and Division of Pure Water Monroe County, New York July 1978 Minneapolis, Minnesota I "
2 I. I ~ I
3 T.A:BLE OF CONTENTS, Page I. INTRODUCTION 1 II. DESCRIPTION OF TEE MODEL 2 III. TEST RESULTS 3 A. Minimum Flow Conditions 3 ]. Average Flow Conditions 3 c. Peak Flow Conditions 4 D. Special Flow Conditions 6 E. Alternate Inflow Conditions 6 IV. CONCLUSIONS AND RECOMMENDATIONS 7 List of Figures, Tables, and Photographs 9
4 Project Report No. 174 Model Study of the Van La.re Overflow Distribution Structure I, INTRODUCTION The. Van Lare sewage treatment acili ties in Mon:t'oe County, New York must eventually receive waste from an increased number of waste effluent conduits. The combined flow to the Van Lare treatment faoili ties is limited to 230 mgd and must enter the facili ~Y through two-six-foot diameter conduits. Each condu.i t must carry half of the total maximum flow. A new distribution structure has been proposed by O'Brien and Gere Engineers which will receive waste from six effluent conduits and pass the flow from these conduits to the two inlet parts of the Van Lare Plant. The ma:x:imum. discharge of these six condu.i ts is expected to reach 600 mgd. The flow in excess of 200 mgd must be passed to a storm wate~ treatment plant. The overflow distribution structure is to be built with its:floor at an elevation of 67.5 feet and with a tap elevation at 86 feet. Waste can be discharged by gravity from this facility ~o both the Van Lare treatment facility and the storm water treatment facility. The discharge to the Van Lar~ treatment facility is controlled by sluice gates in the distribution structure. Excess flow over 200 mgd is by-passed over a weir to the storm water treatment facility. A seventh conduit discharge.flows up to 200 mgd into the distribution st:ructure downstream of the control weir and must go directly to the storm water prooessing.facilities. Because of the complex nature of the pro~osed new distribution structure, it was decided to conduct a physical model test program to determine the hydraulic performance of the struct1u'e. This :report summarizes the resul~s of the model tests..
5 ' II. DESCRIPTION OF THE MODEL A 1 to 12 scale model of' the distribution structure was built according to the preliminary design drawing supplied by 0 1J3rien and Gere Engineers. This drawing is shown in Fig. 1..An overall view of the completed model is shown in Photo 1. the distribution structure to be tes l:ied. The he:x:agonal bo:x: at the center of the photograph is All inflow Md outflow pipes attached to the structures are labeled A th:t'ough K in accordance with the labels shown in Fig. 1. The smaller bo:x: in the background is a tailwater control bo:x: which controls the tailwater elevations of' each outflow line by adjustable weirs. It is also used to measure the combined discharges through lines H a.nd I and lines J and K..All supply lines draw water from a common overhead supply source. Flow into each supply line is controlled by a valve and measured by either ~ calibrated orifice or elbow meter. :Because this is a gravity flow system and flow conditions in the distribution structure are of' main concern, the model was constructed and tested according to the Froude law of' dyriamic similarity. Accordingly~ the model will simulate the flow within the.di~tribution bo:x: ve~ well but will not simulate the energy losses in the long supply and discha;'ge lines. Consequently, the head at the intake point of each discharge line was established by the tailwa.ter control to an elevation calculated by 0 1J3rien and Gere Engineers. For example, the piezometric head at lines R and I was set at 74 f't at the flow ra~e of' 200 mgd and the head at lines J and K was set at 75 7 f't at 400 mgd. out excess turbulence generated at the valves. Wire mesh was used in each supply line to dump This also assured the occurrence of' subcri tical flow in the pipe and ori tical flow at the outfall when the pipe was not --submerged. According to the Froude law of' similarity, the measured quanti ties in the model may be scaled up to predict the prototype performance using the following scale factors, where the subscripts p and m denote prototype and model, respectiv~ly, L Linear Scale ratio; f = 12 m L Velocity ratio; -1- = 12 m
6 /.'; 3 - ))is charge ratio; ~ ~ ( 12 )!>/2 Pressure X'atio; ~. F ::::; 12 m III. TEST BESULTS The model was tested aocox'ding to the opex'ating schedule detex'roined by 0' BX'ien and Gere Engineers. This schedule is shown in Table 1 In addition to the flow conditions shown in this table, an alternate set of flow conditions identical to those shown in Table 1 wex'e tested, except that the inflows at lines A and B were diverted to line c. Thus, a ~otal of 26 flow conditions were tested. The result of each run is described below. A. Minimum Flow Condi tiona Photos 2 and 3 show the :minimum flow conditions, Min. 1 and Min. 2, X'espectively. The low flow condition fills only the tx'apezoidal part of the flow channel in the structure as desired. The watex' surfaces are relatively tranquil and the elevations of 71 ft and 73 ft can be observed in Photos 2 and 3, respectively. B. Average Flow Condi tiona Photos 4 through 7 show the four average flow conditions listed in Table 1 Fifty mgd inflow each was imposed on lines A and B for all four cases. In addition, 15 mgd inflow was added from line E to con- -. sti tute A 1 flow condition. The outflow was equally divided between lines H. and I. Photo 4 shows that the flow in the distribution box was relatively smooth. The water surface in the box was at elevation 72.5 ft.- An A2 flow condition was obtained by adding 50 mgd from line D to the A.1 flow condition. This gave a uniform surface elevation at 73 ft as shown in Photo 5. The outflow was spread evenly between lines H and I. For the A3 case, the flow from line E was increased to 80 mgd and the flow in D reduc~d to ~ero. The flow in lines H and I became 90 mgd each. The water surface level in the control structure remained nearly equal to 73 ft. This flow condition is shown in Photo 6. The flow "
7 - 4- condition,.a4, was obtained by reducing the outflow.at lines H and I to 75 rogd each and 30 rogd was passed through lines J and K. To accomplis~ this the sluiqe gate on lines H and I must be lowered to reduce the flow in these lines and raise the water surface sufficiently, 76 ft, to cause the overflow of 30 mgd over the weir. The flow over the weir can be seen in Photo 7 A slightly increa~ed elevation at the downstream end of the weir was due to the momentum of the inflow crossing the basin. 0. Peak Flow Conditions Seven peak flow conditions were examined in the model, according to the schedule of Table 1. The results for the water surface conditions axe shown on Photos 8 to 14. Peak flow condition 1 (P1) as shown in Photo 8 had a flow of 100 ~ from each of lines A and ]., 80 mgd in line lll, and 120 mgd in line F. The outflow was adjusted to give 100 mgd each in lines H and I by means of the sluice gates. Two hundred mgd flowed over the weir and out from lines J and K. The water surface downstream of the weir was below the crown of condu.i ts J and K. Peak flow condition 2 (P2) required the same inflow as P1 above. However, the sluice gates on lines H and I were further lowered to reduce the flow in these lines to 75 mgd each. The flow in lines J and K increased to 250 mgd. The water level in the box rose to 77.5 to cause 250 mgd to pass over the weir. Photo 9 shows the water surface conditions of P2. The maximum flow condition was simulated dur~ peak condition 3 (P3). The inflow was as follows: A := B = 100 mgd, E = 80 mgd, F := 120 mgd, and G := 185 mgd. The heavy water usage in other facilities of the Laboratory at the tiine of this test reduced the available head so that the total flow of 600 mgd was reduced to 585 mgd. For this reason, two alternative combinations of discharges, each combination adding up to a total of 585 mgd, were tested. For the first alternative, lines H and I discharged 100 rogd each and lf.nes J and K a total of 385 mgd.. In this case the water surface elevation was 78 ft upstream of the weir and 77 ft downstream of the weir. The flow condition is shown on Photo 10. For the
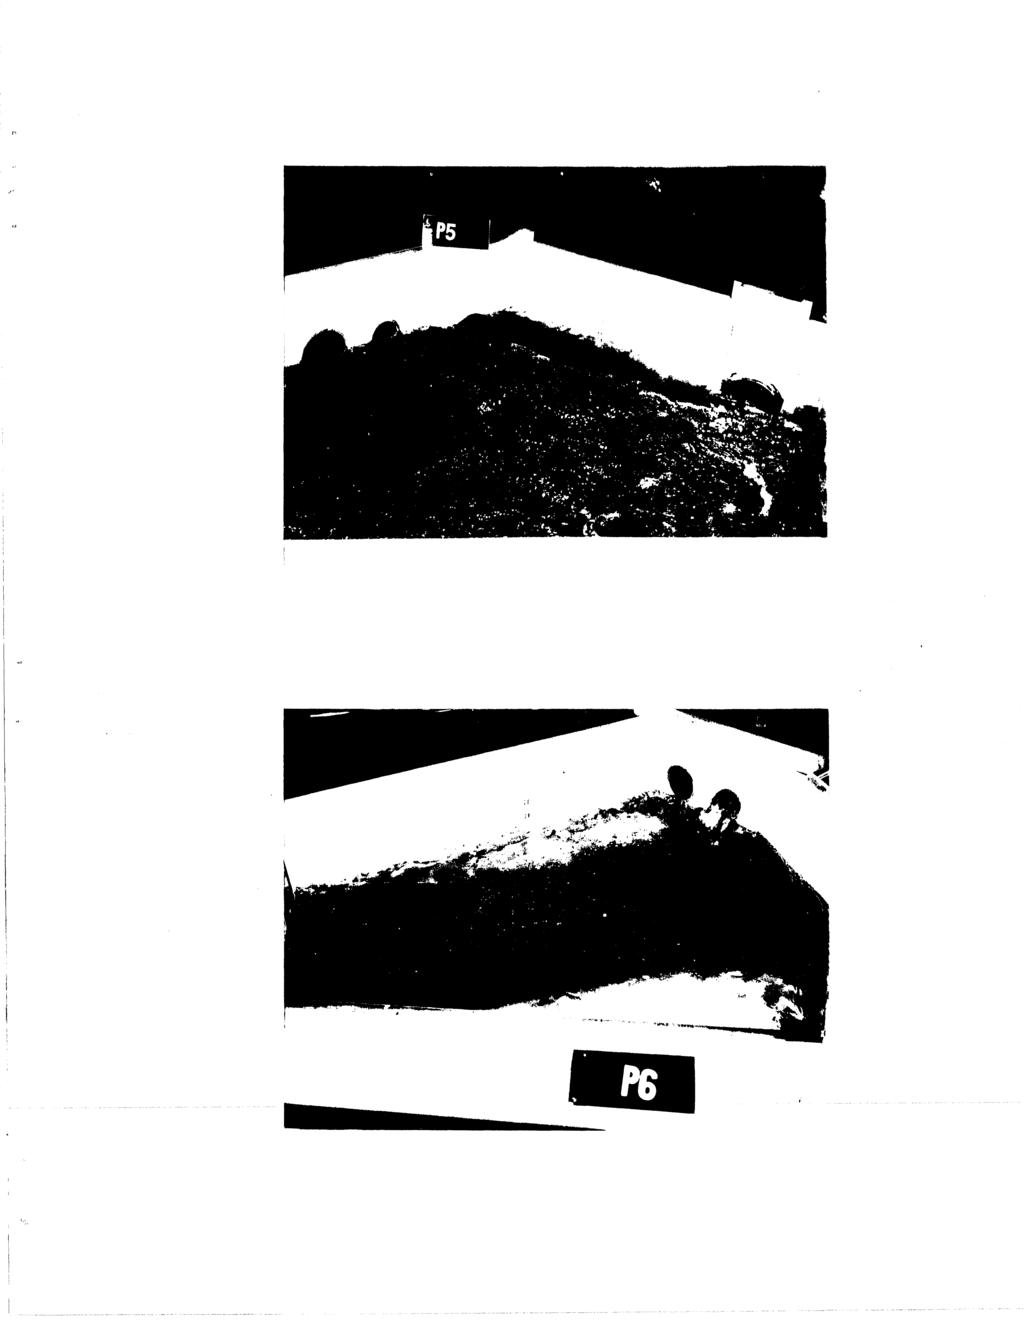
8 - 5 - second alternative, the flow through H and I were reduced to 92.5 mgd each in order to maintain an overflow of 200 mgd so that the flow through lines J and K had a tptal of 400 mgd. This second alternate flow condition was also satisfactory. It is significant to note that the water surface disturbance was reduced as the outlets from lines c, D, -E, and F were partly submerged and the outflow velocity from these lines was reduced from critical to subcritical as the water level in the structure partially submerged the outlets. For peak flow condition 4(P4), conduits A and B each delivered 100 mgd; E delivered 80 mgd; and F delivered 120 mgd. The outflow from the structure was 75 mgd from H and 325 mgd through J plus K. Photo 11 shows the water surface for the P4 condition. The water surface elevation upstream of the weir was 77 ft and 76 ft downstream of the weir. surface was not quite level along the length of the weir. There was a The water slight pile-up of water ne~ the downstream end as can be seen in Photo 11. Peak flow condition 5 (P5) is shown on Photo 12. and ] conduits was 100 mgd each and that from oondui ~s The inflow from A E and F were 90 mgd and 180, respectively. The outflow from conduits H and I was 100 mgd each. The remaining 270 mgd flows out through conduit J plus K. The disturbance to the flow over the weir due to the cross-flow from E and F is very evident. from this, however. No adverse operating condition was envisioned Peak flow condition 6 (P6) refers to peak flow in conduits H and I. The inflow was 75 mgd each from conduits A and ] and 80 mgd from conduit E. TJ:Us gives an outflow through conduits H and I of 115 mgd each. The water surface elevation in the diversion structure was 75 ft and a maximum hydraulic gradeline of in the conduits H and I. This flow condition is shown in Photo 13. Peak flow condition 7 (P7) is shown on Photo 14. The inflow was 60 mgd each from lines A and :B, 80 mgd from line E, and 100 mgd from line F. The outflow from lines H and I were limited to 100 mgd by ~ throttling the sluice gates. The remaining 100 mgd was forced over the
9 - 6 - weir and discharged through lines J and K. D. Special Flow Conditions 1. Unbalanced Flow Conditions in Conduits A and ] Because of a problem in the existing control structure, the inflow from the two conduits may not be equal at all times. [l:wo sets of unbalanced inflow conditions, (QA::: 120 mgd, ~ ::: 80 mdg) and ( QA ::;:: 80 mgd, ~ ::: 120 mgd), were tested. The resulting water surface conditions are shown in Photo 15 and Photo 16, respectively. Flow measurement taken at the orifice meters indicated no detectable changes in lines H and I. This means the flow rate through the two outflow pipes are mainly dete~ned by the friction and the average available head but not sensitive to the tu:r'bulence or the secondax.y currents generated by the unbalanced inflows. 2. Weir Performance The performance of the overflow weir was examined in detail for a maximum flow condition. The maximum total inflow used in the tests was.585 mgd instead of the 600 mgd requested due to the pre- - viously mentioned capacity limitation. The difference in the flow was so small that its effect on the weir performance should be negligible. The sluice gates at lines H and I were throttled to allow the discharge through each of them to be equal to 92.5 mgd so that 200 mgd would flow over the weir. The inflow from line G was equal to 200 mgd. This gave the water surface elevation of 78 ft upstream. of the weir and ft downstream of the weir..a1 though there was some flow pile-up occurring near the downstream end of the weir, the overall flow was quite satisfactory. -- The water surface condition is shown in Photo 17. E..A1 ter:nate Inflow Conditions It was requested by O'Brien and Gere Engineers that the effect of replacing the inflow from conduits A and E with conduit C be ' examined. The s~e tests were made as specified in Table 1 with conduits A and ] closed and an equal amount of flow passing through C. The
10 - 7 - results are shown in Photos 18 to 30. The results of this series of tests are essentially the same as that of the other series in every respect except that the~e were more-surface disturbances and pile-up of water at the downstream end of the distribution structure due to the greater flow velocity and the coherence of the jet near the water surface. This ~s believed to be caused by (1) concentration of flow in one pipe and (2) relatively higher elevation of line C as compared with lines A and B. IV. COHCLUSIONS.AND RECOMl\lEJNDATIOHS The model performed quite satisfactorily for the series of flow conditions tested. There are a few minor possible problem areas for which some improvement may be made. A. Ventilation of the Overflow Weir These are as follows. A long weir sealed at both ends as,proposed has a tendency to flutter at a particular flow rate. This fluttering is a nuisance and occasionally may cause structural damage. nappe. It can be prevented by ventilation of the The exact amount of necessary flow rate is difficult to calculate. It appears that a sufficient for the purpose. 1 ft diameter pipe at each end of the weir would be The vent should have its air intake at a sufficiently high elevation to prevent being flooded at all times. B. Weir Height and Flow Control The proposed weir height of 76 ft requires a considerable amount of throttling at the intakes of lines H and I in order to force overflow when inflow exceeds 200 rogd. (This condition assumes that the frictional and other losses estimated for the entire lines H and I are correct.) If so desired, the weir height could be lowered to 74-1/2 ft or thereabouts in order to reduce the throttling requirement at lines H and I; that is, some flow in excess of 200 rogd may automatically overflow without throttling. However, this must be done with caution because it would also reduce the controllability of the flow. That is, if the weir is too low and the friction in lines~ H and I too high, then it would not be able to disr charge 200 rogd through these lines.
11 - 8 - c. Floor Elevation There is an advantage to keep lines J and K completely s~bmerged during an overflow period. This would require lowering of the pipes and the floor on the downstream side of the weir by about 6 ft. This amount can be reduced to the extent that the weir height elevation in the stop distribution structure could be raised. D. Water Surface Disturbances It can be seen from the photographs of the model in operation that the surface disturbance is reduced as the conduits C, D, E, and F are more submerged. The raised tailwater reduces the velocity of discharge and hence reduces the surface disturbance. It mqr be beneficial to lower the inflow pipes as much as the geometry pe~~ts.
12 - 9 - LIST OF FIGURES, TABLES AND PHOTOGRAPHS Figu:re 1 Drawing of th~ overflow distribution structure supplied by O'Brien and Gere Engineers, Inc. Table I Operation conditions supplied by O'Brien and Gere Engineers, Inc. Photo 1 Completed 1/12 scale m~del of overflow distribution structure. Left to right in foreground conduit G, D, c, B, A, E, F. Conduit K in left background. Photo 2 Photo 3 Minimum flow condition 1 in the model conduit. A = 25, J3 = 25, E::::: 5, H = 27.5, and I= 27.5 mgd. Minimum flow condition 2 in the model flow conduit. A= 25, J3::::: 25, D = 50, E = 5, H = 52.5, and I= 52.5 mgd. Photo 4 Average flow condition 1. Inflow in model, A::::: 50,~.= 50, E::::: 15 mgd, Outflow, H = 57.5, I::::: 57.5 mgd. Photo 5 Average flow condition 2. Inflow to the model,' A= 50, J3 = 50, D = 50, E = 15 mgd. Outflow, H = 82.5, I::::: S2.5 mgd. Photo 6 Average flow condition 3 Inflow to the model, A= 50, J3 = 50, E ::::: SO mgd. Outflow, H = 90, I ::::: 90 mgd, Photo 7 Average flow condition 4. Inflow to model, A= 50, J3 = 50, E = SO mgd. Outflow, H = 75, I = 75, J+K = 30 mgd. PhotoS Peak flow condition 1. Inflow to model, A::::: 100, J3 = 100, E = So, F = 120 mgd. Outflow, H = 100, I = 100, J+K = 200 mgd. Photo 9 Peak flow condition 2. Inflow to model, A = 100, J3 = 100, E = So, F = 120 mgd. Outflow, H = 75, I = 75, J+K = 250 mgd. Photo 10 Peak flow condition 3 Inflow to model, A= 100, J3 = 100, E = SO, F = 120, G = 185 mgd. Outflow, H = 100, I.= 100, J+K = 3S5 mgd. Photo 11 Peak flow condition 4 Inflow to model, A= 100, J3 = 100, E::::: SO, F = 120 mgd. Outflow, H = 15, I = o, J+K = 325 mgd. Photo 12 Peak flow condition 5. Inflow to model, A= 100, J3 = 100, E = 90, F = 1SO mgd. Outflow, H = 100, I = 100, J+K = 270 mgd. Photo 13 Peak flow condition 6. Inflow to model, A= 15, J3 = 75, E = So mgd. Outflow, H = 115, I = 115 mgd. Photo 14 Peak flbw condition 7 Inflow to model, A= 60, J3 = 60, E = SO, F = 100 mgd. Outflow, H = 100, I = 100, J+K = 100 mgd.
13 r Photo 15 Photo 16 Photo 17 Photo 18 Photo 19 Photo 20 Photo 21 Photo 22 Photo 23 Photo 24 Photo 25 Photo 26 Photo 27 Photo 28 Photo 29 Photo 30 Special flow condition 1. Inflow to model, A~ 120, B = 80 mgd. Outflow, H = 100, I = 100 mgd. Special flow pondi tion 2. Outflow, H = 100, I = 100 mgd. Inflow to model, A= 80, B = 1'20 mgd. Special flow condition 3 Inflow to model, G = 200 mgd. Outflow, J+K = 200 mgd. Minimum flow condition 10. Outflow, H = 27.5, I= 27.5 mgd. Inflow to model, 0 = 50, E = 5 mgd. Minimum flow condition 20. Inflow to model, 0 = 50, D = 50, E = 5 mgd. Outflow, H = 52.5, I= 52.5 mgd. Average flow condition 10. Outflow, H = 57.2, I= 57.2 mgd. Inflow to model, 0 = 100, E = 15 mgd. Average flow condition 20. Inflow to model, 0 = 100, D = 50, E = 15 mgd. Outflow, H,;, 82.5, I = 82.5 mgd. Average flow condition 30. Outflow, H = 90, I = 90 mgd. Average flow condition 40. Outflow, H = 75, ~ = 75, J+K = 30 mgd. Inflow to model, 0 = 100, E = 80 mgd. Inflow to model, 0 = 100, F = 80 mgd. Peak flow condition 10. Inflow to model, 0 = 200, E = 80, F = 120 mgd. Outflow, H = 100, I = 100, J+K = 200 mgd. Peak flow condition 20. Inflow to model, 0 = 200, E = 80, F = 120 mgd. Outflow, H = 75, I = 75, J+K = 250 mgd. Peak flow condition 30. Inflow to model, 0 200, E = 80, F = 120, G = 200 mgd. Outflow, H = 100, I = 100, J+K = 400 mgd. Peak flow condition 40. Inflow to model, 0 = 200, E = 80, F = 120 mgd. Outflow, H = 75, I = O, J+K = 325 mgd. Peak flow condition 50. Inflow to model, 0 = 200, E = 90, F = 180 mgd. Outflow, H = 100, I= 100, J+K = 270 mgd. Peak flow condition 60. Outflow, H = 115, I = 115 mgd. Inflow to model, 0 = 150, E = 80 mgd. Peak flow condition 70. Inflow to model, 0 = 120, E = 80, F = 100 mgd. Outflow, H = 100, I = 100, J+K = 100 mgd.!
14 ... I ~ ~ TABLE I. Operation conditions supplied. by D':Brien and Gere Engineers, Inc. Min Min Avg Avg Avg Avg Pk Pk Pk Pk Pk (i) G) G) Pk Pk (j) A ]3 c D E 0.$ o so so so F G I 0 0 H S I S J K JO NOTE: In the f'uture Lines A & ]3 may be abandoned and. the f'low from those lines would be carried by Line C. Testing should. also incorporate this possible change..all flows in million gallons/day.
15 .I.. -4'- P.~~- 'L ~~~t~';.e- ~. "14 0" [ -- f'i1n 1 ELEV??.CO',._ fe(t10,"f /:1 f<o...t... ~,: Fig. 1. Drawing of the ove:rflow distribution structure supplied by 0 1 :Srien and Gere Enginee:rs, Inc.
16 Photo 1 - Completed 1/12 scale model of overflow distribution structure. Left to right in foreground conduit G, D, C, B, A, E, F. Conduit K in left background.

17
18 Photo 2 ~ Minimum flow condition 1 in the model conduit. A ~ 25, B = 25, E = 5, R = 27.5, and I= 27.5 mgd. Photo 3 ~ Minimum flow condition 2 in the model flow conduit. A= 25, B = 25, D = 50, E = 5, R ~ 52.5, and I = 52.5 mgd.
19
20 r Photo 4 - Average flow condition 1. Inflow in model, A== 50, :B == 50, E == 15 mgd. Outflow, H == 57.5, I== 57.5 mgd. Photo 5 - Average flow condition 2. Inflow to the model, A = 50, :B =50, D = 50, E = 15 mgd. Outflow, H ~ 82.5, I= 82.5 mgd,

21 '.
22 Photo 6 - Average flow condition 3 Inflow to the model, A ~ 50, ] ~ 50, E ~ 80 mgd. Outflow, R ~ 90, I ~ 90 mgd. Photo 7 - Average flow condition 4 Inflow to model, A = 50, ] = 50, E ~ 80 mgd. Outflow, H ~ 75, I~ 75, J+K ~ 30 mgd.

23
24 Photo 8- Peak flow condition 1. Inflow to model, A~ 100, ~ ~ 100, E ~ 80, F ~ 120 mgd. Outflow, H ~ 100, I ~ 100, J+K ~ 200 mgd. Photo 9 - Peak flow condition 2. Inflow to model, A ~ 100, ~ ~ 100, E ~ 80, F = 120 mgd. Outflow, H = 75, I = 75, J+K = 250 mgd

25
26 n Photo 10 - Peak.flow condition 3 Inflow to model, A~ 100, B ~ 100, E ~ 80, F ~ 120, G ~ 185 mgd. Outflow, H ~ 100, I ~ 100, J+K ~ 385 mgd. Photo 11 - Peak flow condition 4 Inflow to model, A= 100, B = 100, E = 80, F ~ 120 mgd. Outflow, H = 75, I ~ O, J+K = 325 mgd.

27
28 Photo 12 - Peak flow oonaition 5. Inflow to moael, A= 100, ~ = 100, E = 90, F = 180 mgd. Outflow, H = 100, I = 100, J+K = 270 mgd. Photo 13 - Peak flow conaition 6. Inflow to moaei, A= 75, ~ = 75, E = 80 ~a. Outflow, H = 115, I = 115 mga.
29
30 Photo 14- Peak flow condition 7 Inflow to model, A~ 60, ~ ~ 60, E ~ So, F ~ 100 mgd. Outflow, H ~ 100, I ~ 100, J+K ~ 100 mgd. Photo 15- Special flow condition 1. Inflow to model, A= 120,] = 80 mgd. Outflow, H = 100, I ~ 100 mgd.
31 .. \
32 Photo 16 - Special flow condition 2. Outflow, H = 100, I = 100 mgd. Inflow to model, A~ 80, ] = 120 mgd. Photo 17 - Special flow condition 3 Outflow, J+K = 200 mgd. Inflow to model, G = 200 mgd.
33 ,,
34 Photo 18 - Minimum flow condition 10. Inflow to model, 0 ~ so, E ~ S rogd. Outflow, H ~ 27.S, I~ 27.S rogd. Photo 19 - Minimum flow condition 2d. Inflow to model, 0 ~ SO, D ~ So, E ~ S rogd. Outflow, R ~ S2.5, I ~ 52.5 rogd.
35 i c
36 Photo 20 - Average :flow condition 1C. Ini'low to model', C :::: 100, E :::: 15 mgd. Outflow, H:::: 57.2, I:::: 57.2 mgd. Photo 21 - Average :flow condition 2C. Inflow to model, C = 100, D :::: 50, E = 15 mgd. Outflow, H:::: 82.,5, I :::: 82.,5 mgd.
37
38 Photo 22 - Average flow condition 30. Inflow to model, 0 = 100, E = 80 ~d. Outflow, H = 90, I = 90 rogd. Photo 23 - Average flow condition 40. Outflow, H = 7,, I= 75, J+K = 30 rogd. Inflow to model, 0 = 100, F = 80 rogd.

39 i ''
40 Photo 24 - Peak flow condition 10. Inflow to model, 0 ~ 200, E = 80, F ~ 120 mgd. Outflow, H = 100, I ~ 100, J+K = 200 mgd. Photo 25 - Peak flow condition 20. Inflow to model, 0 = 200, E = 80, F ~ 120 mgd. Outflow, H ~ 15,! = 75, J+K ~ 2$0 mgd
41 ", IP...
42 Photo 26 - Peak flow oonaition 30. Inflow to moael, C = 200, E = 80, F = 120, G = 200 mga. Outflow, H = 100, I = 100, J+K = 400 mga. Photo 27 - Peak flow oonaition 40. Inflow to moael, C = 200, E = 80, F = 120 mga. Outflow, H = 15, I = o, J+K = 325 mga
43 '.-. I C, i
44 D Photo 28 ~ Peak flow condition $0. Inflow to model, a ~ 200, E ~ 90, F ~ 180 mgd. Outflow, H ~ 100, I ~ 100, J+K ~ 270 mgd. Photo 29- Peak flow condition 60. Inflow to model, C = 1$0, E =.80 mgd. Outflow, H = 11$, I = 11$ mgd. }
45 ..,.j.
46 Photo 30 - Peak flow condition 70. Inflow to model, C = 120, E == 80, F = 100 mgd. Outflow, H = 100, I = 100, J+K = 100 mgd. I
47
Stage Discharge Tabulation for Only Orifice Flow
 Stage Discharge Tabulation for Only Orifice Flow DEPTH STAGE DISCHARGE (meters) (feet) (meters) (feet) (m 3 /s) (ft 3 /s) 0 0.20 0.40 0.60 0.80 1.00 1.20 1.40 1.60 1.80 2.00 0.7 1.3 2.0 2.6 3.3 3.9 4.6
1.060 Engineering Mechanics II Spring Problem Set 4
 1.060 Engineering Mechanics II Spring 2006 Due on Monday, March 20th Problem Set 4 Important note: Please start a new sheet of paper for each problem in the problem set. Write the names of the group members
Application of an ultrasonic velocity profile monitor in a hydraulic laboratory
 Application of an ultrasonic velocity profile monitor in a hydraulic laboratory Abstract Helmut Knoblauch 1, Roman Klasinc 1, Thomas Geisler 1 Velocity profile measurement using the ultrasound-pulse-doppler
Pressure Head: Pressure head is the height of a column of water that would exert a unit pressure equal to the pressure of the water.
 Design Manual Chapter - Stormwater D - Storm Sewer Design D- Storm Sewer Sizing A. Introduction The purpose of this section is to outline the basic hydraulic principles in order to determine the storm
CHAPTER FOUR Flow Measurement and Control
 CHAPTER FOUR Flow Measurement and Control 4.1 INTRODUCTION Proper treatment plant operation requires knowledge of the rate at which flow enters the plant and controlling the flow between unit processes.
Cavitation occurs whenever the pressure in the flow of water drops to the value of the pressure of the saturated water vapour, pv (at the prevailing
 Cavitation occurs whenever the pressure in the flow of water drops to the value of the pressure of the saturated water vapour, pv (at the prevailing temperature); cavities filled by vapour, and partly
Guo, James C.Y. (1999). "Critical Flow Section in a Collector Channel," ASCE J. of Hydraulic Engineering, Vol 125, No. 4, April.
. Critical Flow Section in a Collector Channel, ASCE J. of Hydraulic Engineering, Vol 125, No. 4, April.") Guo, James C.Y. (1999). "Critical Flow Section in a Collector Channel," ASCE J. of Hydraulic Engineering, Vol 15, No. 4, April. CRITICAL FLOW SECTION IN A COLLECTOR CHANNEL By James C.Y. Guo, PhD, P.E.
Guo, James C.Y. (1999). "Critical Flow Section in a Collector Channel," ASCE J. of Hydraulic Engineering, Vol 15, No. 4, April. CRITICAL FLOW SECTION IN A COLLECTOR CHANNEL By James C.Y. Guo, PhD, P.E.
CVE 372 HYDROMECHANICS EXERCISE PROBLEMS
 VE 37 HYDROMEHNIS EXERISE PROLEMS 1. pump that has the characteristic curve shown in the accompanying graph is to be installed in the system shown. What will be the discharge of water in the system? Take
DEPARTMENT OF CIVIL AND ENVIRONMENTAL ENGINEERING Urban Drainage: Hydraulics. Solutions to problem sheet 2: Flows in open channels
 DEPRTMENT OF CIVIL ND ENVIRONMENTL ENGINEERING Urban Drainage: Hydraulics Solutions to problem sheet 2: Flows in open channels 1. rectangular channel of 1 m width carries water at a rate 0.1 m 3 /s. Plot
Reservoir Oscillations with Through Flow
 American Journal of Environmental Sciences 3 (): 37-42, 27 ISSN 553-345X 27 Science Publications Reservoir Oscillations with Through Flow A. A. Khan 28 Lowry Hall, epartment of Civil Engineering, Clemson
Chapter 3.8: Energy Dissipators. By Dr. Nuray Denli Tokyay
 Chapter 3.8: Energy Dissipators By Dr. Nuray Denli Tokyay 3.1 Introduction A stilling basin is a short length of paved channel placed at the foot of a spillway or any other source of supercritical flow
BRANDON LAKES AVENUE PRE AND POST CONDITIONS DRAINAGE REPORT
 BRANDON LAKES AVENUE PRE AND POST CONDITIONS DRAINAGE REPORT Hillsborough County Public Works County Center, 22nd Floor 601 E. Kennedy Blvd. Tampa, FL 33602 BRANDON LAKES AVENUE DRAINAGE IMPROVEMENTS Capital
WATER DISTRIBUTION NETWORKS
 WATER DISTRIBUTION NETWORKS CE 370 1 Components of Water Supply System 2 1 Water Distribution System Water distribution systems are designed to adequately satisfy the water requirements for a combinations
VARIED FLOW IN OPEN CHANNELS
 Chapter 15 Open Channels vs. Closed Conduits VARIED FLOW IN OPEN CHANNELS Fluid Mechanics, Spring Term 2011 In a closed conduit there can be a pressure gradient that drives the flow. An open channel has
Rucker Pond. Background
 Rucker Pond Background The Rucker Basin consists of two subbasins (East and West) that drain to a single area known as Rucker Pond. Both subbasins have the same hydraulic parameters, but have different
Lateral Inflow into High-Velocity Channels
 Lateral Inflow into High-Velocity Channels by Richard L. Stockstill PURPOSE: This Coastal and Hydraulics Engineering Technical Note (CHETN) investigates lateral flow discharging into a high-velocity channel.
Limited Visual Dam Safety Inspections OA Oahu Reservoir No Oahu, Hawaii
 Limited Visual Dam Safety Inspections OA00137 Oahu Reservoir No. 155 Oahu, Hawaii Prepared by: U.S. ARMY CORPS OF ENGINEERS HONOLULU DISTRICT STATE OF HAWAII DEPARTMENT OF LAND AND NATURAL RESOURCES May
Applied Fluid Mechanics
 Applied Fluid Mechanics 1. The Nature of Fluid and the Study of Fluid Mechanics 2. Viscosity of Fluid 3. Pressure Measurement 4. Forces Due to Static Fluid 5. Buoyancy and Stability 6. Flow of Fluid and
Experiment (4): Flow measurement
: Flow measurement") Experiment (4): Flow measurement Introduction: The flow measuring apparatus is used to familiarize the students with typical methods of flow measurement of an incompressible fluid and, at the same time
Experiment (4): Flow measurement Introduction: The flow measuring apparatus is used to familiarize the students with typical methods of flow measurement of an incompressible fluid and, at the same time
ARTICLE 5 (PART 2) DETENTION VOLUME EXAMPLE PROBLEMS
 DETENTION VOLUME EXAMPLE PROBLEMS") ARTICLE 5 (PART 2) DETENTION VOLUME EXAMPLE PROBLEMS Example 5.7 Simple (Detention Nomograph) Example 5.8 Offsite and Unrestricted Areas (HEC-HMS) Example 5.9 Ponds in Series w/ Tailwater (HEC-HMS) Example
ARTICLE 5 (PART 2) DETENTION VOLUME EXAMPLE PROBLEMS Example 5.7 Simple (Detention Nomograph) Example 5.8 Offsite and Unrestricted Areas (HEC-HMS) Example 5.9 Ponds in Series w/ Tailwater (HEC-HMS) Example
INFLOW DESIGN FLOOD CONTROL SYSTEM PLAN 40 C.F.R. PART PLANT YATES ASH POND 2 (AP-2) GEORGIA POWER COMPANY
 GEORGIA POWER COMPANY") INFLOW DESIGN FLOOD CONTROL SYSTEM PLAN 40 C.F.R. PART 257.82 PLANT YATES ASH POND 2 (AP-2) GEORGIA POWER COMPANY EPA s Disposal of Coal Combustion Residuals from Electric Utilities Final Rule (40 C.F.R.
INFLOW DESIGN FLOOD CONTROL SYSTEM PLAN 40 C.F.R. PART 257.82 PLANT YATES ASH POND 2 (AP-2) GEORGIA POWER COMPANY EPA s Disposal of Coal Combustion Residuals from Electric Utilities Final Rule (40 C.F.R.
NPTEL Quiz Hydraulics
 Introduction NPTEL Quiz Hydraulics 1. An ideal fluid is a. One which obeys Newton s law of viscosity b. Frictionless and incompressible c. Very viscous d. Frictionless and compressible 2. The unit of kinematic
WATER MANAGEMENT REPORT FOR PAGE ESTATES
 WATER MANAGEMENT REPORT FOR PAGE ESTATES SLB Consulting of SW Florida, LLC PO Box 2826 Bonita Springs, FL. 34133 Phone: 239-948-9566 sandra@slbconsult.com C.O.A. # 25395 September 1, 2014 Sandra L. Bottcher
Flow estimations through spillways under submerged tidal conditions
 Computational Methods and Experimental Measurements XIII 137 Flow estimations through spillways under submerged tidal conditions P. D. Scarlatos 1, M. Ansar 2 & Z. Chen 2 1 Department of Civil Engineering
LECTURE 6- ENERGY LOSSES IN HYDRAULIC SYSTEMS SELF EVALUATION QUESTIONS AND ANSWERS
 LECTURE 6- ENERGY LOSSES IN HYDRAULIC SYSTEMS SELF EVALUATION QUESTIONS AND ANSWERS 1. What is the head loss ( in units of bars) across a 30mm wide open gate valve when oil ( SG=0.9) flow through at a
Flow Characteristics and Modelling of Head-discharge Relationships for Weirs
 Chapter 8 Flow Characteristics and Modelling of Head-discharge Relationships for Weirs 8.1 Introduction In Chapters 5 and 7, the formulations of the numerical models for the simulations of flow surface
Hydraulics Prof. Dr. Arup Kumar Sarma Department of Civil Engineering Indian Institute of Technology, Guwahati
 Hydraulics Prof. Dr. Arup Kumar Sarma Department of Civil Engineering Indian Institute of Technology, Guwahati Module No. # 04 Gradually Varied Flow Lecture No. # 07 Rapidly Varied Flow: Hydraulic Jump
EXPERIMENT No.1 FLOW MEASUREMENT BY ORIFICEMETER
 EXPERIMENT No.1 FLOW MEASUREMENT BY ORIFICEMETER 1.1 AIM: To determine the co-efficient of discharge of the orifice meter 1.2 EQUIPMENTS REQUIRED: Orifice meter test rig, Stopwatch 1.3 PREPARATION 1.3.1
The University of Akron. William Troyer The Dr. Gary B. and Pamela S. Williams Honors College
 The University of Akron IdeaExchange@UAkron Honors Research Projects The Dr. Gary B. and Pamela S. Williams Honors College Spring 2018 Applying Control Logic to the End of the Ohio Canal Interceptor Tunnel
Hydraulics and hydrology
 Hydraulics and hydrology - project exercises - Class 4 and 5 Pipe flow Discharge (Q) (called also as the volume flow rate) is the volume of fluid that passes through an area per unit time. The discharge
OPEN CHANNEL FLOW. One-dimensional - neglect vertical and lateral variations in velocity. In other words, Q v = (1) A. Figure 1. One-dimensional Flow
 A. Figure 1. One-dimensional Flow") OPEN CHANNEL FLOW Page 1 OPEN CHANNEL FLOW Open Channel Flow (OCF) is flow with one boundary exposed to atmospheric pressure. The flow is not pressurized and occurs because of gravity. Flow Classification
OPEN CHANNEL FLOW Page 1 OPEN CHANNEL FLOW Open Channel Flow (OCF) is flow with one boundary exposed to atmospheric pressure. The flow is not pressurized and occurs because of gravity. Flow Classification
Visualization of flow pattern over or around immersed objects in open channel flow.
 EXPERIMENT SEVEN: FLOW VISUALIZATION AND ANALYSIS I OBJECTIVE OF THE EXPERIMENT: Visualization of flow pattern over or around immersed objects in open channel flow. II THEORY AND EQUATION: Open channel:
Chapter 8: Flow in Pipes
 Objectives 1. Have a deeper understanding of laminar and turbulent flow in pipes and the analysis of fully developed flow 2. Calculate the major and minor losses associated with pipe flow in piping networks
R09. d water surface. Prove that the depth of pressure is equal to p +.
 Code No:A109210105 R09 SET-1 B.Tech II Year - I Semester Examinations, December 2011 FLUID MECHANICS (CIVIL ENGINEERING) Time: 3 hours Max. Marks: 75 Answer any five questions All questions carry equal
CIE4491 Lecture. Hydraulic design
 CIE4491 Lecture. Hydraulic design Marie-claire ten Veldhuis 19-9-013 Delft University of Technology Challenge the future Hydraulic design of urban stormwater systems Focus on sewer pipes Pressurized and
57:020 Mechanics of Fluids and Transfer Processes CONSERVATION OF MASS, LINEAR MOMENTUM, AND ENERGY IN A SLUICE GATE FLOW. dt dt. d ( momentum.
 57: Mechani of Fluids and Transfer Processes CONSERVATION OF MASS, LINEAR MOMENTUM, AND ENERGY IN A SLUICE GATE FLOW Purpose To measure the total piezometric pressure at various locations along a vertical
Rock Sizing for Waterway & Gully Chutes
 Rock Sizing for Waterway & Gully Chutes WATERWAY MANAGEMENT PRACTICES Photo 1 Rock-lined waterway chute Photo 2 Rock-lined gully chute 1. Introduction A waterway chute is a stabilised section of channel
5 ENERGY EQUATION OF FLUID MOTION
 5 ENERGY EQUATION OF FLUID MOTION 5.1 Introduction In order to develop the equations that describe a flow, it is assumed that fluids are subject to certain fundamental laws of physics. The pertinent laws
Atmospheric pressure. 9 ft. 6 ft
 Name CEE 4 Final Exam, Aut 00; Answer all questions; 145 points total. Some information that might be helpful is provided below. A Moody diagram is printed on the last page. For water at 0 o C (68 o F):
Advanced /Surface Hydrology Dr. Jagadish Torlapati Fall 2017 MODULE 2 - ROUTING METHODS
 Routing MODULE - ROUTING METHODS Routing is the process of find the distribution of flow rate and depth in space and time along a river or storm sewer. Routing is also called Flow routing or flood routing.
Modeling Siphon Weirs within EXTRAN
 Modeling Siphon Weirs within EXTRAN William James and Brett C. Young This chapter presents the background for new code for simulating self-priming siphon-weirs within the Extended Transport (EXTRAN) module
Tanjung Priok GFPPEP. Presentation and discussion, 22 October 2009 PT. PLN (Persero) Jasa Enjiniring Office Jl. KS Tubun I/2 Petamburan, Jakarta
 Jasa Enjiniring Office Jl. KS Tubun I/2 Petamburan, Jakarta") Tanjung Priok GFPPEP Presentation and discussion, 22 October 2009 PT. PLN (Persero) Jasa Enjiniring Office Jl. KS Tubun I/2 Petamburan, Jakarta prepared by Department of Civil and Environmental Engineering
Tanjung Priok GFPPEP Presentation and discussion, 22 October 2009 PT. PLN (Persero) Jasa Enjiniring Office Jl. KS Tubun I/2 Petamburan, Jakarta prepared by Department of Civil and Environmental Engineering
PRELIMINARY CULVERT ANALYSIS REPORT FOR CULVERT NO. 008-C OREGON AVENUE OVER PINEHURST CREEK
 PRELIMINARY CULVERT ANALYSIS REPORT FOR CULVERT NO. 008-C OREGON AVENUE OVER PINEHURST CREEK Prepared for The District of Columbia Department of Transportation Washington, D.C. Prepared by Parsons Transportation
Closed duct flows are full of fluid, have no free surface within, and are driven by a pressure gradient along the duct axis.
 OPEN CHANNEL FLOW Open channel flow is a flow of liquid, basically water in a conduit with a free surface. The open channel flows are driven by gravity alone, and the pressure gradient at the atmospheric
Free Flow Below Skew Sluice Gate
 International Journal of Engineering Research and Development e-issn: 2278-67X, p-issn: 2278-8X, www.ijerd.com Volume, Issue 3 (March 24), PP.44-52 Talib Mansoor Civil Engineering Department, Aligarh Muslim
Closed duct flows are full of fluid, have no free surface within, and are driven by a pressure gradient along the duct axis.
 OPEN CHANNEL FLOW Open channel flow is a flow of liquid, basically water in a conduit with a free surface. The open channel flows are driven by gravity alone, and the pressure gradient at the atmospheric
Mass of fluid leaving per unit time
 5 ENERGY EQUATION OF FLUID MOTION 5.1 Eulerian Approach & Control Volume In order to develop the equations that describe a flow, it is assumed that fluids are subject to certain fundamental laws of physics.
PHYSICAL MODELING FOR SIDE-CHANNEL WEIRS
 PHYSICAL MODELING FOR SIDE-CHANNEL WEIRS by Ka-Leung Lee and E. R. Holley Center for Research in Water Resources The University of Texas at Austin Austin, TX 7871 USA CRWR Online Report 0- http://www.crwr.utexas.edu/online.shtml
FACULTY OF CHEMICAL & ENERGY ENGINEERING FLUID MECHANICS LABORATORY TITLE OF EXPERIMENT: MINOR LOSSES IN PIPE (E4)
") FACULTY OF CHEMICAL & ENERGY ENGINEERING FLUID MECHANICS LABORATORY TITLE OF EXPERIMENT: MINOR LOSSES IN PIPE (E4) 1 1.0 Objectives The objective of this experiment is to calculate loss coefficient (K
FACULTY OF CHEMICAL & ENERGY ENGINEERING FLUID MECHANICS LABORATORY TITLE OF EXPERIMENT: MINOR LOSSES IN PIPE (E4) 1 1.0 Objectives The objective of this experiment is to calculate loss coefficient (K
HYDRAULIC EFFICIENCY OF GRATE AND CURB INLETS FOR URBAN STORM DRAINAGE
 HYDRAULIC EFFICIENCY OF GRATE AND CURB INLETS FOR URBAN STORM DRAINAGE Prepared for The Urban Drainage and Flood Control District Prepared by Brendan C. Comport Christopher I. Thornton Amanda L. Cox December
HISTORY OF CONSTRUCTION FOR EXISTING CCR SURFACE IMPOUNDMENT PLANT GASTON ASH POND 40 CFR (c)(1)(i) (xii)
(1)(i) (xii)") HISTORY OF CONSTRUCTION FOR EXISTING CCR SURFACE IMPOUNDMENT PLANT GASTON ASH POND 40 CFR 257.73(c)(1)(i) (xii) (i) Site Name and Ownership Information: Site Name: E.C. Gaston Steam Plant Site Location:
HISTORY OF CONSTRUCTION FOR EXISTING CCR SURFACE IMPOUNDMENT PLANT GASTON ASH POND 40 CFR 257.73(c)(1)(i) (xii) (i) Site Name and Ownership Information: Site Name: E.C. Gaston Steam Plant Site Location:
Study of the rate of sediment trapping and water loss in the vortex tube structure at different placement angles
 Journal of Scientific Research and Development 2 (5): 4-1, 2015 Available online at www.jsrad.org ISSN 1115-5 2015 JSRAD Study of the rate of sediment trapping and water loss in the vortex tube structure
CHAPTER THREE FLUID MECHANICS
 CHAPTER THREE FLUID MECHANICS 3.1. Measurement of Pressure Drop for Flow through Different Geometries 3.. Determination of Operating Characteristics of a Centrifugal Pump 3.3. Energy Losses in Pipes under
Mr. Michael Malone CPS Energy 145 Navarro Street San Antonio, Texas Project No
 January 17, 2018 Mr. Michael Malone 145 Navarro Street San Antonio, Texas 78205 Project No. 0337367 Environmental Resources Management CityCentre Four 840 West Sam Houston Pkwy N. Suite 600 Houston, Texas
Chapter Four fluid flow mass, energy, Bernoulli and momentum
 4-1Conservation of Mass Principle Consider a control volume of arbitrary shape, as shown in Fig (4-1). Figure (4-1): the differential control volume and differential control volume (Total mass entering
CHAPTER 3 BASIC EQUATIONS IN FLUID MECHANICS NOOR ALIZA AHMAD
 CHAPTER 3 BASIC EQUATIONS IN FLUID MECHANICS 1 INTRODUCTION Flow often referred as an ideal fluid. We presume that such a fluid has no viscosity. However, this is an idealized situation that does not exist.
White Paper FINAL REPORT AN EVALUATION OF THE HYDRODYNAMICS MECHANISMS WHICH DRIVE THE PERFORMANCE OF THE WESTFALL STATIC MIXER.
 White Paper FINAL REPORT AN EVALUATION OF THE HYDRODYNAMICS MECHANISMS WHICH DRIVE THE PERFORMANCE OF THE WESTFALL STATIC MIXER Prepared by: Dr. Thomas J. Gieseke NUWCDIVNPT - Code 8233 March 29, 1999
Sprinkler Irrigation
 Sprinkler Irrigation Definition Pressurized irrigation through devices called sprinklers Sprinklers are usually located on pipes called laterals Water is discharged into the air and hopefully infiltrates
Gradually Varied Flow I+II. Hydromechanics VVR090
 Gradually Varied Flow I+II Hydromechanics VVR090 Gradually Varied Flow Depth of flow varies with longitudinal distance. Occurs upstream and downstream control sections. Governing equation: dy dx So Sf
Nine Minimum Controls No. 2
 Nine Minimum Controls No. 2 2.0 MAXIMIZATION OF STORAGE IN THE COLLECTION SYSTEM 2.1 OVERVIEW The 2 nd NMC is titled Maximization of Storage in the Collection system. EPA s NMC Guidance explains that this
Hydraulic model study of sedimentation at the allentown water supply intake, Lehigh River.
 Lehigh University Lehigh Preserve Fritz Laboratory Reports Civil and Environmental Engineering 1987 Hydraulic model study of sedimentation at the allentown water supply intake, Lehigh River. Richard N.
Sediment Control Practices. John Mathews Ohio Dept. of Natural Resources, Division of Soil and Water Resources
 Sediment Control Practices John Mathews Ohio Dept. of Natural Resources, Division of Soil and Water Resources Practices Treat the Largest Soil Particles Sand Sand Silt Clay Treated Untreated Settleable
Rock Sizing for Small Dam Spillways
 Rock Sizing for Small Dam Spillways STORMWATER MANAGEMENT PRACTICES Photo 1 Rock-lined spillway on a construction site sediment basin Photo 2 Rock-lined spillway on a small farm dam 1. Introduction A chute
9. Flood Routing. chapter Two
 9. Flood Routing Flow routing is a mathematical procedure for predicting the changing magnitude, speed, and shape of a flood wave as a function of time at one or more points along a watercourse (waterway
Plant Design LECTURE 8: REBOILER CIRCUIT DESIGN. Daniel R. Lewin Department of Chemical Engineering Technion, Haifa, Israel
 054410 Plant Design LECTURE 8: REBOILER CIRCUIT DESIGN Daniel R. Lewin Department of Chemical Engineering Technion, Haifa, Israel Ref: Kern, R. Thermosyphon Reboiler Piping Simplified, Hydrocarbon Processing,
U.S. ARMY CORPS OF ENGINEERS
 CORPS FACTS Regulating Mississippi River Navigation Pools U.S. ARMY CORPS OF ENGINEERS BUILDING STRONG Historical Background Federal improvements in the interest of navigation on the Mississippi River
P10.5 Water flows down a rectangular channel that is 4 ft wide and 3 ft deep. The flow rate is 15,000 gal/min. Estimate the Froude number of the flow.
 P10.5 Water flows down a rectangular channel that is 4 ft wide and ft deep. The flow rate is 15,000 gal/min. Estimate the Froude number of the flow. Solution: Convert the flow rate from 15,000 gal/min
Laboratory experiences on open channel flow (in collaboration with Dr. Ing. Luca Milanesi)
") Classwork 8 Laboratory experiences on open channel flow (in collaboration with Dr. Ing. Luca Milanesi) Why a practical lesson on open channel flow? In the first part of the course we studied open channel
Classwork 8 Laboratory experiences on open channel flow (in collaboration with Dr. Ing. Luca Milanesi) Why a practical lesson on open channel flow? In the first part of the course we studied open channel
FE Exam Fluids Review October 23, Important Concepts
 FE Exam Fluids Review October 3, 013 mportant Concepts Density, specific volume, specific weight, specific gravity (Water 1000 kg/m^3, Air 1. kg/m^3) Meaning & Symbols? Stress, Pressure, Viscosity; Meaning
EFFECT OF BAFFLE BLOCKS ON THE PERFORMANCE OF RADIAL HYDRAULIC JUMP
 Fourth International Water Technology Conference IWTC 99, Alexandria, Egypt 255 EFFECT OF BAFFLE BLOCKS ON THE PERFORMANCE OF RADIAL HYDRAULIC JUMP O. S. Rageh Irrigation & Hydraulics Dept., Faculty of
Flow Measurement in Pipes and Ducts COURSE CONTENT
 Flow Measurement in Pipes and Ducts Dr. Harlan H. Bengtson, P.E. COURSE CONTENT 1. Introduction This course is about measurement of the flow rate of a fluid flowing under pressure in a closed conduit.
DESIGN AND CONSTRUCTION OF A WATER TUNNEL. Stephen C. Ko
 i DESGN AND CONSTRUCTON OF A WATER TUNNEL By Stephen C. Ko This work has been carried out as a part of a grant from the National Science Foundation for the development of fluid mechanics laboratory equipments
Attachment B to Technical Memorandum No.2. Operations Plan of Ross Valley Detention Basins
 Attachment B to Technical Memorandum No.2 Operations Plan of Ross Valley Detention Basins Operations Plan of Ross Valley Detention Basins Stetson Engineers Inc. January 26, 2011 1.0 Introduction Achieving
Rock Sizing for Batter Chutes
 Rock Sizing for Batter Chutes STORMWATER MANAGEMENT PRACTICES Photo 1 Rock-lined batter chute Photo 2 Rock-lined batter chute 1. Introduction In the stormwater industry a chute is a steep drainage channel,
Estimating Sewage System Flows
 9 Estimating Sewage System Flows DWSD Wholesale Sewer Rates 201 In this module, you will learn the sources of dry and wet weather flows and how these flows are estimated. Three different tools are used
ME332 FLUID MECHANICS LABORATORY (PART II)
") ME332 FLUID MECHANICS LABORATORY (PART II) Mihir Sen Department of Aerospace and Mechanical Engineering University of Notre Dame Notre Dame, IN 46556 Version: April 2, 2002 Contents Unit 5: Momentum transfer
ME332 FLUID MECHANICS LABORATORY (PART II) Mihir Sen Department of Aerospace and Mechanical Engineering University of Notre Dame Notre Dame, IN 46556 Version: April 2, 2002 Contents Unit 5: Momentum transfer
NUMERICAL SIMULATION OF OPEN CHANNEL FLOW BETWEEN BRIDGE PIERS
 TASK QUARTERLY 15 No 3 4, 271 282 NUMERICAL SIMULATION OF OPEN CHANNEL FLOW BETWEEN BRIDGE PIERS MICHAŁ SZYDŁOWSKI Faculty of Civil and Environmental Engineering, Gdansk University of Technology, Narutowicza
Pipe Flow. Lecture 17
 Pipe Flow Lecture 7 Pipe Flow and the Energy Equation For pipe flow, the Bernoulli equation alone is not sufficient. Friction loss along the pipe, and momentum loss through diameter changes and corners
Open Channel Hydraulics III - Sharpcrested
 PDHonline Course H140 (2 PDH) Open Channel Hydraulics III - Sharpcrested Weirs Instructor: Harlan H. Bengtson, Ph.D., PE 2012 PDH Online PDH Center 5272 Meadow Estates Drive Fairfax, VA 22030-6658 Phone
Objectives. Conservation of mass principle: Mass Equation The Bernoulli equation Conservation of energy principle: Energy equation
 Objectives Conservation of mass principle: Mass Equation The Bernoulli equation Conservation of energy principle: Energy equation Conservation of Mass Conservation of Mass Mass, like energy, is a conserved
Part 2: Introduction to Open-Channel Flow SPRING 2005
 Part : Introduction to Open-Cannel Flow SPRING 005. Te Froude number. Total ead and specific energy 3. Hydraulic jump. Te Froude Number Te main caracteristics of flows in open cannels are tat: tere is
1.060 Engineering Mechanics II Spring Problem Set 8
 1.060 Engineering Mechanics II Spring 2006 Due on Monday, May 1st Problem Set 8 Important note: Please start a new sheet of paper for each problem in the problem set. Write the names of the group members
CFD Modeling for Structure Designs in Environmental Impacts Mitigation
 CFD Modeling for Structure Designs in Environmental Impacts Mitigation June 05 Navid Nekouee, Hugo Rodriguez and Steven Davie Environmental Impact Mitigation Design Savannah Harbor Expansion Project (SHEP)
FE Fluids Review March 23, 2012 Steve Burian (Civil & Environmental Engineering)
") Topic: Fluid Properties 1. If 6 m 3 of oil weighs 47 kn, calculate its specific weight, density, and specific gravity. 2. 10.0 L of an incompressible liquid exert a force of 20 N at the earth s surface.
Topic: Fluid Properties 1. If 6 m 3 of oil weighs 47 kn, calculate its specific weight, density, and specific gravity. 2. 10.0 L of an incompressible liquid exert a force of 20 N at the earth s surface.
Storm Water Best Management Practice: Development of Debris Filtering Structure for Supercritical Flow
 Storm Water Best Management Practice: Development of Debris Filtering Structure for Supercritical Flow Jungseok Ho 1, Todd Marti 2, and Julie Coonrod 3 1 Department of Civil Engineering, University of
CIVE HYDRAULIC ENGINEERING PART I Pierre Julien Colorado State University
 CIVE 401 - HYDRAULIC ENGINEERING PART I Pierre Julien Colorado State University Problems with and are considered moderate and those with are the longest and most difficult. In 2018 solve the problems with
Lab 7: Nonuniform Flow and Open Channel Transitions
 CE 3620: Water Resources Engineering Spring 2015 Lab 7: Nonuniform Flow and Open Channel Transitions BACKGROUND An open channel transition may be defined as a change either in the direction, slope, or
Hydraulic Considerations for Citrus Microirrigation Systems 1
 Cir1425 Hydraulic Considerations for Citrus Microirrigation Systems 1 Brian Boman and Sanjay Shukla 2 Introduction Hydraulics is the study of the behavior of liquids as they move through channels or pipes.
3301 East 120 th Avenue Assited Living & Memory Care
 UTILITY REPORT FOR 3301 East 120 th Avenue Assited Living & Memory Care 1 st Submittal January 23, 2016 2 nd Submittal March 04, 2016 Prepared for: 3301 E. 120 th Ave, LLC. 8200 E. Maplewood Ave., Suite
Lecture Note for Open Channel Hydraulics
 Chapter -one Introduction to Open Channel Hydraulics 1.1 Definitions Simply stated, Open channel flow is a flow of liquid in a conduit with free space. Open channel flow is particularly applied to understand
Coarse Sediment Traps
 Coarse Sediment Traps SEDIMENT CONTROL TECHNIQUE Type 1 System Sheet Flow Sandy Soils Type 2 System [1] Concentrated Flow Clayey Soils [2] Type 3 System Supplementary Trap Dispersive Soils [1] Though primarily
STEADY FLOW THROUGH PIPES DARCY WEISBACH EQUATION FOR FLOW IN PIPES. HAZEN WILLIAM S FORMULA, LOSSES IN PIPELINES, HYDRAULIC GRADE LINES AND ENERGY
 STEADY FLOW THROUGH PIPES DARCY WEISBACH EQUATION FOR FLOW IN PIPES. HAZEN WILLIAM S FORMULA, LOSSES IN PIPELINES, HYDRAULIC GRADE LINES AND ENERGY LINES 1 SIGNIFICANCE OF CONDUITS In considering the convenience
Head loss coefficient through sharp-edged orifices
 Head loss coefficient through sharp-edged orifices Nicolas J. Adam, Giovanni De Cesare and Anton J. Schleiss Laboratory of Hydraulic Constructions, Ecole Polytechnique fédérale de Lausanne, Lausanne, Switzerland
[1] Performance of the sediment trap depends on the type of outlet structure and the settling pond surface area.
![[1] Performance of the sediment trap depends on the type of outlet structure and the settling pond surface area.](/thumbs/76/74245181.jpg "[1] Performance of the sediment trap depends on the type of outlet structure and the settling pond surface area.") Sediment Trench SEDIMENT CONTROL TECHNIQUE Type 1 System Sheet Flow Sandy Soils Type 2 System [1] Concentrated Flow Clayey Soils Type 3 System [1] Supplementary Trap Dispersive Soils [1] Performance of
Sediment Trench SEDIMENT CONTROL TECHNIQUE Type 1 System Sheet Flow Sandy Soils Type 2 System [1] Concentrated Flow Clayey Soils Type 3 System [1] Supplementary Trap Dispersive Soils [1] Performance of
Sudden Expansion Exercise
 Sudden Expansion Exercise EAS 361, Fall 2009 Before coming to the lab, read sections 1 through 4 of this document. Engineering of Everyday Things Gerald Recktenwald Portland State University gerry@me.pdx.edu
FHWA Headloss in InfoWorks ICM. August 2013
 FHWA Headloss in InfoWorks ICM August 2013 Innovyze 1 August 2013 Contents FHWA Headloss... 1 Contents... 2 1. Introduction... 3 2. Step 1, Calculation of E ai... 3 3. Step 2, Adjustment of E ai to Provide
WP2.1 BREACH FORMATION LARGE SCALE EMBANKMENT FAILURE
 WP2. BREACH FORMATION LARGE SCALE EMBANKMENT FAILURE Kjetil Arne Vaskinn, Sweco Gröner Norway Aslak Løvoll, Norconsult AS Norway Kaare Höeg, Norwegian Geotechnical Institute (NGI), Norway WP2. BREACH FORMATION
Fluid Mechanics Prof. T.I. Eldho Department of Civil Engineering Indian Institute of Technology, Bombay. Lecture - 17 Laminar and Turbulent flows
 Fluid Mechanics Prof. T.I. Eldho Department of Civil Engineering Indian Institute of Technology, Bombay Lecture - 17 Laminar and Turbulent flows Welcome back to the video course on fluid mechanics. In
State Water Survey Division SURFACE WATER SECTION
 State Water Survey Division SURFACE WATER SECTION AT THE UNIVERSITY OF ILLINOIS Illinois Department of Energy and Natural Resources SWS Miscellaneous Publication 88 SEDIMENTATION OF POOL 19 ON THE MISSISSIPPI
FLUID MECHANICS D203 SAE SOLUTIONS TUTORIAL 2 APPLICATIONS OF BERNOULLI SELF ASSESSMENT EXERCISE 1
 FLUID MECHANICS D203 SAE SOLUTIONS TUTORIAL 2 APPLICATIONS OF BERNOULLI SELF ASSESSMENT EXERCISE 1 1. A pipe 100 mm bore diameter carries oil of density 900 kg/m3 at a rate of 4 kg/s. The pipe reduces