The weather and climate as problems in physics: scale invariance and multifractals. S. Lovejoy McGill, Montreal
|
|
|
- Amie Willis
- 5 years ago
- Views:
Transcription
1 The weather and climate as problems in physics: scale invariance and multifractals S. Lovejoy McGill, Montreal McGill April 13, 2012


2 Required reading for this course The Weather and Climate Emergent Laws and Multifractal Cascades SHAUN LOVEJOY and DANIEL SCHERTZER (in press, Oct. 2012)
3 The Weather 3

4 Meteorologists
5 The Emergence of physical laws Quantum mechanics Statistical mechanics General Relativity Special Relativity Large scales (usually) Large numbers of particles Low energy mass density Classical Mechanics Continuum mechanics, Fluid mechanics thermodynamics Special Relativity Classical (Galilean) Relativity Low level (fundamental) Velocities << speed of light high level (simpler if applicable)
6 Example: The emergence of Thermodynamics from Newton s laws Newton s laws: Thermodynamics: F=ma F=ma F=ma Large number of particles First law: conservation of energy Second law: increase in entropy ex.: Boyle s law: (pressure) x (volume) = constant Low level, (difficult to handle for many particles) High level (Valid when many particles are present)


7 Pioneers of turbulence Richardson Kolmogorov


8 Corrsin Obukhov Ralph Bolgiano, Jr
 Fluid mechanics Low level (fundamental) Strong stirring (nonlinearity) Laws of turbulence Classical: Richardson,")
9 The emergence of turbulence dynamics (Classical) Spaghetti Vortices in strongly turbulent fluid (M. Wiczek, numerical simulation, 2010) Fluid mechanics Low level (fundamental) Strong stirring (nonlinearity) Laws of turbulence Classical: Richardson, Kolmogorov, Corrsin, Obukhov, Bolgiano High level
10 Emergent laws reduce seeming complexity to simplicity at another level


11 Mandelbrot

12 Complex? Blowing up gives the same type of shapes The Mandelbrot set ( self-similar, scale invariant, fractal)
13 Or simple? Generating the Mandelbrot set -Take a number. -Multiply it by itself. -Add a constant. -Repeat. (I forgot to mention: take a COMPLEX number)


14 Complex? Δx 20 steps: 1:1 20 steps: 5:1 200 steps: 1:1 200 steps: 5:1 Drunkard s walk 20,000 steps: 1:1 20,000 steps: 5:1
15 Or simple? (distance) x (distance) = number of bars visited From initial bar Average number of bars visited (or displacements made) (Brownian motion)
 1700 mm/s 1600 1500 1400 1300 1200 1100 0 512 1024 1536 2048 t Infra Red satellite effective temperatures,")
16 Complex? or simple? v(t) 1700 mm/s t Infra Red satellite effective temperatures, January 16, second of wind data (roof of Rutherford building, McGill) The Atmosphere
17 Brute force

18 Atmosphere: Laws of Fluid mechanics (low level) wind Earth angular velocity Gravitational potential Specific volume=1/ρ pressure Friction Specific heat temperature Heating rate density Gas constant Governing atmospheric laws
 Discretization of the")
19 Brute force numerical solution of the equations (2) Discretization of the equations
 Earth system")
20 Brute force numerical solution of the equations (3) Earth system modelling
21 Or simplicity?
22 Atmosphere: Emergent laws (high level) Power law Fluctuations (turbulent flux) x (scale) H Differences, tendencies, wavelet coefficients Cascading Turbulent flux Size: Anisotropic Space-time Scale function Fluctuation /conservation exponent These laws are scale Fluctuation = change in time and/or space Scale = size invariant Turbulent flux = strength of stirring

23 Which Richardson? The father of Numerical Weather Prediction

24 The father of numerical weather prediction 1922

25 The weather prediction factory (artist: Francois Schuiten)

26 Richardson s numerical grid for integrating Each column was divided into 5 vertical cells and defined 7 quantities: pressure, temperature, density, water content, 3 velocity components It took me the best part of six weeks to draw up the computing forms and to work out the new distribution in two vertical columns for the first time. My office was a heap of hay in cold rest billet. With practice the work of an average computer might go perhaps ten times faster. If the time-step were 3 hours, then 32 individuals could just compute two-points so as to keep up with the weather. -Richardson 1922

27 ... or the grandfather of cascades? Weather prediction by Numerical Process 1922, p.66
28 Scale by scale simplicity: cascades CASCADE LEVELS 0 -- l 0 x ε y 1 -- l 0 / λ 1 multiplication by 4 independent random (multiplicative) increments n -- 2 l 0 / λ n l 0 / λ multiplication by 16 independent random (multiplicative) increments
29 W(t) Does the wind have a velocity? Although at first sight strange, the question grows upon acquaintance - Richardson 1926 v(t) mm/s t second of wind data (roof of Rutherford building, McGill) t 2048 Richardson suggested that the trajectory of a particle could be like a Wierstrass function (1872)
30 Scale invariance and fractals
31 λ Η blowup Wierstrass function showing scale invariance under anisotropic blowup (H=1/3 in this example, λ=3) -1-2 λ λ=3
32 Cantor set Let us start with: and let us iterate: A small part is same as the whole if blown up by a factor 3 ( scale invariance, selfsimilarity ) x3
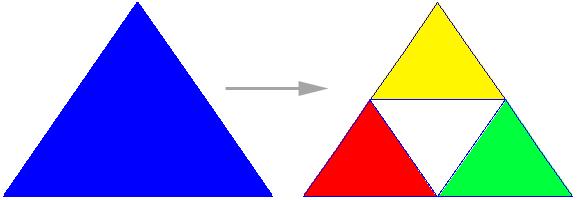

33 Sierpinski Triangle 1 2
34 Let us start with: Koch snowflake and let us iterate:


35 Sierpinski Pyramid First iteration: 10 th iteration:


36 Menger Sponge motif: iterations:
37 CASCADES Parent eddy Homogeneous Daughter eddies Grand-daughter eddies Intermittent

38 β-model Fractal set active calm
39 Cascades and Multifractals
40 Aircraft temperature transect (12km altitude) - 49 Temperature ( o C) x (km) Turbulent flux (gradient of the above) 1 σ
41 Temperature turbulent flux ε at 280m resolution High to low Resolution: degrading by factors of 4 20 ε ε ε ε ε ε ε x x x x x x km x
 ε 0 ε 1 ( α")
42 Cascades and Multifractals Simulations: adding small scale details (low resolution to high) ε 0 ε 1 ( α model )
43 BARE ENERGY 1. Cascade level 1 bare density DRESSED ENERGY FLUX FLUX DENSITY DENSITY 1. FIELDS FIELDS 1. Cascades Multifractal Cascade level 3 bare density 1. Cascade level 4 bare density Dressed density averaged over 16x16 1. Dressed density averaged over 8x Cascade level 5 bare density Dressed density averaged over 4x Cascade level 6 bare density y ε x 1. y Π Dressed density averaged over 2x2 x Cascade level 7 bare density
44 0.4 Log 10 M q 0.3 EW wind M q λ K ( q) q= Log 10 M q NS wind Cascades work!! q= km km Log 10 M q Temp q= km 200km Log 10 λ q=2 q= Log 10 λ 20000km 20000km Log 10 M q h s humidity 200km km q=1.5 q=2 q=1.5
")


45 Cloud liquid water (top) Cascade modeling: clouds and radiative transfer Cloud top visible Cloud top, infra red Cloud liquid water (side) Cloud bottom visible

46

47 Cascade Simulations
48 The Climate 48


49 The produc+on of maple syrup is affected by global warming... Instead... have you tried my delicious 100% Canadian syrup on your pancakes? Tar sands syrup
50 What is the climate? "Climate is what you expect, weather is what you get. -Farmers Almanac Climate is conventionally defined as the long-term statistics of the weather. -Committee on Radiative Forcing Effects on Climate, 2005 US National Academy of Science
51 3 Three regimes: three types of variability: not two! Temperature T/ 10 Fluctuations Growing Climate (10-30 yrs to 50,000 yrs) Low frequency weather (10 days to yrs) Fluctuations Decreasing 1 Century, Vostok, 20-92kyr BP 20 days, 75 o N,100 o W, Weather (up to 10 days) 0-2 Fluctuations Growing hour, Lander, 10 Feb.-12 March, 2005 t
52 ΔT (K) Today Holocene Vostok core (Antarctica 75 o S) 130 yr resolution (average) Age (kyr) yr resolution Last four Glacials 600yr resolution
53 18 O - 34 Paleotemperatures: GRIP (GReenland Ice core Project), summit location ( 75 o N), High (5.2 yr ) resolution section Dansgaard events K Holocene Last glacial NOW Age (kyr BP) 53
54 Briffa Mann Esper Jones -0.2 Crowley Ljundquist -0.4 Moburg T(K) 0.2 Multiproxy Temperatures Date Huang post 2003 (30 year average applied) Eight Reconstructions of the Northern hemisphere temperatures
55 T (K) Global temperature anomaly mean and spread from three different instrumental estimates Date -0.4
56 Do Global Climate models predict... The climate?...or low frequency weather? 56
57 average temperature change O C O C Data Atmosphere (3km) O C O C Mean surface IPSL 0.1 C 1 year 10 years 100 years GCM Log 10 Δt (yrs)
58 average temperature change o C 0.5 Global Temperature Vostok (Antarctic) ±3K ±2K days 1 year 100 years years Log 10 Δt (yrs) 1 o C yrs 20CR global scale -0.5 Global Surface 0.1 o C >2003 multiproxies, weather Low frequency weather climate GCM s Low frequency climate
59 Implications for global warming By comparing model and natural variability, we found that GCM s seem to be missing a long-time mechanism of internal variability such as land-ice. Anthropogenic contributions to 20th warming and 21st C warming scenarios may thus be either over - or under estimated. 59

60

61 Conclusions 1. Low level laws: complex (Fluid mechanics) High level laws simplicity (emergent turbulent laws) 2. Emergent Atmospheric laws are power laws Fluctuations are scaling, their exponents are scale invariant 3. There are three different regimes: Weather to 10 days, Low frequency weather to yrs, Climate to kyrs. 4. Without special forcing GCM s produce low frequency weather not climate type variability
Do GCM s predict the Climate... or low frequency weather?
 Do GCM s predict the Climate... or low frequency weather? CMOS, Montreal May 29, 2012 S. Lovejoy, McGill, Physics Avec D. Schertzer, Paris Tech D. Varon, McGill, Physics Atmospheric dynamics: Three scaling
Low frequency weather and the emergence of the Climate
 10/25/11 1 1 Low frequency weather and the emergence of the Climate 2 3 4 5 6 7 8 9 10 11 12 13 14 15 16 17 18 19 20 21 22 23 24 25 26 S. Lovejoy 1, D. Schertzer 2,3 1 Physics, McGill University, 3600
5. General Circulation Models
 5. General Circulation Models I. 3-D Climate Models (General Circulation Models) To include the full three-dimensional aspect of climate, including the calculation of the dynamical transports, requires
Torben Königk Rossby Centre/ SMHI
 Fundamentals of Climate Modelling Torben Königk Rossby Centre/ SMHI Outline Introduction Why do we need models? Basic processes Radiation Atmospheric/Oceanic circulation Model basics Resolution Parameterizations
The Horizontal cascade structure of atmospheric. fields determined from aircraft data
 6/3/09 1 1 2 The Horizontal cascade structure of atmospheric fields determined from aircraft data 3 4 5 6 7 8 9 S. Lovejoy 1, A. F. Tuck 2, D. Schertzer 3,4 1 Physics, McGill University, 3600 University
The effect of turbulence and gust on sand erosion and dust entrainment during sand storm Xue-Ling Cheng, Fei Hu and Qing-Cun Zeng
 The effect of turbulence and gust on sand erosion and dust entrainment during sand storm Xue-Ling Cheng, Fei Hu and Qing-Cun Zeng State Key Laboratory of Atmospheric Boundary Layer Physics and Atmospheric
/ Past and Present Climate
 MIT OpenCourseWare http://ocw.mit.edu 12.842 / 12.301 Past and Present Climate Fall 2008 For information about citing these materials or our Terms of Use, visit: http://ocw.mit.edu/terms. Ice Sheet Paleoclimatology
Intermittency, Fractals, and β-model
 Intermittency, Fractals, and β-model Lecture by Prof. P. H. Diamond, note by Rongjie Hong I. INTRODUCTION An essential assumption of Kolmogorov 1941 theory is that eddies of any generation are space filling
Climate models. René D. Garreaud. Departement of Geophysics Universidad de Chile
 Climate models René D. Garreaud Departement of Geophysics Universidad de Chile www.dgf.uchile.cl/rene My first toy model A system of coupled, non-linear algebraic equations X (t) = A X (t-1) Y (t) B Z
Table of Contents. Chapter: Atmosphere. Section 1: Earth's Atmosphere. Section 2: Energy Transfer in the Atmosphere. Section 3: Air Movement
 Table of Contents Chapter: Atmosphere Section 1: Earth's Atmosphere Section 2: Energy Transfer in the Atmosphere Section 3: Air Movement Table of Contents Chapter 4: Atmosphere Section 1: Earth's Atmosphere
Patterns in Nature 8 Fractals. Stephan Matthiesen
 Patterns in Nature 8 Fractals Stephan Matthiesen How long is the Coast of Britain? CIA Factbook (2005): 12,429 km http://en.wikipedia.org/wiki/lewis_fry_richardson How long is the Coast of Britain? 12*200
The temporal cascade structure of reanalyses and Global Circulation models
 The temporal cascade structure of reanalyses and Global Circulation models J. Stolle 1, S. Lovejoy 1, D. Schertzer 2,3 (1) Physics, McGill University, 3600 University St., Montreal, Que. H3A 2T8, Canada
Passive Scalars in Stratified Turbulence
 GEOPHYSICAL RESEARCH LETTERS, VOL.???, XXXX, DOI:10.1029/, Passive Scalars in Stratified Turbulence G. Brethouwer Linné Flow Centre, KTH Mechanics, SE-100 44 Stockholm, Sweden E. Lindborg Linné Flow Centre,
Today s Lecture: Land, biosphere, cryosphere (All that stuff we don t have equations for... )
") Today s Lecture: Land, biosphere, cryosphere (All that stuff we don t have equations for... ) 4 Land, biosphere, cryosphere 1. Introduction 2. Atmosphere 3. Ocean 4. Land, biosphere, cryosphere 4.1 Land
Today s Lecture: Land, biosphere, cryosphere (All that stuff we don t have equations for... ) 4 Land, biosphere, cryosphere 1. Introduction 2. Atmosphere 3. Ocean 4. Land, biosphere, cryosphere 4.1 Land
Interactive comment on Global warming projections derived from an observation-based minimal model by K. Rypdal
 Earth Syst. Dynam. Discuss., www.earth-syst-dynam-discuss.net/6/c944/2015/ Author(s) 2015. This work is distributed under the Creative Commons Attribute 3.0 License. comment on Global warming projections
The temporal cascade structure of reanalyses and global circulation models
 Quarterly Journal of the Royal Meteorological Society Q. J. R. Meteorol. Soc. 138: 1895 1913, October 2012 A The temporal cascade structure of reanalyses and global circulation models J. Stolle, a * S.
How Will Low Clouds Respond to Global Warming?
 How Will Low Clouds Respond to Global Warming? By Axel Lauer & Kevin Hamilton CCSM3 UKMO HadCM3 UKMO HadGEM1 iram 2 ECHAM5/MPI OM 3 MIROC3.2(hires) 25 IPSL CM4 5 INM CM3. 4 FGOALS g1. 7 GISS ER 6 GISS
Wavelets and Fractals
 Wavelets and Fractals Bikramjit Singh Walia Samir Kagadkar Shreyash Gupta 1 Self-similar sets The best way to study any physical problem with known symmetry is to build a functional basis with symmetry
Factors that Affect Climate
 Factors that Affect Climate What is climate? Climate is the average weather conditions over a long period of time Includes average temperatures and precipitation, wind patterns, humidity, air pressure
Chapter 2 Weather Patterns Guided Notes Objective(s): 7.E.1.4 Predict weather conditions and patterns based on information obtained from:
: 7.E.1.4 Predict weather conditions and patterns based on information obtained from:") Chapter 2 Weather Patterns Guided Notes Objective(s): 7.E.1.4 Predict weather conditions and patterns based on information obtained from: Weather data collected from direct observations and measurement
Chapter 2 Weather Patterns Guided Notes Objective(s): 7.E.1.4 Predict weather conditions and patterns based on information obtained from: Weather data collected from direct observations and measurement
Lecture 7: The Monash Simple Climate
 Climate of the Ocean Lecture 7: The Monash Simple Climate Model Dr. Claudia Frauen Leibniz Institute for Baltic Sea Research Warnemünde (IOW) claudia.frauen@io-warnemuende.de Outline: Motivation The GREB
Solar variability and Climate Change
 Solar variability and Climate Change Ulrich Cubasch Freie Universität, Berlin Joint work with Fidel Gonzalez-Rouco, Tom Crowley, Gabi Hegerl, Stefanie Legutke, Jürg Luterbacher, Ulrich Schlese, Hans von
Atmospheric complexity or scale by scale simplicity?
 Click Here for Full Article GEOPHYSICAL RESEARCH LETTERS, VOL. 36, L01801, doi:10.1029/2008gl035863, 2009 Atmospheric complexity or scale by scale simplicity? S. Lovejoy, 1 D. Schertzer, 2,3 V. Allaire,
March was 3rd warmest month in satellite record
 April 4, 2016 Vol. 25, No. 12 For Additional Information: Dr. John Christy, (256) 961-7763 john.christy@nsstc.uah.edu Dr. Roy Spencer, (256) 961-7960 roy.spencer@nsstc.uah.edu Global Temperature Report:
Do GCM s predict the climate. Or macroweather?
 8/7/13 1 1 2 Do GCM s predict the climate. Or macroweather? S. Lovejoy 1, D. Schertzer 2, D. Varon 1 3 4 5 6 1 Physics, McGill University 3600 University st., Montreal, Que., Canada 7 8 9 10 11 12 2 CEREVE
Ice on Earth: An overview and examples on physical properties
 Ice on Earth: An overview and examples on physical properties - Ice on Earth during the Pleistocene - Present-day polar and temperate ice masses - Transformation of snow to ice - Mass balance, ice deformation,
Second-Order Draft Chapter 6 IPCC WG1 Fourth Assessment Report
 Second-Order Draft Chapter IPCC WG Fourth Assessment Report 0 Figure.. Locations of temperature-sensitive proxy records with data back to 000, 00 and 0 (instrumental records: red thermometers; tree-ring:
Space time cascades and the scaling of ECMWF reanalyses: Fluxes and fields
 JOURNAL OF GEOPHYSICAL RESEARCH, VOL. 116,, doi:10.1029/2011jd015654, 2011 Space time cascades and the scaling of ECMWF reanalyses: Fluxes and fields S. Lovejoy 1 and D. Schertzer 2,3 Received 19 January
Weather What is weather? Weather. is the study of our atmosphere. Atmosphere literally means vapor (atmos) of a sphere.
 of a sphere.") Weather What is weather? Weather is the study of our atmosphere. Atmosphere literally means vapor (atmos) of a sphere. Our atmosphere is made up of 4 basic layers: The outermost layer is the thermosphere
Weather What is weather? Weather is the study of our atmosphere. Atmosphere literally means vapor (atmos) of a sphere. Our atmosphere is made up of 4 basic layers: The outermost layer is the thermosphere
CLIMATE. UNIT TWO March 2019
 CLIMATE UNIT TWO March 2019 OUTCOME 9.2.1Demonstrate an understanding of the basic features of Canada s landscape and climate. identify and locate major climatic regions of Canada explain the characteristics
!"#$%&'()*+, ==== == OIP !"#$%& National Research Council of the National Academies. !"!"#$ G. R. North! "!"#21 1/4 "#$%&'()*+
*+, ==== == OIP !#$%& National Research Council of the National Academies. !!#$ G. R. North! !#21 1/4 #$%&'()*+") ==== www.climatechange.cn P = N OMMT N % Vol.3, No. 1 January, 2 0 0 7 ADVANCES IN CLIMATE CHANGE RESEARCH!"1673-1719 (2007) 01-0014-06 %&'()*+, N=!= NIO == OIP N OIP!" NMMUTN O=!" #$%&'()*+ NMMMUN P=!"=
==== www.climatechange.cn P = N OMMT N % Vol.3, No. 1 January, 2 0 0 7 ADVANCES IN CLIMATE CHANGE RESEARCH!"1673-1719 (2007) 01-0014-06 %&'()*+, N=!= NIO == OIP N OIP!" NMMUTN O=!" #$%&'()*+ NMMMUN P=!"=
Welcome to ATMS 111 Global Warming.
 Welcome to ATMS 111 Global Warming http://www.atmos.washington.edu/2010q1/111 Isotopic Evidence 16 O isotopes "light 18 O isotopes "heavy" Evaporation favors light Rain favors heavy Cloud above ice is
Chapter outline. Reference 12/13/2016
 Chapter 2. observation CC EST 5103 Climate Change Science Rezaul Karim Environmental Science & Technology Jessore University of science & Technology Chapter outline Temperature in the instrumental record
Global Circulation. Local weather doesn t come from all directions equally Everyone s weather is part of the global circulation pattern
 Global Circulation Local weather doesn t come from all directions equally Everyone s weather is part of the global circulation pattern Wind rose shows % frequency of winds around the compass 1 Global Circulation
Harnessing Butterflies: Theory and Practice of the Stochastic Seasonal to Interannual Prediction System (StocSIPS)
") Harnessing Butterflies: Theory and Practice of the Stochastic Seasonal to Interannual Prediction System (StocSIPS) S. Lovejoy, L. Del Rio Amador, and R. Hébert Abstract The atmosphere is governed by continuum
Harnessing Butterflies: Theory and Practice of the Stochastic Seasonal to Interannual Prediction System (StocSIPS) S. Lovejoy, L. Del Rio Amador, and R. Hébert Abstract The atmosphere is governed by continuum
The Atmospheric Boundary Layer. The Surface Energy Balance (9.2)
") The Atmospheric Boundary Layer Turbulence (9.1) The Surface Energy Balance (9.2) Vertical Structure (9.3) Evolution (9.4) Special Effects (9.5) The Boundary Layer in Context (9.6) Fair Weather over Land
The Atmospheric Boundary Layer Turbulence (9.1) The Surface Energy Balance (9.2) Vertical Structure (9.3) Evolution (9.4) Special Effects (9.5) The Boundary Layer in Context (9.6) Fair Weather over Land
Exemplar for Internal Achievement Standard. Mathematics and Statistics Level 3
 Exemplar for internal assessment resource Mathematics and Statistics for Achievement Standard 91580 Exemplar for Internal Achievement Standard Mathematics and Statistics Level 3 This exemplar supports
saw from far away have become increasingly blurry. In fact, the closer parasols gaze out towards the water. Dogs scamper around the
 LITTLE Things By Johnny LIN anging on the wall at the Art Institute in Chicago, Georges Seurat s impressionist painting A Sunday on La Grande Jatte 1884 gives us a snapshot of a lazy Sabbath day in Europe
Chapter 6: Modeling the Atmosphere-Ocean System
 Chapter 6: Modeling the Atmosphere-Ocean System -So far in this class, we ve mostly discussed conceptual models models that qualitatively describe the system example: Daisyworld examined stable and unstable
,Solar Energy, Greenhouse effect, Convection.notebook October 31, 2016
 Essential Question: How is weather created? What is Solar Energy? The driving source of energy for Earth. 1. Heats Earth's land, water, and air. 2. Causes movement in the atmosphere. Key Topics: The sun
ATM S 111, Global Warming Climate Models
 ATM S 111, Global Warming Climate Models Jennifer Fletcher Day 27: July 29, 2010 Using Climate Models to Build Understanding Often climate models are thought of as forecast tools (what s the climate going
Introduction to Global Warming
 Introduction to Global Warming Cryosphere (including sea level) and its modelling Ralf GREVE Institute of Low Temperature Science Hokkaido University Sapporo, 2010.09.14 http://wwwice.lowtem.hokudai.ac.jp/~greve/
Chapter 4 Water Vapor
 Chapter 4 Water Vapor Chapter overview: Phases of water Vapor pressure at saturation Moisture variables o Mixing ratio, specific humidity, relative humidity, dew point temperature o Absolute vs. relative
Contribution of vegetation changes to dust decadal variability and its impact on tropical rainfall asymmetry
 Contribution of vegetation changes to dust decadal variability and its impact on tropical rainfall asymmetry Presented by Paul Ginoux Geophysical Fluid Dynamics Laboratory NOAA Barcelona Supercomputing
Sea-level change: A scientific and societal challenge for the 21 st century John Church International GNSS Service Workshop, Sydney, Feb 11, 2016
 Sea-level change: A scientific and societal challenge for the 21 st century John Church International GNSS Service Workshop, Sydney, Feb 11, 2016 OCEANS AND ATMOSPHERE NATIONAL RESEARCH FLAGSHIP Our coastal
Are cosmic rays responsible for climate change?
 Cosmoclimatology Kristina Pistone SIO 209: Cloud Physics 5 June 2009 Are cosmic rays responsible for climate change? I call it cosmoclimatology and I suggest that it is already at least as secure, scientifically
An Introduction to Theories of Turbulence. James Glimm Stony Brook University
 An Introduction to Theories of Turbulence James Glimm Stony Brook University Topics not included (recent papers/theses, open for discussion during this visit) 1. Turbulent combustion 2. Turbulent mixing
Climate changes in Finland, but how? Jouni Räisänen Department of Physics, University of Helsinki
 Climate changes in Finland, but how? Jouni Räisänen Department of Physics, University of Helsinki 19.9.2012 Outline Some basic questions and answers about climate change How are projections of climate
CLIMATE CHANGE: THE SUN S ROLE HUGH S 80 TH!
 CLIMATE CHANGE: THE SUN S ROLE Gerald E. Marsh FOR HUGH S 80 TH! 1 BACKGROUND MATERIALS IPCC: Climate Change 2001: Working Group I: The Scientific Basis: http://www.grida.no/climate/ipcc_tar/wg1/index.htm
Today s Climate in Perspective: Hendrick Avercamp ( ) ~1608; Rijksmuseum, Amsterdam
 ~1608; Rijksmuseum, Amsterdam") Today s Climate in Perspective: Paleoclimate Evidence Hendrick Avercamp (1585-1634) ~1608; Rijksmuseum, Amsterdam Observations Instrumental surface temperature records? (Le Treut et al., 2007 IPCC AR4
Today s Climate in Perspective: Paleoclimate Evidence Hendrick Avercamp (1585-1634) ~1608; Rijksmuseum, Amsterdam Observations Instrumental surface temperature records? (Le Treut et al., 2007 IPCC AR4
Natural and anthropogenic climate change Lessons from ice cores
 Natural and anthropogenic climate change Lessons from ice cores Eric Wolff British Antarctic Survey, Cambridge ewwo@bas.ac.uk ASE Annual Conference 2011; ESTA/ESEU lecture Outline What is British Antarctic
10.1 TEMPERATURE, THERMAL ENERGY AND HEAT Name: Date: Block: (Reference: pp of BC Science 10)
") 10.1 TEMPERATURE, THERMAL ENERGY AND HEAT Name: Date: Block: (Reference: pp. 424-435 of BC Science 10) kinetic molecular theory: explains that matter is made up of tiny that are constantly. These atoms
10.1 TEMPERATURE, THERMAL ENERGY AND HEAT Name: Date: Block: (Reference: pp. 424-435 of BC Science 10) kinetic molecular theory: explains that matter is made up of tiny that are constantly. These atoms
Grid-generated turbulence, drag, internal waves and mixing in stratified fluids
 Grid-generated turbulence, drag, internal waves and mixing in stratified fluids Not all mixing is the same! Stuart Dalziel, Roland Higginson* & Joanne Holford Introduction DAMTP, University of Cambridge
Advanced Hydrology. (Web course)
") Advanced Hydrology (Web course) Subhankar Karmakar Assistant Professor Centre for Environmental Science and Engineering (CESE) Indian Institute of Technology Bombay Powai, Mumbai 400 076 Email: skarmakar@iitb.ac.in
Advanced Hydrology (Web course) Subhankar Karmakar Assistant Professor Centre for Environmental Science and Engineering (CESE) Indian Institute of Technology Bombay Powai, Mumbai 400 076 Email: skarmakar@iitb.ac.in
Why build a climate model
 Climate Modeling Why build a climate model Atmosphere H2O vapor and Clouds Absorbing gases CO2 Aerosol Land/Biota Surface vegetation Ice Sea ice Ice sheets (glaciers) Ocean Box Model (0 D) E IN = E OUT
The North Atlantic Oscillation: Climatic Significance and Environmental Impact
 1 The North Atlantic Oscillation: Climatic Significance and Environmental Impact James W. Hurrell National Center for Atmospheric Research Climate and Global Dynamics Division, Climate Analysis Section
Factors that Affect Climate
 Factors that Affect Climate What is climate? Climate is the average weather conditions over a long period of time Includes average temperatures and precipitation, wind patterns, humidity, air pressure
The stochastic multiplicative cascade structure of deterministic numerical models of the atmosphere
 Nonlin. Processes Geophys., 6, 5, 2009 www.nonlin-processes-geophys.net/6//2009/ Author(s) 2009. This work is distributed under the Creative Commons Attribution 3.0 License. Nonlinear Processes in Geophysics
ATMOSPHERIC MOTION I (ATM S 441/503 )
") http://earth.nullschool.net/ ATMOSPHERIC MOTION I (ATM S 441/503 ) INSTRUCTOR Daehyun Kim Born in 1980 B.S. 2003 Ph.D. 2010 2010-2013 2014- Assistant Professor at Dept. of Atmospheric Sciences Office:
http://earth.nullschool.net/ ATMOSPHERIC MOTION I (ATM S 441/503 ) INSTRUCTOR Daehyun Kim Born in 1980 B.S. 2003 Ph.D. 2010 2010-2013 2014- Assistant Professor at Dept. of Atmospheric Sciences Office:
Chapter 5: Weather. Only Section 1: What is Weather?
 Chapter 5: Weather Only Section 1: What is Weather? Find the definitions of: Meteorology, meteorologist, weather, climate Not in book? Use the dictionaries **Meteorology - Meteorology is the study of the
Presentation A simple model of multiple climate regimes
 A simple model of multiple climate regimes Kerry Emanuel March 21, 2012 Overview 1. Introduction 2. Essential Climate Feedback Processes Ocean s Thermohaline Circulation, Large-Scale Circulation of the
POLAR EXPLORER EXPLORING SEA LEVEL RISE
 POLAR EXPLORER EXPLORING SEA i LEVEL RISE Developed by: Margie Turrin, mkt@ldeo.columbia.edu As a polar explorer you and your team will be collec@ng evidence of changes occurring throughout the world that
p = ρrt p = ρr d = T( q v ) dp dz = ρg
 dp dz = ρg") Chapter 1: Properties of the Atmosphere What are the major chemical components of the atmosphere? Atmospheric Layers and their major characteristics: Troposphere, Stratosphere Mesosphere, Thermosphere
Chapter 1: Properties of the Atmosphere What are the major chemical components of the atmosphere? Atmospheric Layers and their major characteristics: Troposphere, Stratosphere Mesosphere, Thermosphere
NAME: Log onto YouTube and search for jocrisci channel. All video listed with numbers below and sorted into playlists for easy access.
 NAME: Log onto YouTube and search for jocrisci channel. All video listed with numbers below and sorted into playlists for easy access. GRAPHING (Video 1.2) 1. Look at a data table: a. Determine which column
Name Period 4 th Six Weeks Notes 2013 Weather
 Name Period 4 th Six Weeks Notes 2013 Weather Radiation Convection Currents Winds Jet Streams Energy from the Sun reaches Earth as electromagnetic waves This energy fuels all life on Earth including the
SUPPLEMENTARY INFORMATION
 doi:10.1038/nature12310 We present here two additional Tables (Table SI-1, 2) and eight further Figures (Figures SI-1 to SI-8) to provide extra background information to the main figures of the paper.
CLIMATE CHANGE OVER THE LAST TWO MILLION YEARS
 CLIMATE CHANGE OVER THE LAST TWO MILLION YEARS 1. Introduction: forcings and feedbacks 2. Standing on the shoulders of giants: development of the Milankovitch theory 3. Evidence from the oceans, evidence
The ocean s overall role in climate
 The ocean s overall role in climate - moderates climate in time (diurnally, annually) - redistributes heat spatially in the largescale ocean circulation - lower albedo (sea ice higher albedo) - dry atmosphere
Logarithmic scaling in the near-dissipation range of turbulence
 PRAMANA c Indian Academy of Sciences Vol. 64, No. 3 journal of March 2005 physics pp. 315 321 Logarithmic scaling in the near-dissipation range of turbulence K R SREENIVASAN 1 and A BERSHADSKII 1,2 1 The
INTRODUCTION TO FRACTAL GEOMETRY
 Every mathematical theory, however abstract, is inspired by some idea coming in our mind from the observation of nature, and has some application to our world, even if very unexpected ones and lying centuries
May Global Warming: Recent Developments and the Outlook for the Pacific Northwest
 Global Warming: Recent Developments and the Outlook for the Pacific Northwest Pat Bartlein Department of Geography University of Oregon (bartlein@uoregon.edu) http://geography.uoregon.edu/envchange/gwhr/
University Centre in Svalbard AT 301 Infrastructure in a changing climate 10. September 2009 Physics of Snow drift
 University Centre in Svalbard AT 301 Infrastructure in a changing climate 10. September 2009 Personal report by Christian Katlein 2 Introduction This personal report for the graduate course AT 301 Infrastructure
( ) = 1005 J kg 1 K 1 ;
 = 1005 J kg 1 K 1 ;") Problem Set 3 1. A parcel of water is added to the ocean surface that is denser (heavier) than any of the waters in the ocean. Suppose the parcel sinks to the ocean bottom; estimate the change in temperature
Problem Set 3 1. A parcel of water is added to the ocean surface that is denser (heavier) than any of the waters in the ocean. Suppose the parcel sinks to the ocean bottom; estimate the change in temperature
Temperature Pressure Wind Moisture
 Chapter 1: Properties of Atmosphere Temperature Pressure Wind Moisture Thickness of the Atmosphere (from Meteorology Today) 90% 70% The thickness of the atmosphere is only about 2% of Earth s thickness
Multi-Scale Modeling of Turbulence and Microphysics in Clouds. Steven K. Krueger University of Utah
 Multi-Scale Modeling of Turbulence and Microphysics in Clouds Steven K. Krueger University of Utah 10,000 km Scales of Atmospheric Motion 1000 km 100 km 10 km 1 km 100 m 10 m 1 m 100 mm 10 mm 1 mm Planetary
GSC 107 Lab # 3 Calculating sea level changes
 GSC 107 Lab # 3 Calculating sea level changes Student name Student ID Background Glacial-Interglacial Cycles Climate-related sea-level changes of the last century are very minor compared with the large
Preferential concentration of inertial particles in turbulent flows. Jérémie Bec CNRS, Observatoire de la Côte d Azur, Université de Nice
 Preferential concentration of inertial particles in turbulent flows Jérémie Bec CNRS, Observatoire de la Côte d Azur, Université de Nice EE250, Aussois, June 22, 2007 Particle laden flows Warm clouds Plankton
Volcanoes drive climate variability by
 Volcanoes drive climate variability by 1. emitting ozone weeks before eruptions, 2. forming lower stratospheric aerosols that cool Earth, 3. causing sustained ozone depletion, surface warming, and lower
A Skeptical View of Anthropogenic Global Warming
 A Skeptical View of Anthropogenic Global Warming Having the courage to do Nothing For the Cambridge Society April 6, 2009 Friends of Science Society Ken Gregory Presented by: Peter Burns Runaway greenhouse
Multifractal Models for Solar Wind Turbulence
 Multifractal Models for Solar Wind Turbulence Wiesław M. Macek Faculty of Mathematics and Natural Sciences. College of Sciences, Cardinal Stefan Wyszyński University, Dewajtis 5, 01-815 Warsaw, Poland;
Background: What is Weather?
 Weather Maps Background: What is Weather? Weather is the day-to-day state of the atmosphere. The interaction of three important factors result in weather systems: air temperature, air pressure, and the
Thomas P. Phillips CIRES Prof K. Steffen, L. Colgan PhD ABD, D. McGrath MA
 Thomas P. Phillips CIRES Prof K. Steffen, L. Colgan PhD ABD, D. McGrath MA Problem: we know very little about the processes happening within the Greenland Ice Sheet. What is the velocity at the base? What
Connection between NAO/AO, surface climate over Northern Eurasia: snow cover force - possible mechanism.
 Connection between NAO/AO, surface climate over Northern Eurasia: snow cover force - possible mechanism. Krupchatnikov V., Yu. Martynova (Pr. Ac. Lavrentieva, 6, Novosibirsk, 630090, Russia; tel: 330 61-51;
Ice-Core Data from Greenland and Near-Term Climate Prediction. Sergey R. Kotov
 Ice-Core Data from Greenland and Near-Term Climate Prediction Abstract Sergey R. Kotov Records from the GISP2 Greenland ice core are considered in terms of dynamical systems theory and nonlinear prediction.
What is Chaos? Implications of Chaos 4/12/2010
 Joseph Engler Adaptive Systems Rockwell Collins, Inc & Intelligent Systems Laboratory The University of Iowa When we see irregularity we cling to randomness and disorder for explanations. Why should this
Lecture 2. Turbulent Flow
 Lecture 2. Turbulent Flow Note the diverse scales of eddy motion and self-similar appearance at different lengthscales of this turbulent water jet. If L is the size of the largest eddies, only very small
Sea level change recent past, present, future
 Sea level change recent past, present, future Anny Cazenave LEGOS-CNES Toulouse, France CCI_Colocation meeting, ESA/ESRIN Global mean sea level rise during the 20 th century (red : tide gauges; blue :
GEMPAK Symbols, Lines, and Markers APPENDIX C. SYMBOLS, LINES, and MARKERS. Past Weather. Pressure tendency with change.
 APPENDIX C SYMBOLS, LINES, and MARKERS SYMBOLS The World Meteorological Organization (WMO) has established a standard set of symbols depicting descriptive reports of certain types of weather observations.
Claim: Arctic, antarctic and Greenland ice loss is accelerating due to global warming REBUTTAL
 Claim: Arctic, antarctic and Greenland ice loss is accelerating due to global warming REBUTTAL Satellite and surface temperature records and sea surface temperatures show that both the East Antarctic Ice
Climate change: How do we know?
 Climate change: How do we know? This graph, based on the comparison of atmospheric samples contained in ice cores and more recent direct measurements, provides evidence that atmospheric CO2 has increased
Two aspects of moisture origin relevant to analysis of isotope modeling
 Two aspects of moisture origin relevant to analysis of isotope modeling Maxwell Kelley MIT Department of Earth, Atmospheric, and Planetary Sciences and NASA Goddard Institute for Space Studies IAEA SIMS
Atmosphere, Weather & Climate Review for Unit Assessment (Can be taken on Study Island Due Mon., 11/26/12)
") Name Class Period Atmosphere, Weather & Climate Review for Unit Assessment (Can be taken on Study Island Due Mon., 11/26/12) 1. When hot and cold air meet, the hot air rises to the top. Which process causes
Name Class Period Atmosphere, Weather & Climate Review for Unit Assessment (Can be taken on Study Island Due Mon., 11/26/12) 1. When hot and cold air meet, the hot air rises to the top. Which process causes
Fractals and Multifractals
 Fractals and Multifractals Wiesław M. Macek (1,2) (1) Faculty of Mathematics and Natural Sciences, Cardinal Stefan Wyszyński University, Wóycickiego 1/3, 01-938 Warsaw, Poland; (2) Space Research Centre,
Brita Horlings
 Knut Christianson Brita Horlings brita2@uw.edu https://courses.washington.edu/ess431/ Natural Occurrences of Ice: Distribution and environmental factors of seasonal snow, sea ice, glaciers and permafrost
When Did the Anthropocene Begin? Observations and Climate Model Simulations
 When Did the Anthropocene Begin? Observations and Climate Model Simulations by John Kutzbach University of Wisconsin-Madison March 31, 2011 Colleagues: W. Ruddiman, S. Vavrus, G. Philippon-Berrthier Main
Scale invariance of fluctuations, the return time of climate events and anthropogenic warming*
 Scale invariance of fluctuations, the return time of climate events and anthropogenic warming* A mephiticly ectoplasmic emanation from the forces of darkness Viscount Christopher Monckton of Brenchley
The importance of long-term Arctic weather station data for setting the research stage for climate change studies
 The importance of long-term Arctic weather station data for setting the research stage for climate change studies Taneil Uttal NOAA/Earth Systems Research Laboratory Boulder, Colorado Things to get out
LECTURE #14: Extreme Heat & Desertification
 GEOL 0820 Ramsey Natural Disasters Spring, 2018 LECTURE #14: Extreme Heat & Desertification Date: 27 February 2018 (lecturer: Dr. Shawn Wright) I. Start of Part 2 of the Course weather-related disasters
Haar wavelets, fluctuations and structure functions: convenient choices for geophysics
 1 Haar wavelets, fluctuations and structure functions: convenient choices for geophysics S. Lovejoy, Physics, McGill University, 3600 University st., Montreal, Que. H3A 2T8, Canada lovejoy@physics.mcgill.ca