!"#$%&'()*+%,-#$%.*&,/0*1)$2,0$3, %4#,5#2607)0%)8$,89,/#+%#*$,-0$030,
|
|
|
- Neal Rodgers
- 5 years ago
- Views:
Transcription
1 !"#$%&'()*+%,-#$%.*&,/0*1)$2,0$3, %4#,5#2607)0%)8$,89,/#+%#*$,-0$030, F07)G7,-6)10%#,H1A07%+,-8$+8*%).1, C$)D#*+)%&,89,I)7%8*)0, :0**&,-60*;#, H7#60$3)7,L#%#8*8682)706,>M7#, N#&;O0D);=,H7#60$3, I06#$%)$0,N03)Q, C$)D#*+)%&,89,,E-, E*)0$,L#$8.$8+, P0%.*06,N#+8.*7#+,?, <$D)*8$1#$%06,B%.3)#+, C$)D#*+)%&,89,,P8*%4#*$,E-,
2
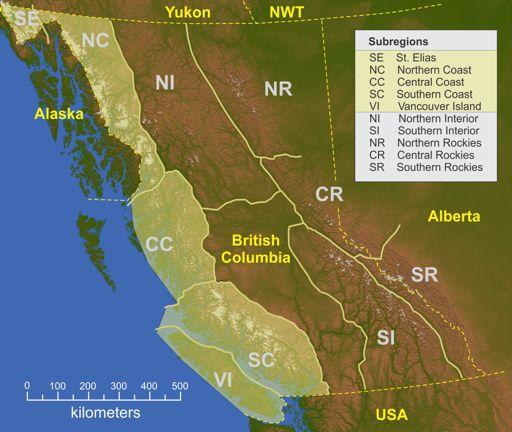
3 Glacier Overview for 2005 Region Number Area (km 2 ) SE NC CC SC VI NI SI NR CR SR St Elias North Coast Central Coast South Coast Vancouver Island North Interior South Interior North Rockies Central Rockies South Rockies , Totals 17,595 26,728.3 Bolch, Menounos & Wheate, Remote Sens. Environ., 2010.
4 Mean Ice Thickness (2005) and Average Thinning Rate ( )* Region <H>** (m) Rate (m/yr) SE NC CC SC VI NI SI NR CR SR St Elias North Coast Central Coast South Coast Vancouver Island North Interior South Interior North Rockies Central Rockies South Rockies *Schiefer, Menounos & Wheate, Geophys. Res. Lett., 2007 **Clarke, et al. J. Climate, 2013.
5 Mean Ice Thickness (2005) and Average Thinning Rate ( )* Region <H>** (m) Rate (m/yr) Lifetime (yr) SE NC CC SC VI NI SI NR CR SR St Elias North Coast Central Coast South Coast Vancouver Island North Interior South Interior North Rockies Central Rockies South Rockies *Schiefer, Menounos & Wheate, Geophys. Res. Lett., 2007 **Clarke, et al. J. Climate, 2013.


6 B81#,H1A07%+,
7 !"#$%&' ()*'+,-.'/'
*'+0.")
8 !"#$%&' ()*'+0..'/'
9 !"#$%&' ()*'+0-.'/'
10 !"#$%&' ()*'+1..'/'
11 !"#$%&' ()*'+1-.'/'
12 !"#$%&' ()*'+2..'/'
13 Percentage Change in Area and Volume of Ice vs. Equilibrium Line Altitude (ELA)
")
14 Percentage Change in Area and Volume of Ice vs. Equilibrium Line Altitude (ELA)
15 Percentage Change in Area and Volume of Ice
16

17 Evaluation of IPCC (2007) GCMs Radi! & Clarke, Evaluation of IPCC models performance in simulation twentieth century climatologies and weather patterns over North America. Journal of Climate.

18 IPCC CLIMATE PROJECTIONS Alley et al. (2007)
19
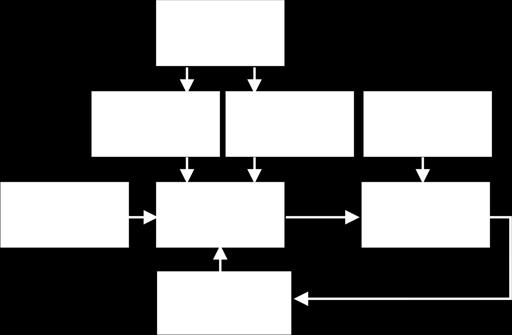
20 Digital Elevation Model (DEM) SRTM Shuttle Radar Topography Mission C-band radar Sampling: 3 arcsec (~90m) Ice Mask Shape files Prepared at University of Northern BC from various sources Glaciation Model Inputs CELL SIZE 200 m x 200 m (standard mode)

21 -6)10%#,(8*7)$2,
22 Representation of Past and Future Climate
23 North American Regional Reanalysis (NARR) National Centers for Environmental Prediction (NCEP) Time span 1977-present Spatial coverage North America, Greenland & Iceland (parts of Asia, South America, Europe) Grid scale 32 km x 32 km Vertical layers 45 Fields (3-hourly) Pressure Temperature Precipitation Moisture content Ice content Wind " and much else

24 58"$+706)$2,89,!#1A#*0%.*#,0$3, Jarosch, A.H, F.S. Anslow & G.K.C. Clarke High-resolution precipitation and temperature downscaling for glacier model. Climate Dynamics, 38,

25 NARR Topography Southwestern Canada

26 DEM Topography Southwestern Canada (200 m)

27 NARR Temperature (southwest Canada)

28 Downscaled Temperature (southwest Canada)
29 Linear Theory of Orographic Precipitation WIND Smith, R.B J. Hydrol. 282, 2-9. Smith, R.B., & I. Barstad J. Atmos. Sci., 61, Crochet, P., T. Jóhannesson, et al J. Hydrometeorol. 8,
30 Linear Theory of Orographic Precipitation WIND Smith, R.B J. Hydrol. 282, 2-9. Smith, R.B., & I. Barstad J. Atmos. Sci., 61, Crochet, P., T. Jóhannesson, et al J. Hydrometeorol. 8,
31 Linear Theory of Orographic Precipitation WIND Smith, R.B J. Hydrol. 282, 2-9. Smith, R.B., & I. Barstad J. Atmos. Sci., 61, Crochet, P., T. Jóhannesson, et al J. Hydrometeorol. 8,

32 NARR Precipitation: Southwest Canada (2000 AD)
33 Downscaled Precipitation: Southwest Canada (2000 AD)

34 Precipitation Bias Factor Based on analysis of glacier outlines

35 Representation of Past and Future Climate

36 Delta Method

37 L0++,E060$7#,0$3,H7#,(68",L83#6+,
38 Melt Model Modified degree-day model which includes potential direct solar radiation Hock, R J. Glaciol., 45,
39 Snowfall Model 32 km
40 Snowfall Model SNOW 2 C RAIN 32 km
\"$*\"+),-(./'(84<C(/.")
41 South Coast :#"#72&(B&"89'(,><77<7;($#,&9'(#78(#(:&8(9,$&99(648&"(!"#$%&'()"$*"+),-(./'(84<C(/.*//DEFG!H1IJI/-I..E/0*/*(
42 South Coast Ice
43 South Coast dot(b)


44 F*8O#7%)8$+,
45 Modelled Mean Balance Rate : MPI-ESM-LR

46 Modelled Mean Balance Rate : MPI-ESM-LR
47 Modelled Mean Balance Rate : MPI-ESM-LR

48 Modelled Mean Balance Rate : MPI-ESM-LR

49 Modelled Mean Balance Rate : MPI-ESM-LR
50 Ice Dynamics Model Vertically-integrated velocity fields Energy transport Mass conservation equation Debris transport
51

52 St Elias region
53 St Elias Region ECHAM A1B 1980
54 St Elias Region ECHAM A1B 1980
55 St Elias Region ECHAM A1B 1990
56 St Elias Region ECHAM A1B 2000
57 St Elias Region ECHAM A1B 2010
58 St Elias Region ECHAM A1B 2020

59 St Elias Region ECHAM A1B 2030
60 St Elias Region ECHAM A1B 2040
61 St Elias Region ECHAM A1B 2050
62 St Elias Region ECHAM A1B 2060
63 St Elias Region ECHAM A1B 2070
64 St Elias Region ECHAM A1B 2080
65 St Elias Region ECHAM A1B 2090
66 St Elias Region ECHAM A1B 2100
67 St Elias Region ECHAM A1B 2000
68 St Elias Region ECHAM A1B 2100

69
70

71
72
73 Projected Loss of Glacier Volume BC Coast (SE + NC + CC + SC + VI) Scenario A1B
74 Projected Loss of Glacier Volume BC Interior (NI + SI) Scenario A1B
75 Projected Loss of Glacier Volume Rockies (NR + CR + SR) Scenario A1B
76 Projected Loss of Glacier Volume All regions (BC + AB) Scenario A1B
 Scenario")
77 Projected Loss of Glacier Volume All regions (BC + AB) Scenario A2
78 Projected Loss of Glacier Volume All regions (BC + AB) Scenario B1
 ECHAM Scenarios A1B,")
79 Projected Loss of Glacier Volume All regions (BC + AB) ECHAM Scenarios A1B, A2, B1
80 -8$76.+)8$+,!(!( B.R+%0$%)06,S$#0*,%8%06T,2607)#*,68++,98*,1.74,89, "#+%#*$,-0$030,)+,.$0D8)30R6#, N#"0*3+,98*,2883,R#40D)8*,SEU,+7#$0*)8T,0*#, 3)+0AA8)$%)$26&,+6)24%,!( B#0'6#D#6,78$+#V.#$7#,)+,+1066,%48.24,6);#6&, #78$81)7,)1A07%+,S#W2W=,4&3*8'#6#7%*)7,A8"#*=, G+4#*)#+=,02*)7.6%.*#T,$8%,

81 @7;$8"6#321#$%+,
ICRC-CORDEX Sessions A: Benefits of Downscaling Session A1: Added value of downscaling Stockholm, Sweden, 18 May 2016
 ICRC-CORDEX Sessions A: Benefits of Downscaling Session A1: Added value of downscaling Stockholm, Sweden, 18 May 2016 Challenges in the quest for added value of climate dynamical downscaling: Evidence
RADAR Remote Sensing Application Examples
 RADAR Remote Sensing Application Examples! All-weather capability: Microwave penetrates clouds! Construction of short-interval time series through cloud cover - crop-growth cycle! Roughness - Land cover,
Lecture 7: The Monash Simple Climate
 Climate of the Ocean Lecture 7: The Monash Simple Climate Model Dr. Claudia Frauen Leibniz Institute for Baltic Sea Research Warnemünde (IOW) claudia.frauen@io-warnemuende.de Outline: Motivation The GREB
Bugs in JRA-55 snow depth analysis
 14 December 2015 Climate Prediction Division, Japan Meteorological Agency Bugs in JRA-55 snow depth analysis Bugs were recently found in the snow depth analysis (i.e., the snow depth data generation process)
Supplementary Materials for
 advances.sciencemag.org/cgi/content/full/3/12/e1701169/dc1 Supplementary Materials for Abrupt shift in the observed runoff from the southwestern Greenland ice sheet Andreas P. Ahlstrøm, Dorthe Petersen,
Climate Summary for the Northern Rockies Adaptation Partnership
 Climate Summary for the Northern Rockies Adaptation Partnership Compiled by: Linda Joyce 1, Marian Talbert 2, Darrin Sharp 3, John Stevenson 4 and Jeff Morisette 2 1 USFS Rocky Mountain Research Station
MODELING PRECIPITATION OVER COMPLEX TERRAIN IN ICELAND
 MODELING PRECIPITATION OVER COMPLEX TERRAIN IN ICELAND Philippe Crochet 1, Tómas Jóhannesson 1, Oddur Sigurðsson 2, Helgi Björnsson 3 and Finnur Pálsson 3 1 Icelandic Meteorological Office, Bústadavegur
Climate Modeling Dr. Jehangir Ashraf Awan Pakistan Meteorological Department
 Climate Modeling Dr. Jehangir Ashraf Awan Pakistan Meteorological Department Source: Slides partially taken from A. Pier Siebesma, KNMI & TU Delft Key Questions What is a climate model? What types of climate
Northern New England Climate: Past, Present, and Future. Basic Concepts
 Northern New England Climate: Past, Present, and Future Basic Concepts Weather instantaneous or synoptic measurements Climate time / space average Weather - the state of the air and atmosphere at a particular
Weather Atmospheric condition in one place during a limited period of time Climate Weather patterns that an area typically experiences over a long
 Weather Atmospheric condition in one place during a limited period of time Climate Weather patterns that an area typically experiences over a long period of time Many factors influence weather & climate
Climate Change and Runoff Statistics in the Rhine Basin: A Process Study with a Coupled Climate-Runoff Model
 IACETH Climate Change and Runoff Statistics in the Rhine Basin: A Process Study with a Coupled Climate-Runoff Model Jan KLEINN, Christoph Frei, Joachim Gurtz, Pier Luigi Vidale, and Christoph Schär Institute
The PRECIS Regional Climate Model
 The PRECIS Regional Climate Model General overview (1) The regional climate model (RCM) within PRECIS is a model of the atmosphere and land surface, of limited area and high resolution and locatable over
MET Lecture 20 Mountain Snowstorms (CH16)
") MET 4300 Lecture 20 Mountain Snowstorms (CH16) Learning Objectives Provide an overview of the importance and impacts of mountain snowstorms in the western US Describe how topography influence precipitation
MET 4300 Lecture 20 Mountain Snowstorms (CH16) Learning Objectives Provide an overview of the importance and impacts of mountain snowstorms in the western US Describe how topography influence precipitation
A downscaling and adjustment method for climate projections in mountainous regions
 A downscaling and adjustment method for climate projections in mountainous regions applicable to energy balance land surface models D. Verfaillie, M. Déqué, S. Morin, M. Lafaysse Météo-France CNRS, CNRM
Diagnosing the Climatology and Interannual Variability of North American Summer Climate with the Regional Atmospheric Modeling System (RAMS)
") Diagnosing the Climatology and Interannual Variability of North American Summer Climate with the Regional Atmospheric Modeling System (RAMS) Christopher L. Castro and Roger A. Pielke, Sr. Department of
Diagnosing the Climatology and Interannual Variability of North American Summer Climate with the Regional Atmospheric Modeling System (RAMS) Christopher L. Castro and Roger A. Pielke, Sr. Department of
Regional and global projections of twenty-first century glacier mass changes in response to climate scenarios from global climate models
 Clim Dyn DOI 10.1007/s00382-013-1719-7 Regional and global projections of twenty-first century glacier mass changes in response to climate scenarios from global climate models Valentina Radić Andrew Bliss
1 What Is Climate? TAKE A LOOK 2. Explain Why do areas near the equator tend to have high temperatures?
 CHAPTER 17 1 What Is Climate? SECTION Climate BEFORE YOU READ After you read this section, you should be able to answer these questions: What is climate? What factors affect climate? How do climates differ
6. What has been the most effective erosive agent in the climate system? a. Water b. Ice c. Wind
 Multiple Choice. 1. Heinrich Events a. Show increased abundance of warm-water species of planktic foraminifera b. Show greater intensity since the last deglaciation c. Show increased accumulation of ice-rafted
Downscaled Climate Change Projection for the Department of Energy s Savannah River Site
 Downscaled Climate Change Projection for the Department of Energy s Savannah River Site Carolinas Climate Resilience Conference Charlotte, North Carolina: April 29 th, 2014 David Werth Atmospheric Technologies
1 What Is Climate? TAKE A LOOK 2. Explain Why do areas near the equator tend to have high temperatures?
 CHAPTER 17 1 What Is Climate? SECTION Climate BEFORE YOU READ After you read this section, you should be able to answer these questions: What is climate? What factors affect climate? How do climates differ
Climate changes in Finland, but how? Jouni Räisänen Department of Physics, University of Helsinki
 Climate changes in Finland, but how? Jouni Räisänen Department of Physics, University of Helsinki 19.9.2012 Outline Some basic questions and answers about climate change How are projections of climate
Weather and Climate Change
 Weather and Climate Change What if the environmental lapse rate falls between the moist and dry adiabatic lapse rates? The atmosphere is unstable for saturated air parcels but stable for unsaturated air
Memorandum. Höfundur: Halldór Björnsson, Nikolai Nawri, Guðrún Elín Jóhannsdóttir and Davíð Egilson.
 EBV-007-1 Memorandum Date: 17.12.2015 Title: Estimation of evaporation and precipitation in Iceland Höfundur: Halldór Björnsson, Nikolai Nawri, Guðrún Elín Jóhannsdóttir and Davíð Egilson. Ref: 2015-69
Application and verification of ECMWF products 2010
 Application and verification of ECMWF products 2010 Icelandic Meteorological Office (www.vedur.is) Guðrún Nína Petersen 1. Summary of major highlights Medium range weather forecasts issued at IMO are mainly
Annex I to Target Area Assessments
 Baltic Challenges and Chances for local and regional development generated by Climate Change Annex I to Target Area Assessments Climate Change Support Material (Climate Change Scenarios) SWEDEN September
Application and verification of ECMWF products 2009
 Application and verification of ECMWF products 2009 Icelandic Meteorological Office (www.vedur.is) Gu rún Nína Petersen 1. Summary of major highlights Medium range weather forecasts issued at IMO are mainly
Presented at IP3 2 nd Annual Workshop No Reproduction Permitted
 Western Canadian Cryospheric Network WC 2 N - Recent Progress Investigators: Andrew Bush (U. Alberta); John Clague (SFU); Garry Clarke (UBC); Stephen Déry (UNBC); Peter Jackson (UNBC); Shawn Marshall (U.
Inter-linkage case study in Pakistan
 7 th GEOSS Asia Pacific Symposium GEOSS AWCI Parallel Session: 26-28 May, 2014, Tokyo, Japan Inter-linkage case study in Pakistan Snow and glaciermelt runoff modeling in Upper Indus Basin of Pakistan Maheswor
Introduction to Climate Projections and Analysis
 Introduction to Climate Projections and Analysis Jack Katzfey, CSIRO Oceans and Atmosphere 1 June 2016 The project is being implemented by the Asian Development Bank through the technical assistance (TA
8-km Historical Datasets for FPA
 Program for Climate, Ecosystem and Fire Applications 8-km Historical Datasets for FPA Project Report John T. Abatzoglou Timothy J. Brown Division of Atmospheric Sciences. CEFA Report 09-04 June 2009 8-km
Weather Atmospheric condition in one place during a limited period of time Climate Weather patterns that an area typically experiences over a long
 Weather Atmospheric condition in one place during a limited period of time Climate Weather patterns that an area typically experiences over a long period of time Many factors influence weather & climate
GCM, GWM, RCM, Mesoscale
 Recent Developments in Computer Software Related to GCM and Mesoscale Rainfall Simulation Re-linking the cycle Assela Pathirana Why Atmosphere? Sky Forcing for surface hydrology Rainfall Radiation Winds,
1 What Is Climate? TAKE A LOOK 2. Explain Why do areas near the equator tend to have high temperatures?
 CHAPTER 3 1 What Is Climate? SECTION Climate BEFORE YOU READ After you read this section, you should be able to answer these questions: What is climate? What factors affect climate? How do climates differ
Andrey Martynov 1, René Laprise 1, Laxmi Sushama 1, Katja Winger 1, Bernard Dugas 2. Université du Québec à Montréal 2
 CMOS-2012, Montreal, 31 May 2012 Reanalysis-driven climate simulation over CORDEX North America domain using the Canadian Regional Climate Model, version 5: model performance evaluation Andrey Martynov
Implementation of Land Information System in the NCEP Operational Climate Forecast System CFSv2. Jesse Meng, Michael Ek, Rongqian Yang, Helin Wei
 Implementation of Land Information System in the NCEP Operational Climate Forecast System CFSv2 Jesse Meng, Michael Ek, Rongqian Yang, Helin Wei 1 Outline NCEP CFSRR Land component CFSv1 vs CFSv2 Land
Impacts of Climate Change on Autumn North Atlantic Wave Climate
 Impacts of Climate Change on Autumn North Atlantic Wave Climate Will Perrie, Lanli Guo, Zhenxia Long, Bash Toulany Fisheries and Oceans Canada, Bedford Institute of Oceanography, Dartmouth, NS Abstract
Application and verification of ECMWF products 2011
 Application and verification of ECMWF products 2011 Icelandic Meteorological Office (www.vedur.is) Guðrún Nína Petersen 1. Summary of major highlights Medium range weather forecasts issued at IMO are mainly
Climate Change 2007: The Physical Science Basis
 Climate Change 2007: The Physical Science Basis Working Group I Contribution to the IPCC Fourth Assessment Report Presented by R.K. Pachauri, IPCC Chair and Bubu Jallow, WG 1 Vice Chair Nairobi, 6 February
Investigating Regional Climate Model - RCM Added-Value in simulating Northern America Storm activity
 Investigating Regional Climate Model - RCM Added-Value in simulating Northern America Storm activity E. D. Poan 1, P. Gachon 1, R. Laprise 1, R. Aider 1,2, G. Dueymes 1 1 Centre d Etude et la Simulation
1. Deglacial climate changes
 Review 3 Major Topics Deglacial climate changes (last 21,000 years) Millennial oscillations (thousands of years) Historical Climate Change (last 1000 years) Climate Changes Since the 1800s Climate Change
Sep May Ppt Anomaly (N = 60)
") balance (annual net balance and its summer/winter components) measures how climate affects the health of Arctic glaciers. As most 2007 08 measurements are not yet available, we report results for the 2006
balance (annual net balance and its summer/winter components) measures how climate affects the health of Arctic glaciers. As most 2007 08 measurements are not yet available, we report results for the 2006
China s contribution to Indus Forum (2013-): Changes of observation and projection in climate, runoff and flood/drought over Indus River Basin
: Changes of observation and projection in climate, runoff and flood/drought over Indus River Basin") China s contribution to Indus Forum (2013-): Changes of observation and projection in climate, runoff and flood/drought over Indus River Basin Jiang Tong, Xu Hongmei, Li Xiucang, NCC/CMA Zhao Chengyi,
China s contribution to Indus Forum (2013-): Changes of observation and projection in climate, runoff and flood/drought over Indus River Basin Jiang Tong, Xu Hongmei, Li Xiucang, NCC/CMA Zhao Chengyi,
Assessing the Applicability of CHELSA (Climatologies at
 International Conference Terrestrial Systems Research: Monitoring, Prediction and High Performance Computing April 4th-6th, 2018, Bonn, Germany Assessing the Applicability of CHELSA (Climatologies at High
Joseph M. Shea 1, R. Dan Moore, Faron S. Anslow University of British Columbia, Vancouver, BC, Canada. 1 Introduction
 17th Conference on Applied Climatology, American Meteorological Society, 11-1 August, 28, Whistler, BC, Canada P2. - Estimating meteorological variables within glacier boundary layers, Southern Coast Mountains,
Torben Königk Rossby Centre/ SMHI
 Fundamentals of Climate Modelling Torben Königk Rossby Centre/ SMHI Outline Introduction Why do we need models? Basic processes Radiation Atmospheric/Oceanic circulation Model basics Resolution Parameterizations
Milankovitch Theory of the Ice Ages
 Ruddiman CHAPTER 10 Insolation Control of Ice Sheets Milankovitch Theory of the Ice Ages margin of Greenland ice sheet Today s main points: 1) Review of glaciology basics. 2) Orbital changes affecting
Grade 9 Social Studies Canadian Identity. Chapter 2 Review Canada s Physical Landscape
 Grade 9 Social Studies Canadian Identity Chapter 2 Review Canada s Physical Landscape Name: Unit 1: Empowerment Terms (notes or textbook) 1. Core 2. Crust 3. Mantle 4. Magma 5. Continental drift 6. Plate
Examining Ice Volume Change in the Northern Cascades, Washington
 Abstract for Digital Terrain Analysis Project Examining Ice Volume Change in the Northern Cascades, Washington Candice Loveland (candicel@pdx.edu) and Christina Gray (ceg4@pdx.edu) Portland State University
Overview of Data for CREST Model
 Overview of Data for CREST Model Xianwu Xue April 2 nd 2012 CREST V2.0 CREST V2.0 Real-Time Mode Forcasting Mode Data Assimilation Precipitation PET DEM, FDR, FAC, Slope Observed Discharge a-priori parameter
SUPPLEMENTARY INFORMATION
 Intensification of Northern Hemisphere Subtropical Highs in a Warming Climate Wenhong Li, Laifang Li, Mingfang Ting, and Yimin Liu 1. Data and Methods The data used in this study consists of the atmospheric
JOURNAL OF GEOPHYSICAL RESEARCH, VOL. 115, D05108, doi: /2009jd011706, 2010
 Click Here for Full Article JOURNAL OF GEOPHYSICAL RESEARCH, VOL. 115,, doi:10.1029/2009jd011706, 2010 Changes in synoptic weather patterns and Greenland precipitation in the 20th and 21st centuries: 2.
The Latest Water-Relevant Climate Change Projections for California
 The Latest Water-Relevant Climate Change Projections for California Michael Dettinger US Geological Survey, Scripps Inst Oceanography, La Jolla, CA Suraj Goladi, SIO Dan Cayan, SIO/USGS Tapash Das, SIO/CH2M
Regional Climate Change Modeling: An Application Over The Caspian Sea Basin. N. Elguindi and F. Giorgi The Abdus Salam ICTP, Trieste Italy
 Regional Climate Change Modeling: An Application Over The Caspian Sea Basin N. Elguindi and F. Giorgi The Abdus Salam ICTP, Trieste Italy Outline I. Background and historical information on the Caspian
Assimilation of Snow and Ice Data (Incomplete list)
") Assimilation of Snow and Ice Data (Incomplete list) Snow/ice Sea ice motion (sat): experimental, climate model Sea ice extent (sat): operational, U.S. Navy PIPs model; Canada; others? Sea ice concentration
Assimilation of Snow and Ice Data (Incomplete list) Snow/ice Sea ice motion (sat): experimental, climate model Sea ice extent (sat): operational, U.S. Navy PIPs model; Canada; others? Sea ice concentration
The Climate System and Climate Models. Gerald A. Meehl National Center for Atmospheric Research Boulder, Colorado
 The Climate System and Climate Models Gerald A. Meehl National Center for Atmospheric Research Boulder, Colorado The climate system includes all components of the physical earth system that affect weather
A PROTOTYPE FOR THE APPLICATION OF CLIMATE INFORMATION TO IMPROVE HIGHWAY AND INFRASTRUCTURE PLANNING IN THE COASTAL REGIONS OF LAKE VICTORIA
 A PROTOTYPE FOR THE APPLICATION OF CLIMATE INFORMATION TO IMPROVE HIGHWAY AND INFRASTRUCTURE PLANNING IN THE COASTAL REGIONS OF LAKE VICTORIA Kara Smith October 26, 2016 Lake Victoria Levels Sudden increase
VIC Hydrology Model Training Workshop Part II: Building a model
 VIC Hydrology Model Training Workshop Part II: Building a model 11-12 Oct 2011 Centro de Cambio Global Pontificia Universidad Católica de Chile Ed Maurer Civil Engineering Department Santa Clara University
Notes for Remote Sensing: Glacier Elevation, Volume and Mass Change
 Notes for Remote Sensing: Glacier Elevation, Volume and Mass Change Elevation and Volume Change: Alex S Gardner Atmospheric Oceanic and Space Sciences, University of Michigan Aircraft- and satellite- mounted
Evidence for Weakening of Indian Summer Monsoon and SA CORDEX Results from RegCM
 Evidence for Weakening of Indian Summer Monsoon and SA CORDEX Results from RegCM S K Dash Centre for Atmospheric Sciences Indian Institute of Technology Delhi Based on a paper entitled Projected Seasonal
Quality Control of the National RAWS Database for FPA Timothy J Brown Beth L Hall
 Quality Control of the National RAWS Database for FPA Timothy J Brown Beth L Hall Desert Research Institute Program for Climate, Ecosystem and Fire Applications May 2005 Project Objectives Run coarse QC
Brita Horlings
 Knut Christianson Brita Horlings brita2@uw.edu https://courses.washington.edu/ess431/ Natural Occurrences of Ice: Distribution and environmental factors of seasonal snow, sea ice, glaciers and permafrost
The Netherlands approach for generating climate change. scenarios. Bart van den Hurk, KNMI and many others
 The Netherlands approach for generating climate change scenarios Bart van den Hurk, KNMI and many others What is the global climate problem? Climate change is normal Natural influences: Internal variability
SUPPLEMENTARY INFORMATION
 1 Supplementary Methods Downscaling of global climate model data Global Climate Model data were dynamically downscaled by the Regional Climate Model (RCM) CLM 1 (http://clm.gkss.de/, meanwhile renamed
Downscaling and Probability
 Downscaling and Probability Applications in Climate Decision Aids May 11, 2011 Glenn Higgins Manager, Environmental Sciences and Engineering Department Downscaling and Probability in Climate Modeling The
Low-level wind, moisture, and precipitation relationships near the South Pacific Convergence Zone in CMIP3/CMIP5 models
 Low-level wind, moisture, and precipitation relationships near the South Pacific Convergence Zone in CMIP3/CMIP5 models Matthew J. Niznik and Benjamin R. Lintner Rutgers University 25 April 2012 niznik@envsci.rutgers.edu
138 ANALYSIS OF FREEZING RAIN PATTERNS IN THE SOUTH CENTRAL UNITED STATES: Jessica Blunden* STG, Inc., Asheville, North Carolina
 138 ANALYSIS OF FREEZING RAIN PATTERNS IN THE SOUTH CENTRAL UNITED STATES: 1979 2009 Jessica Blunden* STG, Inc., Asheville, North Carolina Derek S. Arndt NOAA National Climatic Data Center, Asheville,
The impact of climate change on glaciers and glacial runoff in the Nordic countries
 The impact of climate change on glaciers and glacial runoff in the Nordic countries Tómas Jóhannesson, Guðfinna Aðalgeirsdóttir, Andreas Ahlstrøm, Liss M. Andreassen, Stein Beldring, Helgi Björnsson, Philippe
Accumulation at the equilibrium-line altitude of glaciers inferred from a degree-day model and tested against field observations
 Annals of Glaciology 43 2006 329 Accumulation at the equilibrium-line altitude of glaciers inferred from a degree-day model and tested against field observations Roger J. BRAITHWAITE, 1 Sarah C.B. RAPER,
Global Solar Dataset for PV Prospecting. Gwendalyn Bender Vaisala, Solar Offering Manager for 3TIER Assessment Services
 Global Solar Dataset for PV Prospecting Gwendalyn Bender Vaisala, Solar Offering Manager for 3TIER Assessment Services Vaisala is Your Weather Expert! We have been helping industries manage the impact
Part I: Current observations. Observations of glacier retreat
 20-09-11 Climate Change in the tropical Andes and its impacts on glaciers: observations and projections Rocio Urrutia & Ambarish Karmalkar (Univ. Oxford, UK) Mathias Vuille Department of Atmospheric and
FREEZING- RAIN IN THE GREAT LAKES
 About this Work GLISA participated in a winter climate adaptation project focused on Chicago, IL (http://glisaclimate.org/project/indicator-suite-and-winter-adaptation-measures-for-thechicago-climate-action-plan).
Glaciology (as opposed to Glacial Geology) Why important? What are glaciers? How do they work?
 Why important? What are glaciers? How do they work?") Glaciology (as opposed to Glacial Geology) Why important? What are glaciers? How do they work? Glaciers are important because of their role in creating glacial landscapes (erosional and depositional features).
Glaciology (as opposed to Glacial Geology) Why important? What are glaciers? How do they work? Glaciers are important because of their role in creating glacial landscapes (erosional and depositional features).
GEOSPATIAL ANALYSIS OF GLACIAL DYNAMICS OF SHIGAR AND SHAYOK BASINS. Syed Naseem Abbas Gilany 1
 GEOSPATIAL ANALYSIS OF GLACIAL DYNAMICS OF SHIGAR AND SHAYOK BASINS 1 OUTLINE Introduction Problem Statement / Rationale Objectives Material and Methods Study Area Datasets Required Data Analysis / Assessment
Increased frequency and intensity of atmospheric rivers affecting Europe during the XXI Century
 Increased frequency and intensity of atmospheric rivers affecting Europe during the XXI Century Alexandre M. Ramos 1, Ricardo Tomé 1, Ricardo M. Trigo 1*, Margarida L.R. Liberato 1,2, Joaquim G. Pinto
Glacier Elevation, Volume and Mass Change
 8/8/12 Glacier Elevation, Volume and Mass Change 1 Outline: Elevation, Volume and Mass Change ① Elevation change fundamentals ② Elevation measurement platforms ③ Calculating elevation change ④ Calculating
The general procedure for estimating 24-hour PMP includes the following steps:
 14th Conference on Applied Climatology Abstract # 71520 Using PRISM Climate Grids and GIS for Extreme Precipitation Mapping George H. Taylor and Christopher Daly Oregon State University Corvallis Oregon
Glacier (and ice sheet) Mass Balance
 Mass Balance") Glacier (and ice sheet) Mass Balance The long-term average position of the highest (late summer) firn line is termed the Equilibrium Line Altitude (ELA) Firn is old snow How an ice sheet works (roughly):
Glacier (and ice sheet) Mass Balance The long-term average position of the highest (late summer) firn line is termed the Equilibrium Line Altitude (ELA) Firn is old snow How an ice sheet works (roughly):
Why modelling? Glacier mass balance modelling
 Why modelling? Glacier mass balance modelling GEO 4420 Glaciology 12.10.2006 Thomas V. Schuler t.v.schuler@geo.uio.no global mean temperature Background Glaciers have retreated world-wide during the last
Determining the spatio-temporal distribution of 20th Century Antarctic Peninsula glacier mass change
 Determining the spatio-temporal distribution of 20th Century Antarctic Peninsula glacier mass change Jon Mills, Pauline Miller, Matthias Kunz School of Civil Engineering & Geosciences / Centre for Earth
Projected Impacts of Climate Change in Southern California and the Western U.S.
 Projected Impacts of Climate Change in Southern California and the Western U.S. Sam Iacobellis and Dan Cayan Scripps Institution of Oceanography University of California, San Diego Sponsors: NOAA RISA
Water Stress, Droughts under Changing Climate
 Water Stress, Droughts under Changing Climate Professor A.K.M. Saiful Islam Institute of Water and Flood Management Bangladesh University of Engineering and Technology (BUET) Outline of the presentation
REGIONAL SIMULATION WITH THE PRECIS MODEL
 Anales Instituto Patagonia (Chile), 2012. 40(1):45-50 45 REGIONAL SIMULATION WITH THE PRECIS MODEL SIMULACIÓN REGIONAL CON EL MODELO PRECIS Mark Falvey 1 During 2006 the Geophysics Department of the University
the expected changes in annual
 1 2 3 4 5 6 7 8 9 10 11 12 13 14 15 16 17 18 19 20 21 22 23 24 25 26 27 28 29 30 31 32 33 34 35 36 37 38 39 40 41 42 43 44 Article Quantification of the expected changes in annual maximum daily precipitation
Climate Downscaling 201
 Climate Downscaling 201 (with applications to Florida Precipitation) Michael E. Mann Departments of Meteorology & Geosciences; Earth & Environmental Systems Institute Penn State University USGS-FAU Precipitation
Robert Shedd Northeast River Forecast Center National Weather Service Taunton, Massachusetts, USA
 Robert Shedd Northeast River Forecast Center National Weather Service Taunton, Massachusetts, USA Outline River Forecast Centers FEWS Implementation Status Forcing Data Ensemble Forecasting The Northeast
GLOBAL CLIMATES FOCUS
 which you will learn more about in Chapter 6. Refer to the climate map and chart on pages 28-29 as you read the rest of this chapter. FOCUS GLOBAL CLIMATES What are the major influences on climate? Where
Ice Sheets and Glaciers
 Ice Sheets and Glaciers Technical University of Denmark Kees van der Veen Department of Geography University of Kansas Why are glaciers and ice sheets important? Large volume of fresh water stored in ice
performance EARTH SCIENCE & CLIMATE CHANGE Mujtaba Hassan PhD Scholar Tsinghua University Beijing, P.R. C
 Temperature and precipitation climatology assessment over South Asia using the Regional Climate Model (RegCM4.3): An evaluation of model performance Mujtaba Hassan PhD Scholar Tsinghua University Beijing,
2018 Science Olympiad: Badger Invitational Meteorology Exam. Team Name: Team Motto:
 2018 Science Olympiad: Badger Invitational Meteorology Exam Team Name: Team Motto: This exam has 50 questions of various formats, plus 3 tie-breakers. Good luck! 1. On a globally-averaged basis, which
Evaluation of ClimateBC V5
 1 Evaluation of ClimateBC Dave Spittlehouse, BC Min Forests, Lands and Natural Resource Operations, Victoria, BC & Tongli Wang, Centre for Forest Conservation Genetics, Department of Forest and Conservation
THE EARTH S RELIEF SOCIAL SCIENCES 1º ESO
 THE EARTH S RELIEF SOCIAL SCIENCES 1º ESO 1. THE STRUCTURE OF THE EARTH The Earth is divided into layers: The crust is the surface layer. It is a thin, solid layer made of rock. The Earth s crust has a
291. IMPACT OF AIRS THERMODYNAMIC PROFILES ON PRECIPITATION FORECASTS FOR ATMOSPHERIC RIVER CASES AFFECTING THE WESTERN UNITED STATES
 291. IMPACT OF AIRS THERMODYNAMIC PROFILES ON PRECIPITATION FORECASTS FOR ATMOSPHERIC RIVER CASES AFFECTING THE WESTERN UNITED STATES Clay B. Blankenship, USRA, Huntsville, Alabama Bradley T. Zavodsky
Annals of Glaciology 52(59)
") Annals of Glaciology 52(59) 2011 109 Use of historical elevation data to calculate surface-elevation and volume changes of Ha-Iltzuk Icefield, southwest British Columbia, Canada, 1970 to mid-1980s Jeffrey
Annals of Glaciology 52(59) 2011 109 Use of historical elevation data to calculate surface-elevation and volume changes of Ha-Iltzuk Icefield, southwest British Columbia, Canada, 1970 to mid-1980s Jeffrey
Summary for the Greenland ice sheet
 Contribution of Greenland and Antarctica to future sea level change Catherine Ritz, Gaël Durand, Fabien Gillet-Chaulet, Olivier Gagliardini, Vincent Peyaud EDGe team, LGGE, CNRS/UJF Grenoble, France Ice
ClimateBC version history
 ClimateBC version history ClimateBC v5.60 (August 31, 2018) Improvements Historical monthly data from the Climate Research Unit (CRU ts4.01) for the years 1999-2016 have been replaced by our newly developed
Land Analysis in the NOAA CFS Reanalysis. Michael Ek, Ken Mitchell, Jesse Meng Helin Wei, Rongqian Yang, and George Gayno
 Land Analysis in the NOAA CFS Reanalysis Michael Ek, Ken Mitchell, Jesse Meng Helin Wei, Rongqian Yang, and George Gayno 1 Outline CFS Reanalysis execution Land surface model upgrade from OSU to Noah LIS/GLDAS
Using PRISM Climate Grids and GIS for Extreme Precipitation Mapping
 Using PRISM Climate Grids and GIS for Extreme Precipitation Mapping George H. Taylor, State Climatologist Oregon Climate Service 316 Strand Ag Hall Oregon State University Corvallis OR 97331-2209 Tel:
SUPPLEMENTARY INFORMATION
 SUPPLEMENTARY INFORMATION DOI: 1.138/NCLIMATE1327 Lack of uniform trends but increasing spatial variability in observed Indian rainfall extremes SI Guide Supplementary Information Title of the file: Supplementary
3. Climate Change. 3.1 Observations 3.2 Theory of Climate Change 3.3 Climate Change Prediction 3.4 The IPCC Process
 3. Climate Change 3.1 Observations 3.2 Theory of Climate Change 3.3 Climate Change Prediction 3.4 The IPCC Process 3.1 Observations Need to consider: Instrumental climate record of the last century or
Modeling the Downward Influence of Stratospheric Final Warming events
 Modeling the Downward Influence of Stratospheric Final Warming events Lantao Sun Department of Atmospheric Sciences, University of Illinois at Urbana-Champaign Walter A. Robinson Division of Atmospheric