Seismicity Of The Rio Grande Rift In New Mexico
|
|
|
- Brett Reeves
- 5 years ago
- Views:
Transcription
1 Circular 120 Seismicity Of The Rio Grande Rift In New Mexico 1972 NEW MEXICO STATE BUREAU OF MINES AND MINERAL RESOURCES
2 NEW MEXICO STATE BUREAU OF MINES AND MINERAL RESOURCES Don H. Baker, Jr., Director Full-Time Staff JOYCE M. AGUILAR, Stenographer WILLIAM E. ARNOLD, Scientific Illustrator BLAIR R. BENNER, Junior Metallurgist ROBERT A. BIEBERMAN, Petroleum Geologist LYNN A. BRANDVOLD, Chemist CHARLES E. CHAPIN, Geologist RICHARD R. CHAVEZ, Technician JILL COLLIS, Secretary LOIS M. DEVLIN, Office Manager JO DRAKE, Administrative Ass't. & Sec'y. ROUSSEAU H. FLOWER, Senior Paleontologist Roy W. FOSTER, Petroleum Geologist WILLIAM L. HAWKS, Materials Engineer ROBERT W. KELLEY, Editor & Geologist FRANK E. KOTTLOWSKI, Ass't. Dir. & Sr. Geol. JUDITH M. PERALTA, Clerk-Typist, Stenog. ROBERT L. PRICE, Draftsman JACQUES R. RENAULT, Geologist RONALD ROMAN, Chief Research Metallurgist JOHN W. SHOMAKER, Geologist JACKIE H. SMITH, Laboratory Assistant KARL VONDER LINDEN, Min. Eng., Env. Geol. CHARLES W. WALKER, Mineralogist ROBERT H. WEBER, Senior Geologist MAX E. WILLARD, Economic Geologist JUARINE W. WOOLDRIDGE, Editorial Clerk MICHAEL W. WOOLDRIDGE, Draftsman Part-Time Staff ROSHAN B. BHAPPU, Senior Metallugist ROBIN C. LEASE, Geologist CORALS BRIERLEY, Ass't. Chemist, Biology RUFIE MONTOYA, Dup. Mach. Oper. E. JACK COATS, Editorial Clerk JOHN REICHE, Instrument Manager ROLAND F. DICKEY, Public Relations Graduate Students UMAR M. UDDIN AHMAD, Metallurgist JIM BRUNING, Geologist ROGER ALLMENDINGER, Geologist CHARLES WILLIAM HARRIS, Geologist WILLIAM AVERILL, Metallurgist MICHAEL JAWORSKI, Geologist N. BAKSHANI, Metallurgist HENRY HANS KOEHN, Geologist Plus more than 28 undergraduate assistants New Mexico Tech Staff Advisors GALE BILLINGS, Geoscience PAIGE W. CHRISTIANSEN, Historian-Mining ALLAN R. SANFORD, Geophysics W. K. SUMMERS, Geothermal FRANK B. TITUS, Hydrology
3 New Mexico State Bureau of Mines and Mineral Resources Circular 120 SEISMICITY OF THE RIO GRANDE RIFT IN NEW MEXICO by A. R. Sanford, A. J. Budding, J. P. Hoffman, O. S. Alptekin, C. A. Rush and T. R. Toppozada Socorro 1972
4
5 New Mexico State Bureau of Mines and Mineral Resources Don H. Baker, Jr., Director A Division of New Mexico Institute of Mining and Technology Stirling A. Colgate, President BOARD OF REGENTS Ex Officio Bruce King, Governor of New Mexico Leonard DeLayo, Superintendent of Public Instruction Appointed William G. Abbott, Chairman, , Hobbs Henry S. Birdseye, , Albuquerque Ben Shantz, , Silver City Steve Torres, , Socorro James R. Woods, , Socorro Published by Authority of State of New Mexico, NMSA 1953 Sec Printed by University of New Mexico Printing Plant, April 1972 Available from New Mexico Bureau of Mines, Socorro, NM Deposited in public libraries Price $1.25 ii
6 PREFACE We have attempted to establish the degree of seismic risk along the Rio Grande Valley in New Mexico. The results of the study are necessarily preliminary because the data used for estimates of seismic risk are quite limited, particularly instrumental studies of earthquakes and geologic investigations relevant to the seismicity problem. Undoubtedly as more of these types of information become available, some of the conclusions reached in this paper will need to be modified. The text was written for the non-specialist as well as the seismologist. We hope that engineers who must consider seismic risk in the design of structures, and officials responsible for public safety, will use the results of this study in their work. The authors are indebted to Stuart A. Northrop, Richard H. Jahns, and David B. Slemmons for reviewing the paper and making many useful suggestions to improve its content. We also wish to thank Professor Northrop for providing historical information on some earthquakes in New Mexico. Assistance from the Albuquerque Seismological Center (ERL, NOAA) in the form of equipment and data, is gratefully acknowledgeed. John Hoffman, a coauthor of this report, is a staff member of the Albuquerque Seismological Center. This study was supported by a National Science Foundation Grant (GA 4446). Socorro Nov 1971 Allan R. Sanford Professor of Geophysics Geoscience Department New Mexico Institute of Mining and Technology iii
7
8 CONTENTS Page iii PREFACE 1 ABSTRACT 1 INTRODUCTION 2 SEISMICITY BASED ON EARTHQUAKE DATA 2 Earthquakes prior to Earthquakes after Microearthquake studies in the Rio Grande Rift 10 Socorro region 10 Albuquerque region 11 Las Cruces region 12 Bernardo to Socorro 13 Summary and conclusions 14 SEISMICITY OF SOCORRO REGION BASED ON GEOLOGIC DATA 14 Tectonics 16 Relation of seismicity to tectonics 16 Determination of seismicity from fault scarps 17 SUMMARY 19 REFERENCES V
9 Page viii viii ILLUSTRATIONS Figures 1 Seismicity risk maps 2 Rio Grande rift zone 11 3 Night-time shocks at Albuquerque vs. S-P interval 11 4 Distance from Albuquerque vs. distance from Socorro, for events detected by both stations 12 5 Night-time shocks at Las Cruces vs. S-P interval 13 6 Epicenters from Bernardo to Socorro 13 7 Seismic energy release from Bernardo to Socorro 15 8 Quaternary fault scarps Maps 6 1 Tectonic map from Belen to San Antonio 9 2 Geomorphic map from Belen to San Antonio Tables 2 1 Strong earthquakes in Rio Grande depression 1869 to Relation between magnitude, intensity, and perceptibility of California earthquakes 4 3 Instrumentally located earthquakes with magnitudes 2.7 or greater from 1960 through Seismograph stations used 11 5 Minimum magnitude events considered in analyzing Albuquerque records 17 6 List of most prominent scarps offsetting geomorphic surfaces, and magnitude of associated earthquakes 17 7 Degrees of seismicity for different ages of fault scarps vii
10 Figure 1. Seismic risk maps. Intensitites according to Modified Mercalli Intensity Scale of Figure 2. Rio Grande rift zone. Viii
11 ABSTRACT The Rio Grande rift zone is the most probable area of New Mexico to have substantial seismic activity. The principal data used in establishing the seismicity of this region were: (1) reports of strong earthquakes before 1960, (2) instrumental studies of moderate shocks (M L >2.7) after 1960, (3) analyses of microearthquakes (M L <2.7) recorded at Albuquerque, Socorro, and Las Cruces, and (4) analysis of fault scarps offsetting the Quaternary geomorphic surfaces in the Socorro area. Historical reports indicate a moderately high seismic risk in a zone from Albuquerque to Socorro. In this region, particularly near Socorro, the largest shock in a 100-year period is likely to be magnitude 6. Instrumental data on earthquakes (M> 2.7) since 1960 show that activity is highest near Socorro and Las Cruces. However, estimated seismic risk from these data is low, with a maximum magnitude shock of about 5 each 100 years over the entire extent of the rift zone. Analyses of microearthquakes (M L <2.7) also lead to low estimates of seismic risk in the rift zone, e.g. a maximum magnitude shock of 4.6 in the Socorro-Bernardo region each 100 years. Historical reports, spanning a century, are probably more reliable indicators of seismic risk than the relatively short-term instrumental data spanning only about a decade. The historical data indicate probability of a magnitude 6 earthquake each 100 years. Both categories of data indicate seismic risk is not uniform and is greatest in the following regions: (1) Socorro-Bernardo, (2) Albuquerque-Belen, and (3) El Paso-Las Cruces. In the region of highest seismic risk, Socorro-Bernardo, little direct correlation exists between the distribution of microearthquakes and faults. Analyses of data for faults offsetting recent geomorphic surfaces indicates seismic activity has been occurring in the Socorro-Bernardo region for thousands of years. Estimates of seismicity based on the fault scarps cover a fairly wide range because of the uncertainty in the age of the scarps. However, the most reasonable estimates for the age yield seismicity values comparable to those calculated from earthquake data. INTRODUCTION In 1959, Richter published a seismic regionalization map for the conterminous United States (fig. 1). This map shows five regions in which major damage from earthquakes might be expected, at least occasionally. The type of damage to be expected includes partial collapse of substantial buildings, shifting of buildings off foundations, and the breaking of underground pipes. One of the regions shown on Richter's map is a zone kilometers wide following the Rio Grande Valley south from Bernalillo, New Mexico, to the Great Bend country of Texas. In New Mexico, this seismic region coincides with the Rio Grande rift (fig. 2), a prominent chain of structural depressions extending north-south through central New Mexico from the Colorado boundary to Mexico (Kelley, 1952, 1956). The Rio Grande rift is the most likely area in New Mexico to have significant seismicity because the structures comprising the rift were formed during the latest period of tectonic activity. Pediment surfaces offset by fault scarps, historical reports of earthquakes, and recent instrumental seismic studies indicate that tectonic activity within the rift continues to the present time. Since the publication of Richter's map, Algermissen (1969) has also released the results of another study of seismic risk in the United States (fig. 1). In contrast to Richter's results, his findings indicate moderate damage from earthquakes in the western half of the state, minor damage in the eastern half, and no zone of high seismic risk along the Rio Grande rift. One purpose of this study was to determine which of these estimates of seismic risk for the Rio Grande rift is more nearly correct. The problem is of more than academic interest because New Mexico's principal population centers, and much industry, are located in the rift zone. Recent studies in California (Steinbrugge, Cloud, and Scott, 1970) show that an earthquake of only moderate strength near a population center can cause extensive damage. A comparable seismic event in New Mexico could be much worse because of the absence of consideration of seismic risks in the state building code. The principal data used to establish the seismicity of the Rio Grande rift zone were: (1) Historical reports of strong earthquakes before (2) Instrumental studies of moderate shocks throughout the state after (3) Analysis of instrumentally recorded microearth- 1
12 quakes at Albuquerque, Socorro, and Las Cruces. (4) Analysis of fault scarps offsetting the Quaternary geomorphic surfaces in the Socorro area. Although this study involved a great deal more data than those of Richter and Algermissen, much of the information, particularly geologic, comes from only a short segment of the rift near Socorro. This appears to be the most seismically active region, but additional studies probably should be undertaken to provide a more uniform distribution of data from the entire length of the rift zone. SEISMICITY BASED ON EARTHQUAKE DATA Earthquakes Prior to 1960 Most of the information on locations and strengths of earthquakes prior to 1960 is based on noninstrumentally determined values of earthquake intensity. Intensity values are determined by the reactions and observations of people during a shock and the degree of damage to structures. Given many observations, the point of maximum intensity and the limits of perceptibility can be established. Both of these factors can be roughly related to the earthquake magnitude, an instrumental measure of the strength of an earthquake. The principal weakness in determining the strengths and locations of earthquakes from intensity observations is that this method depends on population density. In the most sparsely populated sections of New Mexico, moderate shocks may go completely unreported. Even in the areas of relatively high population density, as along the Rio Grande, the point of maximum intensity may not be defined because of too few observations. Most of the statistical bias arising from population density can be eliminated by considering only the obviously strong earthquakes, i.e. earthquakes with high maximum intensities and large areas of perceptibility. Also for the strong earthquakes, the intensity observations are sufficiently numerous to indicate whether the epicenter does or does not lie in the Rio Grande rift. However, the observations for the best TABLE 1 Strong earthquakes in Rio Grande depression, 1869 to 1960 The reported maximum intensity of these shocks is not as high as those listed above. However, the fact that instrumental locations could be determined indicates substantial strength. At the time of these earthquakes, the nearest station, Tucson, was about 500 km away, and the instruments (Wood- Andersons) were of low sensitivity (magnification equal to 2800) by modern standards. 2
13 documented New Mexico earthquakes are not adequate to accurately pinpoint the epicenter. Even if large numbers of observations existed, the epicenter might be difficult to establish noninstrumentally because of the manner in which the ground can influence intensity (Richter, 1958, p ). The reason for incorporating noninstrumental data on earthquakes in this study is that they are available for a span of years about ten times greater than the period for which instrumental data is available. Strong earthquakes are rare events, hence the longer the earthquake history available, the more reliable the estimates of seismic risk. Table 1 lists strong earthquakes occurring within the Rio Grande rift system from 1869 to The first part is restricted to events having maximum reported intensities of VII or greater. Some characteristics of intensity VII are (1) everybody runs outdoors, (2) difficult to stand, (3) damage to weak masonry (e.g. adobe) structures, (4) weak chimneys broken at roof line, and (5) fall of plaster, loose bricks, stones, tiles, etc. TABLE 2 Relation between magnitude, intensity, and perceptibility of California earthquakes (from Richter, 1958, p. 353) The second part of table 1 includes three shocks with maximum intensities rated at less than VII. However, the fact that these events could be located instrumentally indicates an earthquake of substantial strength. At the time of these earthquakes, the nearest seismic station, Tucson, was about 500 kilometers (300 mi.) away, and the instruments were of low sensitivity by modern standards. To be detected at Tucson, the magnitude (M L ) of these events would have had to be greater than 4.7. Also the epicenters of these earthquakes could have been some distance from the point of maximum reported intensity. Only one New Mexico shock as strong as any of those listed in table 1 is known to have occurred outside the Rio Grande rift from 1869 to This shock, with an instrumental magnitude of 51/2, occurred September 17, 1938, in the Gila National Forest during an eight-month earthquake swarm. The radius of perceptibility was about 100 kilometers (60 mi.) (Neumann, 1940). Over this long period of time, therefore, the central Rio Grande rift was by far the most seismically active region of New Mexico. The shocks listed in table 1 are the principal seismic evidence used by Richter (1959) to assign substantial seismic risk to the Rio Grande rift south of Albuquerque. Of these nine strong shocks, the three near Socorro in 1906 are probably the best documented and most significant. All three occurred during a prolonged earthquake swarm that commenced July 2, 1906, and continued through the early part of 1907 (Reid, 1911; Sanford, 1963). The largest of the several hundred shocks in this swarm occurred on July 16, 1906, and was felt to a distance of 330 kilometers (200 mi.). Using the relations between magnitude and radius of perceptibility in table 2, the magnitude of the July 16th shock could have been somewhere near 61/2. This shock and its companions on July 12, 1906, and November 15, 1906, are the strongest seismic events to occur anywhere in New Mexico during the past 100 years. Earthquakes After 1960 For California, Richter (1958, p. 353) has established generalized relations among maximum intensity, earthquake magnitude, and radius of the region over which the shock is felt (table 2). Recent data from instrumentally recorded shocks at several locations in New Mexico, including the Rio Grande Valley, indicate similar relations among these parameters. For an earthquake with a maximum intensity VII, the magnitude (ML) is about 5, and the radius of perceptibility is 180 kilometers or 110 miles (table 2). Instrumental studies of earthquakes in New Mexico were started in June, 1960, when high-magnification seismographs were placed in operation by the New Mexico Institute of Mining and Technology (New Mexico Tech) at Socorro, and by the Atomic Energy Commission at Sandia Base near Albuquerque. These two stations provided some information on locations and strengths of earthquakes in New Mexico, but accurate locations throughout the state were not possible until the beginning of 1962, when additional high-gain stations went into operation in New Mexico and in bordering states (e.g., Las Cruces, New Mexico (LCN); Payson, Arizona (TFO); and Ft. Sill, Oklahoma (WMO)). Also, at this time the U.S. Coast and Geodetic Survey (now Environmental Research Labora- 3
14 tories (ERL), NOAA) established a regular reporting station at Albuquerque (ALQ). Table 3 lists earthquakes occurring within the Rio Grande rift system from 1960 through 1970 with local or Richter magnitudes (M L ) equal to or greater than 2.7. The sources of information on shocks from 1962 through 1967 are publications by Sanford (1965) and Sanford and Cash (1969). The data for later shocks come from the Earthquake Data Reports of Preliminary Determinations of Epicenters published by the Environmental Research Laboratories (ERL). Information on the stations used to locate the earthquakes is given in table 4. Under "Magnitude" in table 3 are four columns. If a magnitude is listed under the first column, its value was determined by ERL. Magnitudes appearing in the next three columns were calculated by New Mexico Tech from Albuquerque (ALQ), Socorro (SNM), or Las Cruces (LCN) records. Magnitudes followed by a "(B)" are based on amplitudes of the P phases (Richter, 1958, p ). Magnitudes followed by "(L)" are based on the amplitudes of S phases (Sanford and Cash, 1969). Empirical relations given by Richter (1958, p. 348) indicate m b and M L magnitudes are equal at 6.7. Below this value, m b is increasingly greater than M L, e.g., an M L of 2.7 is equivalent to an m b of 4.2. Therefore, in terms of m b, the minimum magnitude shock in table 3 is about 4. The magnitude normally reported by ERL is m b. The possible error in locations of epicenters in table 3 ranges from about 8 kilometers for events less than 25 kilometers from recording stations in New Mexico to 24 kilometers for events farthest removed from these stations. The pattern of seismic activity since 1960 appears to differ considerably from that of the previous 90 years. The 17 earthquakes listed in table 3 constitute only about 30 percent of the total number of earthquakes (with M L greater than 2.7) in New Mexico during the entire eleven-year period. The percentage is even less if the total includes after-shocks of the largest quake. The latter had a magnitude (m b ) of 5.5 and an epicenter on the northern border of New Mexico 130 kilometers west of the Rio Grande rift. Nearly all the other located shocks originated in the northeastern quadrant of the state, a region without strong earthquakes during the past 100 years. TABLE 3 Instrumentally located earthquakes with magnitudes 2.7 or greater from 1960 through 1970 *Although NMT locations for these events are only based on 1 or 2 stations, one station (SNM) was close to the epicenter. Locations listed here are known to be more accurate than those given in U. S. Earthquakes 1960, 1961 (Talley and Cloud, 1962; Lander and Cloud, 1963). The latter publications do not list any other instrumentally detected or reported felt earthquakes in New Mexico for 1960 and

15 tween magnitude and number of shocks in the Rio Grande rift for a 100-year period becomes approximately If we let N equal 1, we find that equation (2) predicts that the strongest earthquake in the rift for a 100-year period will be 4.9. However, data in tables 1 and 2 indicate there must have been at least six shocks in the 100-year interval from 1869 to 1969 with M L greater than 4.9. In fact, the largest earthquake during this period appears to have had a magnitude of about 6 1/2. The Rio Grande rift earthquakes listed in table 2 were concentrated in two areas, one centered near Las Cruces (from 31.8 N to 32.4 N and W to W), the other centered near Socorro (from 33.9 N to 34.5 N and W to W). Six shocks with M L ranging from 2.8 to 3.4 occurred in the first area, and eight shocks with M L from 2.7 to 3.8 occurred in the second area. Microearthquake Studies in the Rio Grande Rift The recent instrumental data indicate that significant seismic activity may be occurring outside the Rio Grande rift, particularly in the northeast quadrant of the state. Seismic activity could have occurred previously, but was unreported because of the low population density. To assume, on the basis of this instrumental data, that seismic risk is higher in the northeastern quadrant of the state than along the Rio Grande rift, would probably be a mistake. An eleven-year time period is far too short, and the total number of shocks (approx. 50) far too small, to estimate seismicity. To illustrate how misleading instrumental data alone can be, consider an estimate of the seismicity of the Rio Grande rift based on the shocks listed in table 3. The empirical relation between number of shocks and magnitude is (Richter, 1958, p ): where N is the number of shocks of magnitude M L or greater. If we assume b is equal to 1, a value found for many seismic areas of the world, we can calculate a value of a from the data in table 2. The computed a 3.9, is the log to the base 10 of the number of shocks of M L greater than 0 for the eleven year period. To extrapolate the relation to a 100-year period, one must add to a the log /11, i.e., The relation be- A microearthquake differs from a regular earthquake only in magnitude. A microearthquake is defined herein as a natural seismic event having M L less than 2.7. No lower limit to the magnitude of a microearthquake exists other than the ability to detect it. Thus, events with magnitudes less than 0 (i.e., negative) are not only possible, but commonly recorded. The principal reason for microearthquake investigations is that weak earthquakes are more numerous than strong earthquakes. In most seismic areas, the number of shocks increases by about a factor of 10 for each unit decrease in. magnitude (Richter, 1958, p. 359). For example, the number of magnitude 0 shocks will be approximately one thousand times greater than the number of magnitude 3 shocks. By investigating the weaker shocks, a large amount of seismic data can be gathered in a short period of time, even in regions having relatively low earthquake activity, as New Mexico. The micro-earthquake data provide information on the distribution of seismic activity, the dominant type of tectonic movement, and crustal structure. However, in New Mexico, and probably elsewhere, the number of microearthquakes detected (within rela lively short periods of recording) is not a good index of longterm (100-year) seismicity (Sanford and Singh, 1968; Singh, 1970). Microearthquake research is best performed with instruments having very high magnification and good high-frequency as well as low-frequency response. Magnifications of several million, up to frequencies of 30 Hz (Hertz) or more, are fairly typical for microearthquake seismographs. However, standard equipment, with magnifications of only a few hundred thousand and limited high-frequency response, provide useful records if they are near a source of microearthquakes. 5

16
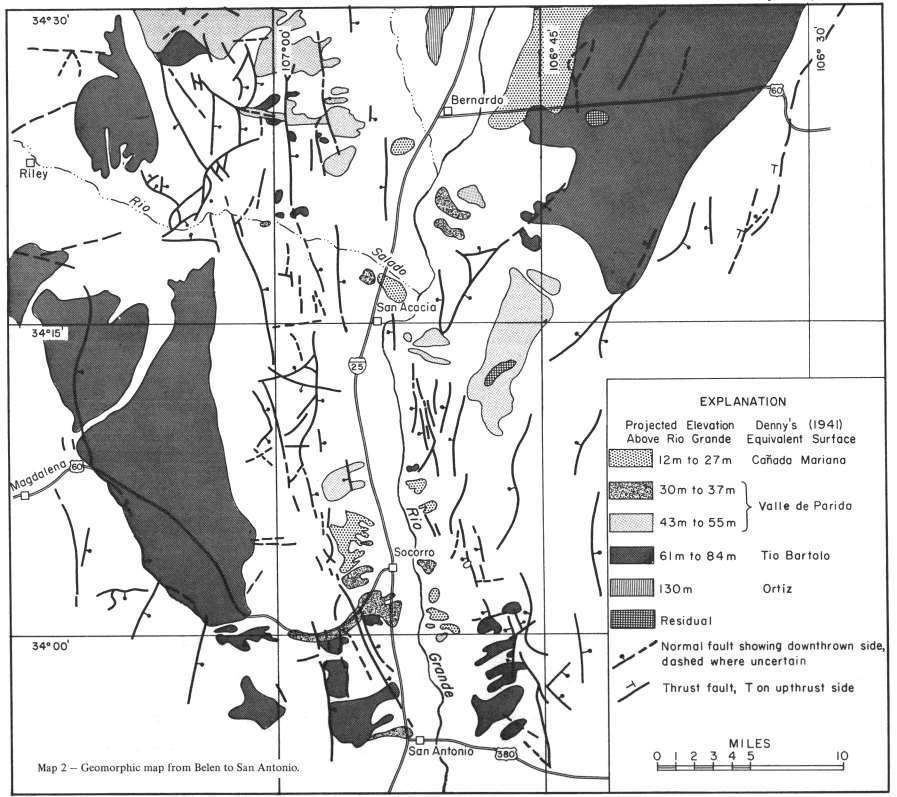
17 8 Sources of Information for Map 1 1. Black, B. A., 1964, The geology of the northern and eastern parts of the Ladron Mtns., Socorro Co.: Univ. New Mexico, M. Sc. thesis. 2. Budding, A. J. and others, 1966, unpublished map of part of Magdalena Mtns. 3. Dane, C. H., and Bachman, G. 0., 1965, Geologic map of New Mexico: U. S. Geol. Surv. 4. Kelley, V. C., 1954, Tectonic map of part of Upper Rio Grande Area: U. S. Geol. Surv. Oil and Gas Investigations Map OM Kelley, V. C., and Wood, G. H., 1964, Lucero Uplift: U. S. Geol. Surv. Oil and Gas Investigations Preliminary Map Wilpolt, R. H., MacAlpin, A. J., Bates, R. L., and Vorbe, G., 1946, Geologic map and stratigraphic sections of Paleozoic rocks in Joyita Hills, Los Pinos Mountains and Northern Chupadera Mesa, Valencia, Torrance, and Socorro Counties, New Mexico: U. S. Geol. Surv. Oil and Gas Investigations Preliminary Map Wilpolt, R. H., and Wanek, A. A., 1951, Geology of the region from Socorro and San Antonio east to Chupadera Mesa, Socorro County, New Mexico: U. S. Geol. Surv. Oil and Gas Investigations Map OM 121. Notes on Geomorphic Map The map was constructed from the topographical contour maps of 1:24,000 and 1:62,500 scale. Surfaces having uniform slope as indicated by the contour spacing were outlined. The gradient of the surfaces is about 300 feet per mile near the mountains and diminishes to about 10 feet per mile near the Rio Grande. The slopes of the surface remnants were projected out to the Rio Grande flood plain on the basis of this progressive reduction in slope, and their elevations above the flood plain were thereby determined. The elevations fall into five groups which correspond approximately to Denny's (1941) four surfaces, with his "Valle de Parida" subdivided into two surfaces.
18
19 Socorro region Investigation of the microearthquakes in the Rio Grande rift began at Socorro in Results of the studies on weak shocks originating near Socorro have been described by Sanford and Holmes (1961,1962), Sanford (1963), Sanford and Long (1965), Sanford and Singh (1968), and Singh (1970). Aspects of the research important to the seismicity of the Rio Grande rift are summarized below. The number of earthquakes with magnitudes of 0 or greater, originating within 20 kilometers of Socorro averages about 400 a year. Most of the microearthquakes are located west and southwest of Socorro. The prominent fault separating Socorro Mountain from Socorro Basin (Sanford, 1968) has little or no activity. A careful statistical analysis of five years of Socorro data (S-P<<3.0 sec) by Sanford and Singh (1968) has indicated that long-term (100-year) seismicity probably cannot be predicted from the microearthquake activity. The number of microearthquakes observed in the Socorro region is at least an order of magnitude less than expected for a region that has had shocks as strong as those listed in table 1. From this study, the relation between number of earthquakes and magnitude for a 100-year period was found to be: The total area covered in this study was about 2,000 square kilometers. The 100-year recurrence relation for an equivalent area of the Los Angeles Basin in California is (Allen and others, 1965): Albuquerque region The recording at Socorro since 1960 appears to show that at the present time the Socorro area is the most active segment of the Rio Grande rift from Santa Fe to Las Cruces. To confirm this observation, special studies of records from the Albuquerque (ALQ) and Las Cruces (LCN) stations were undertaken. The Albuquerque study involved four and one-half years of records from January 1, 1962, through June 30, 1964, and from January 1, 1965, through December 30, The records from July 1, 1964 to January 1, 1965 were not studied. All available records were examined for natural earthquakes having S-P intervals of from 0 to 15 seconds (equivalent to epicentral distances of 0 to about 120 km). The S-P interval, which is the time separation in seconds between the P-wave and S-wave arrivals, is directly proportional to distance. For the Rio Grande rift zone the distance in kilometers is equal to 7.95 (S-P). Only shocks occurring from 0200 to 1300 GMT (19:00 to 06:00 MST) were considered to avoid the problem of the numerous daytime mining explosions. Socorro records also were examined for the same time period to determine which events were detected by both stations. A total of 96 earthquakes was identified on the Albuquerque records. The frequency distribution of these events as a function of S-P interval is shown in fig. 3. The shocks also recorded at Socorro are striped in fig. 3, the type of marking changing with distance (S-P interval) from Socorro. Fig. 3 is somewhat misleading because it appears to indicate considerable activity near Albuquerque. However, the minimum-level earthquake considered in the analysis increases in magnitude with distance from Albuquerque as shown in table 5. Thus the majority of shocks near Albuquerque are very weak in comparison with events that occurred at distances of 64 kilometers (S-P = 8.0) or greater. With the aid of Socorro records, a rough geographical grouping of most earthquakes beyond 64 kilometers from Albuquerque is possible. Fig. 4 is a plot of the distance from Albuquerque versus the distance from Socorro for all events detected by both stations. Most of the points on this graph lie near a straight line drawn between the 106-km points on both axes. The distance between the Socorro and Albuquerque stations is 106 kilometers (62 mi.) and both stations lie within the Rio Grande rift. Thus the majority of events plotted on fig. 4 have epicenters within or along the Rio Grande depression. The distances in fig. 4 are determined from S-P intervals. Incorrect identification of the S phase, particularly on Albuquerque records, is believed to be the reason for the points falling left of the line in fig. 4. The distribution of points in fig. 4 suggests three separate regions of activity. Area A from other seismic data is known to lie southeast of Socorro. All shocks in area A are from an earthquake swarm of about two-months duration. The swarm started 18:00 GMT May 26, 1965, and, within a period of 24 hours, 136 shocks were recorded at Socorro. The frequency of shocks gradually diminished with time, but the two largest events of the series did not occur until very near the end of the swarm. Area B surrounds Socorro and area C is 64 kilometers south of Albuquerque. The total energy release of all 96 earthquakes in fig. 3 is 3.9 x ergs. The energy release from areas A, B, and C described above are: A B + C A + B + C 1.9x ergs 1.6 x ergs 3.5 x ergs Therefore, the energy contributed by shocks located within the three areas shown in fig. 4 is about 90 percent of the total. If A is eliminated from the statistics, then areas B and C account for 80 percent of the total energy release. If one makes 10
20 the reasonable assumption that detection of earthquakes is equally probable north and south of Albuquerque, then the results of this study are indicative of the seismicity over a reach of the Rio Grande rift zone extending from Santa Fe to Las Cruces region The study of records from the Las Cruces station (LCN) was restricted to a two-year period from July 1, 1963, to July 1, Only shocks occurring between 00:00 GMT (17:00 MST) and 14:00 GMT (07:00 MST) and having S-P << 25.0 seconds were considered in the analysis. Socorro. The analysis of Albuquerque records clearly shows that recent seismic activity along this segment of the rift is concentrated near Socorro. This study also confirmed the existence of a zone (area C) of activity in the rift centered about 35 kilometers north of Socorro. The four and one-half years of data used in this investigation indicate that area C may be about one-third as active (about 150 per year with M >> 0) as B in the vicinity of Socorro. 11
21 A total of 40 shocks was identified on the Las Cruces records. The distribution of these events as a function of S-P interval is shown in fig. 5. Fifteen of the 40 events had epicenters near Socorro, and of this number 13 occurred during the two-month swarm (May-July, 1965) from area A shown in fig. 4. All the shocks with S-P<<4.0 seconds were probably due to earthquakes within the southern part of the rift. The strongest earthquake of this group (M L = 2.9) was located northwest of the Las Cruces station (Sanford, 1965). Shocks that have S-P>>11.0, and that were not detected at Socorro, probably lie south of a line drawn through the Las Cruces station; had they been north of this line, the Socorro station should have detected them. A significant fraction of earthquake activity south of Las Cruces could be located within a possible southward extension of the rift zone into Mexico. From mid-1966 through 1969, the ERL located eight shocks in northern Chihuahua, Mexico, from 30.0 N to 30.5 N and W to W, in an area that, from geologic considerations, could be part of the rift zone. The two shocks with S-P = 24.0 seconds in fig. 5 could have originated from this region of Mexico. However, without additional multiple-station studies for the Las Cruces region little can be said with confidence about the location of any event with an S-P>>5.0 seconds. Bernardo to Socorro Because evidence has indicated a relatively high degree of seismicity along the Rio Grande rift from Bernardo to Socorro (regions B and C of fig. 4), special studies in this area were undertaken. On June 1, 1969, a remote station (SRM) was put into operation about 30 kilometers directly north of Socorro. Later, in collaboration with the Albuquerque Seismological Center, stations (SCC and SBB) were established about 20 kilometers west and 42 kilometers northeast of Socorro. Precise locations of the stations SRM, SCC, and SBB are given in table 4. The results of a 13-month study, using data from the five stations ALQ, SNM, SRM, SBB, and SCC, are given in figs. 6 and 7. Fig. 6 shows the distribution of epicenters. Locations given in black are relatively accurate, probably within 1.5 kilometers of the true epicenter. Locations given by open circles are less accurate, and the poorest of these could be as much as 5 kilometers from the true locations. The numbers opposite the symbols indicate the number of shocks from each location. Fig. 7 shows the distribution of energy release for the same 13-month period (June 1, 1969 to July 1, 1970). Figs. 6 and 7 indicate current microearthquake activity is far from uniformly distributed in the region, tending to be concentrated in relatively narrow zones. The relation of these seismic zones to the known structure is not obvious. Activity appears to be unrelated to the fault-defined margins between basins and highlands. For example, the large and sharp faults (Sanford, 1968) that separate the Socorro-Polvadera Mountains from the Socorro Basin are nearly aseismic. Instead, the activity near Socorro falls within a zone that cuts obliquely (northeastward) across the north-trending mountains just north of the town. Other fault-defined boundaries between basins and highlands having little or no activity are the eastern margin of the Socorro Basin and the eastern front of the Magdalena Mountains. In the northern half of the area, most of the earthquakes are located in a broad zone along the southern margin of the Albuquerque-Belen Basin, and beneath the narrow structural constriction at San Acacia separating the Albuquerque-Belen and Socorro Basins. The crust beneath the Socorro Basin appears to be aseismic. The lack of correlation everywhere between rift structure and zones of microearthquake activity could indicate a recent shift of tectonic stresses. On the other hand, the sampling period is extremely short, and, therefore, the observed distribution of microearthquake activity may not accurately represent the distribution of stress within the region. The zones of microearthquakes may only indicate areas where relatively minor concentrations of stress are being relieved. Large concentrations may exist along the major faults of the rift, but these stress concentrations would have to be relieved by strong shocks which are relatively rare in the region. In other words, the areas that are likely to produce shocks as large as those that occurred in 1906 may currently show little or no microearthquake activity. The distribution of energy release shown in fig. 7 indicates two centers of relatively high activity, one located southwest of Socorro, the other southeastward from the Ladron Mountains to San Acacia. However, the entire area during the period of study can hardly be characterized as a region of high seismicity. The total energy release, about 3 x ergs, is about equivalent to the energy released by a single magnitude 3 earthquake. 12
22 Another indication of the low seismicity during the period of study comes from the relation between number of shocks and magnitude. The relation for the 13-month period is: If the relation is adjusted to a 100-year period, it becomes: On the basis of equation (5), the strongest shock in a 100- year period would be 4.2, whereas from an earlier study (equation 3) the strongest earthquake for the same period would be 4.7. The difference is significant because the area north from San Acacia (fig. 6) was not covered in the earlier study (Sanford and Singh, 1968). The discrepancy between equations (3) and (5) is the result of temporal variations in seismic activity in the region. Tables 1 and 2 indicate that several shocks with magnitudes much greater than 4.2 have occurred in the Bernardo- Socorro area during the past 100 years. Therefore, this study, as well as an earlier one by Sanford and Singh (1968), indicates that long-term seismicity probably cannot be accurately predicted from a short-term observation of microearthquakes. Summary and Conclusions The distribution of seismic activity in the Rio Grande rift is fairly well established. Historical reports and recent instrumental studies indicate that most of the shocks have been occurring south from Albuquerque, with the most intense activity centered near Socorro. The level of activity is difficult to appraise. Recent instrumental work, including microearthquake surveys, indicates a modest degree of seismicity. These studies point to a maximum magnitude (ML) shock within a 100-year period of only 4.2 to 4.9. On the other hand, historical records (table 1) show that at least one shock in excess of magnitude 6 has occurred within the past 100 years. This discrepancy can be explained in at least two alternative ways. First, seismic activity during the instrumental studies, i.e. since 1960, may have been anomalously low, so that seismic risk could be underestimated. Second, the instrumental estimates of longterm seismicity may be essentially correct, so that activity in the past was anomalously high (particularly at Socorro) and is not likely to be repeated for several centuries. At this time, there is inadequate information to provide a reasonable choice between these two alternatives. The safe procedure therefore is to assume the worst, i.e. that shocks of 13
23 magnitude as great as 6 are likely to occur along the rift, and particularly in the segment from Albuquerque through Socorro. A shock of this magnitude could be very destructive in a population center like Albuquerque. Even in the lower population areas south of Albuquerque, the damage would be extensive, particularly to the many adobe structures. The maximum intensity for a magnitude 6 shock is VII- VIII (see table 2). Therefore, Richter's estimate of seismic risk for the Rio Grande rift zone appears to be too high and Algermissen's too low (see fig. 1). SEISMICITY OF SOCORRO REGION BASED ON GEOLOGIC DATA Tectonics In the Socorro area, the rift structure is expressed by elevated northward-trending blocks that are separated by structural depressions (map 1). From east to west, the structural highs are the Joyita Hills, the Ladron Peak-Polvadera Peak-Socorro Peak block with its southern extension into the Chupadera Mountains, and the Magdalena Mountains-Bear Mountains block. These features are separated by the Rio Grande Valley and La Jencia (La Jense) Basin. The basins are filled with late Tertiary elastic sediments and volcanic rocks, mainly basalts, of the Santa Fe Group. The oldest rocks exposed in the uplifted blocks are Precambrian in age, and are overlain by Carboniferous, Permian, Triassic, and Cretaceous strata. Volcanic and sedimentary rocks of early Tertiary age are also present. The structures in the Phanerozoic rocks are complex; folding, steep reverse faulting, and normal faulting are the result of deformations that started near the end of the Mesozoic Era. The uplifted blocks are structurally higher to the north, where Precambrian rocks are extensively exposed in the Lemitar and Ladron Mountains, than to the south in the Socorro and Chupadera Mountains, where outcrops of Precambrian rocks are scarce. In a similar fashion, the Magdalena Mountains expose older rocks in their northern part. In the intervening troughs, a thick sequence of Santa Fe sediments overlies older rocks and obscures deeper structures to a great extent. The thickness of Santa Fe fill, as estimated from gravity data, is about 900 meters in the Rio Grande Valley and about 450 meters in La Jencia Basin (Sanford, 1968). Along the graben edge, Santa Fe beds are in fault contact with older rocks; locally, the Santa Fe overlapped the structural basin and is resting unconformably on older rocks. Where faults are exposed in the Santa Fe section the angles of dip range from 70 to 90. Dips of normal faults associated with graben structures usually are from 55 to 70. The higher dips observed in the Santa Fe section may represent fault refraction near the surface. Faults in the Santa Fe sediments are relatively young features; therefore, the steep dips are measured near the original surface and these may not reflect the attitude of the faults at deeper levels of the crust. The most satisfactory method, in terms of time and effort expended, for detecting faults in the Santa Fe Formation is from the stereoscopic study of aerial photographs. Black and white aerial photographs of the Socorro region are available from the U. S. Geological Survey at a scale of about 1:40,000. Small, partly eroded fault scarps may easily go undetected during ground observations, owing to the irregular nature of the terrain. More effective recognition of faults and fault scarps may be accomplished on aerial photographs by noting one or more of the following features: (1) Linear features, marked by a change in "color" tone, photographic texture, or changes in vegetation or drainage pattern not directly attributable to present erosional forms or land use practices. (2) Rectilinear escarpments, sometimes partially eroded, which may offset pediment, alluvial-fan, and other geomorphic surfaces. (3) Alignment of tributary arroyos and linear stream patterns; this is particularly noticeable as most of the drainage patterns on the Santa Fe Formation are dendritic. In spite of the relative ease with which faults can be recognized on the aerial photographs, field checking is the only way to positively identify the faults. The normal field criteria, such as interruption of strata, fault drag, slickensides, brecciation and unusual cementation, should be used to supplement photo interpretation in properly identifying faults. The pattern of faulting in the Rio Grande Valley (map 1) shows the same complexity as the structure of adjoining uplifted blocks. The faults have a predominant northward trend; other more widely spaced and shorter faults trend eastward. Movement along the northward trending faults is not necessarily downward on the side toward the river, as individual blocks appear as horsts within the broader, downdropped part of the valley structure. Indeed, the Socorro- Polvadera mountain block could be considered as an intergraben horst in a structural depression 32 kilometers wide (Denny, 1940). Faulting in the Rio Grande rift is discontinuous. Individual faults can be traced for several kilometers, but eventually they diminish in throw as traced along their strike; in such places movement is taken up by parallel faults. Within the Rio Grande Valley and La Jencia Basin, zones of closely spaced, parallel faults contrast with ground little affected by faulting. The zone of most intense faulting extends from San Antonio to San Acacia in the Rio Grande Valley (map 1), and this zone continues northward into the Albuquerque-Belen Basin to the latitude of Belen. The greater part of La Jencia Basin and the Rio Grande Valley east of Belen are relatively 14


 Fault scarp offsetting lower Valle de Parida surface southwest of Socorro.")

24 (a) Fault scarp in alluvium along the northeast side of the Magdalena Mountains is about one kilometer from the mountain front. Offset of alluvial surface is about 10 meters, downthrown to the northeast. Photograph is taken looking south. (b) One of the north-trending faults offsetting the upper Valle de Panda surface east of Ladron Peak. (c) Fault scarp offsetting lower Valle de Parida surface southwest of Socorro. Photograph is taken looking north along scarp on foreground. Socorro Canyon is south of basalt-covered spur against skyline. Figure 8. Quaternary fault scarps 15 (d) Same fault as shown in (c), as exposed in south wall of Socorro Canyon. Sandy layers of Santa Fe beds are offset, whereas overlying boulder beds are unaffected.
25 little affected by faulting. In these areas, the only recognized fault scarps are northeast of the Magdalena Mountains and east of the Bear Mountains, and in an area of 7 kilometers west of and parallel to the Manzano Mountains. In Quaternary time, an extensive series of geomorphic surfaces was developed on Santa Fe and older sediments. The oldest of these, termed the Ortiz surface (Denny, 1941), is about 130 meters above the present drainage and is preserved west of Bernardo between the Rio Puerco and the Rio Grande. Remnants of younger surfaces can be found at successively lower elevations. Extensive surfaces have been cut at meters, meters, meters and meters above the level of the present drainage. The surface at meters, or Cañada Mariana surface of Denny (1941), has been correlated with the Picacho surface of the Las Cruces area (Ruhe, 1964). The surfaces at meters, and meters were combined by Denny into the Valle de Parida Surface, which is considered the correlative of the Tortugas surface in the Las Cruces area. The surface at meters was named the Tio Bartolo by Denny. Several faults displace these surfaces in a vertical sense by as much as 15 meters (fig. 8 and map 2). Because these fault scarps are the most recent evidence of tectonism in the area, they are especially significant in an investigation of the seismicity. Relation of Seismicity to Tectonics A comparison between the tectonic map and the location map of epicenters of microearthquakes from June 1, 1969, through June 30, 1970 (fig. 6), shows little direct correlation between the distribution of faults and seismic events. For example, no microearthquakes occurred during this period near the prominent fault scarps along the eastern margins of the Magdalena and Bear Mountains. The zone of faults that extends southeast from Socorro Mountain also was aseismic. On the other hand, evidence of late Quaternary tectonism exists in the area of microearthquake activity extending southeast of Ladron Peak. The locations of epicenters shown in fig. 6 support the idea of a structural constriction in the rift zone near San Acacia. Epicenters converge from the north and from the south toward the San Acacia region, where a substantial part of the seismic energy release occurred (fig. 7). Determination of Seismicity from Fault Scarps Map 2 shows the relation between faults and geomorphic surfaces in the Socorro area. An estimate of seismicity based on the lengths and displacements of faults cutting the surfaces is useful because of the much longer span of seismic history incorporated in the estimate. Unfortunately, this estimate can only be approximate because of the uncertainty in the ages of the fault scarps. Several faults offset the Tio Bartolo and Valle de Parida surfaces (see fig. 8). The scarps cutting the Tio Bartolo surface appear to be as fresh in appearance as those offsetting the Valle de Parida surface, which is of the same age as the Tortugas surface in the Las Cruces area. Hawley and Kottlowski (1969) cite faunal evidence indicating the Tortugas surface may be Illinoian in age or about 400,000 years old (Ericson and Wollin, 1968). On the other hand, they also suggest the possibility that this surface might date from Early Wisconsin or from about 150,000 years ago (Ericson and Wollin, 1968). On the basis of the postulated ages of the surfaces, the fault scarps are certain to be younger than 400,000 years. The magnitudes of shocks producing the scarps can be determined from the empirical formula (King and Knopoff, 1968): where L and D are the length and maximum displacement of the fault expressed in centimeters. The longest series of fault scarps that could have been produced during a single earthquake lie along the eastern margin of the Magdalena and Bear Mountains. The maximum displacement, 10 meters, and aggregate length, 34 kilometers, of this fault yields a D to L ratio of 2.9 x From a compilation of fault parameters for strong historical earthquakes, Iida (1965) obtained an average D to L ratio of However, 2.9 x 10⁻⁴ is within the range of values obtained by Iida, and therefore, this ratio could be considered characteristic of faulting in the Socorro region. Equation (6), with a D to L ratio of 2.9 x 10⁻⁴, was used to calculate the magnitudes of the largest earthquakes associated with the observed scarps. Table 6 is a listing of the most important fault scarps, their lengths, probable maximum displacements, and the calculated magnitudes of the earthquakes associated with their formation. The 6 scarps listed could have been generated by 13 shocks ranging in magnitude from 7.1 to 7.9. Because the ratio of displacement to length for some of the most prominent scarps exceeds 2.9 x 10⁻⁴, it was necessary to assume that they were formed by more than one earthquake. A fault scarp, number 2 in table 6, crossing two geomorphic surfaces (map 2) indicates that repeated movements have occurred. The offset of the lower pediment surface is only about one-half that of the upper surface. A relation between number of earthquakes and earthquake magnitude can be established from equation (1) by assuming a value of b and knowing the number of shocks exceeding some prescribed value. The best estimate of b for the Socorro area is 1.0, a value obtained from 30 months of microearthquake data (Sanford and Singh, 1968). For a b value of 1.0 and the 13 shocks exceeding magnitude 7.1, the relation is: 16

26 The degree of seismicity derived from equation (7) depends on the age of the scarps. Table 7 gives the seismicity for two time intervals, 100 and 1,000 years, assuming three ages for the scarps. The first age listed, 400,000 years, gives an absolute minimum estimate of seismicity. In using this age, the scarps are assumed to have formed immediately after the formation of the Valle de Parida surface which is probably 400,000 years in age (Hawley and Kottlowski, 1969). If 400,000 is the true age, many fault scarps probably would have disappeared because of erosion, and thus any estimate of seismicity would be low. On the other hand, the estimate of seismicity obtained by assuming that fault scarps are less than 4,000 years old is very likely too high. The absence of scarps offsetting the youngest geomorphic features in the area suggests that the mapped scarps are older than 4,000 years. The estimate of seismicity obtained by assuming that the fault scarps are less than 40,000 years old is compatible with the historical earthquake activity in the Socorro region. However, by increasing the age span of the fault scarps to about 200,000 years, the seismicity becomes close to that indicated by microearthquake studies (Sanford and Singh, 1968). Until the ages of some scarps are accurately known, no precise estimate of the seismicity in geologically recent times is possible. However, even with broad limits on the age, the scarps indicate a level of seismic activity that is not drastically greater or lesser than that historically observed. Thus, earthquake activity in the Socorro area over the past 100 years is 17 not a recent development but has existed for many thousands of years. SUMMARY Historical reports of earthquakes indicate that the most seismically active segment of the Rio Grande rift zone in New Mexico extends southward from Albuquerque through Socorro. Within this zone, the seismicity has been substantially higher near Socorro than elsewhere. The seismic risk estimated from historical data is moderately high; a maximum magnitude shock of 6 is probable each 100 years. Instrumental data on earthquakes (M>2.7) since 1960 show that activity along the rift is highest in the vicinity of Socorro and Las Cruces. Estimates of seismicity for the entire rift based on the instrumental data are moderately low, with a maximum magnitude shock of about 5 each 100 years. Although the estimates of seismicity from instrumental and historical data are not in good agreement, both types of information indicate that the region of greatest earthquake activity in the rift is probably in the vicinity of Socorro. Analysis of microearthquakes (M<2.7) recorded at three locations, Albuquerque, Las Cruces, and Socorro, also shows that the region of highest activity in the rift at the present time is centered near Socorro. However, estimated seismicity from detailed studies of microearthquakes in the Socorro region is substantially lower (a maximum magnitude shock of 4.6 each 100 years) than expected from historical data. The historical data probably give the best and most reliable estimate of seismic risk because they extend over a much longer time period than the instrumental data. From historical information, the largest shock in a 100-year period is likely to be magnitude 6. This leads to a seismic risk in the Rio Grande rift that is less than the estimate of Richter (1959), but more than that of Algermissen (1969). However, the instrumental and historical data combined show that the seismic risk is not uniform. The areas of highest seismic risk, in descending order of risk, are: (1) Socorro-Bernardo, (2) Albuquerque-Belen, and (3) El Paso-Las Cruces. An area of very low seismic risk appears to lie between San Antonio and Hatch. In the region of highest seismic risk, Socorro-Bernardo, little direct correlation exists between the distribution of microearthquakes and faults, including recent faults offsetting geomorphic surfaces. An analysis involving the lengths, displacements, and ages of the fault scarps on the geomorphic surfaces indicates that the seismic activity in the Socorro- Bernardo region is not a recent development but has existed for many thousands of years. Estimates of seismicity obtained from the fault scarp data cover a fairly wide range because of the uncertainty in the age of the scarps. However, the most reasonable estimates for the age yield seismicity values comparable to those calculated from the earthquake data. References follow
New Mexico Geological Society
 New Mexico Geological Society Downloaded from: http://nmgs.nmt.edu/publications/guidebooks/34 Recent measurements of crustal deformation related to the Socorro magma body, New Mexico Shawn Larsen and Robert
Lecture # 6. Geological Structures
 1 Lecture # 6 Geological Structures ( Folds, Faults and Joints) Instructor: Dr. Attaullah Shah Department of Civil Engineering Swedish College of Engineering and Technology-Wah Cantt. 2 The wavy undulations
United States Department of the Interior
 IN KHM.Y RKKKR'IO. United States Department of the Interior GEOLOGICAL SURVEY BOX 25016 'M.S._911_ DENVER FEDERAL CENTER DENVER, COLORADO 80225 May 1A, 1981 Memorandum To: Through: From: Mr. Mr. Earl W.
Cenozoic Extensional Basin Development and Sedimentation in SW Montana
 Cenozoic Extensional Basin Development and Sedimentation in SW Montana Robert C. Thomas Department of Environmental Sciences, The University of Montana Western, Dillon, MT 59725, (406) 683-7615, r_thomas@umwestern.edu
Structural Geology Lab. The Objectives are to gain experience
 Geology 2 Structural Geology Lab The Objectives are to gain experience 1. Drawing cross sections from information given on geologic maps. 2. Recognizing folds and naming their parts on stereoscopic air
Section 7. Reading the Geologic History of Your Community. What Do You See? Think About It. Investigate. Learning Outcomes
 Chapter 3 Minerals, Rocks, and Structures Section 7 Reading the Geologic History of Your Community What Do You See? Learning Outcomes In this section, you will Goals Text Learning Outcomes In this section,
New Mexico Geological Society
 New Mexico Geological Society Downloaded from: http://nmgs.nmt.edu/publications/guidebooks/25 Structure of the Guadalupe Box area, Sandoval County, New Mexico Harvey R. DuChene, 1974, pp. 131-135 in: Ghost
Continental Landscapes
 Continental Landscapes Landscape influenced by tectonics, climate & differential weathering Most landforms developed within the last 2 million years System moves toward an equilibrium Continental Landscapes
New Mexico Geological Society
 New Mexico Geological Society Downloaded from: http://nmgs.nmt.edu/publications/guidebooks/35 Seismicity of the Rio Grande rift in northern New Mexico, 1973-1983 Daniel J. Cash and Joyce J. Wolff, 1984,
Dynamic Crust Regents Review
 Name Dynamic Crust Regents Review Base your answers to questions 1 through 3 on the table below, which lists the location of some earthquakes, their Richter magnitude, and their year of occurrence. Data
(1) Identify 5 major principles of relative dating? For each principle, describe how you tell what is younger and what is older.
 Identify 5 major principles of relative dating? For each principle, describe how you tell what is younger and what is older.") Things to Know - Third GLG101Exam Page 1 Important Note: This is not everything you need to know or study. However, it provides you with a relatively comprehensive list of questions to help you study.
Things to Know - Third GLG101Exam Page 1 Important Note: This is not everything you need to know or study. However, it provides you with a relatively comprehensive list of questions to help you study.
Contemporary Tectonics and Seismicity of the Teton and Southern Yellowstone Fault Systems- Phase I
 University of Wyoming National Park Service Research Center Annual Report Volume 4 4th Annual Report, 1980 Article 16 1-1-1980 Contemporary Tectonics and Seismicity of the Teton and Southern Yellowstone
Name. GEOL.5220 Structural Geology Faults, Folds, Outcrop Patterns and Geologic Maps. I. Properties of Earth Materials
 I. Properties of Earth Materials GEOL.5220 Structural Geology Faults, Folds, Outcrop Patterns and Geologic Maps Name When rocks are subjected to differential stress the resulting build-up in strain can
Estimation of Regional Seismic Hazard in the Korean Peninsula Using Historical Earthquake Data between A.D. 2 and 1995
 Bulletin of the Seismological Society of America, Vol. 94, No. 1, pp. 269 284, February 2004 Estimation of Regional Seismic Hazard in the Korean Peninsula Using Historical Earthquake Data between A.D.
Laboratory data for calcic soils in central New Mexico: Background information for mapping Quaternary deposits in the Albuquerque Basin
 Laboratory data for calcic soils in central New Mexico: Background information for mapping Quaternary deposits in the Albuquerque Basin Michael N. Machette, Thomas Long, George 0. Bachman, and Ned R. Timbel
General Geologic Setting and Seismicity of the FHWA Project Site in the New Madrid Seismic Zone
 General Geologic Setting and Seismicity of the FHWA Project Site in the New Madrid Seismic Zone David Hoffman University of Missouri Rolla Natural Hazards Mitigation Institute Civil, Architectural & Environmental
Structural Geology Lab. The Objectives are to gain experience
 Geology 2 Structural Geology Lab The Objectives are to gain experience 1. Drawing cross sections from information given on geologic maps. 2. Recognizing folds and naming their parts on stereoscopic air
THE MAMMOTH "EARTHQUAKE FAULT" AND RELATED FEATURES IN MON0 COUNTY, CALIFORNIA* By H. BENIOFF and B. GUTENBERG
 THE MAMMOTH "EARTHQUAKE FAULT" AND RELATED FEATURES IN MON0 COUNTY, CALIFORNIA* By H. BENIOFF and B. GUTENBERG IN UNDERTAKING this work it was our intention to investigate the well-known "Earthquake Fault"
20.1 Earthquakes. Chapter 20 EARTHQUAKES AND VOLCANOES. Earthquakes and plate boundaries 500 UNIT 6 EARTH S STRUCTURE
 Chapter 20 EARTHQUAKES AND VOLCANOES 20.1 Earthquakes In Chapter 19, you read about the San Andreas Fault, which lies along the California coast (Figure 20.1). This fault passes right through San Francisco
The Size of an Earthquake. Intensity of Shaking (Robert Mallet, 1857) Calculation of Earthquake Magnitude (Charles Richter, 1935)
 Calculation of Earthquake Magnitude (Charles Richter, 1935)") The Size of an Earthquake Intensity of Shaking (Robert Mallet, 1857) Calculation of Earthquake Magnitude (Charles Richter, 1935) In 1857, Robert Mallet produced isoseismal lines based on quantified damage
The Size of an Earthquake Intensity of Shaking (Robert Mallet, 1857) Calculation of Earthquake Magnitude (Charles Richter, 1935) In 1857, Robert Mallet produced isoseismal lines based on quantified damage
Geologic Structures. Changes in the shape and/or orientation of rocks in response to applied stress
 Geologic Structures Changes in the shape and/or orientation of rocks in response to applied stress Figure 15.19 Can be as big as a breadbox Or much bigger than a breadbox Three basic types Fractures >>>
Earthquakes and Earth s Interior
 - What are Earthquakes? Earthquakes and Earth s Interior - The shaking or trembling caused by the sudden release of energy - Usually associated with faulting or breaking of rocks - Continuing adjustment
COSMORPHOLOGY - May 2009
 Name COSMORPHOLOGY - May 2009 Geologic landforms Purpose: By studying aerial photographs you will learn to identify different kinds of geologic features based on their different morphologies and learn
Earthquakes and Earth s Chapter. Interior
 Earthquakes and Earth s Chapter Interior 8.1 What Is an Earthquake? An earthquake is the vibration of Earth produced by the rapid release of energy Focus and Epicenter Focus is the point within Earth
Earthquakes Chapter 19
 Earthquakes Chapter 19 Does not contain complete lecture notes. What is an earthquake An earthquake is the vibration of Earth produced by the rapid release of energy Energy released radiates in all directions
Petrography and Petrogenesis of Tertiary Camptonites and Diorites Sacramento Mountains, New Mexico
 CIRCULAR 141 Petrography and Petrogenesis of Tertiary Camptonites and Diorites Sacramento Mountains, New Mexico by George B. Asquith 1974 New Mexico Bureau of Mines & Mineral Resources A DIVISION OF NEW
ENGINEER S CERTIFICATION OF FAULT AREA DEMONSTRATION (40 CFR )
") PLATTE RIVER POWER AUTHORITY RAWHIDE ENERGY STATION BOTTOM ASH TRANSFER (BAT) IMPOUNDMENTS LARIMER COUNTY, CO ENGINEER S CERTIFICATION OF FAULT AREA DEMONSTRATION (40 CFR 257.62) FOR COAL COMBUSTION RESIDUALS
PLATTE RIVER POWER AUTHORITY RAWHIDE ENERGY STATION BOTTOM ASH TRANSFER (BAT) IMPOUNDMENTS LARIMER COUNTY, CO ENGINEER S CERTIFICATION OF FAULT AREA DEMONSTRATION (40 CFR 257.62) FOR COAL COMBUSTION RESIDUALS
Determining the Earthquake Epicenter: Japan
 Practice Name: Hour: Determining the Earthquake Epicenter: Japan Measuring the S-P interval There are hundreds of seismic data recording stations throughout the United States and the rest of the world.
Team Name. Name(s) SSSS Unome Geologic Mapping Test Packet p1
 SSSS Unome Geologic Mapping Test Packet p1") Scioly Summer Study Session 2018-2019 Geologic Mapping Test Packet Written by Unome Instructions 1) This test is based on the 2016 rules for Geologic Mapping. 2) This test is out of 115 points. Questions
Scioly Summer Study Session 2018-2019 Geologic Mapping Test Packet Written by Unome Instructions 1) This test is based on the 2016 rules for Geologic Mapping. 2) This test is out of 115 points. Questions
Plate Tectonics - Demonstration
 Name: Reference: Prof. Larry Braile - Educational Resources Copyright 2000. L. Braile. Permission granted for reproduction for non-commercial uses. http://web.ics.purdue.edu/~braile/indexlinks/educ.htm
NOA ASSESSMENT HARRIS QUARRY MENDOCINO COUNTY, CALIFORNIA TABLE OF CONTENTS
 NOA ASSESSMENT HARRIS QUARRY MENDOCINO COUNTY, CALIFORNIA TABLE OF CONTENTS Introduction... 1 Scope of Services... 1 Project Location and Description... 1 Geologic Setting... 1 Regional Geology... 1 Site
GPR AS A COST EFFECTIVE BEDROCK MAPPING TOOL FOR LARGE AREAS. Abstract
 GPR AS A COST EFFECTIVE BEDROCK MAPPING TOOL FOR LARGE AREAS Dr. Jutta L. Hager, Hager GeoScience, Inc., Waltham, MA Mario Carnevale, Hager GeoScience, Inc., Waltham, MA Abstract Hager GeoScience, Inc.
Earthquakes. Building Earth s Surface, Part 2. Science 330 Summer What is an earthquake?
 Earthquakes Building Earth s Surface, Part 2 Science 330 Summer 2005 What is an earthquake? An earthquake is the vibration of Earth produced by the rapid release of energy Energy released radiates in all
Earthquakes. Earthquakes are caused by a sudden release of energy
 Earthquakes Earthquakes are caused by a sudden release of energy The amount of energy released determines the magnitude of the earthquake Seismic waves carry the energy away from its origin Fig. 18.1 Origin
Geo736: Seismicity and California s Active Faults Introduction
 Geo736: Seismicity and California s Active Faults Course Notes: S. G. Wesnousky Spring 2018 Introduction California sits on the boundary of the Pacific - North American plate boundary (Figure 1). Relative
UNIT - 7 EARTHQUAKES
 UNIT - 7 EARTHQUAKES WHAT IS AN EARTHQUAKE An earthquake is a sudden motion or trembling of the Earth caused by the abrupt release of energy that is stored in rocks. Modern geologists know that most earthquakes
Earthquakes Earth, 9th edition, Chapter 11 Key Concepts What is an earthquake? Earthquake focus and epicenter What is an earthquake?
 1 2 3 4 5 6 7 8 9 10 Earthquakes Earth, 9 th edition, Chapter 11 Key Concepts Earthquake basics. "" and locating earthquakes.. Destruction resulting from earthquakes. Predicting earthquakes. Earthquakes
New Mexico Geological Society
 New Mexico Geological Society Downloaded from: http://nmgs.nmt.edu/publications/guidebooks/26 Tectonic significance of the Pony Hills, Luna County, New Mexico LeRoy L. Corbitt and Fred L. Nials, 1975,
THE SONORA EARTHQUAKE OF 1887
 Bulletin of the Seismological Society of America. Vol. 67, No. 4, pp. 1219-1223. August 1977 THE SONORA EARTHQUAKE OF 1887 BY JOHN RANDOLPH SUMNER* INTRODUCTION The 1887 Sonoran earthquake is historically
Geologic Mapping Regional Tournament Trial Event
 Geologic Mapping Regional Tournament Trial Event A TEAM OF UP TO: 2 Team Name AVAILABLE TIME: 50 min Required Materials: Each team MUST have a protractor, ruler, non-programmable calculator, colored pencils,
Earthquakes. Chapter Test A. Multiple Choice. Write the letter of the correct answer on the line at the left.
 Earthquakes Chapter Test A Multiple Choice Write the letter of the correct answer on the line at the left. 1. Stress that pushes a mass of rock in two opposite directions is called a. shearing. b. tension.
Dynamic Earth A B1. Which type of plate boundary is located at the Jordan Fault? (1) divergent (3) convergent (2) subduction (4) transform
 divergent (3) convergent (2) subduction (4) transform") Dynamic Earth A B1 1. The edges of most lithospheric plates are characterized by (1) reversed magnetic orientation (2) unusually rapid radioactive decay (3) frequent volcanic activity (4) low P-wave and
Dynamic Earth A B1 1. The edges of most lithospheric plates are characterized by (1) reversed magnetic orientation (2) unusually rapid radioactive decay (3) frequent volcanic activity (4) low P-wave and
Seismic Reflection Imaging across the Johnson Ranch, Valley County, Idaho
 Seismic Reflection Imaging across the Johnson Ranch, Valley County, Idaho Report Prepared for the Skyline Corporation Lee M. Liberty Center for Geophysical Investigation of the Shallow Subsurface (CGISS)
Earthquakes and Earthquake Hazards Earth - Chapter 11 Stan Hatfield Southwestern Illinois College
 Earthquakes and Earthquake Hazards Earth - Chapter 11 Stan Hatfield Southwestern Illinois College What Is an Earthquake? An earthquake is the vibration of Earth, produced by the rapid release of energy.
Structural Geology of the Mountains
 Structural Geology of the Mountains Clinton R. Tippett Shell Canada Limited, Calgary, Alberta clinton.tippett@shell.ca INTRODUCTION The Southern Rocky Mountains of Canada (Figure 1) are made up of several
GEOL 02: Historical Geology Lab 14: Topographic Maps. Name: Date:
 GEOL 02: Historical Geology Lab 14: Topographic Maps Name: Date: A topographic map is a two dimensional (flat) representation (model) of a three dimensional land surface (landscape). It shows landforms
Unit 7.2 W.E.D. & Topography Test
 Name: Score: Unit 7.2 W.E.D. & Topography Test 1. 2. 3. 4. 5. 6. 7. 8. 9. 10. 11. 12. 13. 14. 15. 16. 17. 18. 19. 20. 21. 22. 23. 24. 25. 1. The formation of mountains is due mainly to while the destruction
Module 7: Plate Tectonics and Earth's Structure Topic 4 Content : Earthquakes Presentation Notes. Earthquakes
 Earthquakes 1 Topic 4 Content: Earthquakes Presentation Notes Earthquakes are vibrations within the Earth produced by the rapid release of energy from rocks that break under extreme stress. Earthquakes
Basin & Range / Mojave Desert
 Basin & Range / Mojave Desert Basin & Range vs. Great Basin 1 2/20/2016 An overview of the last horst Basin and Range / Mojave Desert Summary: Granitic, volcanic, marine sedimentary, non marine sedimentary,
Chapter 15 Structures
 Chapter 15 Structures Plummer/McGeary/Carlson (c) The McGraw-Hill Companies, Inc. TECTONIC FORCES AT WORK Stress & Strain Stress Strain Compressive stress Shortening strain Tensional stress stretching
Section 19.1: Forces Within Earth Section 19.2: Seismic Waves and Earth s Interior Section 19.3: Measuring and Locating.
 CH Earthquakes Section 19.1: Forces Within Earth Section 19.2: Seismic Waves and Earth s Interior Section 19.3: Measuring and Locating Earthquakes Section 19.4: Earthquakes and Society Section 19.1 Forces
New Mexico Geological Society
 New Mexico Geological Society Downloaded from: http://nmgs.nmt.edu/publications/guidebooks/33 Quaternary and Pliocene faults in the La Jencia and southern part of the Albuquerque-Belen Basins, New Mexico--Evidence
Earthquake. What is it? Can we predict it?
 Earthquake What is it? Can we predict it? What is an earthquake? Earthquake is the vibration (shaking) and/or displacement of the ground produced by the sudden release of energy. Rocks under stress accumulate
Topic 5: The Dynamic Crust (workbook p ) Evidence that Earth s crust has shifted and changed in both the past and the present is shown by:
 Evidence that Earth s crust has shifted and changed in both the past and the present is shown by:") Topic 5: The Dynamic Crust (workbook p. 65-85) Evidence that Earth s crust has shifted and changed in both the past and the present is shown by: --sedimentary horizontal rock layers (strata) are found
Topic 5: The Dynamic Crust (workbook p. 65-85) Evidence that Earth s crust has shifted and changed in both the past and the present is shown by: --sedimentary horizontal rock layers (strata) are found
Magnitude 6.3 SOUTH ISLAND OF NEW ZEALAND
 A magnitude 6.3 earthquake shook the southern New Zealand city of Christchurch. At least 100 people are reported dead, and there are reports of collapsed buildings, cracked streets and flooding due to
STAAR Science Tutorial 40 TEK 8.9C: Topographic Maps & Erosional Landforms
 Name: Teacher: Pd. Date: STAAR Science Tutorial 40 TEK 8.9C: Topographic Maps & Erosional Landforms TEK 8.9C: Interpret topographic maps and satellite views to identify land and erosional features and
Term 1 final review ES
 Name: Date: 1. t what approximate altitude in the atmosphere can stratospheric ozone be found?. 10 km. 30 km. 70 km D. 100 km 2. What percentage of Earth s history represents human existence?. less than
From Punchbowl to Panum: Long Valley Volcanism and the Mono-Inyo Crater Chain
 From Punchbowl to Panum: Leslie Schaffer E105 2002 Final Paper Long Valley Volcanism and the Mono-Inyo Crater Chain Figure 1. After a sequence of earthquakes during the late 1970 s to the early 1980 s
Bonn, Germany MOUTAZ DALATI. General Organization for Remote Sensing ( GORS ), Syria Advisor to the General Director of GORS,
, Syria Advisor to the General Director of GORS,") Bonn, Germany Early Warning System is needed for Earthquakes disaster mitigation in Syria Case Study: Detecting and Monitoring the Active faulting zones along the Afro-Arabian-Syrian Rift System MOUTAZ
Bonn, Germany Early Warning System is needed for Earthquakes disaster mitigation in Syria Case Study: Detecting and Monitoring the Active faulting zones along the Afro-Arabian-Syrian Rift System MOUTAZ
SURFACE GEOLOGY AND LIQUEFACTION SUSCEPTIBILITY IN THE INNER RIO GRANDE VALLEY NEAR ALBUQUERQUE, NEW MEXICO
 SURFACE GEOLOGY AND LIQUEFACTION SUSCEPTIBILITY IN THE INNER RIO GRANDE VALLEY NEAR ALBUQUERQUE, NEW MEXICO Keith I. Kelson, Christopher S. Hitchcock, and Carolyn E. Randolph William Lettis & Associates,
Structure contours on Bone Spring Formation (Lower Permian), Delaware Basin
, Delaware Basin") Structure contours on Bone Spring Formation (Lower Permian), Delaware Basin By Ronald F. Broadhead and Lewis Gillard New Mexico Bureau of Geology and Mineral Resources, a division of New Mexico Tech, Socorro
Structure contours on Bone Spring Formation (Lower Permian), Delaware Basin By Ronald F. Broadhead and Lewis Gillard New Mexico Bureau of Geology and Mineral Resources, a division of New Mexico Tech, Socorro
Geologic Trips San Francisco and the Bay Area
 Excerpt from Geologic Trips San Francisco and the Bay Area by Ted Konigsmark ISBN 0-9661316-4-9 GeoPress All rights reserved. No part of this book may be reproduced without written permission in writing,
What Causes Rock to Deform?
 Crustal Deformation Earth, Chapter 10 Chapter 10 Crustal Deformation What Causes Rock to Deform? Deformation is a general term that refers to all changes in the shape or position of a rock body in response
Earthquake. earthquake, epicenters in the U.S. Kobe, Japan deaths
 Kobe, Japan 1995 5000 deaths Earthquakes It is estimated that there are 500,000 detectable earthquakes in the world each year. 100,000 of those can be felt, and 100 of them cause damage. The world's deadliest
Groundwater Resources of the Las Cruces/Doña Ana County Region
 Groundwater Resources of the Las Cruces/Doña Ana County Region Presentation to Lower Rio Grande Water Users Organization Water Symposium June 6, 2007 Las Cruces, NM by Bobby J. Creel, PhD New Mexico Water
Cenozoic: Global Events Ma- Present
 Cenozoic: Global Events 65.5 Ma- Present Major Tectonic Events The Rise of the Himalayas and Closure of the Tethyan Ocean Caused Climate Change Equatorial Ocean Closed Rifting in Western North America
New Mexico Geological Society
 New Mexico Geological Society Downloaded from: http://nmgs.nmt.edu/publications/guidebooks/35 Development and deformation of Quaternary surfaces on the northeastern flank of the Jemez Mountains Charles
Crustal Deformation Earth - Chapter Pearson Education, Inc.
 Crustal Deformation Earth - Chapter 10 Structural Geology Structural geologists study the architecture and processes responsible for deformation of Earth s crust. A working knowledge of rock structures
Answers: Internal Processes and Structures (Isostasy)
") Answers: Internal Processes and Structures (Isostasy) 1. Analyse the adjustment of the crust to changes in loads associated with volcanism, mountain building, erosion, and glaciation by using the concept
Answers: Internal Processes and Structures (Isostasy) 1. Analyse the adjustment of the crust to changes in loads associated with volcanism, mountain building, erosion, and glaciation by using the concept
Crustal Deformation. (Building Earth s Surface, Part 1) Science 330 Summer Mapping geologic structures
 Science 330 Summer Mapping geologic structures") Crustal Deformation (Building Earth s Surface, Part 1) Science 330 Summer 2005 Mapping geologic structures When conducting a study of a region, a geologist identifies and describes the dominant rock structures
Crustal Deformation (Building Earth s Surface, Part 1) Science 330 Summer 2005 Mapping geologic structures When conducting a study of a region, a geologist identifies and describes the dominant rock structures
Geologic History of Texas: The Making of Texas Over 1.5 Billion Years
 # 4 Geologic History of Texas: The Making of Texas Over 1.5 Billion Years Dr. Richard Kyle March 24, 2000 Produced by and for Hot Science - Cool Talks by the Environmental Science Institute. We request
UGRC 144 Science and Technology in Our Lives/Geohazards
 UGRC 144 Science and Technology in Our Lives/Geohazards Session 3 Understanding Earthquakes and Earthquake Hazards Lecturer: Dr. Patrick Asamoah Sakyi Department of Earth Science, UG Contact Information:
UNDERSTANDING GEOLOGIC M APS
 Name: Lab Section: work in groups, but each person turns in his/her own GEOSCIENCE 001 L AB UNDERSTANDING GEOLOGIC M APS Geologic maps are colorful and even beautiful, but they also contain an amazing
Terrain Units PALEOGEOGRAPHY: LANDFORM CREATION. Present Geology of NYS. Detailed Geologic Map of NYS
 NYS TOPOGRAPHY Why so? PALEOGEOGRAPHY: LANDFORM CREATION Prof. Anthony Grande AFG 014 Present Geology of NYS Detailed Geologic Map of NYS Generalized Geology Detailed Geology Hot links to the fold out
Geologic Landforms Seen on Aerial Photos Instructor Notes
 1.5 hours Exercise Two Geologic Landforms Instructor Notes Suggested Correlation of Topics Geomorphology, gradation, impact cratering, tectonism, volcanism, photography Purpose The objective of this exercise
Apparent and True Dip
 Apparent and True Dip Cross-bedded building stone. The contact immediately below A appears to dip gently to the right, but at B, the contact appears to dip to the left. But it's not a syncline! Both of
INTRODUCTION. Climate
 INTRODUCTION Climate Landslides are serious natural disasters in many parts of the world. Since the past 30 years, rainfall triggered landslides and debris flows had been one of the natural disasters of
New Mexico Geological Society
 New Mexico Geological Society Downloaded from: http://nmgs.nmt.edu/publications/guidebooks/30 Structure and stratigraphy of the Hagan embayment--a new look Bruce A. Black, 1979, pp. 101-105 in: Santa Fe
S e i s m i c W a v e s
 Project Report S e i s m i c W a v e s PORTLAND STATE UNIVERSITY PHYSICS 213 SPRING TERM 2005 Instructor: Dr. Andres La Rosa Student Name: Prisciliano Peralta-Ramirez Table Of Contents 1. Cover Sheet 2.
Magnitude 6.9 GULF OF CALIFORNIA
 A pair of strong earthquakes struck off the coast of Mexico early Thursday only minutes apart. The magnitude 6.9 and 6.2 were centered about 85 miles northeast of Guerrero Negro in the Mexican state of
New Mexico Bureau of Mines & Mineral Resources
 New Mexico Bureau of Mines & Mineral Resources A DIVISION OF NEW MEXICO INSTITUTE OF MINING & TECHNOLOGY Circular 143 New Mexico Bureau of Mines & Mineral Resources A DIVISION OF NEW MEXICO INSTITUTE OF
Guidelines for Site-Specific Seismic Hazard Reports for Essential and Hazardous Facilities and Major and Special-Occupancy Structures in Oregon
 Guidelines for Site-Specific Seismic Hazard Reports for Essential and Hazardous Facilities and Major and Special-Occupancy Structures in Oregon By the Oregon Board of Geologist Examiners and the Oregon
Geophysical Data Bearing on Hydrocarbon Traps and Resource Potential of the Galisteo Basin, New Mexico
 Open Journal of Geology, 2014, 4, 18-23 Published Online January 2014 (http://www.scirp.org/journal/ojg) http://dx.doi.org/10.4236/ojg.2014.41002 Geophysical Data Bearing on Hydrocarbon Traps and Resource
RR#8 - Free Response
 Base your answers to questions 1 through 4 on the passage and the map below and on your knowledge of Earth science. The map indicates the epicenter (*) of a major earthquake that occurred at 38 N 142 E.
Tornado Hazard Risk Analysis: A Report for Rutherford County Emergency Management Agency
 Tornado Hazard Risk Analysis: A Report for Rutherford County Emergency Management Agency by Middle Tennessee State University Faculty Lisa Bloomer, Curtis Church, James Henry, Ahmad Khansari, Tom Nolan,
A. rift valley B. deep trench C. volcanic cone D. uplifted mountain. A. a volcanic island arc B. a large watershed area
 DC Practice Test Dynamic Crust PRCTICE TEST Zimm's Earth Science 2013 1. Which feature would most likely be forming at converging continental tectonic plate boundaries?. rift valley. deep trench C.
Structural Styles and Geotectonic Elements in Northwestern Mississippi: Interpreted from Gravity, Magnetic, and Proprietary 2D Seismic Data
 Structural Styles and Geotectonic Elements in Northwestern Mississippi: Interpreted from Gravity, Magnetic, and Proprietary 2D Seismic Data Nick Loundagin 1 and Gary L. Kinsland 2 1 6573 W. Euclid Pl.,
HISTORICAL NOTES. Catastrophism. James Usher, mid-1600s, concluded Earth was only a few thousand years old
 1 GEOLOGIC TIME HISTORICAL NOTES Catastrophism James Usher, mid-1600s, concluded Earth was only a few thousand years old Uniformitarianism Charles Lyell published Principles of Geology 1830. 3 HOW DO WE
In this lab, we will study and analyze geologic maps from a few regions, including the Grand Canyon, western Wyoming, and coastal California.
 Name: Lab Section: work in groups, but each person turns in his/her own GEOSCIENCE 001 LAB UNDERSTANDING GEOLOGIC MAPS Geologic maps are colorful and even beautiful, but they also contain an amazing amount
GEOLOGIC TIME. Smith and Pun, Chapter 7 DETERMINING THE ORDER OF EVENTS
 GEOLOGIC TIME Smith and Pun, Chapter 7 DETERMINING THE ORDER OF EVENTS Examination of ancient rocks reveals the history of our planet. Sedimentary and volcanic rocks record processes that occur on the
LAB 5: LANDSLIDE RECOGNITION AND MAPPING
 Geology 350 1 LAB 5: LANDSLIDE RECOGNITION AND MAPPING OBJECTIVES: a. to learn to recognize and classify landslides on airphotos and topographic maps b. to learn to recognize landslide topography on topographic
New Mexico Geological Society
 New Mexico Geological Society Downloaded from: http://nmgs.nmt.edu/publications/guidebooks/34 Magma bodies in the Rio Grande rift in central New Mexico Allan R. Sanford, 1983, pp. 123-125 in: Socorro Region
PHYSICAL GEOGRAPHY: An overview. Definitions. Faulting. Folding GEOLOGIC PROCESSES 9/17/2013 TOPOGRAPHIC RELIEF
 TOPOGRAPHIC RELIEF PHYSICAL GEOGRAPHY: An overview Prof. Anthony Grande AFG 0913 2 Definitions GEOLOGIC PROCESSES Geography: Study of people living on the surface of the earth. Geology: the study of the
New Mexico Geological Society
 New Mexico Geological Society Downloaded from: http://nmgs.nmt.edu/publications/guidebooks/27 Structural framework of the southern Raton Basin, New Mexico Lee A. Woodward and D. O. Snyder, 1976, pp. 125-127
GO ON. Directions: Use the diagram below to answer question 1.
 d i a g n o s t i c t e s t : e a r t h a n d s p a c e s c i e n c e question 1. 1. What is the correct order (starting from the surface) of Earth s layers? A crust, outer core, inner core, mantle B mantle,
Las Vegas Valley is a fault-bounded basin containing hundreds of metres of Tertiary and Quaternary sediments derived from lacustrine, paludal, and
 Land Subsidence (Proceedings of the Fourth International Symposium on Land Subsidence, May 1991). IAHS Publ. no. 200, 1991. Elevation Changes Associated with Subsidence in Las Vegas Valley, Nevada JOHN
Plate Tectonics. Structure of the Earth
 Plate Tectonics Structure of the Earth The Earth can be considered as being made up of a series of concentric spheres, each made up of materials that differ in terms of composition and mechanical properties.
Petroleum possibilities of the Cuervo trough, Tucumcari Basin, New Mexico
 Petroleum possibilities of the Cuervo trough, Tucumcari Basin, New Mexico Charles B. Reynolds and Irene B. Reynolds Geological Associates, 4409 San Andres NE, Albuquerque, New Mexico 87110 Abstract One
Figure Diagram of earth movements produced by (a) P-waves and (b) S-waves.
 P-waves and (b) S-waves.") Geology 101 Name(s): Lab 11: Earthquakes When the stresses in a rock (which may or may not already be faulted) exceed the tensile strength of the rock, the rock ruptures at a point called the focus or
Geology 101 Name(s): Lab 11: Earthquakes When the stresses in a rock (which may or may not already be faulted) exceed the tensile strength of the rock, the rock ruptures at a point called the focus or
C) 10:20:40 A) the difference between the arrival times of the P -wave and the S -wave
 10:20:40 A) the difference between the arrival times of the P -wave and the S -wave") 1. The arrival time of the first earthquake P-wave at a seismograph station was 10:11:20 (hours:minutes:seconds). If the epicenter of the earthquake is 8000 km away, what was the approximate arrival time
1. The arrival time of the first earthquake P-wave at a seismograph station was 10:11:20 (hours:minutes:seconds). If the epicenter of the earthquake is 8000 km away, what was the approximate arrival time