SUPPLEMENTARY INFORMATION
|
|
|
- Imogen Butler
- 5 years ago
- Views:
Transcription
1 SUPPLEMENTARY INFORMATION DOI: /NGEO1158 Characteristic Slip for 5 great earthquakes along the Fuyun fault in China. Klinger 1 Y., Etchebes 1 M., Tapponnier 2 P., and Narteau 1 C. 1 Institut de Physique du Globe de Paris, Sorbonne Paris Cité, Univ. Paris Diderot, UMR 7154 CNRS, 1 rue Jussieu, F Paris, France. 2 EOS, NTU, Singapore. Supplementary Material Table of content 1/ Offset measurements from Quickbird satellite images 2 2/ Comparison between Quickbird offsets and field measurements values 20 3/ Methods 3.1 Determination of characteristic slip amount Determination of geomorphic preservation constant Statistical modeling of offset measurements 27 4/Captions for supplementary table 1 and / References 28 Separate accompanying supplementary information files: 2/ SuppTable1 is an excel table with the tabulated offset data presented in this study. (ngeo1158-s2) 3/ SuppTable2 is an excel data with the tabulated data of Jiangbang et al. (1984) and Lin et Lin (1998). (ngeo1158-s3) NATURE GEOSCIENCE 1
2 1/ Offset measurements from Quickbird satellite images Method : The presence of readily visible offsets at scales of 1/2000 to 1/5000 on the images guided our selection of measurement sites. At each site, the fault trace was mapped and minimal, maximal, and preferred offset values were determined, by realigning each marker (terrace riser, gully channel...) displaced by fault motion. Beyond pixel size, the reconstruction uncertainties depend on marker size and sharpness, orientation relative to the fault trace and width of the fault zone. Each measurement was done manually. Typical apertures used to define piercing lines on either side of the fault were several tens to a hundred meters. The sharpness of the Quickbird images and field inspection of key outcrops (supplementary figure 1b) ensured that mis-identification of either rupture trace or piercing line was kept to a minimum. In this respect, the Fuyun dataset is exceptional because a large number of offset values derived from remote sensing and field measurements can be compared. Depending on the kind of image used, it has been suggested that field measurements tend to provide minimum offset values (Lienkaemper et al., 2001; Klinger et al., 2005, Zielke et al., 2010). In other cases, however, field observations appear to have mislead workers into interpreting cumulative as single event offsets, yielding overestimates of the latter (see discussion in Xu et al., 2006). Here, the relative simplicity and freshness of the rupture trace, as well as the high quality of the images make the correlation between field and satellite data unusually good (see supplementary fig. 1b), even though 1:1 comparisons are not possible because the exact locations of the field values are not published (see supplementary Table 2). In addition to the actual accuracy attached to each offset measurement, an assessment of robustness is provided (see supplementary Table 1), based on the number of other features this particular offset value realigns in its immediate vicinity along the rupture trace (to distances of ~ 100m on either side). If 10 or more side features are thus restored, a maximum robustness index of 5 is attributed to the offset value. If only 2 such additional features are realigned, a robustness index of 1 is appropriate. In fine, the dataset presented in supplementary Table 1 gives for each measurement site a band limited offset range with minimal, maximal, preferred values, and robustness index on a 1 to 5 scale. 2

3 Figure 1a: Location of sites D1 to D15 along the 1931 rupture. 3


4 Figure 1b : Example of comparison between field and Quickbird measurements to calibrate the latter 4
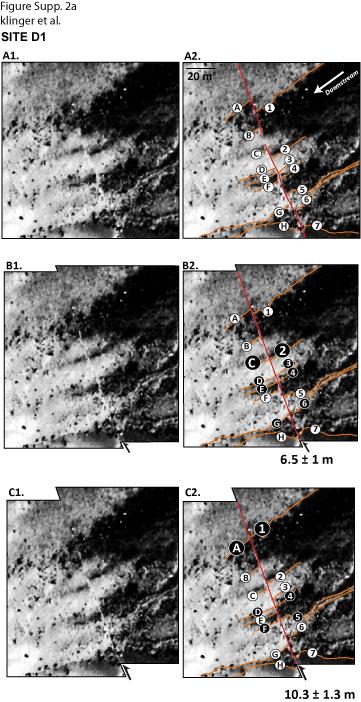
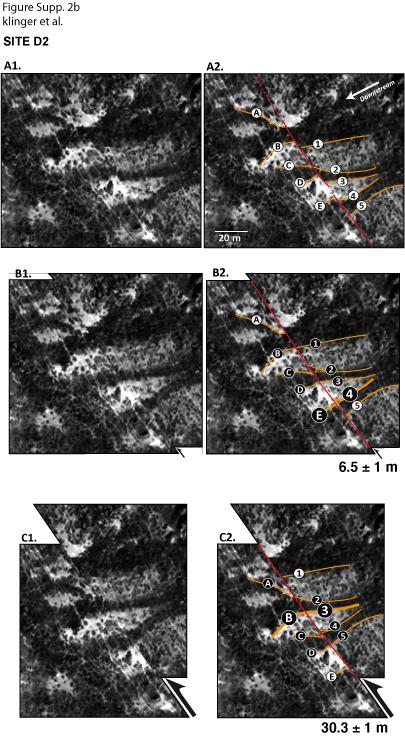
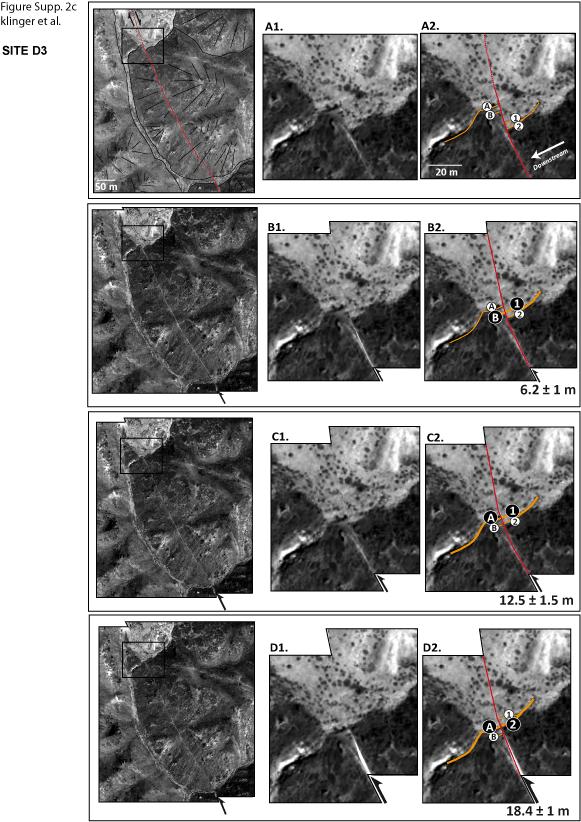
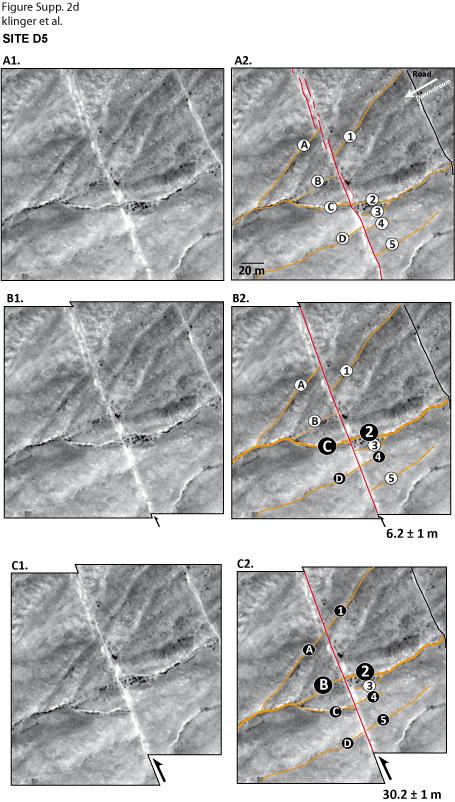
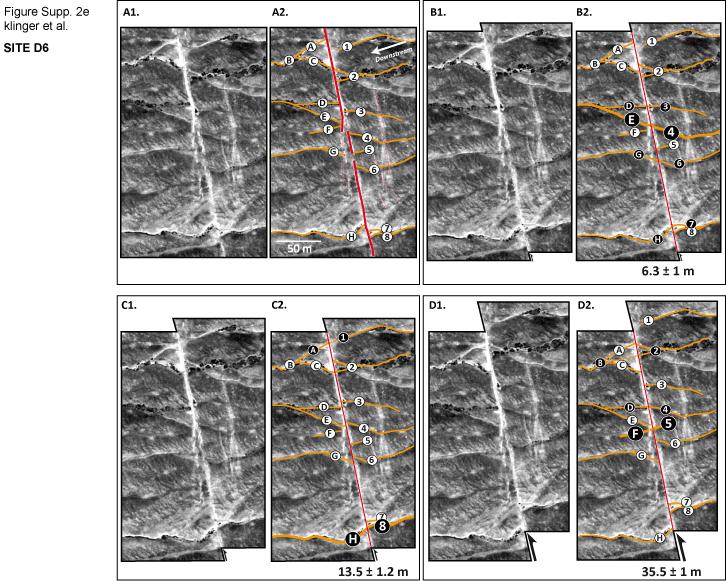
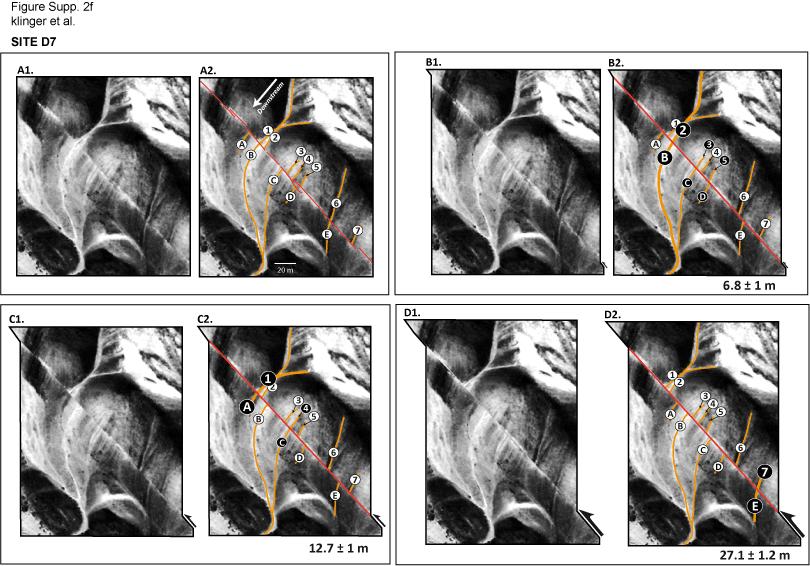
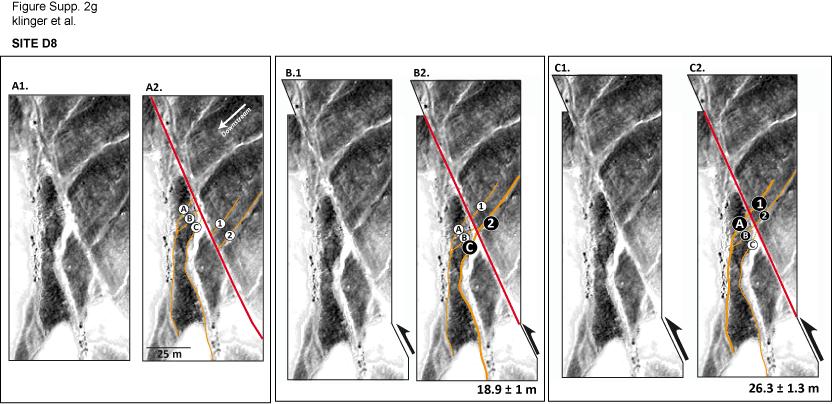
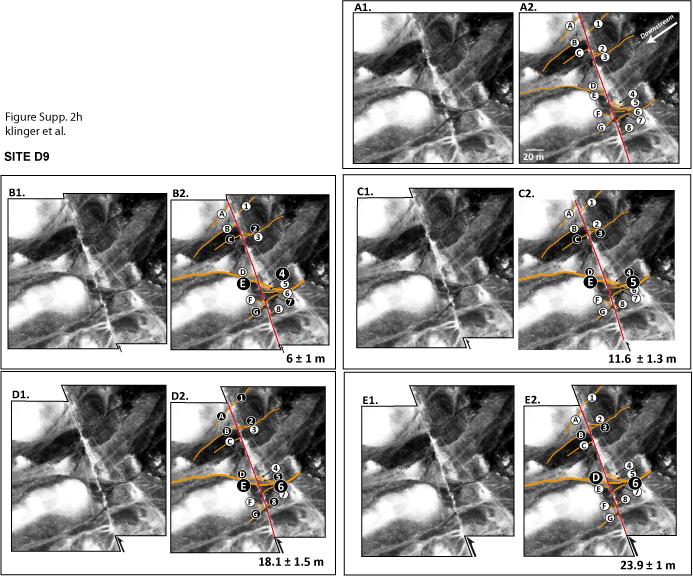
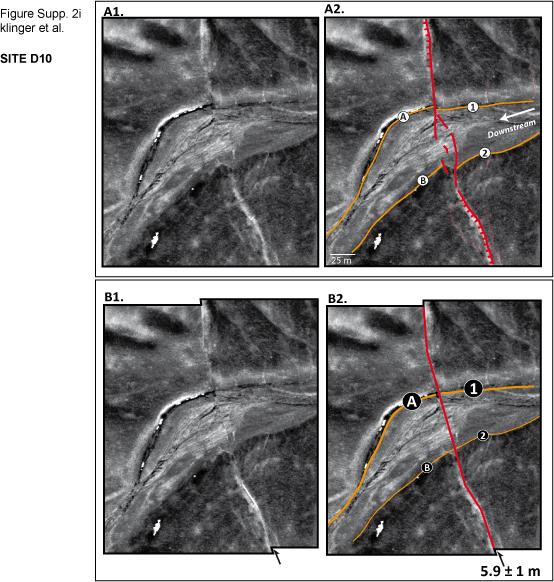
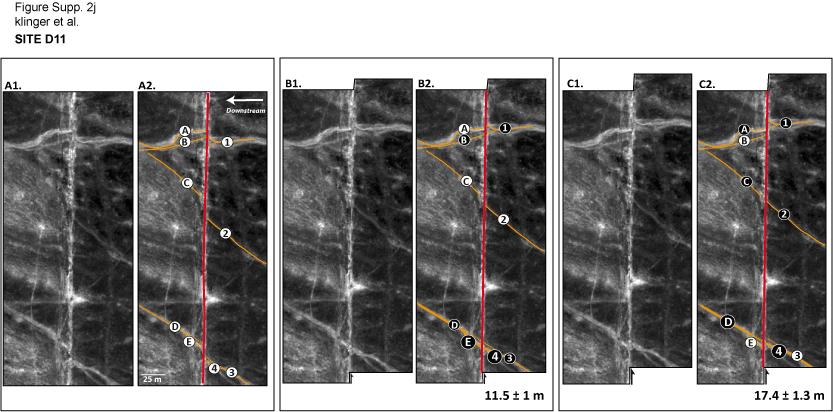
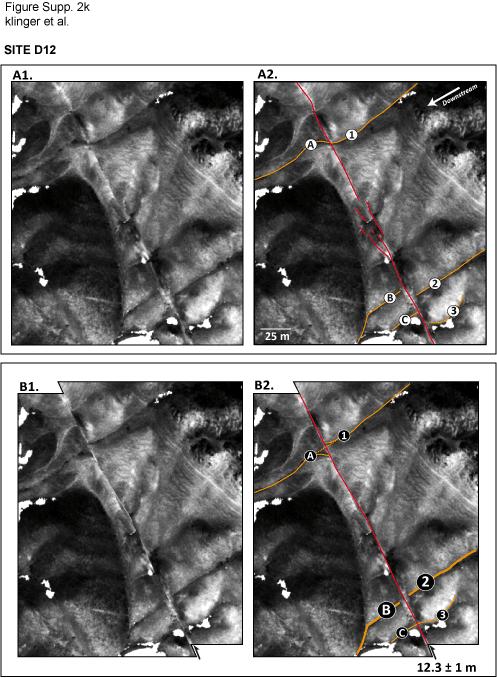
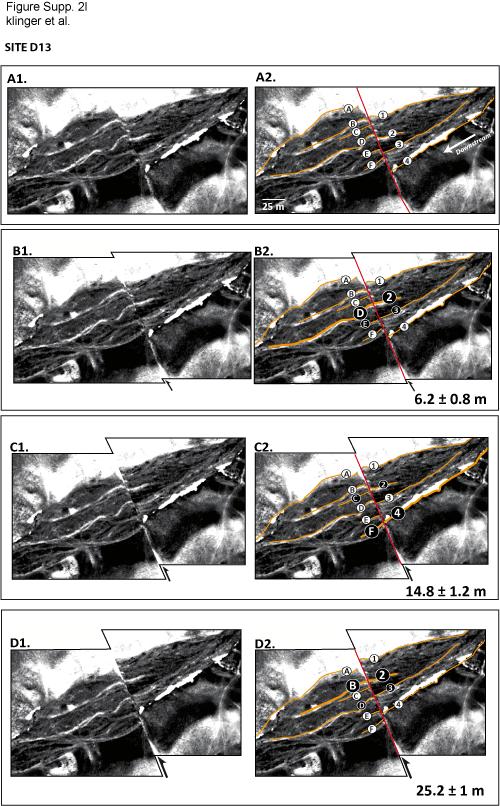
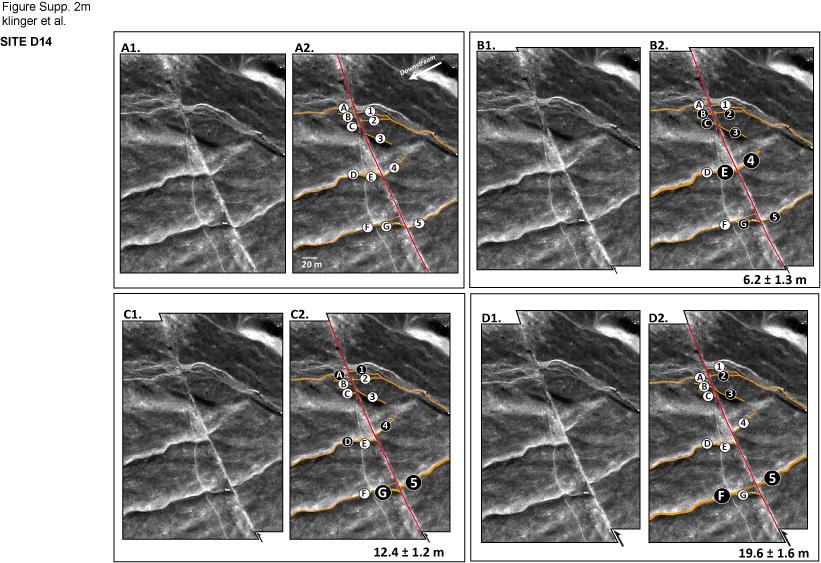
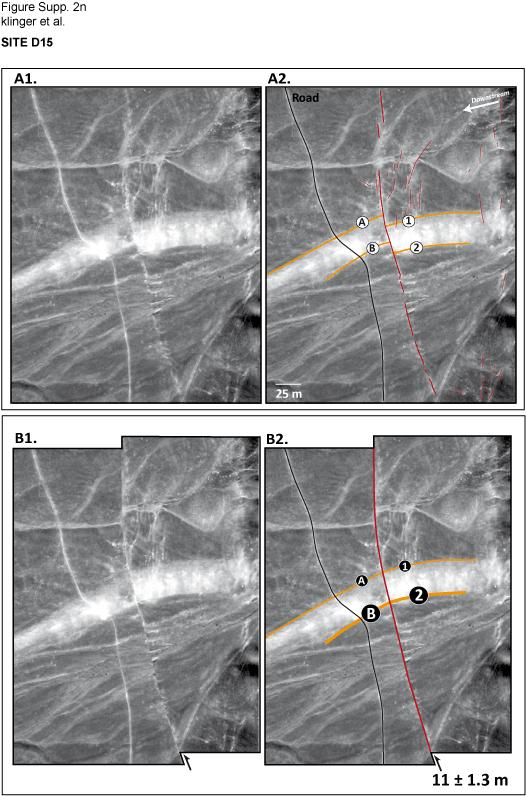
5 Figures 2a to 2n: Examples of reconstructions of multiple offset measurements at 14 selected sites along rupture (location in fig. 1a). At each site, present-day un-interpreted image is shown next to map of landforms and channels used to determine offsets. Successive restorations are then presented. Circles indicate piercing lines fits that constrain landform restorations (symbols as in main text fig. 2). 5
6 6

7 7

8 8
9 9

10 10

11 11

12 12

13 13

14 14

15 15
16 16

17 17

18 18

19 19
20 2/ Comparison between field measurements and Quickbird offsets values Dextral offset (m) N S 1931 offsets measurements using HRS images (this study) 1931 field offsets measurements (Lin, A. and Lin, S. 1998) 1931 field offsets measurements (Jian-bang and al., 1984) Distance along the fault (km) Figure 3: Comparison between 1931 co-seismic offset values collected in the field by Jianbang et al. (1984) and Lin and Lin (1998), and 1931 offset measurements from our image analysis. The datasets are in general agreement, but there are discrepancies at a few locations. Around km 35 for instance, Lin and Lin (1998) documented offsets larger than either to the north or south, while Jianbang et al. (1984) measured even larger offsets. Large vertical offsets have been reported along this section, which makes image analysis difficult. In fact, we failed to measure fresh horizontal offsets on the images at the same location. Similarly, at km 45, Lin and Lin (1998) observed 1931 offsets on order of 3 m where we could measure none on the images. This location might correspond to a segment boundary, where the rupture shows a high degree of complexity (main text fig. 1). South of km 80, our measurements are in a good agreement with the densest field observations of Lin and Lin (1998), while Jianbang et al s offsets (1984) are systematically larger. It is possible that the latter data reflects cumulative offsets. 20
21 3/ Methods 3.1/ Determination of characteristic slip amount Analysis of the Quickbird offsets distribution from the entire dataset (fig. 4a) and northern 80 km subset (largest offsets, fig. 5a) shows well-separated peaks due to highly discontinuous slip accumulation with time. The sharpness of the peaks implies that individual earthquakes have a mean co-seismic slip larger than the slip variability along the fault. To a first order, the periodicity of the signal indicates that this mean slip is about the same for several seismic events. We use a discrete Fourier transform (DFT) to quantitatively characterize the frequency content of the offset distributions (fig. 4b and 5b). In practice, we construct an offset distribution histogram with bins centered every meter between 1 and 70m. Thus, we analyze a regular series of observations stacked along the entire rupture with a sampling length of 1 m. A characteristic wavelength Λ 6.2 m emerges, which can be used as a mean value of the co-seismic slip along the Fuyun fault in the past. To verify that this characteristic value is compatible with the 1931 mean co-seismic slip, we select the smallest offset measurements along the fault (see main text fig. 1b) using a non-overlapping sliding window, with a width of 100 m, moving along the fault. For each window position we choose the smallest offsets. Then, we calculate the mean and standard deviation values of this subset of 290 offset measurements. We take the mean value, lc = 6.3 ± 1.2 m, to represent the average co-seismic slip of the 1931 earthquake, excluding the northern normal fault section in this calculation. Both values (lc and Λ) are in agreement within error. Figure 4a and 5a show the peak-to peak distances calculated from the position of the modes obtained by linear interpolation of the cumulated distribution function. There is good agreement between the peak-to-peak distance, DFT s characteristic wavelength and the mean value of the 1931 offset. Such agreement between three independent estimates suggests that a repeating slip pattern for past earthquakes may be accurately predicted from the 1931 co-seismic slip distribution. 21
22 Figure 4a & 4b: Characteristic wavelength of offset measurement distribution along entire fault (110 km). a) Offset measurements stacked along entire fault. This offset distribution histogram is constructed with 1m-wide bins centered on integer of values between 1m and 70m. Peak to peak distances are calculated from the position of the modes obtained by linear interpolation of the cumulated distribution function. b) Discrete Fourier transform of offset measurement distribution. Position of first peak corresponds to a maximum wavelength =6.24 m. Harmonics at /2 and /3 are indicated by dashed lines. a m and 5 pics Λ ~ 6.18 m Offset measurement distribution 6.02 m Number of offset m 6.25 m 5.95 m 6.17 m b Dextral offset [m] Discrete Fourier Transform Characteristic wavelength Λ of the offset measurement distribution Amplitude m -1 Λ = 6.24 m Wavenumber [1/m] 22
23 Figure 5a & 5b: Characteristic wavelength of offset measurement distribution along northern 80 km of rupture. a) Offset measurements stacked along northern 80k part of rupture. Histogram and peak to peak values obtained as in Fig. 4a. b) Discrete Fourier transform. Position of the first peak corresponds to a maximum wavelength =6.09 m. Harmonics at /2 and /3 are indicated by dashed lines. a m and 5 pics Λ ~ 6.17 m 6.13 m Offset measurement distribution Number of offset m 6.14 m 6.11 m 6.17 m b Dextral offset [m] Discrete Fourier Transform m Λ = 6.09 m Amplitude Characteristic wavelength Λ of the offset measurement distribution Wavenumber [1/m] 23
24 3.2/ Determination of geomorphic preservation constant The shape and visibility of geomorphic markers degrade with time. Correspondingly, the Quickbird offset distribution shows a number of measurable markers that decreases with increasing cumulative slip (supplementary fig. 4a and 5b). The shape of this decay function may be used to define a constant characteristic of the geomorphic preservation in this region of Central Asia. Clearly, trying to define the preservation of landforms with a single parameter is to oversimplify a complex natural process. In general, the evolution of stream channels and terrace risers involves a range of physical-chemical-biological-anthropological mechanisms that are individually difficult to quantify. Furthermore, while such processes may coexist in most environments, their relative influence is likely to vary from one area to another. Nevertheless, towards a first-order regional assessment, we use the Fuyun dataset to quantify landform degradation. Assuming a characteristic slip model and a mean co-seismic slip of 6 m, offset measurements are distributed into classes corresponding to one, two, three earthquakes... using a non-overlapping sliding window of width ± 3m, moving by steps of 6m along the offset axis on main text fig. 1b. Fig. 6 shows, in log/normal coordinates, the probability density function (PDF) maxima (blue dots) of the offset measurements distribution, as a function of the number of characteristic earthquakes. The best fitting model (black line) is an exponential of the form f λ (n; λ) = λexp ( λn) (1) where λ is a dimensionless constant characterizing the preservation of geomorphic markers. The exponential function likely reflects a stationary degradation process. For the whole 110 km-long rupture mapped, λ=0.55. For only the northern 80km of the rupture, where offsets are best defined, λ=0.49. λ is the logarithm of the ratio of the number of geomorphic markers for 2 successive earthquakes. For instance, considering the offset distribution in fig. 6a, the value λ = 0.55 indicates that the probability to observe a marker recording n events is 1.7 times greater than that to observe one recording (n+1) events. 24
25 To test the robustness of the model, we generate, through a Monte Carlo scheme, 5000 synthetic offset distributions, using the best-fitting constant λ = 0.55 (or λ =0.49, for the northern rupture). Following the same procedure as for the field data, the PDFs of these synthetic distributions can be determined. Hence, error bars can be estimated, based on the mean and standard deviation (purple squares and bars in fig. 6). Despite one clear exception, the fit between data and synthetics is acceptable. It is worth noting that the probability for a geomorphic marker to have recorded n events is given by P(n) = exp( λn)(1 exp( λ)) (2) The inference that the Fuyun fault generates characteristic earthquakes implies that λ is proportional to the earthquake recurrence time ΔT. Hence, the characteristic time for the preservation of geomorphic markers is t 0 = ΔT λ, and the PDF for such preservation is of the form ( ) = 1 exp t t 0 f t t;t 0 t 0. (3) Note that such a relationship between preservation constant and recurrence time may be used to compare slip rates on two different faults in the same environment. Conversely, comparing measurements on two faults with characteristic behavior in different environments might provide useful insight into the factors that contribute to overall preservation. 25
26 Figure 6: Constant of preservation of geomorphic markers. (a) for entire fault and (b) for the northern 80 km of rupture with best preserved offsets. Blue dots are offset measurement PDFs plotted relative to number of characteristic earthquakes with best exponential fit shown as a purple line. PDFs of modeled data with associated error are purple diamonds and bars. See text for more detailed discussion. a PDF maximum Offset measurements Monte Carlo simulation using f λ (n; λ) = λ exp ( λn ) b PDF maximum km along the fault λ = Nb n of Characteristic Earthquakes 10 0 Offset measurements Monte Carlo simulation using f λ (n; λ) = λ exp ( λn ) km along the fault λ = Nb n of Characteristic Earthquakes 26
27 3.3/ Statistical modeling of offset measurements We present here a synthetic stochastic model of multiple offsets along strike-slip faults generating characteristic earthquakes, such as the Fuyun fault. All model parameter values are determined from observations. The main goal is to verify that, with a minimal set of assumptions, one can satisfactorily reproduce the observed dataset and thus ensure that our interpretation of offset landforms is not biased by prejudice on what the offset distribution should be. We consider slip in all events to be statistically identical to coseismic slip in 1931, as characterized by the smallest offsets measured along the fault (see main text fig. 1). Using this data subset, we determine the mean and standard deviation (µ(x) and σ(x), respectively), of the co-seismic slip at each location x along the fault, obtained by cubic spline interpolation of the mean value and error associated with each measurement. We consider the local slip s(x) produced by a single event to be a random variable with a normal distribution ( ( )) = N s( x);µ ( x),σ x ( ) 2π exp s( x) µ ( x) 2σ ( x) 1 σ x ( )2 (4) We also consider the number n of events recorded by a geomorphic marker to be a random variable with an exponential distribution f λ ( n;λ), (see Eq. 1). A large number of synthetic offset values is then generated using f λ n;λ N s( x);µ ( x),σ x ( ) and ( ( )). Practically, three values are drawn at random to determine: 1/ The location x of the geomorphic marker along the fault. For simplicity, all locations are assumed to be equiprobable. 2/ The number of events (n) recorded by the geomorphic marker, sampled from the exponential distribution f λ n;λ events, sampled from the normal distribution N s( x);µ ( x),σ x ( ). 3/ The local cumulative slip produced by these n ( ( )). Thanks to the large number of synthetic data (10 6 simulations in main text fig. 3), probability densities to observe a given offset at a given location along the fault are obtained (main text fig. 3). For each offset at each location along the fault, the PDF of the number of events having produced the offset is also obtained. Accordingly, the symbols in main text fig. 27
28 3 show the most probable number of earthquakes seen by each geomorphic marker (mode of the probability distribution function). 4/ Caption for supplementary table 1: Table 1 contains all the offset data presented in figure 1 of the main text. The best fitting, minimum and maximum acceptable values, measurement robustness index (see text for definition of this index) and location of each offset are listed. Caption for supplementary table 2: Table 2 presents the tabulated data from Jiangbang et al. (1984) and Lin and Lin (1998). Measurement locations, retrieved from published figures (no GPS or other precise positions are given in any of the two articles) should be considered approximate. 5/ References Jianbang, S., S. Xianyue, and G. Shumo (1984), The Fuyun earthquake fault zone in Xinjiang, China, paper presented at International symposium on continental seismicity and earthquake prediction, Seismological Press, Beijing. Klinger Y., Xu X., Tapponnier P., Van der Woerd J., Lasserre C., King, G. (2005), Highresolution satellite imagery mapping of the surface rupture and slip distribution of the Mw 7.8, 14 November 2001 Kokoxili earthquake, Kunlun fault, northern Tibet, China, Bull. Seis. Soc. Am., 95(5), Lienkaemper J. (2001), 1857 slip on the San Andreas fault southeast of Cholame, California, Bull. Seis. Soc. Am., 91(6), Lin, A., and S. Lin (1998), Tree damage and surface displacement: The 1931 M 8.0 Fuyun earthquake, J. Geol., 106, Xu, X., Hu G., Klinger Y., Tapponnier P., Van der Woerd J. (2006), Reevaluation of surface rupture parameters and faulting segmentation of the 2001 Kunlunshan earthquake (Mw7.8), northern Tibetan plateau, China, J. Geophys. Res., 111(B5), B05316, doi: /2004JB
Supporting Information for Break of slope in earthquake-size distribution reveals creep rate along the San Andreas fault system
 GEOPHYSICAL RESEARCH LETTERS Supporting Information for Break of slope in earthquake-size distribution reveals creep rate along the San Andreas fault system Inessa Vorobieva, 1,2 Peter Shebalin, 1,2 Clément
Aiming Lin * Graduate School of Science and Technology, Shizuoka University, Shizuoka , Japan
 The Open Geology Journal, 2008, 2, 1-9 1 Systematical Stream Offsets Resulting from Large Earthquakes Along the Strike-Slip Kunlun Fault, Northern Tibetan Plateau: Evidence from the 2001 M w 7.8 Kunlun
to: Interseismic strain accumulation and the earthquake potential on the southern San
 Supplementary material to: Interseismic strain accumulation and the earthquake potential on the southern San Andreas fault system by Yuri Fialko Methods The San Bernardino-Coachella Valley segment of the
Journal of Geophysical Research - Solid Earth
 Journal of Geophysical Research - Solid Earth Supporting Information for Transpressional Rupture Cascade of the 2016 M w 7.8 Kaikoura Earthquake, New Zealand Wenbin Xu 1*, Guangcai Feng 2*, Lingsen Meng
UCERF3 Task R2- Evaluate Magnitude-Scaling Relationships and Depth of Rupture: Proposed Solutions
 UCERF3 Task R2- Evaluate Magnitude-Scaling Relationships and Depth of Rupture: Proposed Solutions Bruce E. Shaw Lamont Doherty Earth Observatory, Columbia University Statement of the Problem In UCERF2
The M w 7.9, 12 May 2008 Sichuan earthquake rupture measured by sub-pixel correlation of ALOS PALSAR amplitude images
 LETTER Earth Planets Space, 62, 875 879, 2010 The M w 7.9, 12 May 2008 Sichuan earthquake rupture measured by sub-pixel correlation of ALOS PALSAR amplitude images Marcello de Michele 1, Daniel Raucoules
Evidence of an axial magma chamber beneath the ultraslow spreading Southwest Indian Ridge
 GSA Data Repository 176 1 5 6 7 9 1 11 1 SUPPLEMENTARY MATERIAL FOR: Evidence of an axial magma chamber beneath the ultraslow spreading Southwest Indian Ridge Hanchao Jian 1,, Satish C. Singh *, Yongshun
Study on the feature of surface rupture zone of the west of Kunlunshan pass earthquake ( M S 811) with high spatial resolution satellite images
 with high spatial resolution satellite images") 48 2 2005 3 CHINESE JOURNAL OF GEOPHYSICS Vol. 48, No. 2 Mar., 2005,,. M S 811.,2005,48 (2) :321 326 Shan X J, Li J H, Ma C. Study on the feature of surface rupture zone of the West of Kunlunshan Pass
48 2 2005 3 CHINESE JOURNAL OF GEOPHYSICS Vol. 48, No. 2 Mar., 2005,,. M S 811.,2005,48 (2) :321 326 Shan X J, Li J H, Ma C. Study on the feature of surface rupture zone of the West of Kunlunshan Pass
High Resolution Imaging of Fault Zone Properties
 Annual Report on 1998-99 Studies, Southern California Earthquake Center High Resolution Imaging of Fault Zone Properties Yehuda Ben-Zion Department of Earth Sciences, University of Southern California
Measuring earthquake-generated surface offsets from high-resolution digital topography
 Measuring earthquake-generated surface offsets from high-resolution digital topography July 19, 2011 David E. Haddad david.e.haddad@asu.edu Active Tectonics, Quantitative Structural Geology, and Geomorphology
Zone of largest coseismic slips Rupture length (km) Rupture length (km)
 Rupture length (km)") Supplementary Figure S; Perrin et al. Relations between earthquake surface traces and slips, and architecture and, for all earthquakes analyzed in present study. 97 Bogd earthquake (Mw.) Gichgeniyn uruu
Supplementary Figure S; Perrin et al. Relations between earthquake surface traces and slips, and architecture and, for all earthquakes analyzed in present study. 97 Bogd earthquake (Mw.) Gichgeniyn uruu
Comment on Systematic survey of high-resolution b-value imaging along Californian faults: inference on asperities.
 Comment on Systematic survey of high-resolution b-value imaging along Californian faults: inference on asperities Yavor Kamer 1, 2 1 Swiss Seismological Service, ETH Zürich, Switzerland 2 Chair of Entrepreneurial
Ground displacement in a fault zone in the presence of asperities
 BOLLETTINO DI GEOFISICA TEORICA ED APPLICATA VOL. 40, N. 2, pp. 95-110; JUNE 2000 Ground displacement in a fault zone in the presence of asperities S. SANTINI (1),A.PIOMBO (2) and M. DRAGONI (2) (1) Istituto
Geophysical Research Letters. Supporting Information for
 Geophysical Research Letters Supporting Information for A P-wave based, on-site method for earthquake early warning S. Colombelli(1), A. Caruso(1), A. Zollo(1), G. Festa(1) and H. Kanamori(2) (1) Department
SUPPLEMENTAL INFORMATION
 GSA DATA REPOSITORY 2013310 A.M. Thomas et al. MOMENT TENSOR SOLUTIONS SUPPLEMENTAL INFORMATION Earthquake records were acquired from the Northern California Earthquake Data Center. Waveforms are corrected
Learning goals - January 16, Describe the geometry of a fault (1) orientation of the plane (strike and dip) (2) slip vector
 orientation of the plane (strike and dip) (2) slip vector") Learning goals - January 16, 2012 You will understand how to: Describe the geometry of a fault (1) orientation of the plane (strike and dip) (2) slip vector Understand concept of slip rate and how it is
Learning goals - January 16, 2012 You will understand how to: Describe the geometry of a fault (1) orientation of the plane (strike and dip) (2) slip vector Understand concept of slip rate and how it is
SUPPLEMENTARY INFORMATION
 SUPPLEMENTARY INFORMATION doi: 10.1038/ngeo739 Supplementary Information to variability and distributed deformation in the Marmara Sea fault system Tobias Hergert 1 and Oliver Heidbach 1,* 1 Geophysical
Supplementary Information to: Shallow slip amplification and enhanced tsunami. hazard unravelled by dynamic simulations of mega-thrust earthquakes
 1 2 Supplementary Information to: Shallow slip amplification and enhanced tsunami hazard unravelled by dynamic simulations of mega-thrust earthquakes 3 4 6 7 8 9 1 11 12 S. Murphy* 1, A. Scala 2,3, A.
Introduction Faults blind attitude strike dip
 Chapter 5 Faults by G.H. Girty, Department of Geological Sciences, San Diego State University Page 1 Introduction Faults are surfaces across which Earth material has lost cohesion and across which there
Interseismic slip rate of the northwestern Xianshuihe fault from InSAR data
 Click Here for Full Article GEOPHYSICAL RESEARCH LETTERS, VOL. 36, L03302, doi:10.1029/2008gl036560, 2009 Interseismic slip rate of the northwestern Xianshuihe fault from InSAR data H. Wang, 1,2 T. J.
UCERF3 Task R2- Evaluate Magnitude-Scaling Relationships and Depth of Rupture: Proposed Solutions
 UCERF3 Task R- Evaluate Magnitude-Scaling Relationships and Depth of Rupture: Proposed Solutions Bruce E. Shaw Lamont Doherty Earth Observatory, Columbia University Statement of the Problem In UCERF Magnitude-Area
Supplementary Materials for
 advances.sciencemag.org/cgi/content/full/4/3/eaao4915/dc1 Supplementary Materials for Global variations of large megathrust earthquake rupture characteristics This PDF file includes: Lingling Ye, Hiroo
Contents of this file
 Geophysical Research Letters Supporting Information for Coseismic radiation and stress drop during the 2015 Mw 8.3 Illapel, Chile megathrust earthquake Jiuxun Yin 1,2, Hongfeng Yang 2*, Huajian Yao 1,3*
Journal of Geophysical Research Letters Supporting Information for
 Journal of Geophysical Research Letters Supporting Information for InSAR observations of strain accumulation and fault creep along the Chaman Fault system, Pakistan and Afghanistan H. Fattahi 1, F. Amelung
Basics of the modelling of the ground deformations produced by an earthquake. EO Summer School 2014 Frascati August 13 Pierre Briole
 Basics of the modelling of the ground deformations produced by an earthquake EO Summer School 2014 Frascati August 13 Pierre Briole Content Earthquakes and faults Examples of SAR interferograms of earthquakes
Synthetic Seismicity Models of Multiple Interacting Faults
 Synthetic Seismicity Models of Multiple Interacting Faults Russell Robinson and Rafael Benites Institute of Geological & Nuclear Sciences, Box 30368, Lower Hutt, New Zealand (email: r.robinson@gns.cri.nz).
2 compared with the uncertainty in relative positioning of the initial triangulation (30 { 50 mm, equivalent to an angular uncertainty of 2 p.p.m. ove
 Reply to: `Comment on \Geodetic investigation of the 13 May 1995 Kozani { Grevena (Greece) earthquake" by Clarke et al.' by Meyer et al. P. J. Clarke, 1 D. Paradissis, 2 P. Briole, 3 P. C. England, 1 B.
Seismic Analysis of Structures Prof. T.K. Datta Department of Civil Engineering Indian Institute of Technology, Delhi. Lecture 03 Seismology (Contd.
 Seismic Analysis of Structures Prof. T.K. Datta Department of Civil Engineering Indian Institute of Technology, Delhi Lecture 03 Seismology (Contd.) In the previous lecture, we discussed about the earth
27th Seismic Research Review: Ground-Based Nuclear Explosion Monitoring Technologies
 GROUND TRUTH LOCATIONS USING SYNERGY BETWEEN REMOTE SENSING AND SEISMIC METHODS-APPLICATION TO CHINESE AND NORTH AFRICAN EARTHQUAKES C. K. Saikia 1, H. K. Thio 2, D. V. Helmberger 2, G. Ichinose 1, and
Joint inversion of InSAR and broadband teleseismic waveform data with ABIC: application to the 1997 Manyi, Tibet earthquake
 Joint inversion of InSAR and broadband teleseismic waveform data with ABIC: application to the 1997 Manyi, Tibet earthquake Gareth Funning 1, Yukitoshi Fukahata 2, Yuji Yagi 3 & Barry Parsons 4 1 University
Rotation of the Principal Stress Directions Due to Earthquake Faulting and Its Seismological Implications
 Bulletin of the Seismological Society of America, Vol. 85, No. 5, pp. 1513-1517, October 1995 Rotation of the Principal Stress Directions Due to Earthquake Faulting and Its Seismological Implications by
Fault Specific, Dynamic Rupture Scenarios for Strong Ground Motion Prediction
 Fault Specific, Dynamic Rupture Scenarios for Strong Ground Motion Prediction H. Sekiguchi Disaster Prevention Research Institute, Kyoto University, Japan Blank Line 9 pt Y. Kase Active Fault and Earthquake
[ ] Appendix A : Dating results and associated figures. Table A1. Analytical results of cosmogenic dating of 29 samples at site 1.
![[ ] Appendix A : Dating results and associated figures. Table A1. Analytical results of cosmogenic dating of 29 samples at site 1.](/thumbs/84/90992034.jpg "[ ] Appendix A : Dating results and associated figures. Table A1. Analytical results of cosmogenic dating of 29 samples at site 1.") Geophysical Journal International 2002, 147: 356-388. Supplementary material to Van Der Woerd J., P. Tapponnier, F.J. Ryerson, A.S. Mériaux, B. Meyer, Y. Gaudemer, R. Finkel, M. Caffee, Zhao G., Xu Z.,
Geophysical Journal International 2002, 147: 356-388. Supplementary material to Van Der Woerd J., P. Tapponnier, F.J. Ryerson, A.S. Mériaux, B. Meyer, Y. Gaudemer, R. Finkel, M. Caffee, Zhao G., Xu Z.,
Supplementary Material
 1 Supplementary Material 2 3 4 Interseismic, megathrust earthquakes and seismic swarms along the Chilean subduction zone (38-18 S) 5 6 7 8 9 11 12 13 14 1 GPS data set We combined in a single data set
JCR (2 ), JGR- (1 ) (4 ) 11, EPSL GRL BSSA
, JGR- (1 ) (4 ) 11, EPSL GRL BSSA") Dun Wang ( ) In collaboration with: Hitoshi Kawakatsu, Jim Mori, Kazuki Koketsu, Takuto Maeda, Hiroshi Tsuroka, Jiancang Zhunag, Lihua Fang, and Qiang Yao School of Geosciences, China University of Geosciences
Dun Wang ( ) In collaboration with: Hitoshi Kawakatsu, Jim Mori, Kazuki Koketsu, Takuto Maeda, Hiroshi Tsuroka, Jiancang Zhunag, Lihua Fang, and Qiang Yao School of Geosciences, China University of Geosciences
arxiv:physics/ v2 [physics.geo-ph] 18 Aug 2003
![arxiv:physics/ v2 [physics.geo-ph] 18 Aug 2003](/thumbs/90/101580441.jpg "arxiv:physics/ v2 [physics.geo-ph] 18 Aug 2003") Is Earthquake Triggering Driven by Small Earthquakes? arxiv:physics/0210056v2 [physics.geo-ph] 18 Aug 2003 Agnès Helmstetter Laboratoire de Géophysique Interne et Tectonophysique, Observatoire de Grenoble,
Is Earthquake Triggering Driven by Small Earthquakes? arxiv:physics/0210056v2 [physics.geo-ph] 18 Aug 2003 Agnès Helmstetter Laboratoire de Géophysique Interne et Tectonophysique, Observatoire de Grenoble,
SUPPLEMENTARY INFORMATION
 Loading of the San Andreas fault by flood-induced rupture of faults beneath the Salton Sea Daniel Brothers, Debi Kilb, Karen Luttrell, Neal Driscoll and Graham Kent Figure S1. Location map for profiles
F021 Detetection of Mechanical Failure During Hyraulic Fracturing Through Passive Seismic Microseismic Monitoring
 F021 Detetection of Mechanical Failure During Hyraulic Fracturing Through Passive Seismic Microseismic Monitoring A. De La Pena* (Microseismic Inc.), L. Eisner (Microseismic Inc.), M.P. Thornton (Microseismic
Yesterday scaling laws. An important one for seismic hazard analysis
 Yesterday scaling laws An important one for seismic hazard analysis Estimating the expected size of an earthquake expected on a fault for which the mapped length is known. Wells & Coppersmith, 1994 And
Geodesy (InSAR, GPS, Gravity) and Big Earthquakes
 and Big Earthquakes") Geodesy (InSAR, GPS, Gravity) and Big Earthquakes Mathew Pritchard Teh-Ru A. Song Yuri Fialko Luis Rivera Mark Simons UJNR Earthquake Research Panel, Morioka, Japan - Nov 6, 2002 Goals Accurate and high
Geodesy (InSAR, GPS, Gravity) and Big Earthquakes Mathew Pritchard Teh-Ru A. Song Yuri Fialko Luis Rivera Mark Simons UJNR Earthquake Research Panel, Morioka, Japan - Nov 6, 2002 Goals Accurate and high
Automatic Moment Tensor Analyses, In-Situ Stress Estimation and Temporal Stress Changes at The Geysers EGS Demonstration Project
 PROCEEDINGS, 42nd Workshop on Geothermal Reservoir Engineering Stanford University, Stanford, California, February 13-15, 2017 SGP-TR-212 Automatic Moment Tensor Analyses, In-Situ Stress Estimation and
3D MODELING OF EARTHQUAKE CYCLES OF THE XIANSHUIHE FAULT, SOUTHWESTERN CHINA
 3D MODELING OF EARTHQUAKE CYCLES OF THE XIANSHUIHE FAULT, SOUTHWESTERN CHINA Li Xiaofan MEE09177 Supervisor: Bunichiro Shibazaki ABSTRACT We perform 3D modeling of earthquake generation of the Xianshuihe
ON NEAR-FIELD GROUND MOTIONS OF NORMAL AND REVERSE FAULTS FROM VIEWPOINT OF DYNAMIC RUPTURE MODEL
 1 Best Practices in Physics-based Fault Rupture Models for Seismic Hazard Assessment of Nuclear ON NEAR-FIELD GROUND MOTIONS OF NORMAL AND REVERSE FAULTS FROM VIEWPOINT OF DYNAMIC RUPTURE MODEL Hideo AOCHI
Exploring aftershock properties with depth
 Exploring aftershock properties with depth Peter Shebalin 1,2, Clément Narteau 2, Matthias Holschneider 3 1 International Institute of Earthquake Prediction Theory and Mathematical Geophysics, Moscow,
Journal of Geophysical Research (Solid Earth) Supporting Information for
 Supporting Information for") Journal of Geophysical Research (Solid Earth) Supporting Information for Postseismic Relocking of the Subduction Megathrust Following the 2007 Pisco, Peru earthquake D.Remy (a), H.Perfettini (b), N.Cotte
Journal of Geophysical Research (Solid Earth) Supporting Information for Postseismic Relocking of the Subduction Megathrust Following the 2007 Pisco, Peru earthquake D.Remy (a), H.Perfettini (b), N.Cotte
Co- seismic and cumulative offsets of the recent earthquakes along the Karakax left- lateral strike- slip fault in western Tibet
 Co- seismic and cumulative offsets of the recent earthquakes along the Karakax left- lateral strike- slip fault in western Tibet Haibing Li, Jerome Van Der Woerd, Zhiming Sun, Jialiang Si, Paul Tapponnier,
Figure 1 shows a sketch of loading conditions and sample geometry of the employed Westerly
 Supplementary Information: Off-fault damage and acoustic emission distributions during the evolution of structurally-complex faults over series of stick-slip events T. H. W. Goebel 1*, T. W. Becker 1,
Spectral Element simulation of rupture dynamics
 Spectral Element simulation of rupture dynamics J.-P. Vilotte & G. Festa Department of Seismology, Institut de Physique du Globe de Paris, 75252 France ABSTRACT Numerical modeling is an important tool,
COLLOCATED CO-SIMULATION USING PROBABILITY AGGREGATION
 COLLOCATED CO-SIMULATION USING PROBABILITY AGGREGATION G. MARIETHOZ, PH. RENARD, R. FROIDEVAUX 2. CHYN, University of Neuchâtel, rue Emile Argand, CH - 2009 Neuchâtel, Switzerland 2 FSS Consultants, 9,
FULL MOMENT TENSOR ANALYSIS USING FIRST MOTION DATA AT THE GEYSERS GEOTHERMAL FIELD
 PROCEEDINGS, Thirty-Eighth Workshop on Geothermal Reservoir Engineering Stanford University, Stanford, California, February 11-13, 2013 SGP-TR-198 FULL MOMENT TENSOR ANALYSIS USING FIRST MOTION DATA AT
Empirical Green s Function Analysis of the Wells, Nevada, Earthquake Source
 Nevada Bureau of Mines and Geology Special Publication 36 Empirical Green s Function Analysis of the Wells, Nevada, Earthquake Source by Mendoza, C. 1 and Hartzell S. 2 1 Centro de Geociencias, Universidad
Transition from stick-slip to stable sliding: the crucial effect of asperities
 Transition from stick-slip to stable sliding: the crucial effect of asperities Strasbourg, 15 Nov. 2007 François Renard LGCA, CNRS-OSUG, University of Grenoble, France PGP, University of Oslo, Norway Collaborators:
Seth Stein and Emile Okal, Department of Geological Sciences, Northwestern University, Evanston IL USA. Revised 2/5/05
 Sumatra earthquake moment from normal modes 2/6/05 1 Ultra-long period seismic moment of the great December 26, 2004 Sumatra earthquake and implications for the slip process Seth Stein and Emile Okal,
Estimation of S-wave scattering coefficient in the mantle from envelope characteristics before and after the ScS arrival
 GEOPHYSICAL RESEARCH LETTERS, VOL. 30, NO. 24, 2248, doi:10.1029/2003gl018413, 2003 Estimation of S-wave scattering coefficient in the mantle from envelope characteristics before and after the ScS arrival
Simulated and Observed Scaling in Earthquakes Kasey Schultz Physics 219B Final Project December 6, 2013
 Simulated and Observed Scaling in Earthquakes Kasey Schultz Physics 219B Final Project December 6, 2013 Abstract Earthquakes do not fit into the class of models we discussed in Physics 219B. Earthquakes
Moveout approximation for P waves in a homogeneous VTI medium
 Moveout approximation for P waves in a homogeneous VTI medium Véronique Farra 1 and Ivan Pšenčík 2 1 Institut de Physique du Globe de Paris, Sorbonne Paris Cité, Université Paris Diderot, UMR 7154 CNRS,
Di#erences in Earthquake Source and Ground Motion Characteristics between Surface and Buried Crustal Earthquakes
 Bull. Earthq. Res. Inst. Univ. Tokyo Vol. 2+,**0 pp.,/3,00 Di#erences in Earthquake Source and Ground Motion Characteristics between Surface and Buried Crustal Earthquakes Paul Somerville* and Arben Pitarka
Fluvial terrace riser degradation and determination of slip rates on strike-slip faults: An example from the Kunlun fault, China
 GEOPHYSICAL RESEARCH LETTERS, VOL. 35, L05406, doi:10.1029/2007gl033073, 2008 Fluvial terrace riser degradation and determination of slip rates on strike-slip faults: An example from the Kunlun fault,
FOCAL MECHANISM DETERMINATION OF LOCAL EARTHQUAKES IN MALAY PENINSULA
 FOCAL MECHANISM DETERMINATION OF LOCAL EARTHQUAKES IN MALAY PENINSULA Siti Norbaizura MAT SAID Supervisor: Tatsuhiko HARA MEE10505 ABSTRACT Since November 30, 2007, small local earthquakes have been observed
On the validity of time-predictable model for earthquake generation in north-east India
 Proc. Indian Acad. Sci. (Earth Planet. Sci.), Vol. 101, No. 4, December 1992, pp. 361-368. 9 Printed in India. On the validity of time-predictable model for earthquake generation in north-east India V
SUPPLEMENTARY INFORMATION
 SUPPLEMENTARY INFORMATION DOI: 1.138/NGEO177 The Long Precursory Phase of Most Large Interplate Earthquakes Supplementary Information Supplementary Methods 1. Data and Classification We select the earthquakes
THE ECAT SOFTWARE PACKAGE TO ANALYZE EARTHQUAKE CATALOGUES
 THE ECAT SOFTWARE PACKAGE TO ANALYZE EARTHQUAKE CATALOGUES Tuba Eroğlu Azak Akdeniz University, Department of Civil Engineering, Antalya Turkey tubaeroglu@akdeniz.edu.tr Abstract: Earthquakes are one of
CSU Student Research Competition Summary Submission
 Name: CSU Student Research Competition Summary Submission Shawn Morrish Title: Coseismic Uplift and Geomorphic Response to the September 5, 2012 Mw7.6 Nicoya Earthquake, Costa Rica Abstract: The Nicoya
Lateral Offset Quality Rating along Low Slip Rate Faults: Application to the Alhama de Murcia Fault (SE Iberian Peninsula)
") Remote Sens. 2015, 7, 14827-14852; doi:10.3390/rs71114827 Article OPEN ACCESS remote sensing ISSN 2072-4292 www.mdpi.com/journal/remotesensing Lateral Offset Quality Rating along Low Slip Rate Faults:
Remote Sens. 2015, 7, 14827-14852; doi:10.3390/rs71114827 Article OPEN ACCESS remote sensing ISSN 2072-4292 www.mdpi.com/journal/remotesensing Lateral Offset Quality Rating along Low Slip Rate Faults:
FRICTIONAL HEATING DURING AN EARTHQUAKE. Kyle Withers Qian Yao
 FRICTIONAL HEATING DURING AN EARTHQUAKE Kyle Withers Qian Yao Temperature Change Along Fault Mode II (plain strain) crack rupturing bilaterally at a constant speed v r Idealize earthquake ruptures as shear
29th Monitoring Research Review: Ground-Based Nuclear Explosion Monitoring Technologies
 IMPROVING MAGNITUDE DETECTION THRESHOLDS USING MULTI-STATION, MULTI-EVENT, AND MULTI-PHASE METHODS David Schaff and Felix Waldhauser Lamont-Doherty Earth Observatory, Columbia University Sponsored by Air
27th Seismic Research Review: Ground-Based Nuclear Explosion Monitoring Technologies
 GROUND TRUTH OF AFRICAN AND EASTERN MEDITERRANEAN SHALLOW SEISMICITY USING SAR INTERFEROMETRY AND GIBBS SAMPLING INVERSION Benjamin A. Brooks 1, Francisco Gomez 2, Eric A. Sandvol 2, and Neil Frazer 1
Faults. Strike-slip fault. Normal fault. Thrust fault
 Faults Strike-slip fault Normal fault Thrust fault Fault any surface or narrow zone with visible shear displacement along the zone Normal fault Strike-slip fault Reverse fault Thrust fault
Recurrence Times for Parkfield Earthquakes: Actual and Simulated. Paul B. Rundle, Donald L. Turcotte, John B. Rundle, and Gleb Yakovlev
 Recurrence Times for Parkfield Earthquakes: Actual and Simulated Paul B. Rundle, Donald L. Turcotte, John B. Rundle, and Gleb Yakovlev 1 Abstract In this paper we compare the sequence of recurrence times
Uncertainty and Graphical Analysis
 Uncertainty and Graphical Analysis Introduction Two measures of the quality of an experimental result are its accuracy and its precision. An accurate result is consistent with some ideal, true value, perhaps
Surface Rupture in Kinematic Ruptures Models for Hayward Fault Scenario Earthquakes
 Surface Rupture in Kinematic Ruptures Models for Hayward Fault Scenario Earthquakes Brad Aagaard May 21, 2009 Surface Rupture from Kinematic Rupture Models Objective Holistic approach to calculating surface
GPS Strain & Earthquakes Unit 5: 2014 South Napa earthquake GPS strain analysis student exercise
 GPS Strain & Earthquakes Unit 5: 2014 South Napa earthquake GPS strain analysis student exercise Strain Analysis Introduction Name: The earthquake cycle can be viewed as a process of slow strain accumulation
Aftershock From Wikipedia, the free encyclopedia
 Page 1 of 5 Aftershock From Wikipedia, the free encyclopedia An aftershock is a smaller earthquake that occurs after a previous large earthquake, in the same area of the main shock. If an aftershock is
San Francisco Bay Area Earthquake Simulations: A step toward a Standard Physical Earthquake Model
 San Francisco Bay Area Earthquake Simulations: A step toward a Standard Physical Earthquake Model Steven N. Ward Institute of Geophysics and Planetary Physics, University of California, Santa Cruz, CA,
29th Monitoring Research Review: Ground-Based Nuclear Explosion Monitoring Technologies MODELING P WAVE MULTIPATHING IN SOUTHEAST ASIA
 MODELING P WAVE MULTIPATHING IN SOUTHEAST ASIA Ali Fatehi and Keith D. Koper Saint Louis University Sponsored by the Air Force Research Laboratory ABSTRACT Contract No. FA8718-06-C-0003 We have used data
DETECTION OF CRUSTAL DEFORMATION OF THE NORTHERN PAKISTAN EARTHQUAKE BY SATELLITE DATA. Submitted by Japan **
 UNITED NATIONS E/CONF.97/5/CRP. 5 ECONOMIC AND SOCIAL COUNCIL Seventeenth United Nations Regional Cartographic Conference for Asia and the Pacific Bangkok, 18-22 September 2006 Item 6 (b) of the provisional
ATTENUATION OF LG WAVES IN THE EASTERN TIBETAN PLATEAU. Jiakang Xie. Lamont-Doherty Earth Observatory of Columbia University
 ATTENUATION OF LG WAVES IN THE EASTERN TIBETAN PLATEAU Jiakang Xie Lamont-Doherty Earth Observatory of Columbia University Sponsored by The Defense Threat Reduction Agency Contract No. DSWA01-98-1-0006
Dependence of Possible Characteristic Earthquakes on Spatial Samph'ng: Illustration for the Wasatch Seismic Zone, Utah
 Dependence of Possible Characteristic Earthquakes on Spatial Samph'ng: Illustration for the Wasatch Seismic Zone, Utah Seth Stein Northwestern University Anke Friedrich Universitiit Potsdam* Andrew Newman
DEFORMATION KINEMATICS OF TIBETAN PLATEAU DETERMINED FROM GPS OBSERVATIONS
 DEFORMATION KINEMATICS OF TIBETAN PLATEAU DETERMINED FROM GPS OBSERVATIONS Jinwei Ren Institute of Geology, China Seismological Bureau, Beijing 100029 China Tel: (10)62009095; Fax: (10)62009003; email:
High-precision location of North Korea s 2009 nuclear test
 Copyright, Seismological Research Letters, Seismological Society of America 1 High-precision location of North Korea s 2009 nuclear test Lianxing Wen & Hui Long Department of Geosciences State University
Effect of an outer-rise earthquake on seismic cycle of large interplate earthquakes estimated from an instability model based on friction mechanics
 Effect of an outer-rise earthquake on seismic cycle of large interplate earthquakes estimated from an instability model based on friction mechanics Naoyuki Kato (1) and Tomowo Hirasawa (2) (1) Geological
Regional Geodesy. Shimon Wdowinski. MARGINS-RCL Workshop Lithospheric Rupture in the Gulf of California Salton Trough Region. University of Miami
 MARGINS-RCL Workshop Lithospheric Rupture in the Gulf of California Salton Trough Region Regional Geodesy Shimon Wdowinski University of Miami Rowena Lohman, Kim Outerbridge, Tom Rockwell, and Gina Schmalze
by George E. Hilley, J Ramón Arrowsmith, and Elizabeth Stone Introduction
 Bulletin of the Seismological Society of America, 91, 3, pp. 427 440, June 2001 Inferring Segment Strength Contrasts and Boundaries along Low-Friction Faults Using Surface Offset Data, with an Example
27th Seismic Research Review: Ground-Based Nuclear Explosion Monitoring Technologies
 REGIONAL VARIATION OF RAYLEIGH-WAVE ATTENUATION IN SOUTHERN ASIA PREDICTED FROM NEW MAPS OF LG CODA Q AND ITS FREQUENCY DEPENDENCE AT 1 HZ Lianli Cong 1 and Brian J. Mitchell 2 Yunnan University 1 and
Earthquakes and Faulting
 Earthquakes and Faulting Crustal Strength Profile Quakes happen in the strong, brittle layers Great San Francisco Earthquake April 18, 1906, 5:12 AM Quake lasted about 60 seconds San Francisco was devastated
Today: Basic regional framework. Western U.S. setting Eastern California Shear Zone (ECSZ) 1992 Landers EQ 1999 Hector Mine EQ Fault structure
 1992 Landers EQ 1999 Hector Mine EQ Fault structure") Today: Basic regional framework Western U.S. setting Eastern California Shear Zone (ECSZ) 1992 Landers EQ 1999 Hector Mine EQ Fault structure 1 2 Mojave and Southern Basin and Range - distribution of strike-slip
Today: Basic regional framework Western U.S. setting Eastern California Shear Zone (ECSZ) 1992 Landers EQ 1999 Hector Mine EQ Fault structure 1 2 Mojave and Southern Basin and Range - distribution of strike-slip
Automatic time picking and velocity determination on full waveform sonic well logs
 Automatic time picking and velocity determination on full waveform sonic well logs Lejia Han, Joe Wong, John C. Bancroft, and Robert R. Stewart ABSTRACT Full waveform sonic logging is used to determine
On the earthquake predictability of fault interaction models
 On the earthquake predictability of fault interaction models Warner Marzocchi, and Daniele Melini Istituto Nazionale di Geofisica e Vulcanologia, Rome, Italy StatSei 9 meeting, Potsdam, June 15-17, 2015
CHARACTERIZING EARTHQUAKE SLIP MODELS FOR THE PREDICTION OF STRONG GROUND MOTION
 CHARACTERIZING EARTHQUAKE SLIP MODELS FOR THE PREDICTION OF STRONG GROUND MOTION P G SOMERVILLE 1, K IRIKURA, N ABRAHAMSON 3, S SAWADA 4, T KAGAWA 5 And Y TATSUMI 6 SUMMARY Over the past fifteen years,
4((F'~) 2) = ~ = (2)
 2) = ~ = (2)") Bulletin of the Seismological Society of America, Vol. 74, No. 5, pp. 1615-1621, October 1984 AVERAGE BODY-WAVE RADIATION COEFFICIENTS BY DAVID M. BOORE AND JOHN BOATWRIGHT ABSTRACT Averages of P- and
Bulletin of the Seismological Society of America, Vol. 74, No. 5, pp. 1615-1621, October 1984 AVERAGE BODY-WAVE RADIATION COEFFICIENTS BY DAVID M. BOORE AND JOHN BOATWRIGHT ABSTRACT Averages of P- and
Overview of Seismic PHSA Approaches with Emphasis on the Management of Uncertainties
 H4.SMR/1645-29 "2nd Workshop on Earthquake Engineering for Nuclear Facilities: Uncertainties in Seismic Hazard" 14-25 February 2005 Overview of Seismic PHSA Approaches with Emphasis on the Management of
Materials and Methods The deformation within the process zone of a propagating fault can be modeled using an elastic approximation.
 Materials and Methods The deformation within the process zone of a propagating fault can be modeled using an elastic approximation. In the process zone, stress amplitudes are poorly determined and much
Application of Phase Matched Filtering on Surface Waves for Regional Moment Tensor Analysis Andrea Chiang a and G. Eli Baker b
 1 2 3 4 5 6 7 8 9 10 11 12 13 14 15 16 17 18 19 20 21 22 23 24 25 26 27 28 29 30 31 Application of Phase Matched Filtering on Surface Waves for Regional Moment Tensor Analysis Andrea Chiang a and G. Eli
Earthquake Tectonics and Hazards on the Continents June Recognizing and characterizing strike-slip faults and earthquakes in USA
 2464-4 Earthquake Tectonics and Hazards on the Continents 17-28 June 2013 Recognizing and characterizing strike-slip faults and earthquakes in USA S. G. Wesnousky Univ. of Nevada USA Strike-slip Faults
Zoning surface rupture hazard along normal faults: insight from the 2009 M w 6.3 L Aquila, central Italy, earthquake and other global earthquakes
 Zoning surface rupture hazard along normal faults: insight from the 2009 M w 6.3 L Aquila, central Italy, earthquake and other global earthquakes Boncio, P., Galli, P., Naso, G., Pizzi, A. Bulletin of
COULOMB STRESS CHANGES DUE TO RECENT ACEH EARTHQUAKES
 COULOMB STRESS CHANGES DUE TO RECENT ACEH EARTHQUAKES Madlazim Physics Department, Faculty Mathematics and Sciences of Surabaya State University (UNESA) Jl. Ketintang, Surabaya 60231, Indonesia. e-mail:
6 Source Characterization
 6 Source Characterization Source characterization describes the rate at which earthquakes of a given magnitude, and dimensions (length and width) occur at a given location. For each seismic source, the
SUPPLEMENTARY INFORMATION
 doi:10.1038/nature11492 Figure S1 Short-period Seismic Energy Release Pattern Imaged by F-net. (a) Locations of broadband seismograph stations in Japanese F-net used for the 0.5-2.0 Hz P wave back-projection
8.0 SUMMARY AND CONCLUSIONS
 8.0 SUMMARY AND CONCLUSIONS In November 2008, Pacific Gas and Electric (PG&E) informed the U.S. Nuclear Regulatory Commission (NRC) that preliminary results from the Diablo Canyon Power Plant (DCPP) Long
Quantifying Natural Fault Geometry: Statistics of Splay Fault Angles
 Quantifying Natural Fault Geometry: Statistics of Splay Fault Angles Ryosuke Ando 1,*, Bruce E. Shaw 1 and Christopher. H. Scholz 1 1 Lamont-Doherty Earth Observatory, Columbia University, Palisades, NY,