Sulfidic Events in a Shallow Bay of the Central Peruvian Upwelling System
|
|
|
- Harvey Hubbard
- 5 years ago
- Views:
Transcription
1 Sulfidic Events in a Shallow Bay of the Central Peruvian Upwelling System FLORES E, GRACO M, MERMA, L, DIAZ R, MOREIRA M, AGUIRRE A, BÖTTCHER M, SALDARRIAGA, M, SILVA-FILHO E, ALBUQUERQUE A & MENDOZA U Instituto del Mar del Peru Oceanographic and Climatic Change Directorate


2
.")
3 SULFATE REDUCTION 11% of the liquid primary production is decomposed by sulfate reduction at the top sediments (1 cm). Jorgensen 19


4 CRIPTIC SULFUR CYCLE NO3_ and NO_ to NHþ Reduction Oxidation HS to SO via elemental sulphur (S ) Steady-State prevent HS accumulation Inorganic carbon rich sediments with high rates of microbial sulphate reduction and underlying oxygen-depleted bottom waters, DNRA is an important sulphide detoxifying mechanism and coupling the benthic and pelagic sulphur and nitrogen cycles. DNRA in Peruvian sediments: Filamentous and nitrate-storing Sulphur oxidizing chemolithotrophs from genera Beggiatoa and Thioploca. Jørgensen & Nelson,
5 SULFIDIC EVENTS Pieterse & van der Post, 197. Reports a water mass discoloration" attribute to a turquoise discoloration, product of the hydrogen sulfide oxidation and coloidal elemental sulfur formation. Copenhague et al., Hart & Currie, Pieterse y van der Post, Bailey et al., Ferdelman et al., Emeis et al., Weeks et al., Brüchert et al., Ulloa et al., Aguirre et al., Shunck et al., 1953 South Africa 19 South Africa 197 South Africa 1991 South Africa 1999 South Africa South Africa South Africa South Africa 1 Chile & Peru 1 Peru 13 Peru Flores et al. Present Study


6 SeaWiFS-May-jun, 1 SULFUR PLUMES - NAMIBIA COAST MERIS - 1April- EVENT-5 Weeks et al., Ohde et al., Currie et al., Gaute Lavik et al.,

")

7 SULFUR PLUMES - PERUVIAN COAST MODIS 1-1 April- 1 S a Lima PERU c MODIS Mai-9 13 S Elemental sulfur plume Pisco 1 S Depth (m) 5 b 1 1 N km 1km km S 5 3 µm Sulfide Karhu et al., Schunk et al., 13

8 PARACAS BAY
9 SULFIDIC EVENTS DURING EL NIÑO EVENT 15 Intense Sulfidic Event 3-month time series 11 April 7 June 3 31 March Massive fisheries mortality Short-term Sulfidic Event 1 April


10 Intense Sulfidic Event Short-term Sulfidic Event 1 April-15 Normal Conditions Sulfidic Event MODIS March 17
11 MONTHLY ASCAT WINDS VARIATION (January-September 15) Summer Minimal:, m/s Maimal: 7,31 m/s Mean: 3,9 m/s calm days (1 al 19-3) <,5 m/s Spring Minimal:, m/s Maximal: 11, m/s Mean: 5,5 m/s IWinter Minimal:,7 m/s Maximal de1,5 m/s Mean:,95 m/s
12 MONTHLY WINDS AND TEMPERATURE VARIATION (February-July 15) ASCAT Satélite Winds Outside de Bay Inside de Bay
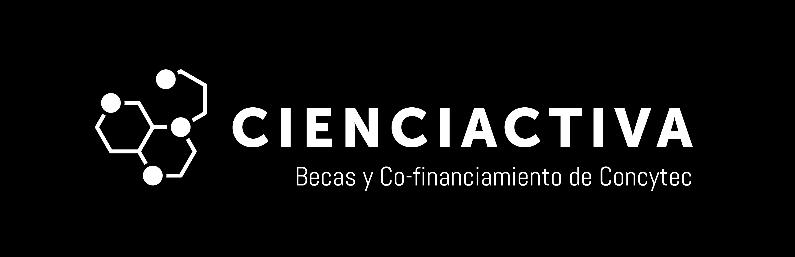
13 Winds of airport Inner-Bay Speed of w inds (m.s 1 ) Correlation Temp vs. O = w inds conditions (hours.day 1 ) Station E1 Oxygen (ml.l 1 ) Inner-Bay Hypoxic conditions (hours.day 1 ) Station E Hipoxic 1,3 ml/l ~ 3 µm (Middelburg, 9 Conolly, 1) Microxic.1 ml/l ~ µm (Naqvi et al., ) Oxygen (ml.l 1 ) Hypoxic conditions (hours.day 1 ) Middle-Bay 1.3 ml/l.1 ml/l Oxygen (ml.l 1 ) Station E Outer-Bay

14
15 Area Winds (m/s) O (ml/l) H S (mm) H S Difusive Flux (mmol.m.d -1 ) Author Namibia (3- o S) Weeks et al., Namibia (3 o S) 11. Buchert et al. Namibia (3-.5 o S) Lavik et al., 9 Peru (1-13 o S), 1 m. - Schunck et al., 13 Perú (1 o S), 7 m Paracas Bay (13 o S) 1 m Short-term Sulfidic event 5 Atypical Conditions 1 <1 Prevailed Microxic Prevailed.1 1. Dale et al., 1 Sommer et al., 1 5. Present Study
16 NORMAL SYSTEM Inner-Bay Middle-Bay Outer-Bay HS SO E1-JUNIO HS (um) SO 1 (mm) E-JUNIO HS SO H S (um) SO - (mm) E-JUNIO E-JUNIO HS SO H S (um) SO - (mm) E1-JUNIO AVS (%) CRS (%) AVS CRS AVS (%) CRS (%) AVS CRS E-JUNIO AVS (%) CRS (%) AVS CRS
17 SHORT-TERM SULFIDIC EVENT Inner-Bay Middle-Bay Outer-Bay HS SO E1-ABRIL HS (um) SO (mm) E-ABRIL HS SO H S (um) SO - (mm) E-ABRIL E-ABRIL HS SO H S (um) SO - (mm) E-ABRIL E1-ABRIL AVS (%) CRS (%) AVS CRS AVS (%) CRS (%) AVS CRS AVS (%) CRS (%) AVS CRS

18 CONCEPTUAL MODEL Winds <,5 m/s Estratificaction Concentration (µm) HS µm S S Oxygen µm S Oxygen Hipoxic 1,3 ml/l ~ 3 µm Microxic.1 ml/l ~ µm Water Column HS HS HS O O O Depth (cm) OM UPWELLING Sediment E1 E HS Flux OM E Depth (cm)
Cable Bacteria Control Iron-Phosphorus Dynamics in Sediments of a
 1 2 3 Supplementary Information Cable Bacteria Control Iron-Phosphorus Dynamics in Sediments of a Coastal Hypoxic Basin 4 5 6 Fatimah Sulu-Gambari 1*, Dorina Seitaj 2, Filip J. R. Meysman 2, Regina Schauer
Nitrogen cycling driven by organic matter export in the South Pacific oxygen minimum zone
 SUPPLEMENTARY INFORMATION DOI: 10.1038/NGEO1739 Nitrogen cycling driven by organic matter export in the South Pacific oxygen minimum zone Tim Kalvelage, Gaute Lavik, Phyllis Lam, Sergio Contreras, Lionel
Namibia s dead zone - ecosystem functioning in an extreme environment
 Namibia s dead zone - ecosystem functioning in an extreme environment Bronwen Currie National Marine Information and Research Centre Swakopmund Namibia With acknowledgement to colleagues: V. Brüchert,
Will a warmer world change Queensland s rainfall?
 Will a warmer world change Queensland s rainfall? Nicholas P. Klingaman National Centre for Atmospheric Science-Climate Walker Institute for Climate System Research University of Reading The Walker-QCCCE
8.1 Attachment 1: Ambient Weather Conditions at Jervoise Bay, Cockburn Sound
 8.1 Attachment 1: Ambient Weather Conditions at Jervoise Bay, Cockburn Sound Cockburn Sound is 20km south of the Perth-Fremantle area and has two features that are unique along Perth s metropolitan coast
Nova Scotia Department of Fisheries and Aquaculture. Environmental Monitoring Program Summary
 Nova Scotia Department of Fisheries and Aquaculture Environmental Monitoring Program Summary 2015 Table of Contents 1 Environmental Monitoring Program Overview... 1 2 2015 EMP... 5 2.1 Level I... 5 2.1.1
Accepted Manuscript. Benthic Nitrogen Cycling Traversing the Peruvian Oxygen Minimum Zone
 Accepted Manuscript Benthic Nitrogen Cycling Traversing the Peruvian Oxygen Minimum Zone L. Bohlen, A.W. Dale, S. Sommer, T. Mosch, C. Hensen, A. Noffke, F. Scholz, K. Wallmann PII: S0016-7037(11)00466-2
Seasonal Climate Outlook for South Asia (June to September) Issued in May 2014
 Issued in May 2014") Ministry of Earth Sciences Earth System Science Organization India Meteorological Department WMO Regional Climate Centre (Demonstration Phase) Pune, India Seasonal Climate Outlook for South Asia (June
Ministry of Earth Sciences Earth System Science Organization India Meteorological Department WMO Regional Climate Centre (Demonstration Phase) Pune, India Seasonal Climate Outlook for South Asia (June
Increased phytoplankton blooms detected by ocean color
 Increased phytoplankton blooms detected by ocean color Mati Kahru & B. Greg Mitchell Scripps Institution of Oceanography/ University of California San Diego La Jolla, CA 92093-0218 ASLO Aquatic Sciences
Time-series observations in the Northern Indian Ocean V.V.S.S. Sarma National Institute of Oceanography Visakhapatnam, India
 The Second GEOSS Asia-Pacific Symposium, Tokyo, 14-16 th April 28 Time-series observations in the Northern Indian Ocean V.V.S.S. Sarma National Institute of Oceanography Visakhapatnam, India Seasonal variations
Turbulence and the Spring Phytoplankton Bloom
 Turbulence and the Spring Phytoplankton Bloom Raffaele Ferrari Earth, Atmospheric and Planetary Sciences, MIT Collaborators: Sophia Merrifield and John Taylor Toronto, February 2, 2012 Phytoplankton Bloom
Drought Characterization. Examination of Extreme Precipitation Events
 Drought Characterization Examination of Extreme Precipitation Events Extreme Precipitation Events During the Drought For the drought years (1999-2005) daily precipitation data was analyzed to find extreme
Bleaching interpretation/alert
 Global coral bleaching response and resilience testing programme, September 7, 2007 p 1 of 6 Pilot early warning for regional bleaching warning network WESTERN INDIAN OCEAN DATE OF THIS ALERT: 10 April
A summary of the weather year based on data from the Zumwalt weather station
 ZUMWALT PRAIRIE WEATHER 2016 A summary of the weather year based on data from the Zumwalt weather station Figure 1. An unusual summer storm on July 10, 2016 brought the second-largest precipitation day
Baltic Sea Research Institute Warnemünde. Cruise report No. 40/04/11. r/v Professor Albrecht Penck. Monitoring cruise. 30 April 10 May 2004
 Baltic Sea Research Institute Warnemünde Cruise report No. 40/04/11 r/v Professor Albrecht Penck Monitoring cruise 30 April 10 May 2004 Kiel Bight to northern Gotland sea This report is based on preliminary
The evolution of ocean color
 The evolution of ocean color Victor Ariel Gallardo 1, 2, Carola Espinoza 1 1 Laboratorio de Bentos, Departamento de Oceanografía and Center for Biotechnology 2 Universidad de Concepción, Concepción, Chile
Champaign-Urbana 1998 Annual Weather Summary
 Champaign-Urbana 1998 Annual Weather Summary ILLINOIS STATE WATER SURVEY Audrey Bryan, Weather Observer 2204 Griffith Dr. Champaign, IL 61820 wxobsrvr@sparc.sws.uiuc.edu The development of the El Nìno
Winds, Coastal Circulation, Climate Variability and Hypoxia off the Pacific Northwest
 Winds, Coastal Circulation, Climate Variability and Hypoxia off the Pacific Northwest Jack Barth College of Oceanic and Atmospheric Sciences Oregon State University with lots of help from: Francis Chan
Coastal Ocean Circulation Experiment off Senegal (COCES)
") DISTRIBUTION STATEMENT A. Approved for public release; distribution is unlimited. Coastal Ocean Circulation Experiment off Senegal (COCES) Pierre-Marie Poulain Istituto Nazionale di Oceanografia e di Geofisica
DISTRIBUTION STATEMENT A. Approved for public release; distribution is unlimited. Coastal Ocean Circulation Experiment off Senegal (COCES) Pierre-Marie Poulain Istituto Nazionale di Oceanografia e di Geofisica
Jackson County 2013 Weather Data
 Jackson County 2013 Weather Data 61 Years of Weather Data Recorded at the UF/IFAS Marianna North Florida Research and Education Center Doug Mayo Jackson County Extension Director 1952-2008 Rainfall Data
Microbial Biogeochemistry
 Microbial Biogeochemistry Chemical reactions occurring in the environment mediated by microbial communities Outline Metabolic Classifications. Winogradsky columns, Microenvironments. Redox Reactions. Microbes
Long-term Water Quality Monitoring in Estero Bay
 Long-term Water Quality Monitoring in Estero Bay Keith Kibbey Laboratory Director Lee County Environmental Laboratory Division of Natural Resource Management Estero Bay Monitoring Programs Three significant
ALASKA REGION CLIMATE FORECAST BRIEFING. January 23, 2015 Rick Thoman ESSD Climate Services
 ALASKA REGION CLIMATE FORECAST BRIEFING January 23, 2015 Rick Thoman ESSD Climate Services Today Climate Forecast Basics Review of recent climate forecasts and conditions CPC Forecasts and observations
ENSO Cycle: Recent Evolution, Current Status and Predictions. Update prepared by Climate Prediction Center / NCEP 23 April 2012
 ENSO Cycle: Recent Evolution, Current Status and Predictions Update prepared by Climate Prediction Center / NCEP 23 April 2012 Outline Overview Recent Evolution and Current Conditions Oceanic Niño Index
The Climate of Murray County
 The Climate of Murray County Murray County is part of the Crosstimbers. This region is a transition between prairies and the mountains of southeastern Oklahoma. Average annual precipitation ranges from
Prepared by the North American Ice Service. 4 December Seasonal Outlook Great Lakes Winter
 Prepared by the North American Ice Service A collaboration of the Canadian Ice Service and the National/Naval Ice Center 4 December 2008 Seasonal Outlook Great Lakes Winter 2008-2009 - 1 - Table of contents
The Thomas Hardye School Summer Preparation Task A Level Chemistry AQA 7405
 The Thomas Hardye School Summer Preparation Task A Level Chemistry AQA 7405 Purpose of task: Consolidate and develop key skills and information from GCSE that is essential and assumed knowledge for A-level
Drought in Southeast Colorado
 Drought in Southeast Colorado Nolan Doesken and Roger Pielke, Sr. Colorado Climate Center Prepared by Tara Green and Odie Bliss http://climate.atmos.colostate.edu 1 Historical Perspective on Drought Tourism
The Pennsylvania Observer
 The Pennsylvania Observer April 2, 2010 March 2010 Pennsylvania Weather Recap Prepared by: Katelyn Johnson March did come in as a lion cub this year. The 1 st proved to be a calm day; however most of Pennsylvania
Short Cruise Report Meteor Cruise M93. Callao, Peru- Balboa, Panama Chief Scientist: Dr. Gaute Lavik Captain: Klaus Bergmann
 Name Dr. Gaute Lavik Institut Max Planck Institute for Marine Microbiology Adresse Celsiusstrasse 1 Adresse 28359 Bremen Adresse Germany Tel.: +49 (0)421 2028 651 Fax: +49 (0)421 2028 690 email: glavik@mpi-bremen.de
ENSO Cycle: Recent Evolution, Current Status and Predictions. Update prepared by Climate Prediction Center / NCEP 11 November 2013
 ENSO Cycle: Recent Evolution, Current Status and Predictions Update prepared by Climate Prediction Center / NCEP 11 November 2013 Outline Overview Recent Evolution and Current Conditions Oceanic Niño Index
Climate impact on seasonal patterns of diarrhea diseases in Tropical area
 Climate impact on seasonal patterns of diarrhea diseases in Tropical area Akari Teshima 1, Michio Yamada 2, *Taiichi Hayashi 1, Yukiko Wagatsuma 3, Toru Terao 4 (1: DPRI, Kyoto Univ., Japan, 2: RIMS, Kyoto
Marche Region Climate Analysis by Danilo Tognetti 1
 Marche Region. 2016 Climate Analysis by Danilo Tognetti 1 With the contribution of eight consecutive high monthly temperature records set from January to August, and the remainder of the months ranking
Sierra Weather and Climate Update
 Sierra Weather and Climate Update 2014-15 Kelly Redmond Western Regional Climate Center Desert Research Institute Reno Nevada Yosemite Hydroclimate Workshop Yosemite Valley, 2015 October 8-9 Percent of
Local Ctimatotogical Data Summary White Hall, Illinois
 SWS Miscellaneous Publication 98-5 STATE OF ILLINOIS DEPARTMENT OF ENERGY AND NATURAL RESOURCES Local Ctimatotogical Data Summary White Hall, Illinois 1901-1990 by Audrey A. Bryan and Wayne Armstrong Illinois
Champaign-Urbana 2000 Annual Weather Summary
 Champaign-Urbana 2000 Annual Weather Summary ILLINOIS STATE WATER SURVEY 2204 Griffith Dr. Champaign, IL 61820 wxobsrvr@sws.uiuc.edu Maria Peters, Weather Observer January: January started on a mild note,
Climate Change Impacts on Maple Syrup Yield
 Climate Change Impacts on Maple Syrup Yield Rajasekaran R. Lada, Karen Nelson, Arumugam Thiagarajan Maple Research Programme, Dalhousie Agricultural Campus Raj.lada@dal.ca Canada is the largest maple
Monthly Volcanic Activity Report (April 2013)
") Monthly Volcanic Activity Report (April 2013) Zaozan (Calm) Small-amplitude volcanic tremors were recorded on April 7 (duration: 3 min 20 sec), 9 (4 min 20 sec) and 21 (5 min 40 sec). These were the first
Monthly Volcanic Activity Report (April 2013) Zaozan (Calm) Small-amplitude volcanic tremors were recorded on April 7 (duration: 3 min 20 sec), 9 (4 min 20 sec) and 21 (5 min 40 sec). These were the first
210 Pb xs (mbq/g) ± 31-2 ± ± 12 3 ± ± 5 3 ± ± 11 4 ± 1
 ± 31-2 ± ± 12 3 ± ± 5 3 ± ± 11 4 ± 1") Depth (cmbsf) Sample Depth Core 1 21 Pb xs (mbq/g) 137 Cs (mbq/g).5 11 ± 31-2 ± 3 Core 2 Core 3 1.5 131 ± 12 3 ± 1 21.5 88 ± 5 3 ± 3.5 58 ± 11 4 ± 1 1.5 9 ± 6 3 ± 1.5 8 ± 7 2 ± 1 2.5 58 ± 4 3 ± 35.5 32
Depth (cmbsf) Sample Depth Core 1 21 Pb xs (mbq/g) 137 Cs (mbq/g).5 11 ± 31-2 ± 3 Core 2 Core 3 1.5 131 ± 12 3 ± 1 21.5 88 ± 5 3 ± 3.5 58 ± 11 4 ± 1 1.5 9 ± 6 3 ± 1.5 8 ± 7 2 ± 1 2.5 58 ± 4 3 ± 35.5 32
Jackson County 2018 Weather Data 67 Years of Weather Data Recorded at the UF/IFAS Marianna North Florida Research and Education Center
 Jackson County 2018 Weather Data 67 Years of Weather Data Recorded at the UF/IFAS Marianna North Florida Research and Education Center Doug Mayo Jackson County Extension Director 1952-2008 Rainfall Data
ENSO Cycle: Recent Evolution, Current Status and Predictions. Update prepared by Climate Prediction Center / NCEP 25 February 2013
 ENSO Cycle: Recent Evolution, Current Status and Predictions Update prepared by Climate Prediction Center / NCEP 25 February 2013 Outline Overview Recent Evolution and Current Conditions Oceanic Niño Index
Looking for Nitrogen Fixation and Denitrification in All of the Right Places L.A. Codispoti HPL 27 May 2008
 Looking for Nitrogen Fixation and Denitrification in All of the Right Places L.A. Codispoti HPL 27 May 2008 (With thanks to a host of colleagues and the meeting organizers) Nomenclature & Background Canonical
Jackson County 2014 Weather Data
 Jackson County 2014 Weather Data 62 Years of Weather Data Recorded at the UF/IFAS Marianna North Florida Research and Education Center Doug Mayo Jackson County Extension Director 1952-2008 Rainfall Data
Regional Climate Change: Current Impacts and Perspectives Greater Lake Nipissing Stewardship Council Annual Meeting Wednesday April 16, 2014
 Regional Climate Change: Current Impacts and Perspectives Greater Lake Nipissing Stewardship Council Annual Meeting Wednesday April 16, 2014 Speaker: Peter Bullock, Stantec Consulting Information Source:
Phase I System Characterization: Year 2 Study Plans
 Phase I System Characterization: Year 2 Study Plans Year I Physical and Biological Data Sets Quarterly Storm Sampling Four storm events with 8 sample stations at bridges Monthly Baseline Characterization
Climate Outlook and Review
 Climate Outlook and Review August 2018 Author: Prof Roger C Stone Overview The European, UK, and US long-term climate models that focus on forecasting central Pacific sea surface temperatures are continuing
SEAWIFS VALIDATION AT THE CARIBBEAN TIME SERIES STATION (CATS)
") SEAWIFS VALIDATION AT THE CARIBBEAN TIME SERIES STATION (CATS) Jesús Lee-Borges* and Roy Armstrong Department of Marine Science, University of Puerto Rico at Mayagüez, Mayagüez, Puerto Rico 00708 Fernando
SEAWIFS VALIDATION AT THE CARIBBEAN TIME SERIES STATION (CATS) Jesús Lee-Borges* and Roy Armstrong Department of Marine Science, University of Puerto Rico at Mayagüez, Mayagüez, Puerto Rico 00708 Fernando
MAURITIUS METEOROLOGICAL SERVICES
 MAURITIUS METEOROLOGICAL SERVICES CLIMATE FEBRUARY 2019 Introduction February 2019 was in mostly warm and dry. ENSO conditions and the Indian Ocean Dipole were neutral. However, the Inter Tropical Convergence
Monthly Volcanic Activity Report (March 2013)
") Monthly Volcanic Activity Report (March 2013) Hakoneyama (Alert Level: 1) Shallow earthquake activity from the area near Mt. Komagatake to Sengokuhara has largely remained at low levels since the middle
Monthly Volcanic Activity Report (March 2013) Hakoneyama (Alert Level: 1) Shallow earthquake activity from the area near Mt. Komagatake to Sengokuhara has largely remained at low levels since the middle
The Climate of Marshall County
 The Climate of Marshall County Marshall County is part of the Crosstimbers. This region is a transition region from the Central Great Plains to the more irregular terrain of southeastern Oklahoma. Average
The Climate of Bryan County
 The Climate of Bryan County Bryan County is part of the Crosstimbers throughout most of the county. The extreme eastern portions of Bryan County are part of the Cypress Swamp and Forest. Average annual
Summary report for Ruamāhanga Whaitua Committee The climate of the Ruamāhanga catchment
 Summary report for Ruamāhanga Whaitua Committee The climate of the Ruamāhanga catchment The Tararua and Rimutaka ranges have a large influence on the climate of the Ruamāhanga catchment. The ranges shelter
YACT (Yet Another Climate Tool)? The SPI Explorer
? The SPI Explorer") YACT (Yet Another Climate Tool)? The SPI Explorer Mike Crimmins Assoc. Professor/Extension Specialist Dept. of Soil, Water, & Environmental Science The University of Arizona Yes, another climate tool for
YACT (Yet Another Climate Tool)? The SPI Explorer Mike Crimmins Assoc. Professor/Extension Specialist Dept. of Soil, Water, & Environmental Science The University of Arizona Yes, another climate tool for
The Canadian ADAGIO Project for Mapping Total Atmospheric Deposition
 The Canadian ADAGIO Project for Mapping Total Atmospheric Deposition Amanda S. Cole Environment & Climate Change Canada (ECCC) MMF-GTAD Workshop Geneva, Switzerland February 28, 2017 ADAGIO team Amanda
Application of Nitrogen and Oxygen Isotopes to Identify Sources of Nitrate
 Application of Nitrogen and Oxygen Isotopes to Identify Sources of Nitrate Illinois Groundwater Consortium Conference April 9, 2001 George S. Roadcap, Illinois State Water Survey Keith C. Hackley, Illinois
The Climate of Pontotoc County
 The Climate of Pontotoc County Pontotoc County is part of the Crosstimbers. This region is a transition region from the Central Great Plains to the more irregular terrain of southeast Oklahoma. Average
ALKOR 346: First IFM-GEOMAR - HYPOX expedition to the Gotland Basin underway.
 ALKOR 346: First IFM-GEOMAR - HYPOX expedition to the Gotland Basin underway. From 18. Sept to 6 Oct. R/V ALKOR is working in the eastern Gotland Basin (central Baltic Sea.). The cruise led by R. Olaf
Analysis of meteorological measurements made over three rainy seasons in Sinazongwe District, Zambia.
 Analysis of meteorological measurements made over three rainy seasons in Sinazongwe District, Zambia. 1 Hiromitsu Kanno, 2 Hiroyuki Shimono, 3 Takeshi Sakurai, and 4 Taro Yamauchi 1 National Agricultural
WHEN IS IT EVER GOING TO RAIN? Table of Average Annual Rainfall and Rainfall For Selected Arizona Cities
 WHEN IS IT EVER GOING TO RAIN? Table of Average Annual Rainfall and 2001-2002 Rainfall For Selected Arizona Cities Phoenix Tucson Flagstaff Avg. 2001-2002 Avg. 2001-2002 Avg. 2001-2002 October 0.7 0.0
Author s Accepted Manuscript
 Author s Accepted Manuscript Biological nitrate transport in sediments on the Peruvian margin mitigates benthic sulfide emissions and drives pelagic N loss during stagnation events A.W. Dale, S. Sommer,
The Climate of Payne County
 The Climate of Payne County Payne County is part of the Central Great Plains in the west, encompassing some of the best agricultural land in Oklahoma. Payne County is also part of the Crosstimbers in the
The Climate of Kiowa County
 The Climate of Kiowa County Kiowa County is part of the Central Great Plains, encompassing some of the best agricultural land in Oklahoma. Average annual precipitation ranges from about 24 inches in northwestern
Drought Monitoring in Mainland Portugal
 Drought Monitoring in Mainland Portugal 1. Accumulated precipitation since 1st October 2014 (Hydrological Year) The accumulated precipitation amount since 1 October 2014 until the end of April 2015 (Figure
Central Region Climate Outlook March20, 2014
 Central Region Climate Outlook March20, 2014 Dr. Jim Angel State Climatologist IL State Water Survey University of Illinois jimangel@illinois.edu 217-333-0729 Happy Spring Equinox! General Information
South & South East Asian Region:
 Issued: 15 th December 2017 Valid Period: January June 2018 South & South East Asian Region: Indonesia Tobacco Regions 1 A] Current conditions: 1] El Niño-Southern Oscillation (ENSO) ENSO Alert System
The Climate of Seminole County
 The Climate of Seminole County Seminole County is part of the Crosstimbers. This region is a transition region from the Central Great Plains to the more irregular terrain of southeastern Oklahoma. Average
Climatological Regime and Weather Condition Occurred on the Cruise Expedition (May 1999) on Vietnam Continental Shelf
 on Vietnam Continental Shelf") outheast Asian Fisheries Development Center Climatological Regime and eather Condition Occurred on the Cruise xpedition (May 999) on Vietnam Continental helf Bui Xuan Thong, guyen Doan Toan, guyen The
outheast Asian Fisheries Development Center Climatological Regime and eather Condition Occurred on the Cruise xpedition (May 999) on Vietnam Continental helf Bui Xuan Thong, guyen Doan Toan, guyen The
Climate Outlook and Review
 Climate Outlook and Review September 2018 Author: Prof Roger C Stone Overview The European, UK, and US long-term climate models that focus on forecasting central Pacific sea surface temperatures are continuing
MPACT OF EL-NINO ON SUMMER MONSOON RAINFALL OF PAKISTAN
 MPACT OF EL-NINO ON SUMMER MONSOON RAINFALL OF PAKISTAN Abdul Rashid 1 Abstract: El-Nino is the dominant mod of inter- annual climate variability on a planetary scale. Its impact is associated worldwide
REGIONALIZATION OF PRECIPITATION ANOMALIES ASSOCIATED WITH EL NIÑO EVENTS IN SOUTHERN SOUTH AMERICA
 REGIONALIZATION OF PRECIPITATION ANOMALIES ASSOCIATED WITH EL NIÑO EVENTS IN SOUTHERN SOUTH AMERICA ABSTRACT Alice M. Grimm (1); Moira E. Doyle (2) (1) Department of Physics Federal University of Paraná
United States Climate
 25-1 Alabama Annual Average Temperature Data Source: http://www.wrcc.dri.edu/cgi-bin/divplot1_form.pl?0106 25-2 How does climate vary as we traverse the U.S. along 40 N? 25-3 Average Temperature Along
PHYSICAL PROPERTIES TAHOE.UCDAVIS.EDU 8
 PHYSICAL PROPERTIES 8 Lake surface level Daily since 1900 Lake surface level varies throughout the year. Lake level rises due to high stream inflow, groundwater inflow, and precipitation directly onto
HAIDA GWAII CLIMATE ASSESSMENT 2010 Special Report for MIEDS Franc Pridoehl
 HAIDA GWAII CLIMATE ASSESSMENT 2010 Special Report for MIEDS Franc Pridoehl INTRODUCTION Climatic conditions have varied considerably on Haida Gwaii over the past centuries and millennia (Hebda 2007).
1.4 USEFULNESS OF RECENT NOAA/CPC SEASONAL TEMPERATURE FORECASTS
 1.4 USEFULNESS OF RECENT NOAA/CPC SEASONAL TEMPERATURE FORECASTS Jeanne M. Schneider* and Jurgen D. Garbrecht USDA/ARS Grazinglands Research Laboratory, El Reno, Oklahoma 1. INTRODUCTION Operational climate
LIGHT PENETRATION INTO FRESH WATER.
 LIGHT PENETRATION INTO FRESH WATER. III. SEASONAL VARIATIONS IN THE LIGHT CONDITIONS IN WINDERMERE IN RELATION TO VEGETATION. BY W. H. PEARS ALL AND PHILIP ULLYOTT. {Received 29th May, 1933.) (With Three
Champaign-Urbana 1999 Annual Weather Summary
 Champaign-Urbana 1999 Annual Weather Summary ILLINOIS STATE WATER SURVEY 2204 Griffith Dr. Champaign, IL 61820 wxobsrvr@sws.uiuc.edu Maria Peters, Weather Observer A major snowstorm kicked off the new
2003 Water Year Wrap-Up and Look Ahead
 2003 Water Year Wrap-Up and Look Ahead Nolan Doesken Colorado Climate Center Prepared by Odie Bliss http://ccc.atmos.colostate.edu Colorado Average Annual Precipitation Map South Platte Average Precipitation
2013 Summer Weather Outlook. Temperatures, Precipitation, Drought, Hurricanes and why we care
 2013 Summer Weather Outlook Temperatures, Precipitation, Drought, Hurricanes and why we care Role of the ERCOT Meteorologist Forecasts Develop temperature input for hourly load forecasts (next day, days
The Climate of Texas County
 The Climate of Texas County Texas County is part of the Western High Plains in the north and west and the Southwestern Tablelands in the east. The Western High Plains are characterized by abundant cropland
Colorado s 2003 Moisture Outlook
 Colorado s 2003 Moisture Outlook Nolan Doesken and Roger Pielke, Sr. Colorado Climate Center Prepared by Tara Green and Odie Bliss http://climate.atmos.colostate.edu How we got into this drought! Fort
What is happening to the Jamaican climate?
 What is happening to the Jamaican climate? Climate Change and Jamaica: Why worry? Climate Studies Group, Mona (CSGM) Department of Physics University of the West Indies, Mona Part 1 RAIN A FALL, BUT DUTTY
PROGRESS ACCOMPLISHED THIS PERIOD
 Semi-Annual Report Period Covered: September 1, 21 through February 28, 217 Prepared By: Richard Radigan Title: Monitoring of a Constructed Oyster Reef in the St. Lucie Estuary Agency: Florida Fish & Wildlife
Climatography of the United States No
 Month (1) Min (2) Month(1) Extremes Lowest (2) Temperature ( F) Lowest Month(1) Degree s (1) Base Temp 65 Heating Cooling 100 Number of s (3) 42.6 24.2 33.4 79 1950 25 44.2 1974-16 1994 19 18.8 1977 977
The Climate of Grady County
 The Climate of Grady County Grady County is part of the Central Great Plains, encompassing some of the best agricultural land in Oklahoma. Average annual precipitation ranges from about 33 inches in northern
2012 Growing Season. Niagara Report. Wayne Heinen
 2012 Growing Season Niagara Report Wayne Heinen Overview The 2012 growing season was a phenomenal one for grapes. Vines entered bud break in good shape following a mild winter. The spring of 2012 was similar
Results of oceanographic analyses conducted under JARPA and possible evidence of environmental changes.
 SC/D06/J30 Results of oceanographic analyses conducted under JARPA and possible evidence of environmental changes. Tomowo Watanabe*, Takashi Yabuki**, Toshio Suga**, Kimio Hanawa**, Koji Matsuoka*** and
Changing Hydrology under a Changing Climate for a Coastal Plain Watershed
 Changing Hydrology under a Changing Climate for a Coastal Plain Watershed David Bosch USDA-ARS, Tifton, GA Jeff Arnold ARS Temple, TX and Peter Allen Baylor University, TX SEWRU Objectives 1. Project changes
Climatography of the United States No
 Temperature ( F) Month (1) Min (2) Month(1) Extremes Lowest (2) Lowest Month(1) Degree s (1) Base Temp 65 Heating Cooling 100 Number of s (3) Jan 32.8 21.7 27.3 62 1918 1 35.8 1983-24 1950 29 10.5 1979
Climatography of the United States No
 Month (1) Min (2) Month(1) Extremes Lowest (2) Temperature ( F) Lowest Month(1) Degree s (1) Base Temp 65 Heating Cooling 100 Number of s (3) Jan 63.9 39.3 51.6 86 1976 16 56.6 1986 20 1976 2 47.5 1973
Chapter 1 Climate in 2016
 Chapter 1 Climate in 2016 1.1 Global climate summary Extremely high temperatures were frequently observed in many regions of the world, and in particular continued for most of the year in various places
Climatography of the United States No
 Climate Division: CA 7 NWS Call Sign: Month (1) Min (2) Month(1) Extremes Lowest (2) Temperature ( F) Lowest Month(1) Degree s (1) Base Temp 65 Heating Cooling 100 Number of s (3) Jan 54.4 36.9 45.7 77+
Climatography of the United States No
 Climate Division: CA 7 NWS Call Sign: Month (1) Min (2) Month(1) Extremes Lowest (2) Temperature ( F) Lowest Month(1) Degree s (1) Base Temp 65 Heating Cooling 100 Number of s (3) 44.5 29.3 36.9 69 1951
Climatography of the United States No
 Climate Division: CA 4 NWS Call Sign: Month (1) Min (2) Month(1) Extremes Lowest (2) Temperature ( F) Lowest Month(1) Degree s (1) Base Temp 65 Heating Cooling 100 Number of s (3) Jan 61.9 42.0 52.0 89
Climatography of the United States No
 Climate Division: CA 1 NWS Call Sign: Month (1) Min (2) Month(1) Extremes Lowest (2) Temperature ( F) Lowest Month(1) Degree s (1) Base Temp 65 Heating Cooling 1 Number of s (3) Jan 56.2 4.7 48.5 79 1962
Climatography of the United States No
 Climate Division: CA 2 NWS Call Sign: Month (1) Min (2) Month(1) Extremes Lowest (2) Temperature ( F) Lowest Month(1) Degree s (1) Base Temp 65 Heating Cooling 100 Number of s (3) Jan 55.6 38.8 47.2 81
Climatography of the United States No
 Climate Division: CA 4 NWS Call Sign: Month (1) Min (2) Month(1) Extremes Lowest (2) Temperature ( F) Lowest Month(1) Degree s (1) Base Temp 65 Heating Cooling 100 Number of s (3) Jan 61.4 33.1 47.3 82+
Climatography of the United States No
 Climate Division: CA 2 NWS Call Sign: Month (1) Min (2) Month(1) Extremes Lowest (2) Temperature ( F) Lowest Month(1) Degree s (1) Base Temp 65 Heating Cooling 100 Number of s (3) 53.7 32.7 43.2 79 1962
Climatography of the United States No
 Climate Division: CA 6 NWS Call Sign: Month (1) Min (2) Month(1) Extremes Lowest (2) Temperature ( F) Lowest Month(1) Degree s (1) Base Temp 65 Heating Cooling 100 Number of s (3) Jan 66.1 38.3 52.2 91
Climatography of the United States No
 Climate Division: CA 7 NWS Call Sign: Month (1) Min (2) Month(1) Extremes Lowest (2) Temperature ( F) Lowest Month(1) Degree s (1) Base Temp 65 Heating Cooling 100 Number of s (3) 56.0 35.7 45.9 83 1975
Climatography of the United States No
 Climate Division: CA 7 NWS Call Sign: Month (1) Min (2) Month(1) Extremes Lowest (2) Temperature ( F) Lowest Month(1) Degree s (1) Base Temp 65 Heating Cooling 1 Number of s (3) 64.8 45.4 55.1 85 1971