Shallow 3-D structure of the San Jacinto Fault zone revealed. from ambient noise imaging with a dense seismic array
|
|
|
- Raymond May
- 5 years ago
- Views:
Transcription
1 Page of submitted to Geophys. J. Int. Shallow -D structure of the San Jacinto Fault zone revealed from ambient noise imaging with a dense seismic array Aurélien Mordret, Philippe Roux, Pierre Boué and Yehuda Ben-Zion Department of Earth, Atmospheric and Planetary Sciences, Massachusetts Institute of Technology (MIT), Cambridge, Massachusetts, USA Institut des Sciences de la Terre (ISTerre), Universit Grenoble-Alpes (UGA), CNRS UMR, Maison des Géosciences, Saint Martin dhères, France Department of Earth Sciences, University of Southern California (USC), Los Angeles, CA, -, USA October SUMMARY We use one month of continuous seismic waveforms from a very dense seismic network to image with unprecedented resolution the shallow damage structure of the San Jacinto fault zone across the Clark fault strand. After calculating noise correlations, high apparent-velocity arrivals coming from below the array are removed using a frequency-wavenumber filter. This is followed by a double-beamforming analysis on multiple pairs of subarrays to extract phase and group velocity information across the study area. The phase and group velocity dispersion curves are regionalized into phase and group velocity maps at different frequencies, and these maps are inverted using a neighbourhood algorithm to build a D shear wave velocity model around the Clark fault down to m depth. The model reveals strong lateral variations across the fault strike with pronounced low velocity zones corresponding to a local sedimentary basin and a fault zone trapping structure. The results complement previous earthquakeand seismic noise-based imaging of the fault zone at greater depth and clarify properties of structural features near the surface.
2 Page of Mordret et al. Key words: Seismic tomography; Seismic interferometry; Wave scattering and diffraction; Wave propagation; Surface waves and free oscillations INTRODUCTION The properties and structures of the heavily damaged material in the top few hundred meters of the crust are understood only in general terms due to the lack of resolution of standard imaging techniques and strong local heterogeneities at shallow depths. Classic local earthquake tomography is best suited below - km, standard noise-based imaging with frequencies up to Hz have resolution below m, while small active seismic sources resolve mostly the first tens of meters of the subsurface. Having a better understanding of crustal structures and processes at this depth range is crucial, especially near fault zones, because of their great influence on observed seismic motion, crustal hydrology, reliability of underground facilities and numerous other applications. The low normal stress at shallow depth renders the subsurface material highly susceptible to failure and strongly attenuative, masking details of deeper structures and processes. Deriving detailed images of the very shallow crust can allow seismic velocity models to be developed essentially up to the surface, where they may be combined with information obtained from geological mapping and boreholes. The San Jacinto fault zone (SJFZ) is the most seismically active structure of the plate-boundary between the Pacific and North America plates in southern California, with a slip rate of about - mm/yr (e.g. McGill et al. ; Rockwell et al. ). It runs parallel to the San Andreas fault to the NE and the Elsinore fault to the SW and is thought to have a recurrence rate of major earthquake (M W >.) of about - yr (Rockwell et al. ). The last earthquake which may have rupture the total km length of the fault likely occurred on November (Rockwell et al. ), indicating that the SJFZ presents a serious seismic hazard for the region in the near future. The Trifurcation area of the SJFZ, the region where the Clark fault is joined by the Bulk Ridge fault and the Coyote Creek fault (Fig. a), has ongoing small to moderate earthquake activity Corresponding author, mordret@mit.edu
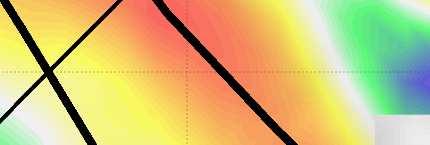
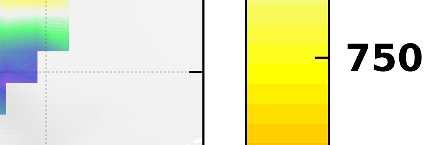
3 Page of Latitude Latitude (b) (d) (a).. y Phase velocity [m/s] - F =. Hz x Clark fault Phase velocity [m/s] - F =. Hz Longitude Thomas Mountain fault San Jacinto Fault zone passive imaging Phase velocity [m/s] Clark fault Coyote Creek fault (c) (e) Buck Ridge fault Phase velocity [m/s] - F =. Hz Phase velocity [m/s] - F =. Hz Longitude Figure. Phase velocity maps at four different frequencies obtained from DBF (Roux et al. ) on top of the local topography (Map data, Google, ). The black dots show the station configuration, the color dots the local phase velocity. The thick black line indicates the surface trace of the Clark fault. The top panel (a) shows the general tectonic context of the studied area (red square) on a topography map of the Trifurcation area of the San Jacinto fault zone (Map data, Google, ). The blue lines are the regional fault traces with their names. b). Hz, c). Hz, d). Hz, e). Hz.
4 Page of Mordret et al. and generates >% of the recent seismicity in southern California (e.g., Ross et al. ). This complex faulting geometry is in contrast to the simpler section of the Clark fault to the NW, referred to as the Anza seismic gap (Sanders & Kanamori ), with a lack of microseismicity and potential source ofm W. earthquakes. Previous imaging studies in the area used local earthquake tomography and ambient noise with frequencies up to Hz to clarify properties of the fault zone at seismogenic depth (Scott et al. ; Allam & Ben-Zion ; Allam et al. ; Zigone et al. ). However, the properties in the top m of the crust remained unresolved and are targeted in this work. Damage fault zone structures have strong heterogeneities of seismic properties including lateral interfaces that produce additional phases and complex wavefield (e.g., Ben-Zion & Aki ; Hillers et al. ). The intense seismicity and complex wavefield in the study area require using special techniques to suppress impulsive earthquake signals and extract Rayleigh surface waves from the remaining ambient seismic noise data that can be used for tomographic imaging (Shapiro et al. ; Roux ; Roux et al. ). This challenging task is accomplished using the pre-processing procedure and iterative double-beamforming (DBF) phase extraction technique of Roux et al. (). The obtained phase and group velocities of Rayleigh waves are inverted for shear wave velocities in the shallow crust with a neighbourhood algorithm (Sambridge ). The derived D shallow structure of the fault zone closes an important observational gap between previous seismic imaging studies and geological mapping in the area. AMBIENT NOISE TOMOGRAPHY FROM A DENSE SEISMIC ARRAY Following previous work on high-resolution imaging from ambient noise correlations of dense array data (e.g. Lin et al. ; Mordret et al. a), we produce here local images of the shear-wave velocity at the SJFZ. We first describe briefly the data and main methodological steps needed to construct accurate dispersion curves of Rayleigh waves from the noise correlations in the complex study area following Roux et al. (). The employed data were obtained by a dense rectangular array with ( Hz) vertical geophones and linear dimensions of about m (Fig. ). The array was centred on the damage structure of the Clark fault in the Trifurcation area of the
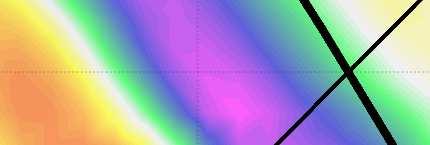
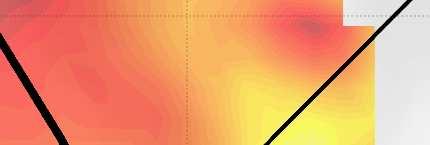
5 Page of Latitude Latitude (a) (c) Group velocity [m/s] - F =. Hz Group velocity [m/s] - F =. Hz Longitude San Jacinto Fault zone passive imaging Group velocity [m/s] (b) (d) Group velocity [m/s] - F =. Hz Group velocity [m/s] - F =. Hz Longitude Figure. Group velocity maps at four different frequencies obtained from DBF (Roux et al. ) on top of the local topography (Map data, Google, ). The black dots show the station configuration, the color dots the local group velocity. The thick black line indicates the surface trace of the fault. a). Hz, b). Hz, c). Hz, d). Hz. SJFZ, south-east of Anza (Fig. ), and recorded waveforms continuously at Hz for about month in (Ben-Zion et al. ). Each row along the fault-normal (x) direction had sensors with an inter-sensor distance of m, and the nominal separation between the rows in the along-strike (y) direction was m. Each element of the seismic array provided continuous GPS-synchronized records.. Reliable extraction of Rayleigh waves information in fault zone region Despite the incoherent noise generated by the ocean and by nearby sources (e.g., wind or human related), recent analyses suggested that numerous impulsive signals recorded by the array are generated by sources below the surface (Ben-Zion et al. ). Their apparent random temporal occurrence, without clear diurnal pattern, suggests that they do not have a thermal or man-made
6 Page of Mordret et al. origin. In addition to many distinguishable micro-seismic events (Meng & Ben-Zion ), the waveforms contain large sets of long bursts that are typically grouped with the ambient seismic noise extending down to Hz. To account for the presence of impulsive spikes in the waveforms, one-bit noise correlation is applied to one-day long recording windows between all sensor pairs of the network. The averaged one-day cross-correlations show a strong contribution around time t =, which suggests that most of the coherent signals are coming from below the array with very high apparent velocities, consistent with the presence of body waves (Roux et al. ). Because of the complexity of the ambient wavefield, all the processing (from raw data to velocity measurements) is done in narrow frequency band (about an octave). This increases significantly the quality of the measurement (for instance, one-bit normalization becomes quite robust) as well as the computational effort. After getting the noise correlations, surface waves can be separated from body waves using a frequency-wavenumber filtering to remove phase velocities greater than m/s at each frequency. Despite unfavourable noise-source distribution for surface waves, both phase and group velocity maps are obtained at discrete frequencies from. Hz to Hz. This is done using a DBF algorithm applied to a set of, sub-array pairs, each made of neighbouring sensors selected among the dense seismic array (Roux et al. ). Similar to standard beamforming where time-delayed traces from one source are stacked across an array of receivers to find the speed and direction of the incoming waves, the DBF stacks time-delayed traces from multiple (virtual) sources on a pair of (virtual) source-receiver arrays. Using cross-correlationsc ij between each pair of sensors within the two sub-arrays, the time-dependent DBF can be expressed as (Roux et al. ): DBF(t) = C ij (t δ ij ), () i,j where δ ij is the time-delay between each station i and j among the two arrays. The elevation difference at each sensor is taken into account in the time-delay computation. The DBF analysis is essential here to separate the fundamental Rayleigh wave from higher-order modes and other spurious arrivals that are superimposed at short distances in the above-mentioned frequency bands. Despite the fact that higher modes can be used to better constrain velocity models in surface wave
7 Page of San Jacinto Fault zone passive imaging tomography (Tomar et al. ), their identification is often difficult and hence less robust (Boué et al. ). Here, we are seeking a good identification of the fundamental mode by increasing its signal-to-noise ratio (Boué et al. ). The DBF provides both the slowness and travel-time of each extracted wavelet, which can be used to derive phase and group velocity information at each frequency when accumulated over all possible sub-array pairs. Figures and show Rayleigh wave phase and group velocity maps obtained at. Hz, Hz, Hz and Hz from the phase slowness and travel-time inversion on a regular horizontal grid with steps of m. The tomography inversion starts from a homogeneous initial model, assuming straight rays as propagation paths and an a-priori error covariance matrix that decreases exponentially with distances over m (Roux et al. ). For the group velocity map, the inversion is performed with a random sub-sample of all the measurements and repeated times. The average results of these inversions give the final group velocity maps and the standard deviation gives their uncertainties. We use this procedure to reduce the computational burden of inverting more than, dispersion curves at once. This also allows us to obtain robust statistical estimate of the group velocity uncertainties. At each frequency, the phase or group velocity inversions produce a residual variance reduction of % relative to the phase slowness and % relative to the travel times of the homogeneous model. The topography has a maximum of m elevation difference on the array and is not taken into account in the inversions (as suggested in Pilz et al. ()). The smallest wavelength that we are measuring is on the order of - m and may only affect our estimation of the group velocity for which the distance between the sub-arrays is used to compute the velocity. Despite this approximation, the correlation between the group velocity maps and the topography is not obvious. Note that with this approach phase velocity is assumed to accumulate over propagation distance, similarly to group velocity, following the Fermat principle. However, phase velocity should instead be considered as a local value below each -element array used to perform the DBF. This requires extracting two phase slowness instead of one following the procedure described in Roux et al. () (see their Eqs. (-) for details) at the price of a significantly larger computation effort. This assumption is valid if the propagation medium is not too complex, i.e., when the two
8 Page of Mordret et al. sub-arrays are close to each other. At longer distance, multipathing is stronger and the phase velocity estimations are less reliable. As for eikonal tomography (Lin et al. ; Mordret et al. c), the phase slowness extracted from each sub-array pair through DBF can be locally averaged to produce equivalent phase velocity maps (Fig. ) and used to estimate the uncertainties. The tomography results show strong lateral variations across the fault traces. The red lowvelocity zone near the right fault line observed at lower frequencies in the phase velocity maps (Fig. a-b) corresponds to the fault zone trapping structure identified in Ben-Zion et al. () and Qin et al. () using active experiment data and earthquake waveforms. The results for increasing frequencies have complex features that correspond progressively to shallower depth. Note that phase velocity maps seem to be at first sight more interpretable than group velocity maps as suggested from their relative sensitivity kernel analysis (Fig. S). Phase velocity sensitivity always exhibits a positive kernel with one main maximum implying that a shear wave velocity anomaly at depth will be positively correlated with the phase velocity at the frequency sensitive to this depth. On the other hand, group velocity kernels exhibit two main extrema: one positive and one negative at different depths. Therefore, at a single frequency, group velocity maps show the weighted average of shear velocity structures that are positively correlated at one depth with shear velocity structures that are negatively correlated at another depth. This makes it difficult to interpret of the resulting group velocity values. Another consequence of the group velocity kernel shape is that a single positive shear wave velocity anomaly at a specific depth may be seen as positive or negative group velocity anomalies depending on frequency. The wavelength range of the Rayleigh waves used here suggests that the imaging results characterize the top m to - m of the crust.. Inversion with a neighbourhood algorithm The full set of phase and group velocity maps provides local dispersion curves at each cell of the map. These local dispersion curves for phase and group velocities are jointly inverted to obtain local D profiles of Vs versus depth. The ensemble of every best local D model constitutes the final D Vs model.
9 Page of San Jacinto Fault zone passive imaging We use a Monte-Carlo approach to invert the dispersion curves at depth because of the strong non-linearity of the problem and the absence of accurate a priori starting velocity model. This Monte-Carlo approach is based on a neighbourhood algorithm (Sambridge ) and is described in detail by Mordret et al. (). This algorithm has the advantage of exploring entirely the model space using a Voronoï cell discretization and increasing the focus on its most promising areas as the iteration number increases. The general D velocity profile is parametrized by a power-law backbone, suitable for modelling compacting sediments (e.g., Wathelet et al. ), modified by two cubic-spline anomalies. The bottom layer of the model is a half-space. The model is described by the following equation: V s (d) = V [(d+) α (d +) α +]+ A n Sn(d), β () n= where V s is the shear-wave velocity, d is the depth, V is the velocity at depth d = m, α is the curvature of the power-law,s n are the spline basis functions,β is a parameter describing the depth distribution of the splines (Mordret et al. ) anda n are the amplitudes of the splines. The local D models are discretized using homogeneous layers with logarithmic increasing thickness between the surface and depth d n. During the inversion, the P-wave velocity is scaled to Vs using a Vp/Vs ratio that varies linearly between Vp/Vs at the surface and Vp/Vs n at the depth d n to take into account the sensitivity of Rayleigh waves to Vp in the near surface (Fig. S). Below d n the Vp/Vs ratio is set to.. The density is scaled to Vp using the empirical relationship of Brocher (). The depth inversion searches for the optimum parameters V, α,β, A, A, Vp/Vs, Vp/Vs n and the depth d n of the half-space at each point of the geographical grid. The ranges explored by the algorithm for the parameters are shown in Table. We sample a total of, models at each geographical point of our grid. The initial random sampling is done with, models; then the Voronoï cells around the best models are resampled with models and this process is iterated times (Mordret et al. ). The final model is the average of the best models (with the lowest misfits). The uncertainties of the velocity model are estimated by the standard deviation of the posterior distribution of the best models.
10 Page of Mordret et al. Table. Inverted parameters and their ranges Parameter Unit Min Max V m/s α.. β A m/s - A m/s - d n m Vp/Vs.. Vp/Vs n.. Figures a-b show two examples of local inversions at two different positions on the grid (Fig. c). The colors show the misfit, the gray curves are the best model and its associated dispersion curves, and the black bars are the measured dispersion curves. During each inversion, we used a misfit defined by Mordret et al. () as a ratio of two surface areas, Misfit = ds/s, with S being the integral surface area of the measured dispersion curve and its errorbars and ds the integral surface area of the synthetic dispersion curve outside ofs. With this definition, the misfit presents a wider minimum area and permits to retain dispersion curves as long as they fit the data within their errorbars. The misfit map has strong lateral variations (Fig. c) that mostly reflect difficulties to fit some local phase dispersion curves (Fig. a). For some frequencies, the phase velocity has large uncertainties and does not seem to be consistent with velocities at neighbouring frequencies. This might indicate discontinuities within cell s phase dispersion curves due to lateral heterogeneities, contamination by higher-order modes, body-waves or local anthropogenic noise (South-West of the fault). Local measurements of phase velocities across the fault reveal strong changes on short distances associated with low velocity damaged zones (see Fig. in Roux et al. ). Future work will focus on local extraction of phase slowness as discussed in section., and its interpretation through both local anisotropy and damage.

11 Page of a) b) San Jacinto Fault zone passive imaging log(normalized misfit) log(normalized misfit) Latitude c) A -. Longitude Normalized misfit Figure. Local depth inversion at two locations in the model: the top-left panel shows the phase velocity dispersion curve fit, the top-middle panel shows the group velocity dispersion curve fit and the top-right (bottom right for point B) panel shows the sampled Vs models. The bottom-left panel shows the sampled Vp models et the bottom-middle panel the Vp/Vs ratios. The inverted data are in black with the errorbars; the best model and the dispersion curves associated with the best model are in gray. The color of the modelled dispersion curves and their associated models indicate their misfit value. a) Inversion of a point on top of the main Clark fault trace. b) Inversion of a point East of the fault. c) Map of the best model misfit on top of the local topography (Map data, Google, ). The fault traces are shown by the red lines. The seismic array is shown by the the black dots and the locations of the points inverted in a) and b) are indicated by the blue and red circles, respectively. The group velocities are comparatively more robust, essentially because of the lack of phase ambiguity measurements but they also exhibit discontinuities to some extent. Again, contamina- tion by higher-modes, body waves or sensor coupling may be at the origin of these jumps. To assess the benefit of jointly inverting phase velocities with group velocities we performed an in- B
12 Page of Mordret et al. version of the group velocity alone (Fig. S). For the same two points as in Fig. we achieve much smaller misfits. However, it clearly appears that the dispersion curves are overfitted and do not correspond to physically and geologically reasonable velocity models. The addition of phase velocity dispersion curves in the inversion, despite their larger uncertainties, helps to diminish the non-uniqueness of the solution (e.g., Shapiro & Ritzwoller ). In conclusion, the constraints brought by the phase velocities, although weak, facilitate the rejection of highly unreasonable models and strengthen the robustness of the results. INVERSION RESULTS The derived D model shows lateral velocity variations of about -% at all depths (Fig. ab- ab) with several structures parallel to the fault strike (Fig. ab). The velocity uncertainties are correlated with the velocity structures with higher uncertainties for higher velocities (Fig. cd). They also tend to increase with depth, showing uncertainties smaller than m/s above m depth and up to - m/s below this depth. This reflects the extra constraint from Vp and density in the near surface (Fig. S). The inversion results confirm that the assumed initial average velocity profile following a modified power-law is a good model for the very shallow velocity structure (Fig. c). The two surface fault traces (black dashed lines in Fig. ab) clearly delineates a low velocity zone encompassed by higher velocities to the SW and slightly lower velocities to the NE (Fig. ). This sharp lateral contrast even more clearly present in the depth variations of the iso-velocity contour at Vs= m/s (Fig. ), which is a proxy for the transition between the loose near surface sediments and the more compact rocks at depth. A trough beneath the surface fault traces is consistent with damaged rocks producing deeper low velocity material than directly to the West. This low velocity zone corresponds to the local seismic trapping structure observed by Ben-Zion et al. () and Qin et al. (). Given the final misfit in the most south-western part of the model (Fig. c) and the large uncertainties associated with the estimations of the depth of the half-space (Fig. a), the deep trough in the SW of Fig., at the location of a small sedimentary basin, should be interpreted with caution. Overall, the robust qualitative features of the model (and the ones explaining most of the variance


 m b) m")
 Figure.")


13 Page of San Jacinto Fault zone passive imaging a) m b) m m m m c) d) Figure. Horizontal slices in the D velocity model at m depth (a) and m depth (b) on top of the local topography (Map data, Google, ). Horizontal slices in the D uncertainty model at m depth (a) and m depth (b) on top of the local topography. The main Clark fault trace is show with thick black curves. The locations of the vertical profiles shown in Fig. are displayed with the thin black lines and graduated every m. in the data) are the power-law increase of the velocity with depth within the near-surface sediments, consistent with compaction (e.g., Baldwin & Butler ; Bachrach et al. ), the lateral variations across the fault traces and the depth variations of the base of the compacting layer. In such a complex environment, however, this simple model might be quantitatively biased by the simplifications we make during the modeling. Assuming a linear gradient-like Vp/Vs ratio in the near surface is one of them. Fig. S shows horizontal and vertical slices through the D Vp/Vs model. We can observe lateral variations that seem to be parallel to the fault strike and most of the model exhibit an increase of Vp/Vs ratio with depth. The scattering of the best models in Fig. suggests that this increase may not be a robust feature of our inversion. Among other simplifi-
14 Mordret et al. B - - B" b) - - Shear-velocity (m/s) d) - - c) Velocity uncertainties (m/s) Distance along the profile (m) Velocity uncertainties (m/s) Shear-velocity (m/s) A" a) e) V s Vp A Page of Velocity (km/s) / Density (g/cm) Distance along the profile (m) Figure. Vertical slices in the D velocity model, the bold black lines and the dashed lines show the surface traces of the faults and their vertical prolongation at depth, respectively. a) Profile A-A, b) Profile B-B. Vertical slices in the D uncertainty model. c) Profile A-A, d) Profile B-B. The locations of the profiles are shown in Fig.. e) Average Vp, Vs and density models. cations, we do not take into account the attenuation and the anisotropy while inverting for the velocity model. These parameters may not be negligible in the center and heavily damaged part of this fault zone as highlighted by previous studies (Ben-Zion et al. ; Hillers et al. ). How- ever, the pre- and post-processing used to compute the noise correlations and extract the Rayleigh waves strongly affect the signal amplitudes, making the extraction of attenuation information dif- ficult. Analysing the noise data with a procedure of the type developed by Liu et al. () can provide information on the attenuation coefficients. Regarding anisotropy the vertical component sensors are used in this study can provide information only on the azimuthal anisotropy of the Rayleigh waves. Resolving radial anisotropy (e.g., Tomar et al. ) expressing the difference in propagation speed between horizontally and vertically polarized waves requires three-components data. An analysis of azimuthal anisotropy through an eikonal tomography approach (Mordret et al. b; Zigone et al. ) will be the subject of future work. DISCUSSION AND CONCLUSIONS Building on the methodological work of Roux et al. (), we image with an unprecedented resolution the shallow damage structure of the SJFZ at the site of the dense seismic deployment (Fig. ). The complex environment, both in term of structure and variety of seismic signals requires the use of innovative techniques to extract the surface-wave information needed to perform the to-

15 Page of Clark Fault Clark Fault San Jacinto Fault zone passive imaging Thomas Mountain Fault Buck Ridge Fault Figure. The velocity model in the tectonic context: shear-wave velocity model at m depth draped on the local topography. The fault traces are shown with white lines. The orange/red areas indicate slower than average velocity zones. The green/blue areas indicate faster than average velocity zones. mography. The derived D shear-wave velocity model for the top m of the crust complements information obtained with more standard earthquake- and noise-based imaging techniques on the deeper structure of the fault zone, and allows direct comparisons with geological observations made at the surface (Wade et al. ). A previous attempt to image fault zone structure with ocean-induced seismic noise was performed on the San Andreas Fault in Parkfield at lower frequency (<. Hz) and at a larger scale from stations in a km x km area (Roux et al. ). A. km wide steep dipping was imaged from less than local dispersion curves for Love waves. Joint inversion of body wave arrival times and these surface wave dispersion curves was applied to further constrain a U-shaped feature of the D seismic structure around SAFOD (Zhang et al. ). It seems that a similar feature is observed in Fig., though at a much smaller scale. In our study area the U-shaped feature is produced by a narrow low velocity zone delimited by the surface fault traces trapped between two higher velocity ridges to the SW and the NE(Fig. -).Qin et al. () concluded based on earthquake waveforms that the SW fault trace represents the main seismogenic fault separating two different crustal blocks at depth. The asymmetry between the high velocities to the SW and the lower velocities to the NE tends to confirm this interpretation. Theoretical and numerical re-


.")


16 Page of Mordret et al. Figure. Isovelocity contour at Vs = m/s showing the base of the compacting sediments. The fault trace is underlain by a trough of low velocity material restricted by ridges of higher velocity material in the South-West and North-East. The fault trace is shown with the magenta lines at the surface on top of shaded digital elevation model. The isovelocity surface and the digital elevation model do not have the same vertical exaggeration. sults indicates that earthquakes on a bimaterial interface tend to have preferred rupture direction (Ben-Zion, and references therein) and produce asymmetric shallow damage structure on the less compliant side of the fault at depth (e.g. Ben-Zion & Shi ; Xu & Ben-Zion ). In the study area, regional tomographic images have shown that the NE side of the main Clark fault is faster than the SW block at seismogenic depth (Scott et al. ; Allam & Ben-Zion ; Allam et al. ; Zigone et al. ). Therefore, it is expected that rock damage be more pronounced on the NE side of the fault in the near surface, generating a shallow velocity contrast inversion between the local scale and the regional scale structures. This is confirmed by the local contrast of seismic velocities across the main Clark fault imaged in this study (Fig.,) and is consistent with local geological mapping (Wade et al. ) and agrees with the general NW directivity of earthquake ruptures in the area. The results of this work mainly provide isotropic shear-wave velocities of the subsurface structure. Future studies can improve the seismological characterization of the study area by deriving information on the compressional wave velocity, attenuation coefficients and anisotropy. Research
17 Page of San Jacinto Fault zone passive imaging on some of these topics is currently under way. Fang et al. () derived a D velocity model for the plate-boundary region around the SJFZ with a nominal resolution of about km from joint inversion of surface-wave and body-wave measurements. Similar analysis can be performed for the site of the dense deployment using our surface-wave results and the collection of active shots recorded on the dense seismic grid (Ben-Zion et al. ). Following Nakata et al. (), refracted and/or reflected body wave arrivals could also be extracted directly from ambient noise correlations from the microseismic activity at depth in the fault zone. The lateral spatial resolution in the sampled area should be lower than m for a detailed D image down to m at depth. The site of the dense deployment used in this work is becoming a natural laboratory for collecting and correlating different types of geological data (detailed mapping, laboratory characterization of rock samples) and geophysical results (seismic, geodetic, electrical resistivity, GPR). The D velocity model developed in this paper for the very shallow crust provides a fundamental component for the effort to compare and correlate different fault zone data sets. It will also help to better constrain results on temporal changes of seismic velocities from various sources, and understand properties of earthquake ruptures in the area. ACKNOWLEDGMENTS The manuscript benefited from useful comments by two anonymous referees. AM acknowledges support from the National Science Foundation grants EAR- and PLR-. YBZ acknowledges support from the Department of Energy (award DE-SC) and the National Science Foundation (grant EAR-). This work was funded by Defi Imag In CNRS (in and ). ISTerre is part of Labex OSUG@.
18 Page of Mordret et al. REFERENCES Allam, A. & Ben-Zion, Y.,. Seismic velocity structures in the Southern California plate-boundary environment from double-difference tomography,, (),. Allam, A., Ben-Zion, Y., Kurzon, I., & Vernon, F.,. Seismic velocity structure in the Hot Springs and Trifurcation areas of the San Jacinto fault zone, California, from double-difference tomography,, (),. Bachrach, R., Dvorkin, J., & Nur, A. M.,. Seismic velocities and Poisson s ratio of shallow unconsolidated sandsseismic Properties of Shallow Sands, Geophysics, (),. Baldwin, B. & Butler, C. O.,. Compaction curves, AAPG bulletin, (),. Ben-Zion, Y.,. Dynamic ruptures in recent models of earthquake faults, Journal of the Mechanics and Physics of Solids, (),. Ben-Zion, Y. & Aki, K.,. Seismic radiation from an SH line source in a laterally heterogeneous planar fault zone, Bulletin of the Seismological Society of America, (),. Ben-Zion, Y. & Shi, Z.,. Dynamic rupture on a material interface with spontaneous generation of plastic strain in the bulk, Earth and Planetary Science Letters, (-),. Ben-Zion, Y., Vernon, F. L., Ozakin, Y., Zigone, D., Ross, Z. E., Meng, H., White, M., Reyes, J., Hollis, D., & Barklage, M.,. Basic data features and results from a spatially dense seismic array on the San Jacinto fault zone,, (),. Boué, P., Roux, P., Campillo, M., & Briand, X.,. Phase velocity tomography of surface waves using ambient noise cross correlation and array processing, Journal of Geophysical Research: Solid Earth, (),. Boué, P., Denolle, M., Hirata, N., Nakagawa, S., & Beroza, G. C.,. Beyond basin resonance: characterizing wave propagation using a dense array and the ambient seismic field, Geophysical Journal International, (),. Brocher, T. M.,. Empirical relations between elastic wavespeeds and density in the Earth s crust, Bulletin of the seismological Society of America, (),. Fang, H., Zhang, H., Yao, H., Allam, A., Zigone, D., Ben-Zion, Y., Thurber, C., & van der Hilst, R. D.,. A new algorithm for three-dimensional joint inversion of body wave and surface wave data and its application to the Southern California plate boundary region, Journal of Geophysical Research: Solid Earth, (),. Hillers, G., Campillo, M., Ben-Zion, Y., & Roux, P.,. Seismic fault zone trapped noise, Journal of Geophysical Research: Solid Earth, (),. Hillers, G., Roux, P., Campillo, M., & Ben-Zion, Y.,. Focal spot imaging based on zero lag crosscorrelation amplitude fields: Application to dense array data at the San Jacinto fault zone, Journal of Geophysical Research: Solid Earth, (),.
19 Page of San Jacinto Fault zone passive imaging Lin, F.-C., Ritzwoller, M. H., & Snieder, R.,. Eikonal tomography: surface wave tomography by phase front tracking across a regional broad-band seismic array,, (),. Lin, F.-C., Li, D., Clayton, R. W., & Hollis, D.,. High-resolution D shallow crustal structure in Long Beach, California: Application of ambient noise tomography on a dense seismic arraynoise tomography with a dense array, Geophysics, (), Q Q. Liu, X., Ben-Zion, Y., & Zigone, D.,. Extracting seismic attenuation coefficients from crosscorrelations of ambient noise at linear triplets of stations,, (),. McGill, S. F., Spinler, J. C., McGill, J. D., Bennett, R. A., Floyd, M. A., Fryxell, J. E., & Funning, G. J.,. Kinematic modeling of fault slip rates using new geodetic velocities from a transect across the Pacific-North America plate boundary through the San Bernardino Mountains, California, Journal of Geophysical Research: Solid Earth, (),. Meng, H. & Ben-Zion, Y.,. Detection of small earthquakes with dense array data: example from the San Jacinto fault zone, southern California,, (),. Mordret, A., Landès, M., Shapiro, N., Singh, S., Roux, P., & Barkved, O., a. Near-surface study at the Valhall oil field from ambient noise surface wave tomography,, (),. Mordret, A., Shapiro, N. M., Singh, S., Roux, P., Montagner, J.-P., Barkved, O., et al., b. Azimuthal anisotropy at Valhall: The Helmholtz equation approach, Geophysical Research Letters, (),. Mordret, A., Shapiro, N. M., Singh, S. S., Roux, P., & Barkved, O. I., c. Helmholtz tomography of ambient noise surface wave data to estimate Scholte wave phase velocity at Valhall Life of the FieldNoise tomography at Valhall, Geophysics, (), WA WA. Mordret, A., Landès, M., Shapiro, N., Singh, S., & Roux, P.,. Ambient noise surface wave tomography to determine the shallow shear velocity structure at Valhall: depth inversion with a Neighbourhood Algorithm,, (),. Mordret, A., Rivet, D., Landès, M., & Shapiro, N. M.,. Three-dimensional shear velocity anisotropic model of Piton de la Fournaise Volcano (La Réunion Island) from ambient seismic noise, Journal of Geophysical Research: Solid Earth, (),. Nakata, N., Chang, J. P., Lawrence, J. F., & Boué, P.,. Body wave extraction and tomography at Long Beach, California, with ambient-noise interferometry, Journal of Geophysical Research: Solid Earth, (),. Pilz, M., Parolai, S., & Bindi, D.,. Three-dimensional passive imaging of complex seismic fault systems: evidence of surface traces of the Issyk-Ata fault (Kyrgyzstan),,
20 Page of Mordret et al. (),. Qin, L., Ben-Zion, Y., Qiu, H., Share, P., Ross, Z., & Vernon, F.,. Internal structure of the San Jacinto fault zone in the trifurcation area southeast of Anza, California, from data of dense seismic arrays,, (),. Rockwell, T. K., Dawson, T. E., Ben-Horin, J. Y., & Seitz, G.,. A -event,,-year history of surface ruptures in the Anza seismic gap, San Jacinto fault, and implications for long-term earthquake production on a major plate boundary fault, Pure and Applied Geophysics, (),. Ross, Z. E., Hauksson, E., & Ben-Zion, Y.,. Abundant off-fault seismicity and orthogonal structures in the San Jacinto fault zone, Science Advances, (), e. Roux, P.,. Passive seismic imaging with directive ambient noise: application to surface waves and the San Andreas Fault in Parkfield, CA,, (),. Roux, P., Wathelet, M., & Roueff, A.,. The San Andreas Fault revisited through seismic-noise and surface-wave tomography, Geophysical Research Letters, (). Roux, P., Moreau, L., Lecointre, A., Hillers, G., Campillo, M., Ben-Zion, Y., Zigone, D., & Vernon, F.,. A methodological approach towards high-resolution surface wave imaging of the San Jacinto Fault Zone using ambient-noise recordings at a spatially dense array,, (),. Sambridge, M.,. Geophysical inversion with a neighbourhood algorithm I. Searching a parameter space,, (),. Sanders, C. O. & Kanamori, H.,. A seismotectonic analysis of the Anza seismic gap, San Jacinto fault zone, southern California, Journal of Geophysical Research: Solid Earth, (B),. Scott, J. S., Masters, T. G., & Vernon, F. L.,. -D velocity structure of the San Jacinto fault zone near Anza, California I. P waves,, (),. Shapiro, N. & Ritzwoller, M.,. Monte-Carlo inversion for a global shear-velocity model of the crust and upper mantle,, (),. Shapiro, N. M., Campillo, M., Stehly, L., & Ritzwoller, M. H.,. High-resolution surface-wave tomography from ambient seismic noise, Science, (),. Tomar, G., Shapiro, N. M., Mordret, A., Singh, S. C., & Montagner, J.-P.,. Radial anisotropy in Valhall: ambient noise-based studies of Scholte and Love waves,, (),. Tomar, G., Stutzmann, E., Mordret, A., Montagner, J.-P., Singh, S. C., & Shapiro, N. M.,. Joint inversion of the first overtone and fundamental mode for deep imaging at the Valhall oil field using ambient noise,, (),. Wade, A., Arrowsmith, R., Donnellan, A., Vernon, F. L., & Ben-Zion, Y.,. Decameter-scale geologic structure validation of shallow seismic properties along the San Jacinto fault at Sage Brush Flat, Anza,
21 Page of San Jacinto Fault zone passive imaging California, in Poster Presentation at SCEC Annual Meeting. Wathelet, M., Jongmans, D., & Ohrnberger, M.,. Surface-wave inversion using a direct search algorithm and its application to ambient vibration measurements, Near surface geophysics, (),. Xu, S. & Ben-Zion, Y.,. Theoretical constraints on dynamic pulverization of fault zone rocks, Geophysical Journal International, (),. Zhang, H., Maceira, M., Roux, P., & Thurber, C.,. Joint inversion of body-wave arrival times and surface-wave dispersion for three-dimensional seismic structure around SAFOD, Pure and Applied Geophysics, (),. Zigone, D., Ben-Zion, Y., Campillo, M., & Roux, P.,. Seismic tomography of the Southern California plate boundary region from noise-based Rayleigh and Love waves, Pure and Applied Geophysics, (),.
22 Page of Mordret et al.. sec c/ V s c/ c/ V p sec U/ V s U/ U/ V p sec. sec sec sec -... Figure S. Top) Phase and bottom) group velocity depth sensitivity kernels computed at different periods in the average velocity model for Vs, Vp and density.
23 Page of San Jacinto Fault zone passive imaging Figure S. Local depth inversion at the two locations (point A, top panel in blue and point B, bottom panel in red) in the model shown in Fig., using only the group velocity dispersion curves. The inverted data are in black with the errorbars; the best model and the dispersion curves associated with the best model are in gray and the color of the modelled dispersion curves and their associated models indicate their misfit value. Note the strong non-uniqueness of the solutions with two families of models competing. A A AA" B B BB" Vp/Vs ratio (.) - - Vp/Vs ratio (.) -. Distance along the profile (m) Distance along the profile (m) Figure S. Top) Horizontal slices in the D Vp/Vs ratio model at m and m depth. Bottom) Vertical profiles. The locations of the profiles are shown in the top panels.
of the San Jacinto Fault Zone and detailed event catalog from spatially-dense array data
 Shallow structure s of the San Jacinto Fault Zone and detailed event catalog from spatially-dense array data Yehuda Ben-Zion, University of Southern California, with F. Vernon, Z. Ross, D. Zigone, Y. Ozakin,
San Jacinto Fault Zone and Sage Brush Flat High Frequency Experiments
 San Jacinto Fault Zone and Sage Brush Flat High Frequency Experiments Frank Vernon! Scripps Institution of Oceanography! University of California, San Diego!! 2015 Udine AUG! 13 March 2015! Southern California
Ambient Noise Tomography in the Western US using Data from the EarthScope/USArray Transportable Array
 Ambient Noise Tomography in the Western US using Data from the EarthScope/USArray Transportable Array Michael H. Ritzwoller Center for Imaging the Earth s Interior Department of Physics University of Colorado
Imaging sharp lateral velocity gradients using scattered waves on dense arrays: faults and basin edges
 2017 SCEC Proposal Report #17133 Imaging sharp lateral velocity gradients using scattered waves on dense arrays: faults and basin edges Principal Investigator Zhongwen Zhan Seismological Laboratory, California
Geophysical Journal International
 Geophysical Journal International Geophys. J. Int. (2017) 211, 450 454 Advance Access publication 2017 July 28 GJI Seismology doi: 10.1093/gji/ggx316 EXPRESS LETTER Rayleigh phase velocities in Southern
to: Interseismic strain accumulation and the earthquake potential on the southern San
 Supplementary material to: Interseismic strain accumulation and the earthquake potential on the southern San Andreas fault system by Yuri Fialko Methods The San Bernardino-Coachella Valley segment of the
Effects of Surface Geology on Seismic Motion
 4 th IASPEI / IAEE International Symposium: Effects of Surface Geology on Seismic Motion August 23 26, 2011 University of California Santa Barbara TOMOGRAPHIC ESTIMATION OF SURFACE-WAVE GROUP VELOCITY
A systematic measurement of shear wave anisotropy in southern California Report for SCEC Award #15081 Submitted March 15, 2016
 A systematic measurement of shear wave anisotropy in southern California Report for SCEC Award #15081 Submitted March 15, 2016 Investigators: Zhigang Peng (Georgia Tech) I. Project Overview... i A. Abstract...
High Resolution Imaging of Fault Zone Properties
 Annual Report on 1998-99 Studies, Southern California Earthquake Center High Resolution Imaging of Fault Zone Properties Yehuda Ben-Zion Department of Earth Sciences, University of Southern California
Seismic interferometry with antipodal station pairs
 GEOPHYSICAL RESEARCH LETTERS, VOL. 4, 1 5, doi:1.12/grl.597, 213 Seismic interferometry with antipodal station pairs Fan-Chi Lin 1 and Victor C. Tsai 1 Received 25 June 213; revised 19 August 213; accepted
Characterization of Induced Seismicity in a Petroleum Reservoir: A Case Study
 Characterization of Induced Seismicity in a Petroleum Reservoir: A Case Study Edmond Sze, M. Nafi Toksöz, and Daniel R. Burns Earth Resources Laboratory Dept. of Earth, Atmospheric and Planetary Sciences
SUPPLEMENTARY INFORMATION
 Inability of additional parameters to resolve the Rayleigh-Love discrepancy Radial anisotropy is introduced to resolve the Rayleigh-Love misfit discrepancy that exists across large regions of the western
Observation of shear-wave splitting from microseismicity induced by hydraulic fracturing: A non-vti story
 Observation of shear-wave splitting from microseismicity induced by hydraulic fracturing: A non-vti story Petr Kolinsky 1, Leo Eisner 1, Vladimir Grechka 2, Dana Jurick 3, Peter Duncan 1 Summary Shear
Empirical Green s Function Analysis of the Wells, Nevada, Earthquake Source
 Nevada Bureau of Mines and Geology Special Publication 36 Empirical Green s Function Analysis of the Wells, Nevada, Earthquake Source by Mendoza, C. 1 and Hartzell S. 2 1 Centro de Geociencias, Universidad
2008 Monitoring Research Review: Ground-Based Nuclear Explosion Monitoring Technologies
 STRUCTURE OF THE KOREAN PENINSULA FROM WAVEFORM TRAVEL-TIME ANALYSIS Roland Gritto 1, Jacob E. Siegel 1, and Winston W. Chan 2 Array Information Technology 1 and Harris Corporation 2 Sponsored by Air Force
Topography on Earthquake Motions in Sedimentary Basins
 TRANSPORTATION RESEARCH RECORD 1411 Effects of Three-Dimensional Bedrock Topography on Earthquake Motions in Sedimentary Basins ARTHUR FRANKEL Work being done at the U.S. Geological Survey on 3-D simulations
Global surface-wave tomography
 Global surface-wave tomography Lapo Boschi (lapo@erdw.ethz.ch) October 7, 2009 Love and Rayleigh waves, radial anisotropy Whenever an elastic medium is bounded by a free surface, coherent waves arise that
Investigation of long period amplifications in the Greater Bangkok basin by microtremor observations
 Proceedings of the Tenth Pacific Conference on Earthquake Engineering Building an Earthquake-Resilient Pacific 6-8 November 2015, Sydney, Australia Investigation of long period amplifications in the Greater
Some aspects of seismic tomography
 Some aspects of seismic tomography Peter Shearer IGPP/SIO/U.C. San Diego September 7, 2009 Earthquake Research Institute Part 1: Global Tomography P velocity perturbations 200 km 1000 km 2700 km MIT 2006
Low-velocity damaged structure of the San Andreas Fault at Parkfield from fault zone trapped waves
 GEOPHYSICAL RESEARCH LETTERS, VOL. 31, L12S06, doi:10.1029/2003gl019044, 2004 Low-velocity damaged structure of the San Andreas Fault at Parkfield from fault zone trapped waves Yong-Gang Li Department
Velocity contrast along the Calaveras fault from analysis of fault zone head waves generated by repeating earthquakes
 Click Here for Full Article GEOPHYSICAL RESEARCH LETTERS, VOL. 35, L01303, doi:10.1029/2007gl031810, 2008 Velocity contrast along the Calaveras fault from analysis of fault zone head waves generated by
Contents of this file
 Geophysical Research Letters Supporting Information for Intraplate volcanism controlled by back-arc and continental structures in NE Asia inferred from trans-dimensional ambient noise tomography Seongryong
Ground displacement in a fault zone in the presence of asperities
 BOLLETTINO DI GEOFISICA TEORICA ED APPLICATA VOL. 40, N. 2, pp. 95-110; JUNE 2000 Ground displacement in a fault zone in the presence of asperities S. SANTINI (1),A.PIOMBO (2) and M. DRAGONI (2) (1) Istituto
Department of Earth Sciences, University of Southern California, Los Angeles, CA,
 Page of 0 0 0 0 0 0 Imaging subsurface structures in the San Jacinto fault zone with high frequency noise recorded by dense linear arrays Dimitri Zigone, Yehuda Ben-Zion, Maximilien Lehujeur,, Michel Campillo,
SHORT PERIOD SURFACE WAVE DISPERSION FROM AMBIENT NOISE TOMOGRAPHY IN WESTERN CHINA. Sponsored by National Nuclear Security Administration 1,2
 SHORT PERIOD SURFACE WAVE DISPERSION FROM AMBIENT NOISE TOMOGRAPHY IN WESTERN CHINA Michael H. Ritzwoller 1, Yingjie Yang 1, Michael Pasyanos 2, Sihua Zheng 3, University of Colorado at Boulder 1, Lawrence
3D IMAGING OF THE EARTH S MANTLE: FROM SLABS TO PLUMES
 3D IMAGING OF THE EARTH S MANTLE: FROM SLABS TO PLUMES Barbara Romanowicz Department of Earth and Planetary Science, U. C. Berkeley Dr. Barbara Romanowicz, UC Berkeley (KITP Colloquium 9/11/02) 1 Cartoon
3D VISCO-ELASTIC WAVE PROPAGATION IN THE BORREGO VALLEY, CALIFORNIA
 3D VISCO-ELASTIC WAVE PROPAGATION IN THE BORREGO VALLEY, CALIFORNIA Kim B OLSEN 1, Robert L NIGBOR 2 And Takaaki KONNO 3 SUMMARY We have simulated 2-Hz wave propagation in a three-dimensional model of
Estimation of S-wave scattering coefficient in the mantle from envelope characteristics before and after the ScS arrival
 GEOPHYSICAL RESEARCH LETTERS, VOL. 30, NO. 24, 2248, doi:10.1029/2003gl018413, 2003 Estimation of S-wave scattering coefficient in the mantle from envelope characteristics before and after the ScS arrival
Supporting Information for An automatically updated S-wave model of the upper mantle and the depth extent of azimuthal anisotropy
 GEOPHYSICAL RESEARCH LETTERS Supporting Information for An automatically updated S-wave model of the upper mantle and the depth extent of azimuthal anisotropy Eric Debayle 1, Fabien Dubuffet 1 and Stéphanie
Data Repository: Seismic and Geodetic Evidence For Extensive, Long-Lived Fault Damage Zones
 DR2009082 Data Repository: Seismic and Geodetic Evidence For Extensive, Long-Lived Fault Damage Zones Fault Zone Trapped Wave Data and Methods Fault zone trapped waves observed for 2 shots and 5 local
Geophysical Journal International
 Geophysical Journal International Geophys. J. Int. (2015) 202, 370 380 GJI Seismology doi: 10.1093/gji/ggv142 Basic data features and results from a spatially dense seismic array on the San Jacinto fault
Imagerie de la Terre profonde avec le bruit sismique. Michel Campillo (ISTERRE, Grenoble)
") Imagerie de la Terre profonde avec le bruit sismique Michel Campillo (ISTERRE, Grenoble) Body waves in the ambient noise: microseisms (Gutenberg, Vinnik..) The origin of the noise in the period band 5-10s:
Imagerie de la Terre profonde avec le bruit sismique Michel Campillo (ISTERRE, Grenoble) Body waves in the ambient noise: microseisms (Gutenberg, Vinnik..) The origin of the noise in the period band 5-10s:
Fault Processes on the Anza section of the San Jacinto Fault
 Fault Processes on the nza section of the San Jacinto Fault J. Steidl (USB), M. Gladwin, R. Gwyther (SIRO ust.), F. Vernon (USD) SUMMRY We propose to instrument the nza slip gap and transition areas of
Theory. Summary. Introduction
 Waveform similarity for quality control of event locations, time picking and moment tensor solutions Fernando Castellanos, University of Alberta. Edmonton, AB. Mirko van der Baan, University of Alberta.
Finite difference elastic modeling of the topography and the weathering layer
 Finite difference elastic modeling of the topography and the weathering layer Saul E. Guevara and Gary F. Margrave ABSTRACT Finite difference 2D elastic modeling is used to study characteristics of the
Correlating seismic wave velocity measurements with mining activities at Williams Mine
 Underground Mining Technology 2017 M Hudyma & Y Potvin (eds) 2017 Australian Centre for Geomechanics, Perth, ISBN 978-0-9924810-7-0 https://papers.acg.uwa.edu.au/p/1710_19_rebuli/ Correlating seismic wave
Long-period Ground Motion Characteristics of the Osaka Sedimentary Basin during the 2011 Great Tohoku Earthquake
 Long-period Ground Motion Characteristics of the Osaka Sedimentary Basin during the 2011 Great Tohoku Earthquake K. Sato, K. Asano & T. Iwata Disaster Prevention Research Institute, Kyoto University, Japan
EARTHQUAKE LOCATIONS INDICATE PLATE BOUNDARIES EARTHQUAKE MECHANISMS SHOW MOTION
 6-1 6: EARTHQUAKE FOCAL MECHANISMS AND PLATE MOTIONS Hebgen Lake, Montana 1959 Ms 7.5 1 Stein & Wysession, 2003 Owens Valley, California 1872 Mw ~7.5 EARTHQUAKE LOCATIONS INDICATE PLATE BOUNDARIES EARTHQUAKE
Evidence of an axial magma chamber beneath the ultraslow spreading Southwest Indian Ridge
 GSA Data Repository 176 1 5 6 7 9 1 11 1 SUPPLEMENTARY MATERIAL FOR: Evidence of an axial magma chamber beneath the ultraslow spreading Southwest Indian Ridge Hanchao Jian 1,, Satish C. Singh *, Yongshun
Supporting Online Material for
 www.sciencemag.org/cgi/content/full/326/5949/112/dc1 Supporting Online Material for Global Surface Wave Tomography Using Seismic Hum Kiwamu Nishida,* Jean-Paul Montagner, Hitoshi Kawakatsu *To whom correspondence
1. A few words about EarthScope and USArray. 3. Tomography using noise and Aki s method
 1. A few words about EarthScope and USArray 2. Surface-wave studies of the crust and mantle 3. Tomography using noise and Aki s method 4. Remarkable images of US crust (and basins)! Unlocking the Secrets
Summary. We present the results of the near-surface characterization for a 3D survey in thrust belt area in Sharjah, United Arab Emirates.
 Near-surface characterization, challenges, and solutions for high-density, high-productivity, Alexander Zarkhidze*, Claudio Strobbia, Abdallah Ibrahim, WesternGeco; Luis Viertel Herrera, Abdulla Al Qadi,
of other regional earthquakes (e.g. Zoback and Zoback, 1980). I also want to find out
. I also want to find out") 4. Focal Mechanism Solutions A way to investigate source properties of the 2001 sequence is to attempt finding well-constrained focal mechanism solutions to determine if they are consistent with those
4. Focal Mechanism Solutions A way to investigate source properties of the 2001 sequence is to attempt finding well-constrained focal mechanism solutions to determine if they are consistent with those
Static Corrections for Seismic Reflection Surveys
 Static Corrections for Seismic Reflection Surveys MIKE COX Volume Editors: Series Editor: Eugene F. Scherrer Roland Chen Eugene F. Scherrer Society of Exploration Geophysicists Tulsa, Oklahoma Contents
Towards Modelling Elastic and Viscoelastic Seismic Wave Propagation in Boreholes
 Towards Modelling Elastic and Viscoelastic Seismic Wave Propagation in Boreholes NA WANG, DONG SHI, BERND MILKEREIT Department of Physics, University of Toronto, Toronto, Canada M5S 1A7 Summary We are
Vollständige Inversion seismischer Wellenfelder - Erderkundung im oberflächennahen Bereich
 Seminar des FA Ultraschallprüfung Vortrag 1 More info about this article: http://www.ndt.net/?id=20944 Vollständige Inversion seismischer Wellenfelder - Erderkundung im oberflächennahen Bereich Thomas
Arthur Frankel, William Stephenson, David Carver, Jack Odum, Robert Williams, and Susan Rhea U.S. Geological Survey
 Probabilistic Seismic Hazard Maps for Seattle: 3D Sedimentary Basin Effects, Nonlinear Site Response, and Uncertainties from Random Velocity Variations Arthur Frankel, William Stephenson, David Carver,
29th Monitoring Research Review: Ground-Based Nuclear Explosion Monitoring Technologies
 MODELING TRAVEL-TIME CORRELATIONS BASED ON SENSITIVITY KERNELS AND CORRELATED VELOCITY ANOMALIES William L. Rodi 1 and Stephen C. Myers 2 Massachusetts Institute of Technology 1 and Lawrence Livermore
Supplementary Figure 1. Distribution of seismic event locations determined using the final 3-D velocity model. We separate the crust-related
 Supplementary Figure 1. Distribution of seismic event locations determined using the final 3-D velocity model. We separate the crust-related seismicity at depths of less than 40 km (panel A) from the deeper
Regional Geodesy. Shimon Wdowinski. MARGINS-RCL Workshop Lithospheric Rupture in the Gulf of California Salton Trough Region. University of Miami
 MARGINS-RCL Workshop Lithospheric Rupture in the Gulf of California Salton Trough Region Regional Geodesy Shimon Wdowinski University of Miami Rowena Lohman, Kim Outerbridge, Tom Rockwell, and Gina Schmalze
Lab 9: Satellite Geodesy (35 points)
") Lab 9: Satellite Geodesy (35 points) Here you will work with GPS Time Series data to explore plate motion and deformation in California. This lab modifies an exercise found here: http://www.unavco.org:8080/cws/pbonucleus/draftresources/sanandreas/
Lab 9: Satellite Geodesy (35 points) Here you will work with GPS Time Series data to explore plate motion and deformation in California. This lab modifies an exercise found here: http://www.unavco.org:8080/cws/pbonucleus/draftresources/sanandreas/
SCEC Community Fault and Velocity Models and how they might contribute to the DCPP seismic hazard assessment. Andreas Plesch Harvard University
 SCEC Community Fault and Velocity Models and how they might contribute to the DCPP seismic hazard assessment Andreas Plesch Harvard University SCEC Unified Structural Representation (USR) The SCEC USR
Data Repository Item
 Data Repository Item 2009003 An abrupt transition from magma-starved to magma-rich rifting in the eastern Black Sea Donna J. Shillington, Caroline L. Scott, Timothy A. Minshull, Rosemary A. Edwards, Peter
Local-scale cross-correlation of seismic noise from the Calico fault experiment
 DOI 10.1007/s11589-014-0074-z RESEARCH PAPER Local-scale cross-correlation of seismic noise from the Calico fault experiment Jian Zhang Peter Gerstoft Received: 27 November 2013 / Accepted: 28 February
DR
 DR2003071 0 0 270 0 30 0 90 0 60 0 120 0 150 0 90 0 180 0 180 0 A) RadialReceiverFunctions B ackazimuth (in degrees relative to north) -135-90 -45 0 45 90 135 180-5.0-2.5 Tangential R eceiver Functions
APPLICATION OF RECEIVER FUNCTION TECHNIQUE TO WESTERN TURKEY
 APPLICATION OF RECEIVER FUNCTION TECHNIQUE TO WESTERN TURKEY Timur TEZEL Supervisor: Takuo SHIBUTANI MEE07169 ABSTRACT In this study I tried to determine the shear wave velocity structure in the crust
State of Stress in Seismic Gaps Along the SanJacinto Fault
 ELEVEN State of Stress in Seismic Gaps Along the SanJacinto Fault Hirao Kanamori and Harold Magistrale NTRODUCTON Data from the Southern California Seismic Network have been extensively used to map spatial
SUPPLEMENTARY INFORMATION
 doi:10.1038/nature11492 Figure S1 Short-period Seismic Energy Release Pattern Imaged by F-net. (a) Locations of broadband seismograph stations in Japanese F-net used for the 0.5-2.0 Hz P wave back-projection
PEAT SEISMOLOGY Lecture 9: Anisotropy, attenuation and anelasticity
 PEAT8002 - SEISMOLOGY Lecture 9: Anisotropy, attenuation and anelasticity Nick Rawlinson Research School of Earth Sciences Australian National University Anisotropy Introduction Most of the theoretical
Fault Specific, Dynamic Rupture Scenarios for Strong Ground Motion Prediction
 Fault Specific, Dynamic Rupture Scenarios for Strong Ground Motion Prediction H. Sekiguchi Disaster Prevention Research Institute, Kyoto University, Japan Blank Line 9 pt Y. Kase Active Fault and Earthquake
Earthquake patterns in the Flinders Ranges - Temporary network , preliminary results
 Earthquake patterns in the Flinders Ranges - Temporary network 2003-2006, preliminary results Objectives David Love 1, Phil Cummins 2, Natalie Balfour 3 1 Primary Industries and Resources South Australia
Effects of Surface Geology on Seismic Motion
 4 th IASPEI / IAEE International Symposium: Effects of Surface Geology on Seismic Motion August 23 26, 2011 University of California Santa Barbara VELOCITY STRUCTURE INVERSIONS FROM HORIZONTAL TO VERTICAL
Seismic Reflection Views of the 1994 Northridge Earthquake Hypocentral Region Using Aftershock Data and Imaging Techniques
 Seismic Reflection Views of the 1994 Northridge Earthquake Hypocentral Region Using Aftershock Data and Imaging Techniques SERGIO CHÁVEZ-PÉREZ and JOHN N. LOUIE SEISMOLOGICAL LABORATORY/174, MACKAY SCHOOL
Fracture characterization from scattered energy: A case study
 Fracture characterization from scattered energy: A case study Samantha Grandi K., Sung Yuh, Mark E. Willis, and M. Nafi Toksöz Earth Resources Laboratory, MIT. Cambridge, MA. Total Exploration & Production.
JOINT ACCURATE TIME-FREQUENCY AND HIGH-RESOLUTION ARRAY ANALYSIS, A TOOL FOR SITE EFFECTS ESTIMATION?
 Third International Symposium on the Effects of Surface Geology on Seismic Motion Grenoble, France, 30 August - 1 September 2006 Paper Number: 152 JOINT ACCURATE TIME-FREQUENCY AND HIGH-RESOLUTION ARRAY
Teleseismic waveform modelling of the 2008 Leonidio event
 The 6 January 2008 (Mw6.2) Leonidio (southern Greece) intermediate depth earthquake: teleseismic body wave modelling Anastasia Kiratzi and Christoforos Benetatos Department of Geophysics, Aristotle University
Regional 3D velocity structure
 Seismic imaging: Regional 3D velocity structure 3 Seismic anisotropy courtesy of Ed Garnero This is birefringence: tells us about the preferential orientation of minerals 1 Anisotropy beneath the East
Kinematics of the Southern California Fault System Constrained by GPS Measurements
 Title Page Kinematics of the Southern California Fault System Constrained by GPS Measurements Brendan Meade and Bradford Hager Three basic questions Large historical earthquakes One basic question How
Effect of an outer-rise earthquake on seismic cycle of large interplate earthquakes estimated from an instability model based on friction mechanics
 Effect of an outer-rise earthquake on seismic cycle of large interplate earthquakes estimated from an instability model based on friction mechanics Naoyuki Kato (1) and Tomowo Hirasawa (2) (1) Geological
Downloaded 07/03/14 to Redistribution subject to SEG license or copyright; see Terms of Use at
 Downloaded 07/03/14 to 129.237.143.21. Redistribution subject to SEG license or copyright; see Terms of Use at http://library.seg.org/ Rayleigh-wave diffractions due to a void in the layered half space
FOCAL MECHANISM DETERMINATION USING WAVEFORM DATA FROM A BROADBAND STATION IN THE PHILIPPINES
 FOCAL MECHANISM DETERMINATION USING WAVEFORM DATA FROM A BROADBAND STATION IN THE PHILIPPINES Vilma Castillejos Hernandez Supervisor: Tatsuhiko Hara MEE10508 ABSTRACT We performed time domain moment tensor
Global geophysics and wave propagation
 Global geophysics and wave propagation Reading: Fowler p76 83 Remote sensing Geophysical methods Seismology Gravity and bathymetry Magnetics Heat flow Seismology: Directly samples the physical properties
Data Repository Item For: Kinematics and geometry of active detachment faulting beneath the TAG hydrothermal field on the Mid-Atlantic Ridge
 GSA Data Repository Item: 2007183 Data Repository Item For: Kinematics and geometry of active detachment faulting beneath the TAG hydrothermal field on the Mid-Atlantic Ridge Brian J. demartin 1*, Robert
On the Limitation of Receiver Functions Method: Beyond Conventional Assumptions & Advanced Inversion Techniques
 On the Limitation of Receiver Functions Method: Beyond Conventional Assumptions & Advanced Inversion Techniques Hrvoje Tkalčić RSES, ANU Acknowledgment: RSES Seismology & Mathematical Geophysics Group
G 3. AN ELECTRONIC JOURNAL OF THE EARTH SCIENCES Published by AGU and the Geochemical Society
 Geosystems G 3 AN ELECTRONIC JOURNAL OF THE EARTH SCIENCES Published by AGU and the Geochemical Society Article Volume 8, Number 8 21 August 2007 Q08010, doi:10.1029/2007gc001655 ISSN: 1525-2027 Click
Seismic Noise Correlations. - RL Weaver, U Illinois, Physics
 Seismic Noise Correlations - RL Weaver, U Illinois, Physics Karinworkshop May 2011 Over the last several years, Seismology has focused growing attention on Ambient Seismic Noise and its Correlations. Citation
= (G T G) 1 G T d. m L2
 1 G T d. m L2") The importance of the Vp/Vs ratio in determining the error propagation and the resolution in linear AVA inversion M. Aleardi, A. Mazzotti Earth Sciences Department, University of Pisa, Italy Introduction.
The importance of the Vp/Vs ratio in determining the error propagation and the resolution in linear AVA inversion M. Aleardi, A. Mazzotti Earth Sciences Department, University of Pisa, Italy Introduction.
GPS Strain & Earthquakes Unit 5: 2014 South Napa earthquake GPS strain analysis student exercise
 GPS Strain & Earthquakes Unit 5: 2014 South Napa earthquake GPS strain analysis student exercise Strain Analysis Introduction Name: The earthquake cycle can be viewed as a process of slow strain accumulation
Tomography of the 2011 Iwaki earthquake (M 7.0) and Fukushima
 and Fukushima") 1 2 3 Auxiliary materials for Tomography of the 2011 Iwaki earthquake (M 7.0) and Fukushima nuclear power plant area 4 5 6 7 8 9 Ping Tong 1,2, Dapeng Zhao 1 and Dinghui Yang 2 [1] {Department of Geophysics,
1 2 3 Auxiliary materials for Tomography of the 2011 Iwaki earthquake (M 7.0) and Fukushima nuclear power plant area 4 5 6 7 8 9 Ping Tong 1,2, Dapeng Zhao 1 and Dinghui Yang 2 [1] {Department of Geophysics,
27th Seismic Research Review: Ground-Based Nuclear Explosion Monitoring Technologies
 SEISMIC SOURCE AND PATH CALIBRATION IN THE KOREAN PENINSULA, YELLOW SEA, AND NORTHEAST CHINA Robert B. Herrmann 1, Young-Soo Jeon 1, William R. Walter 2, and Michael E. Pasyanos 2 Saint Louis University
Seismic and aseismic processes in elastodynamic simulations of spontaneous fault slip
 Seismic and aseismic processes in elastodynamic simulations of spontaneous fault slip Most earthquake simulations study either one large seismic event with full inertial effects or long-term slip history
Retrieving impulse response function amplitudes from the
 submitted to Geophys. J. Int. 1 Retrieving impulse response function amplitudes from the ambient seismic field 3 Loïc Viens 1, Marine Denolle 1, Hiroe Miyake,3, Shin ichi Sakai and Shigeki Nakagawa 1 Earth
Microtremor survey methods in the Tamar Valley, Launceston, Tasmania: Evidence of 2D resonance from microtremor observations.
 Microtremor survey methods in the Tamar Valley, Launceston, Tasmania: Evidence of 2D resonance from microtremor observations. Maxime Claprood 1, Michael W. Asten 2 1. Corresponding author. PhD candidate,
Part 2 - Engineering Characterization of Earthquakes and Seismic Hazard. Earthquake Environment
 Part 2 - Engineering Characterization of Earthquakes and Seismic Hazard Ultimately what we want is a seismic intensity measure that will allow us to quantify effect of an earthquake on a structure. S a
ON NEAR-FIELD GROUND MOTIONS OF NORMAL AND REVERSE FAULTS FROM VIEWPOINT OF DYNAMIC RUPTURE MODEL
 1 Best Practices in Physics-based Fault Rupture Models for Seismic Hazard Assessment of Nuclear ON NEAR-FIELD GROUND MOTIONS OF NORMAL AND REVERSE FAULTS FROM VIEWPOINT OF DYNAMIC RUPTURE MODEL Hideo AOCHI
Elastic full waveform inversion for near surface imaging in CMP domain Zhiyang Liu*, Jie Zhang, University of Science and Technology of China (USTC)
") Elastic full waveform inversion for near surface imaging in CMP domain Zhiyang Liu*, Jie Zhang, University of Science and Technology of China (USTC) Summary We develop an elastic full waveform inversion
Elastic full waveform inversion for near surface imaging in CMP domain Zhiyang Liu*, Jie Zhang, University of Science and Technology of China (USTC) Summary We develop an elastic full waveform inversion
Geophysical Journal International
 Geophysical Journal International Geophys. J. Int. (2017) 210, 819 832 Advance Access publication 2017 May 5 GJI Seismology doi: 10.1093/gji/ggx191 Internal structure of the San Jacinto fault zone at Blackburn
ERTH2020 Introduction to Geophysics The Seismic Method. 1. Basic Concepts in Seismology. 1.1 Seismic Wave Types
 ERTH2020 Introduction to Geophysics The Seismic Method 1. Basic Concepts in Seismology 1.1 Seismic Wave Types Existence of different wave types The existence of different seismic wave types can be understood
Seismic tests at Southern Ute Nation coal fire site
 Seismic tests at Southern Ute Nation coal fire site Sjoerd de Ridder and Seth S. Haines ABSTRACT We conducted a near surface seismic test at the Southern Ute Nation coal fire site near Durango, CO. The
Ground Motion Prediction Equations in the San Jacinto Fault Zone. Significant Effects of Rupture Directivity and Fault Zone Amplification
 Ground Motion Prediction Equations in the San Jacinto Fault Zone Significant Effects of Rupture Directivity and Fault Zone Amplification I. Kurzon 1, F.L.Vernon 1, Y. Ben-Zion 2 and G. Atkinson 3 1 University
Lateral variation of the D 00 discontinuity beneath the Cocos Plate
 GEOPHYSICAL RESEARCH LETTERS, VOL. 31, L15612, doi:10.1029/2004gl020300, 2004 Lateral variation of the D 00 discontinuity beneath the Cocos Plate T. Lay Earth Sciences Department, University of California,
The stratification of seismic azimuthal anisotropy in the western US
 The stratification of seismic azimuthal anisotropy in the western US Fan-Chi Lin 1, Michael H. Ritzwoller 1, Yingjie Yang 1, Morgan P. Moschetti 1, and Matthew J. Fouch 2 1 - Center for Imaging the Earth's
Section Forces Within Earth. 8 th Grade Earth & Space Science - Class Notes
 Section 19.1 - Forces Within Earth 8 th Grade Earth & Space Science - Class Notes Stress and Strain Stress - is the total force acting on crustal rocks per unit of area (cause) Strain deformation of materials
Earthquake Stress Drops in Southern California
 Earthquake Stress Drops in Southern California Peter Shearer IGPP/SIO/U.C. San Diego September 11, 2009 Earthquake Research Institute Lots of data for big earthquakes (rupture dimensions, slip history,
Chapter 3 Minimum 1-D Velocity Model: Using joint determination of hypocenters and velocity 3.1 Introduction
 Chapter 3 Minimum 1-D Velocity Model: Using joint determination of hypocenters and velocity 3.1 Introduction This chapter deals with the estimation of a new 1-D velocity model in the Kumaon- Garhwal Himalaya
ANGLE-DEPENDENT TOMOSTATICS. Abstract
 ANGLE-DEPENDENT TOMOSTATICS Lindsay M. Mayer, Kansas Geological Survey, University of Kansas, Lawrence, KS Richard D. Miller, Kansas Geological Survey, University of Kansas, Lawrence, KS Julian Ivanov,
THREE-DIMENSIONAL FINITE DIFFERENCE SIMULATION OF LONG-PERIOD GROUND MOTION IN THE KANTO PLAIN, JAPAN
 THREE-DIMENSIONAL FINITE DIFFERENCE SIMULATION OF LONG-PERIOD GROUND MOTION IN THE KANTO PLAIN, JAPAN Nobuyuki YAMADA 1 And Hiroaki YAMANAKA 2 SUMMARY This study tried to simulate the long-period earthquake
7.2.1 Seismic waves. Waves in a mass- spring system
 7..1 Seismic waves Waves in a mass- spring system Acoustic waves in a liquid or gas Seismic waves in a solid Surface waves Wavefronts, rays and geometrical attenuation Amplitude and energy Waves in a mass-
Estimating shear-waves velocity structure by using array methods (FK and SPAC) and inversion of ellipticity curves at a site in south of Tehran
 and inversion of ellipticity curves at a site in south of Tehran") Estimating shear-waves velocity structure by using array methods (FK and SPAC) and inversion of ellipticity curves at a site in south of Tehran E. Shabani 1, C. Cornou 2, E. Haghshenas 3, M. Wathelet 2,
Estimating shear-waves velocity structure by using array methods (FK and SPAC) and inversion of ellipticity curves at a site in south of Tehran E. Shabani 1, C. Cornou 2, E. Haghshenas 3, M. Wathelet 2,
B048 Seabed Properties Derived from Ambient Noise
 B048 Seabed Properties Derived from Ambient Noise E. Muyzert* (Schlumberger Cambridge Research) SUMMARY An extensive study of low-frequency ambient noise wavefields in the seabed has resulted in a new