The stratification of seismic azimuthal anisotropy in the western US
|
|
|
- Homer Payne
- 5 years ago
- Views:
Transcription
1 The stratification of seismic azimuthal anisotropy in the western US Fan-Chi Lin 1, Michael H. Ritzwoller 1, Yingjie Yang 1, Morgan P. Moschetti 1, and Matthew J. Fouch Center for Imaging the Earth's Interior, Department of Physics, University of Colorado at Boulder, Boulder, CO 2 - School of Earth and Space Exploration, Arizona State University, Tempe, AZ One-sentence summaries Innovations in the observation of broad-band surface waves allow the inference of 3D azimuthal anisotropy within the crust, lithosphere, and asthenosphere beneath the western US at geological length-scales, which provides new constraints on crustal and mantle deformation, crust-mantle coupling, and sub-lithospheric mantle flow. Abstract Short to intermediate period (12 to 54 s) Rayleigh wave phase travel times and SKS shear wave splitting measurements observed with the EarthScope USArray in the western US are used to estimate the 3D distribution of azimuthal anisotropy. The inferred stratified model of anisotropy consists of a middle-to-lower crustal layer, a 80 km thick uppermost mantle layer, and a 200 km thick smoothly varying asthenospheric mantle layer. The pattern of crustal anisotropy relates well to major geological provinces but is uncorrelated with anisotropy in the uppermost mantle and asthenosphere. The fast axis directions in the underlying asthenosphere separate coherently into three broad tectonic regions: the tectonically active western US including the Basin and Range Province, the Columbia Basin, and much of California, the more tectonically stable regions east of 113 E longitude including the Colorado Plateau, and the Cascadia subduction system. The inferred stratification of anisotropy suggests complex and highly variable crust-mantle mechanical
2 coupling in the western US. Observations of complex regional azimuthal anisotropy are therefore dominated by relatively shallow, regional-scale tectonic processes, and the more homogeneous deeper mantle anisotropy pattern reveals a mantle flow field controlled by a combination of North American plate motion and the subduction of the Juan de Fuca / Farallon slab system. Knowledge of the stratification of anisotropy in the crust and uppermost mantle is critical to an understanding of strain partitioning within and at the base of the continental lithosphere, which in turn would illuminate the dynamical coupling within and at the base of tectonic plates. Seismic anisotropy within the upper mantle appears ubiquitously, but is correlated with diverse dynamical causes. In some continental regions, anisotropy inferred by shear wave splitting measurements is correlated with surface geological features, which may provide evidence that anisotropy is predominantly a lithospheric phenomenon (Silver, 1996) and may be frozen in at the time of formation or subsequent lithospheric deformation. In other regions, anisotropy appears more closely aligned with absolute plate motions (Vinnik et al. 1992), suggesting that anisotropic fabric reflects sublithospheric flows and may still be evolving. Many regions exist where a combination of lithospheric and asthenospheric fabric best explains observed anisotropy (e.g., Fouch et al., 2000). It has not been possible, however, to produce an integrated model of anisotropy of the lithosphere and the underlying asthenosphere (Marone and Romanowicz, 2007), preferably derived from more than one type of observable. Because shear wave splitting provides a path-integrated measurement beneath seismic receivers, the depth resolution of splitting measurements is poor. Surface waves provide complementary information about azimuthal anisotropy, but teleseismic observations at periods that uniquely constrain the crust (<20 sec) are rare and shear wave splitting measurements and surface wave models of azimuthal
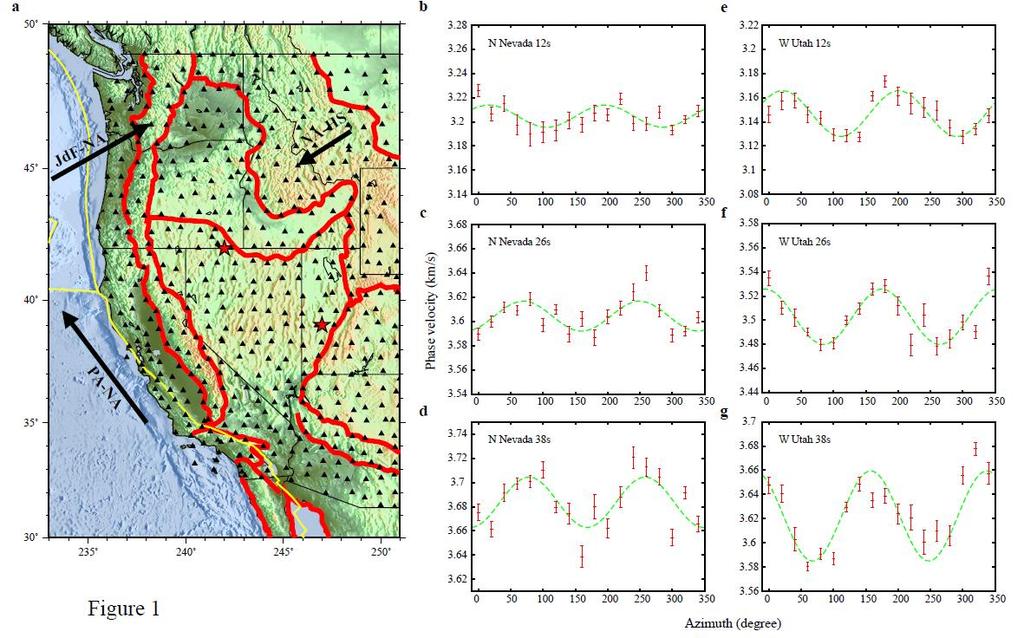
3 anisotropy frequently do not agree well (Montagner et al., 2000; Debayle et al., 2005). Recent advances in surface wave methodology, particularly the development of the method of ambient noise tomography (Sabra et al., 2005; Shapiro et al., 2005), improvements in earthquake tomography (Yang and Forsyth, 2006; Yang et al., 2008), and the ongoing deployment of the USArray Transportable Array (TA) stations (Fig 1a) in the western US, have dramatically improved information recovered about anisotropy in the shallow earth and allow for the development of an integrated high resolution model of azimuthal anisotropy in the crust, lithospheric mantle, and underlying asthenosphere. In this study, we obtain Rayleigh wave phase travel time measurements at periods from 12 to 54 sec to infer the azimuthal anisotropy in the crust and uppermost mantle and, combined with SKS splitting measurements (West et al. 2009; Fouch and West, in prep., 2010), apply new constraints on the azimuthal anisotropy within the asthenospheric mantle. We measure Rayleigh wave travel times using ambient noise (Bensen et al., 2007) at periods from 12 to 46 sec using waveforms observed at 611 TA stations that operated between Oct 2004 and Oct 2008 (Lin et at., 2008). Similar measurements from 24 to 54 sec period are obtained from 574 teleseismic earthquakes with Ms 5.0 that occurred between Jan 2006 and Jan The principal tomographic method used, called Eikonal tomography (Lin et al., 2009), involves empirical phase front tracking (Pollitz, 2008) to estimate azimuthally dependent phase velocity and its uncertainty on a 0.2 spatial grid (Fig 1b-g) by calculating the gradient across each phase travel time surface. At each location, velocity measurements from ambient noise and earthquake tomography are averaged in the period band of overlap. Eikonal tomography takes advantage of the contemporaneous array of stations and complements traditional surface wave tomography in several ways: there is no explicit regularization, it accounts for ray bending, it generates error estimates in the inferred
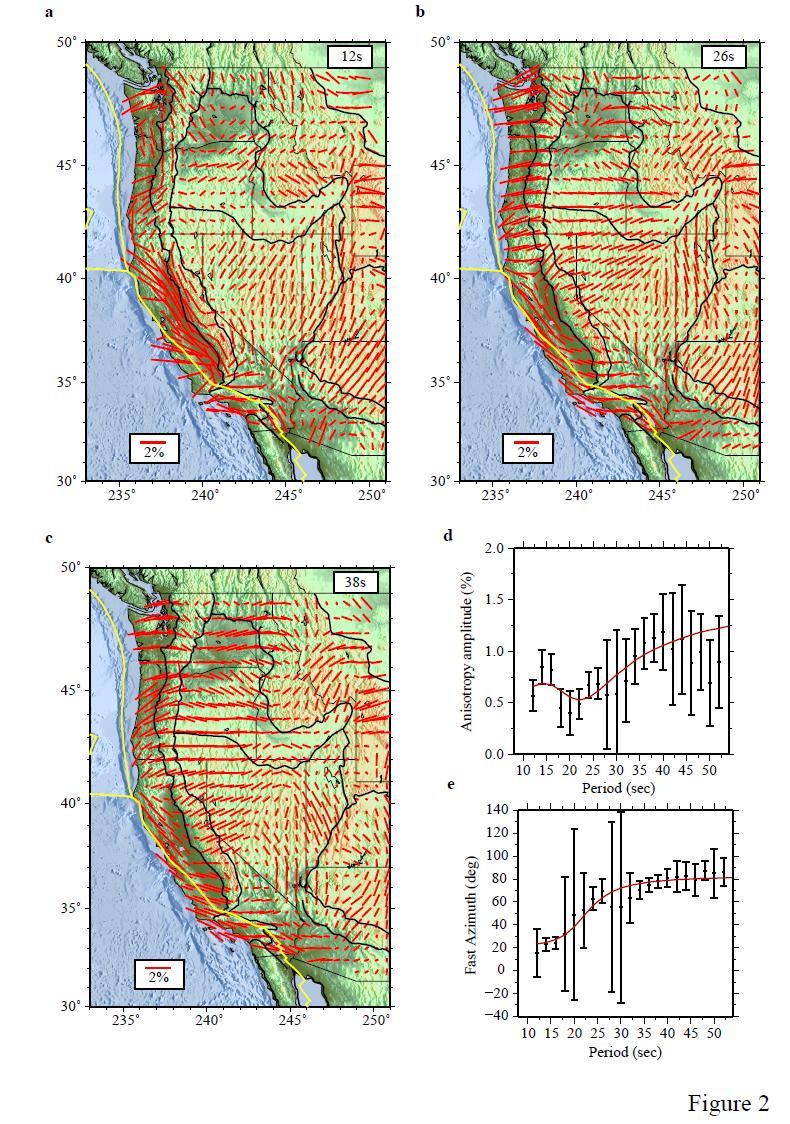
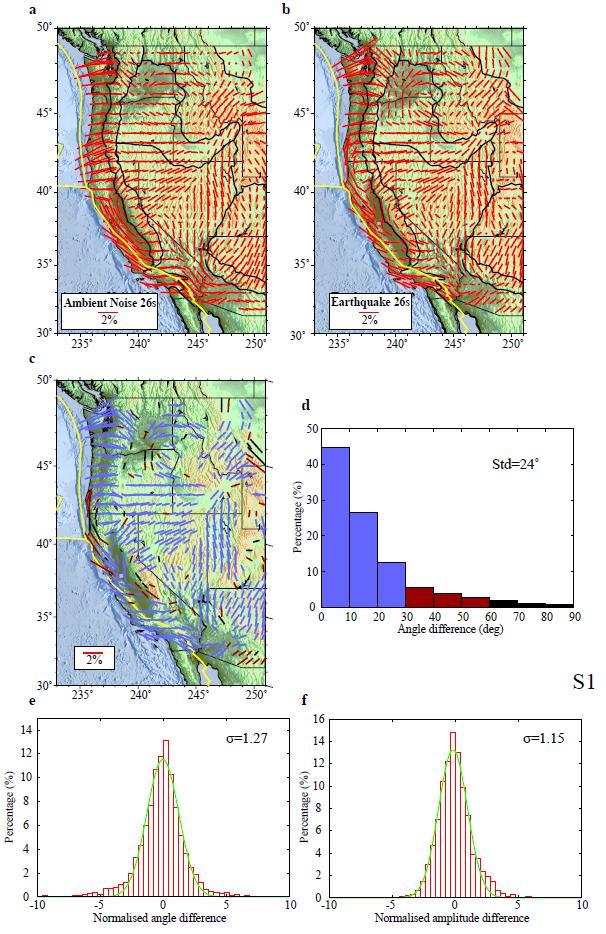
4 dispersion maps for both isotropic and anisotropic parameters, and the azimuthal anisotropy signal can be visually and numerically inspected at each spatial node. Based on observations of the 180 azimuthal periodicity of Rayleigh wave speeds (Fig. 1b-g), we adopt the 2-psi functional form for a weakly anisotropic medium (Smith and Dahlen, 1973) and parameterize the observed azimuthal anisotropy at each period and location with a fast direction and anisotropy amplitude. The robustness of the observed anisotropy patterns as well as estimates of their uncertainty (Note N1) is verified by comparing the independent results obtained from the ambient noise and earthquake datasets (Fig. S1). Because more earthquake measurements are accepted at long periods and more ambient noise measurements at short periods, averaging effectively weights up earthquake measurements at long periods and ambient noise at short periods. At periods above 54 sec, finite frequency effects degrade the reliability of azimuthal anisotropy information from surface waves (Bodin & Maupin 2008). Fig. 2a-c summarizes the observations of Rayleigh wave azimuthal anisotropy at periods of 12, 26, and 38 sec, which are most sensitive to anisotropy in the middle crust, lower crust and uppermost mantle, and uppermost mantle, respectively. Clear differences in the patterns of anisotropy between 12 and 38 sec period require the stratification of anisotropy between the crust and uppermost mantle. Fig 2d-e exemplifies the period dependence of the fast azimuths and anisotropy amplitudes, which we refer to as anisotropic dispersion curves, for a point in northern Nevada (star in Fig 1a) where the fast directions at short (<18 s) and long ( >32 s) periods are stable but differ from one another. Based on these anisotropic dispersion curves at each location, we invert for a 3D azimuthally anisotropic shear velocity model in the crust and uppermost mantle. First, we follow the method of Moschetti et al. (2010) to construct a reference isotropic
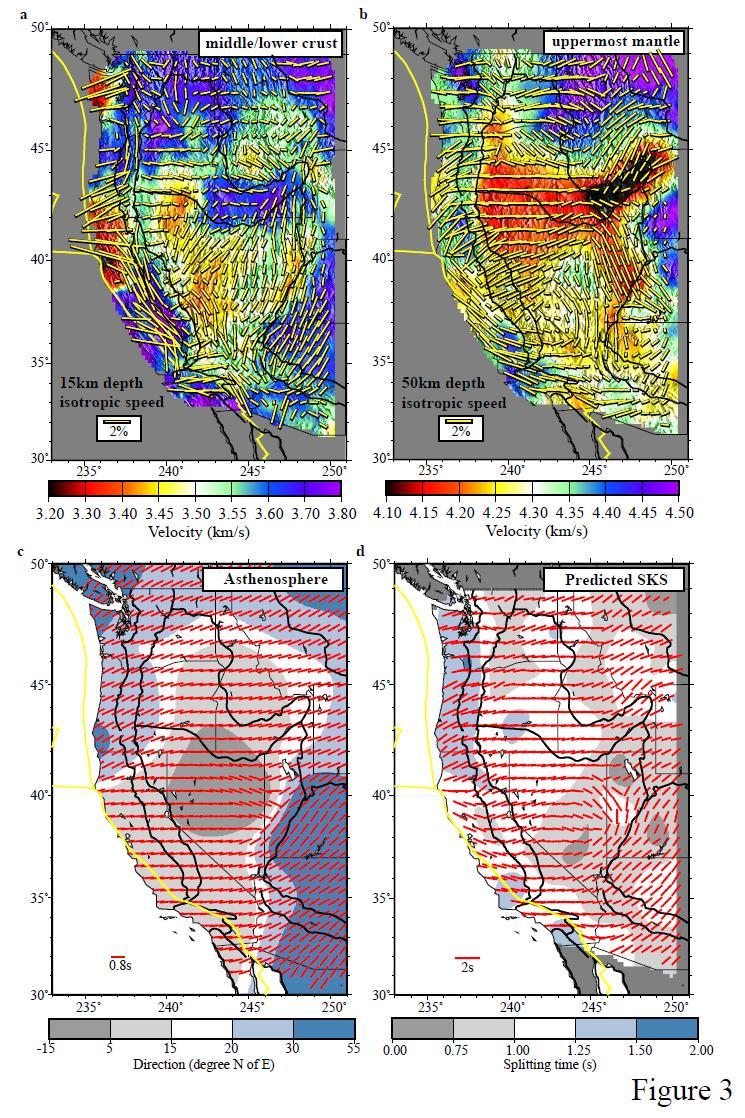
5 model represented with four crustal layers and five B-splines in the upper mantle. Shear wave anomalies in the isotropic model (e.g., Fig. 3a-b) correspond to major geological features and are consistent with a previous study (Yang et al. 2008). Second, we introduce azimuthal anisotropy perturbations to the isotropic model to fit the anisotropic dispersion curves observed at each location. Most observed anisotropic dispersion curves are well fit by a two-layer model (Fig2d-e; Fig. S2) in which azimuthal anisotropy is introduced in the middle-to-lower crust and the uppermost mantle roughly approximating the lithosphere. Anisotropy in each layer is vertically constant but laterally variable. The depth extent of the uppermost mantle layer is not constrained beneath 100 km depth where the surface wave data lose their sensitivity. The crustal and uppermost mantle anisotropic models are summarized in Fig 3a-b and the estimated model uncertainties are presented in Fig. S3. By comparing model predicted and observed SKS splitting measurements within the western US, we can constrain the thickness of the uppermost mantle layer as well as azimuthal anisotropy in the underlying asthenospheric mantle. We use the method described by Rumpker & Silver (1998) to synthesize the azimuthally averaged SKS apparent splitting parameters from our model and calculate the misfit between the model predicted and observed SKS splitting measurements (Supplementary Material SM1). To avoid over parameterization, we assume laterally constant uppermost mantle thickness and asthenospheric splitting strength and only allow smooth lateral variations of asthenospheric fast directions (Note N2). The misfit minimizes when the uppermost mantle layer extends to a depth of 80 km below the Moho, the splitting time of the asthenospheric layer is 0.8 s, and the fast directions of the layer as shown in Fig. 3c. Uncertainties in the asthenospheric fast axis directions average ~6 across the study region and are shown in Fig S4. This results in our preferred or final three-layer anisotropy model,
6 where Fig. 3d summarizes the predicted SKS apparent splitting parameters and Fig. 4a-c present comparisons with the observations. Misfit statistics to the surface wave anisotropic dispersion curves and to the SKS data for our final model (Model C) and two others (Model A: a two-layer crust/uppermost mantle model in which the upper mantle layer extends to 220 km beneath the Moho; Model B: a three-layer model in which the asthenospheric layer is laterally invariant) are presented in Table 1. A 64% variance reduction to the SKS observation is achieved relative to an isotropic model by our preferred model. Differences in fast directions and split times are summarized with histograms in Fig. 4b-c, with the standard deviation of the directional difference equal to 18, in good agreement with differences expected from model and data uncertainties. About 80% of the model predictions agree with the SKS fast directions by better than 20º, although the final model under-predicts split times by 0.25 sec, on average. To contrast with Fig. 4, comparison between the SKS observations and predictions from Models A and B are shown in Figs. S5 and S6. The crustal and uppermost mantle anisotropy layers, which are constrained exclusively by the surface wave data and possess a lateral resolution of ~200 km (Lin et al. 2009), provides information about the spatial variability of anisotropy on scales similar to the major geological and tectonic features across this region. Significant variations in fast directions are observed both in the crust and uppermost mantle (Fig. 3a-b) with a particularly strong coherence between the crustal anisotropy pattern, isotropic structures, and the major geological provinces. This includes N-S fast directions across nearly the entire Basin and Range province coincident with the region of strong crustal radial anisotropy (Moschetti et al. 2010), NW-SE fast directions within the Central Valley of California, E-W fast directions within the Cascadia forearc roughly parallel to the subduction direction of the Juan de Fuca Plate, NE-SW fast directions within the Colorado
7 Plateau, E-W fast directions within the High Lava Plains, and weak anisotropy within the Snake River Plain. Spatial patterns of anisotropy within the uppermost mantle, on the other hand, are neither well correlated with surface geological features nor with the crustal anisotropy pattern (Fig. 4d). The directional correlation coefficient between the crustal and uppermost mantle fast axis distributions is found to be r = 0.12, and a Monte Carlo simulation shows that 1 out of 4 random directional distribution pairs correlate at least as well (Supplementary Materials SM2). Within the uppermost mantle, strong anisotropy is observed both near the western and eastern boundaries of the Great Basin, although the fast directions are rotated almost 90. Near the western boundary of the Great Basin, the east-west oriented fast directions are coherent across a broader region, which extends northward into the High Lava Plains province. As with the eastern boundary, the strong anisotropy coincides with slow isotropic anomalies in the uppermost mantle. Near the western plate boundaries, anisotropic fast directions change abruptly near the Mendocino Triple Junction, consistent with a change in the principal stress direction from a strike-slip related system to the south to a subduction related system to the north. Similar to crustal anisotropy, weak uppermost mantle anisotropy is observed beneath the Snake River Plain. The average strength of uppermost mantle anisotropy across the whole study area is ~1.3% which is slightly stronger than ~1.1% anisotropy observed in the crust. The strength of anisotropy, however, probably is underestimated due to the diminishment of anisotropy amplitudes near regions where fast directions change abruptly laterally. In contrast with the patterns of anisotropy within the crust and uppermost mantle that vary on geological scales, the azimuthal anisotropy pattern observed within the deeper layer (Fig. 3c) is probably attributable to large-scale asthenospheric flow beneath most regions of the western US.
8 By assuming an anisotropic strength of 2% in this layer, the 0.8 sec splitting time implies a thickness of about 200 km beneath the uppermost mantle layer (i.e., below ~110 km depth). The fast directions of the observed asthenospheric anisotropy, although smoothly varying, can be approximately separated into three major tectonic regions. In the east, the fast directions (blue shaded in Fig. 3c) average about 32 (±12 ) N of E, matching the direction of absolute plate motion (33 S of W, Gripp & Gordon 2002) beneath the North American craton. In the west, nearly E-W fast directions are observed in most of the tectonically active western US, which may be induced by a combination of absolute plate motions and the geodynamic effect of the previously subducted Farallon slab (Silver & Holt 2002; Becker et al. 2006), as well as rapid eastward inflow of Pacific asthenosphere in the gap between the Mendocino and Rivera Triple Junctions where subduction has been eradicated. North of the Mendocino Triple Junction within Cascadia, a distinct region with fast directions nearly parallel to the NE-directed subduction of Juan de Fuca plate (Fig. 1a) is observed. Our final 3D model of stratified azimuthal anisotropy reconciles surface wave observations and SKS splitting measurements to within expectations based on data uncertainties and model resolution. This model of anisotropy of the crust, uppermost mantle, and asthenosphere provides new constraints on strain partitioning within the crust and upper mantle and on geodynamical models of deformation within and beneath the lithosphere. Anisotropic features within the crust correlate well with large-scale geological provinces. The disagreement between the patterns of anisotropy in the crust and uppermost mantle argues against a model of simple mechanical coupling between these layers, which has been suggested for regions of thicker lithosphere (Holt 2000) and provides a challenge for lithospheric modeling. In the uppermost mantle, although anisotropy in regions associated with fast isotropic wave speeds (i.e., cold regions) may be
9 "frozen-in", anisotropy in regions with slow isotropic wave speeds may be evolving with the current sub-crustal deformation. A weak directional agreement is observed between the uppermost mantle and asthenospheric layers (Fig. 4e), where uppermost mantle and asthenospheric fast axis directions align predominantly in regions of slow (i.e., hot) upper mantle where the lithosphere is thinnest: in the western Basin and Range, the High Lava Plains, and in Cascadia. In particular, correlations between strong anisotropy and slow upper mantle isotropic wave speed anomalies are observed near the High Lava Plains where large SKS splitting times exist (Long et al. 2009), and in western Utah where an enigmatic N-S SKS fast polarization pattern has been imaged (Savage & Sheehan 2000; Zandt & Humphreys 2008; West et al, 2009). As expected based on our model parameterization in which smaller (<300 km) lateral variations in asthenospheric anisotropy are not resolved, zones of sharp reductions in shear wave splitting times, such as is found in the central Great Basin and interpreted as a ~150-km wide zone of mantle downwelling (West et al. 2009), do not appear in our model. Fast directions parallel to the San Andreas Fault in the uppermost mantle near the North American plate boundary can be explained by assuming that the olivine fast axis [100] aligns with the deformation direction induced by simple shear (Zhang & Karato 1995). E-W asthenospheric fast directions in this area suggest that plate interaction deformation does not penetrate significantly at asthenospheric depths. This is consistent with previous SKS splitting studies near the San Andreas Fault, where azimuthally dependent apparent splitting parameters were studied (Savage & Silver 1993; Ozalaybey & Savage 1995). Numerous studies have used shear wave splitting measurements to infer sub-lithospheric flow beneath the western US (e.g. see Savage 2002 for review; Sheehan et al. 1997; Savage and Sheehan, 2000; Silver & Holt 2002; Becker et al. 2006; Zandt & Humphreys 2008; West et al, 2009). The spatial pattern of broad-scale asthenospheric
10 anisotropy in our final model reconciles earlier studies that have suggested that sub-lithospheric anisotropy is induced by absolute plate motions (Marone & Romanowicz 2007) and the subduction of the Juan de Fuca and Farallon slabs (Silver & Holt 2002; Becker et al. 2006; Zandt & Humphreys 2008). Acknowledgments Instruments [data] used in this study were made available through EarthScope ( EAR ), supported by the National Science Foundation. The facilities of the IRIS Data Management System, and specifically the IRIS Data Management Center, were used for access to waveform and metadata required in this study. The IRIS DMS is funded through the National Science Foundation and specifically the GEO Directorate through the Instrumentation and Facilities Program of the National Science Foundation under Cooperative Agreement EAR This work has been supported by NSF grants EAR and EAR References Silver, P.G. Seismic anisotropy beneath the continents: Probing the depths of geology, Annu. Rev. Earth Planet. Sci. 24, (1996). Vinnik, L.P., Makeyeva, L.I., Milev, A., & Ushenko, A.Y. Global patterns of azimuthal anisotropy and deformations in the continental mantle, Geophys. J. Int. 111, (1992). Fouch, M.J., Fischer, K.M., Wysession, M.E., & Clarke, T.J. Shear wave splitting, continental keels, and patterns of mantle flow, J. Geophys. Res. 105, (2000).
11 Marone, F. & Romanowicz, B. The depth distribution of azimuthal anisotropy in the continental upper mantle, Nature 447, (2007). Montagner, J.-P., Griot-Pommera, D.-A., & Lave, J. How to reltae body wave and surface wave anisotropy?, J. Geophys. Res. 105, (2000). Debayle, E., Kennett, B.L.N., & Priestley, K. Global azimuthal seismic anisotropy and the unique plate-motion deformation of Australia, Science 433, (2005). Sabra, K. G., Gerstoft, P., Roux, P., Kuperman, W. A. & Fehler, M. C. Surface wave tomography from microseisms in Southern California. Geophys. Res. Lett. 32, L14311 (2005). Shapiro, N. M., Campillo, M., Stehly, L. & Ritzwoller, M. H. High-resolution surface-wave tomography from ambient seismic noise. Science 307, (2005). Yang, Y. & Forsyth, D. W. Rayleigh wave phase velocities, small-scale convection, and azimuthal anisotropy beneath southern California. Journal of Geophysical Research-Solid Earth 111, B07306 (2006). Yang, Y., Ritzwoller, M. H., Lin, F. -., Moschetti, M. P. & Shapiro, N. M. Structure of the crust and uppermost mantle beneath the western United States revealed by ambient noise and earthquake tomography. J. Geophys. Res. -Solid Earth 113, B12310 (2008). West, J. D., Fouch, M. J., Roth, J. B. & Elkins-Tanton, L. T. Vertical mantle flow associated with a lithospheric drip beneath the Great Basin. Nat. Geosci. 2, (2009). Fouch, M. J. & West, J. D. The mantle flow field beneath the western United States, in preparation.
12 Bensen, G. D. et al. Processing seismic ambient noise data to obtain reliable broad-band surface wave dispersion measurements. Geophysical Journal International 169, (2007). Lin, F. C., Moschetti, M. P. & Ritzwoller, M. H. Surface wave tomography of the western United States from ambient seismic noise: Rayleigh and Love wave phase velocity maps. Geophysical Journal International 173, (2008). Lin, F., Ritzwoller, M. H. & Snieder, R. Eikonal tomography: surface wave tomography by phase front tracking across a regional broad-band seismic array. Geophys. J. Int. 177, (2009). Pollitz, F. F. Observations and interpretation of fundamental mode Rayleigh wavefields recorded by the Transportable Array (USArray). J. Geophys. Res. -Solid Earth 113, B10311 (2008). Smith, M. L. & Dahlen, F. A. Azimuthal Dependence of Love and Rayleigh-Wave Propagation in a Slightly Anisotropic Medium. Journal of Geophysical Research 78, (1973). Bodin, T. & Maupin, V. Resolution potential of surface wave phase velocity measurements at small arrays. Geophys. J. Int. 172, (2008). Moschetti, M. P., Ritzwoller, M. H., & Lin, F.-C. Seismic evidence for widespread deep crustal deformation caused by extension in the western US. Nature, in press (2010). Rumpker, G. & Silver, P. G. Apparent shear-wave splitting parameters in the presence of vertically varying anisotropy. Geophysical Journal International 135, (1998).
13 Gripp, A. E. & Gordon, R. G. Young tracks of hotspots and current plate velocities. Geophys. J. Int. 150, (2002). Silver, P. & Holt, W. (2002). The mantle flow field beneath western North America. Science, 295(5557), Becker, T. W., Schulte-Pelkum, V., Blackman, D. K., Kellogg, J. B. & O'Connell, R. J. Mantle flow under the western United States from shear wave splitting. Earth Planet. Sci. Lett. 247, (2006). Holt, W. E. Correlated crust and mantle strain fields in Tibet. Geology 28, (2000). Long, M.D., Gao, H., Klaus, A., Wagner, L.S., Fouch, M.J., James, D.E., & Humphreys, E. Shear wave splitting and the pattern of mantle flow beneath eastern Oregon, Earth Planet Sci. Lett. 288, (2009) Savage, M. K. & Sheehan, A. F. Seismic anisotropy and mantle flow from the Great Basin to the Great Plains, western United States. Journal of Geophysical Research-Solid Earth 105, (2000). Zandt, G. & Humphreys, E. Toroidal mantle flow through the western US slab window. Geology 36, (2008). Zhang, S. Q. & Karato, S. Lattice preferred orientation of olivine aggregates deformed in simple shear. Nature 375, (1995). Savage, M. K. & Silver, P. G. (1993). Mantle deformation and tectonics constraints from seismic anisotropy in the western United-States. Phys. Earth Planet. Int., 78(3-4),
14 Ozalaybey, S. & Savage, M. K. Shear-Wave Splitting Beneath Western United-States in Relation to Plate-Tectonics. Journal of Geophysical Research-Solid Earth 100, (1995). Savage, M. K. Seismic anisotropy and mantle deformation in the western United States and southwestern Canada. Int. Geol. Rev. 44, (2002). Notes N1. Lin et al discuss the estimation of uncertainty for the two anisotropic dispersion parameters (period dependent fast axis direction and amplitude) shown, for example, in Fig. 2de. To prevent underestimation of uncertainties, two additional uncertainty scaling schemes are applied. First, the reduced chi-squared value of the best fitting 2-psi curve, χ 2, is used to scale the uncertainty of both parameters by λ=exp(χ 2 /6). The effect is to scale up uncertainties at periods where data misfit is large. Second, if the anisotropy amplitude, c, is less than 0.75% we scale the fast direction uncertainty by λ =8.5 10c, which acts to diminish the effect of fast direction measurements where amplitudes are small in the ensuing inversion. N2. In order to ensure only smooth lateral variations of asthenospheric fast directions, for each location we minimize the misfit between the predicted and observed SKS measurements within 300 km by assuming a constant fast direction in the asthenospheric layer. The tradeoff between splitting strength in the asthenospheric layer and the thickness of the uppermost mantle layer increases the difficulty of investigating the spatial variation of these two parameters. This smoothing process effectively down weights the effect of small scale variations in the SKS measurements.
15 Figure Captions Figure 1. (a) Maps of the study region where black triangles identify the seismic stations used, which are mainly from the EarthScope USarray Transportable Array. Major tectonic boundaries are drawn with red lines and the plate boundaries with yellow lines. Black arrows indicate the relative motions between the Pacific (PA) and North American Plates (NA), the Juan de Fuca Plate (JdF) and NA, and NA and the hotspot reference frame (HS) (Gripp & Gordon, 2002). Red stars mark the locations of examples shown in Fig. 1b-g and Fig. 2d-e. (b)-(g) Examples of 12, 26, and 38 sec period Rayleigh wave azimuthally dependent phase velocity measurements in northern Nevada and western Utah. Green dashed lines are the best fitting 2-psi variation curves, which are used to estimate both the fast direction and the amplitude of anisotropy with their uncertainties. Figure 2. (a)-(c) Maps of 12, 26, and 38 sec period Rayleigh wave azimuthal anisotropy on a 0.6 spatial grid. The fast propagation direction and anisotropic amplitude are presented by the orientation and length of the red bars. (d)-(e) An example of anisotropy dispersion curves for a location in northern Nevada between periods of 12 and 54 sec with associated uncertainties. The red lines are the best fitting dispersion curves based on the crustal and uppermost mantle model shown in Fig. 3a-b. Figure 3.
16 (a)-(c) Anisotropic properties of the middle-to-lower crust, uppermost mantle, and asthenosphere in our final model, where the fast propagation direction and anisotropic amplitude are represented by the orientation and length of the yellow/red bars on a 0.6 spatial grid. Isotropic shear wave speeds at depths of 15 and 50 km are color coded in the background of (a)-(b), and the fast direction is shown in the background in (c). (d) The predicted SKS measurements based on the 3D anisotropic model, where the fast direction and splitting time are represented by the orientation and length of the red bars on a 0.6 spatial grid. The splitting time is also color coded in the background. Figure 4. (a) Comparison of observations of SKS splitting (blue, red, or black) and predictions (yellow) from the 3D model of anisotropy model shown in Fig. 3a-c, where the fast direction and splitting times are summarized by the orientation and length of the bars. The blue, red, and black colors of the observed measurements identify differences with the model predictions of the fast axis directions: Blue: 0º-30º, Red: 30º-60º, Black: 60º-90º. (b)-(c) Histogram of differences between the observed and predicted fast axis directions and splitting times shown in (a). (d) Histogram of differences in anisotropy fast directions between the crust and uppermost mantle. (e) Same as (d), but for differences in fast directions between the uppermost mantle and asthenospheric layers.
17 Table 1. Summary of model performance. Model A: Crust & 220 km thick uppermost mantle Model B: Crust, 80 km thick uppermost mantle, with a laterally homogeneous asthenosphere Model C: Crust, 80 km thick uppermost mantle, with a smoothly varying asthenosphere Variance reduction relative to an isotropic model Surface wave data SKS splitting data Comparison between predicted and observed SKS fast directions Standard deviation Percentage within 20 94% 36% 29 57% 94% 58% % 94% 64% 18 82%
18 Supplementary Materials SM1. Misfit: To constrain the asthenospheric layer, we seek to minimize the misfit between model-predicted and observed SKS measurements defined as follows, where and are azimuthally averaged apparent splitting parameters (split time and fast axis direction, respectively) and N is the number of SKS measurements. SM2. Directional correlation & statistical significance of two directional distributions: We define the directional correlation coefficient,, between two directional distributions and (i=1,,n) as (1) where and are unit vectors. Considering the 180 periodicity of fast directions, the azimuth of each fast direction is first multiplied by 2 before inserting into eq. (1), which leads to r = +1 and -1 when the distributions are parallel and perpendicular, respectively. The statistical significance of the directional correlation coefficient is assessed by Monte Carlo simulation. Although the N in eq. (1) is generally quite large (>400) due to the fine spatial grid used and the small spacing between SKS measurements, we estimate the number of independent fast direction measurements is estimated to be around 50 considering the area of our study region (~2,000,000
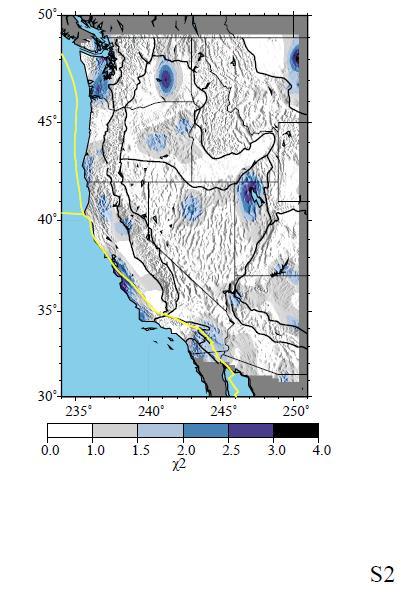
19 km 2 ) and our lateral resolution (~200km). In each realization of the Monte Carlo simulation, we calculate the correlation coefficient between two distributions each with 50 fast directions randomly distributed between 0 and 90. The simulation is repeated 10 8 times and the resulting set of correlation coefficients define the probability that a measured correlation coefficient results by pure chance. Figure S1. (a)-(b) Comparison between the 26s period Rayleigh wave azimuthal anisotropy inverted separately with ambient noise and earthquake data. (c) Earthquake results replotted only at locations where amplitudes are larger than 0.5%, to contrast with ambient noise results. Colorcoding identifies differences between the earthquake and ambient noise fast axis directions: Blue: 0º-30º, Red: 30º-60º, Black: 60º-90º. General similarity is observed between the earthquake and ambient noise fast directions, with differences mostly near the periphery of the maps (Northern California to Southern Oregon) and in regions with particularly sharp isotropic velocity gradients (Northern Oregon to Southern Washington, central California). (d) Histogram of differences between ambient noise and earthquake determined fast axis directions (shown in (c)). (e)-(f) Histograms of differences in the fast axis directions and in the amplitude anisotropy between the ambient noise and earthquake results normalized by their estimated uncertainties. If the uncertainty estimates are accurate, both histograms would be Gaussian with σ = 1. This indicates that our uncertainty estimates are slightly underestimated. Figure S2. The reduced chi-squared value, χ 2, between the observed and predicted anisotropic dispersion curves based on our crustal and uppermost mantle model at each location.
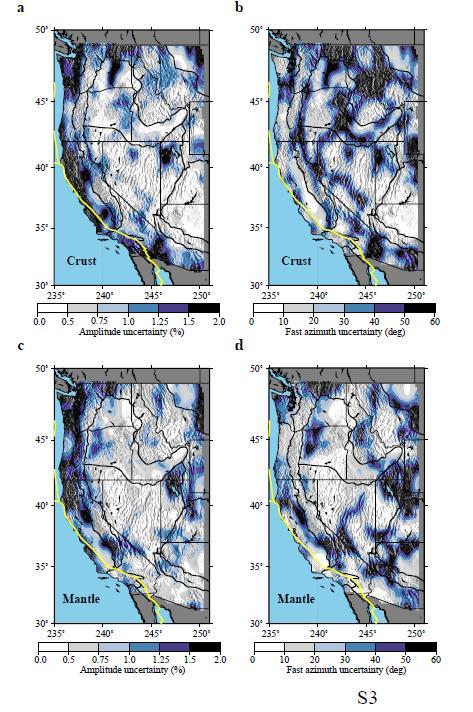
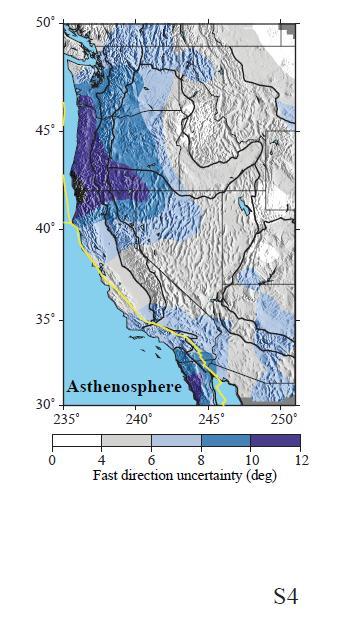
20 Figure S3. (a)-(d) The estimated uncertainty of azimuthal anisotropy in the crust and uppermost mantle. A grid search is performed over the four anisotropy parameters where all models with a reduced chi-squared value less than 1.5χ 2 best are considering as acceptable. χ 2 best is the best fitting reduced chi-squared value shown in Fig. S2. The uncertainty for each parameter is determined by the maximum difference between the acceptable models and the best fitting model. Other than regions near the coast, anisotropic amplitude uncertainties average ~0.5% for both the crust and uppermost mantle. Uncertainties in the fast directions generally are smaller than 20º at locations with meaningful anisotropic amplitudes. Uncertainties are largest near transition regions. Figure S4. The estimated fast direction uncertainties of anisotropy in the asthenospheric layer shown in Fig. 3c. For each location, we assume 50 independent SKS measurements are used to constrain the best fitting fast direction φ best in the asthenospheric layer and the uncertainty of each SKS splitting fast direction measurement is equal to the standard deviation δθ best of the differences between the predicted and observed SKS fast directions for the best fitting case. Based on chi-square analysis, for a model with a fast direction φ to be correct, there should be 75% chance that the predicted and observed SKS fast directions should have standard deviation δθ smaller than 1.06δθ best. We consider all the fast direction φ satisfying this criterion to be acceptable and assign the maximum difference between the best and acceptable fast directions to be the uncertainty of φ best. The largest uncertainties are coastal, particularly in Cascadia.
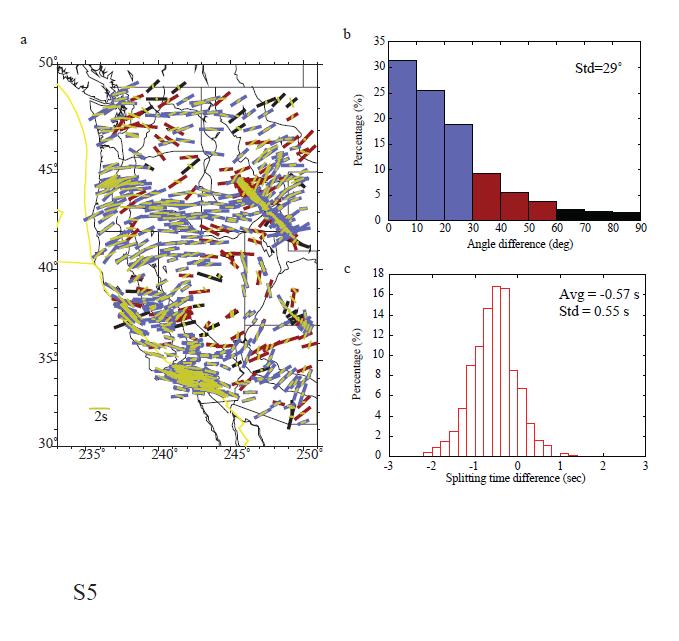
21 Figure S5. Same as Fig. 4a-c, but for Model A which only includes anisotropy in the crust and uppermost mantle layers ( shown in Fig. 3a-b). The uppermost mantle thickness is extended to 220 km to minimize the misfit between the predicted and observed SKS splitting measurements. The directional correlation coefficient between the model predicted and observed SKS fast directions is r = Only one out of one million random directional distribution pairs would have a better correlation (Supplementary Materials SM2). Figure S6. (a)-(c) Same as Fig. 4a-c, but fore Model B that has a constant fast direction (15º N of E) in the asthenospheric layer throughout the entire region. The misfit improvement relative to the model without an asthenospheric layer (Fig. S5) is significant (a 34% variance reduction), although only two parameters (fast axis direction and split time) define the asthenospheric model across the entire region. This supplies strong evidence for the existence of a deeper asthenospheric anisotropy layer that is probably significantly less heterogeneous laterally than the shallower layers of anisotropy.
22
23
24
25
26
27
28
29
30
31
Ambient Noise Tomography in the Western US using Data from the EarthScope/USArray Transportable Array
 Ambient Noise Tomography in the Western US using Data from the EarthScope/USArray Transportable Array Michael H. Ritzwoller Center for Imaging the Earth s Interior Department of Physics University of Colorado
Regional 3D velocity structure
 Seismic imaging: Regional 3D velocity structure 3 Seismic anisotropy courtesy of Ed Garnero This is birefringence: tells us about the preferential orientation of minerals 1 Anisotropy beneath the East
SUPPLEMENTARY INFORMATION
 Inability of additional parameters to resolve the Rayleigh-Love discrepancy Radial anisotropy is introduced to resolve the Rayleigh-Love misfit discrepancy that exists across large regions of the western
G 3. AN ELECTRONIC JOURNAL OF THE EARTH SCIENCES Published by AGU and the Geochemical Society
 Geosystems G 3 AN ELECTRONIC JOURNAL OF THE EARTH SCIENCES Published by AGU and the Geochemical Society Article Volume 8, Number 8 21 August 2007 Q08010, doi:10.1029/2007gc001655 ISSN: 1525-2027 Click
Crustal shear velocity structure of the western US inferred from ambient seismic noise and earthquake data
 JOURNAL OF GEOPHYSICAL RESEARCH, VOL.???, XXXX, DOI:10.1029/, 1 2 3 Crustal shear velocity structure of the western US inferred from ambient seismic noise and earthquake data M. P. Moschetti, 1 M. H. Ritzwoller,
The structure of the crust and uppermost mantle beneath the western US. revealed by ambient noise and earthquake tomography
 The structure of the crust and uppermost mantle beneath the western US revealed by ambient noise and earthquake tomography Yingjie Yang 1, Michael H. Ritzwoller 1, F.-C. Lin 1, M.P.Moschetti 1, and Nikolai
Structures Beneath California, Transpression, and Absolute Plate
 The Relationship Between Upper Mantle Anisotropic Structures Beneath California, Transpression, and Absolute Plate Motions Minoo Kosarian 1, Paul M. Davis 1, Toshiro Tanimoto 2 and Robert W. Clayton 3
Auxiliary Material. Subduction of oceanic asthenosphere: evidence from sub-slab seismic anisotropy. Teh-Ru Alex Song, Hitoshi Kawakatsu
 Auxiliary Material Subduction of oceanic asthenosphere: evidence from sub-slab seismic anisotropy Teh-Ru Alex Song, Hitoshi Kawakatsu correspondence to: tehrusong@gmail.com 1 1. The effect of anisotropy
Geophysical Journal International
 Geophysical Journal International Geophys. J. Int. (2011) doi: 10.1111/j.1365-246X.2011.05100.x Apparent anisotropy in inhomogeneous isotropic media Fan-Chi Lin and Michael H. Ritzwoller Center for Imaging
The Earth s Structure from Travel Times
 from Travel Times Spherically symmetric structure: PREM - Crustal Structure - Upper Mantle structure Phase transitions Anisotropy - Lower Mantle Structure D D - Structure of of the Outer and Inner Core
Seismic Anisotropy and Mantle Flow in the Izu-Bonin-Mariana Subduction System
 Seismic Anisotropy and Mantle Flow in the Izu-Bonin-Mariana Subduction System Matthew J. Fouch (Department of Geological Sciences, Arizona State University, Tempe, AZ 85287, email: fouch@asu.edu) INTRODUCTION
Seismic evidence for widespread deep crustal deformation caused by extension in the western US
 Seismic evidence for widespread deep crustal deformation caused by extension in the western US M.P. Moschetti 1,2, M.H. Ritzwoller 1, F.-C. Lin 1 and Y. Yang 1 1 - Center for Imaging the Earth s Interior,
SHORT PERIOD SURFACE WAVE DISPERSION FROM AMBIENT NOISE TOMOGRAPHY IN WESTERN CHINA. Sponsored by National Nuclear Security Administration 1,2
 SHORT PERIOD SURFACE WAVE DISPERSION FROM AMBIENT NOISE TOMOGRAPHY IN WESTERN CHINA Michael H. Ritzwoller 1, Yingjie Yang 1, Michael Pasyanos 2, Sihua Zheng 3, University of Colorado at Boulder 1, Lawrence
Supplementary Information for USArray Shear Wave Splitting Shows Seismic Anisotropy from Both Lithosphere and Asthenosphere
 GSA Data Repository 2015234 Supplementary Information for USArray Shear Wave Splitting Shows Seismic Anisotropy from Both Lithosphere and Asthenosphere Sutatcha Hongsresawat 1, Mark P. Panning 1, Raymond
1. A few words about EarthScope and USArray. 3. Tomography using noise and Aki s method
 1. A few words about EarthScope and USArray 2. Surface-wave studies of the crust and mantle 3. Tomography using noise and Aki s method 4. Remarkable images of US crust (and basins)! Unlocking the Secrets
Dynamic Subsidence and Uplift of the Colorado Plateau. Supplementary Material
 GSA DATA REPOSITORY 2010177 Liu and Gurnis Dynamic Subsidence and Uplift of the Colorado Plateau Supplementary Material Lijun Liu and Michael Gurnis Seismological Laboratory California Institute of Technology
Activity Pacific Northwest Tectonic Block Model
 Activity Pacific Northwest Tectonic Block Model The Cascadia tectonic margin is caught between several tectonic forces, during the relentless motions of the giant Pacific Plate, the smaller subducting
Travel time tomography of western North America with a new arrival time data set
 Chapter 7 Travel time tomography of western North America with a new arrival time data set 7.1 Introduction The west coast of North America has been, and still continues to be, a site of complex deformation
What does Seismic Anisotropy tell us about the Lithosphere-Asthenosphere Boundary?
 What does Seismic Anisotropy tell us about the Lithosphere-Asthenosphere Boundary? Jean-Paul Montagner (1), Gael Burgos (1), Eric Beucler (2), Antoine Mocquet (2) and Yann Capdeville (2), Mathias Obrebski
Crustal and uppermost mantle structure in southern Africa revealed from ambient noise and teleseismic tomography
 Geophys. J. Int. (2008) doi: 10.1111/j.1365-246X.2008.03779.x Crustal and uppermost mantle structure in southern Africa revealed from ambient noise and teleseismic tomography Yingjie Yang 1, Aibing Li
Geophysical Journal International
 Geophysical Journal International Geophys. J. Int. (2014) 198, 656 670 Advance Access publication 2014 May 31 GJI Seismology doi: 10.1093/gji/ggu160 3-D crustal structure of the western United States:
SUPPLEMENTARY INFORMATION
 SUPPLEMENTARY INFORMATION Patterns of intraplate volcanism controlled by asthenospheric shear Clinton P. Conrad 1,,*, Todd A. Bianco 1,, Eugene I. Smith 2, and Paul Wessel 1 1 Department of Geology & Geophysics,
USArray the first five years
 www.earthscope.org USArray the first five years USArray A Continental-Scale Seismic By the Numbers (2003 2008) More than 600 Transportable Array sites have been occupied and more than 535 permits acquired
CURRICULUM VITAE WEISEN SHEN EDUCATION
 CURRICULUM VITAE WEISEN SHEN Center for Imaging the Earth s Interior, Department of Physics, CU Boulder Boulder, CO, 80309 Research ID: J-3969-2012 http://www.researcherid.com/rid/j-3969-2012 Citizenship:
Mantle and crust anisotropy in the eastern China region inferred from waveform
 Earth Planets Space, 53, 159 168, 2001 Mantle and crust anisotropy in the eastern China region inferred from waveform splitting of SKS and PpSms Takashi Iidaka 1 and Fenglin Niu 2 1 ERI, University of
Non-linear crustal corrections in high-resolution regional waveform seismic tomography
 Geophys. J. Int. (27) 17, 46 467 doi: 1.1111/j.1365-246X.27.3399.x Non-linear crustal corrections in high-resolution regional waveform seismic tomography Federica Marone and Barbara Romanowicz Berkeley
1/9/08. Toroidal Mantle Flow Through the Western U.S. Slab Window. G. Zandt 1 and E. Humphreys 2
 1 2 3 4 5 6 7 8 9 10 11 12 13 14 15 16 17 18 19 20 21 22 23 24 25 26 27 28 29 30 31 32 33 34 35 36 37 38 39 40 41 42 43 44 45 46 47 48 49 50 51 Toroidal Mantle Flow Through the Western U.S. Slab Window
Broad-band ambient noise surface wave tomography across the United States
 JOURNAL OF GEOPHYSICAL RESEARCH, VOL.???, XXXX, DOI:10.1029/, Broad-band ambient noise surface wave tomography across the United States G. D. Bensen Center for Imaging the Earth s Interior, Department
Body Wave Tomography. Matt Fouch. ASU EarthScope Seminar January 26, 2010
 Body Wave Tomography Matt Fouch ASU EarthScope Seminar January 26, 2010 Seismic Tomography Mini-FAQ What is it? Earth sciences CAT-scan Measure of seismic wavespeeds or wavespeed variations Why do we care?
Contents of this file
 Geophysical Research Letters Supporting Information for Intraplate volcanism controlled by back-arc and continental structures in NE Asia inferred from trans-dimensional ambient noise tomography Seongryong
This article appeared in a journal published by Elsevier. The attached copy is furnished to the author for internal non-commercial research and
 This article appeared in a journal published by Elsevier. The attached copy is furnished to the author for internal non-commercial research and education use, including for instruction at the authors institution
Joint inversion of Rayleigh wave phase velocity and ellipticity using USArray: Constraining velocity and density structure in the upper crust
 GEOPHYSICAL RESEARCH LETTERS, VOL. 39,, doi:10.109/01gl05196, 01 Joint inversion of Rayleigh wave phase velocity and ellipticity using USArray: Constraining velocity and density structure in the upper
Distinctive upper mantle anisotropy beneath the High Lava Plains and Eastern Snake River Plain, Pacific Northwest, USA
 Article Volume 14, Number 10 21 October 2013 doi: ISSN: 1525-2027 Distinctive upper mantle anisotropy beneath the High Lava Plains and Eastern Snake River Plain, Pacific Northwest, USA Lara S. Wagner Department
1. University of Ottawa 2. Dublin Institute for Advanced Studies 3. University of Texas at Austin
 Supplementary Figures: Azimuthal seismic anisotropy in the Earth s upper mantle and the thickness of tectonic plates A.J. Schaeffer 1, S. Lebedev 2 and T.W. Becker 3 Geophysical Journal International July
SURFACE WAVE GROUP VELOCITY MEASUREMENTS ACROSS EURASIA
 SURFACE WAVE GROUP VELOCITY MEASUREMENTS ACROSS EURASIA A. L. Levshin, M. H. Ritzwoller, and L. I. Ratnikova Department of Physics, University of Colorado at Boulder -Contract Number F49620-95-1-0139 Sponsored
Empirical Green s Function Analysis of the Wells, Nevada, Earthquake Source
 Nevada Bureau of Mines and Geology Special Publication 36 Empirical Green s Function Analysis of the Wells, Nevada, Earthquake Source by Mendoza, C. 1 and Hartzell S. 2 1 Centro de Geociencias, Universidad
Earth and Planetary Science Letters
 Earth and Planetary Science Letters 297 (2010) 627 632 Contents lists available at ScienceDirect Earth and Planetary Science Letters journal homepage: www.elsevier.com/locate/epsl Seismic anisotropy beneath
Supporting Information for An automatically updated S-wave model of the upper mantle and the depth extent of azimuthal anisotropy
 GEOPHYSICAL RESEARCH LETTERS Supporting Information for An automatically updated S-wave model of the upper mantle and the depth extent of azimuthal anisotropy Eric Debayle 1, Fabien Dubuffet 1 and Stéphanie
12. The diagram below shows the collision of an oceanic plate and a continental plate.
 Review 1. Base your answer to the following question on the cross section below, which shows the boundary between two lithospheric plates. Point X is a location in the continental lithosphere. The depth
Dynamic Crust Practice
 1. Base your answer to the following question on the cross section below and on your knowledge of Earth science. The cross section represents the distance and age of ocean-floor bedrock found on both sides
EPICENTRAL LOCATION OF REGIONAL SEISMIC EVENTS BASED ON LOVE WAVE EMPIRICAL GREEN S FUNCTIONS FROM AMBIENT NOISE
 EPICENTRAL LOCATION OF REGIONAL SEISMIC EVENTS BASED ON LOVE WAVE EMPIRICAL GREEN S FUNCTIONS FROM AMBIENT NOISE Anatoli L. Levshin, Mikhail P. Barmin, and Michael H. Ritzwoller University of Colorado
GEO-DEEP9300 Lithosphere and Asthenosphere: Composition and Evolution
 GEO-DEEP9300 Lithosphere and Asthenosphere: Composition and Evolution Summary Presentation The Structural Evolution of the Deep Continental Lithosphere Focused on the Junction of Arabian, Eurasian and
Shear wave anisotropy beneath the Cascadia subduction zone and western North American craton
 Geophys. J. Int. (2004) 157, 341 353 doi: 10.1111/j.1365-246X.2004.02175.x Shear wave anisotropy beneath the Cascadia subduction zone and western North American craton Claire A. Currie, 1,2, John F. Cassidy,
Parts of the Sevier/ Laramide Orogeny
 Parts of the Sevier/ Laramide Orogeny AA. Accretionary Prism BB. Forearc Basin Sediment scraped off of subducting plate Sediment derived from the volcanic arc CC. Volcanic Arc Magmatic intrusion into the
Continent-sized anomalous zones with low seismic velocity at the base of Earth s mantle
 SUPPLEMENTARY INFORMATION DOI: 10.1038/NGEO2733 Continent-sized anomalous zones with low seismic velocity at the base of Earth s mantle Edward J. Garnero 1, Allen K. McNamara 1, and Sang-Heon D. Shim 1
Imaging sharp lateral velocity gradients using scattered waves on dense arrays: faults and basin edges
 2017 SCEC Proposal Report #17133 Imaging sharp lateral velocity gradients using scattered waves on dense arrays: faults and basin edges Principal Investigator Zhongwen Zhan Seismological Laboratory, California
Peer Reviewed Publications
 Peer Reviewed Publications Moucha, R., A. M. Forte, D. B. Rowley, J. X. Mitrovica, N. A. Simmons, and S. P. Grand (2009),Deep mantle forces and the uplift of the Colorado Plateau,Geophys. Res. Lett., doi:10.1029/2009gl039778,
Effects of Surface Geology on Seismic Motion
 4 th IASPEI / IAEE International Symposium: Effects of Surface Geology on Seismic Motion August 23 26, 2011 University of California Santa Barbara TOMOGRAPHIC ESTIMATION OF SURFACE-WAVE GROUP VELOCITY
Seismic interferometry with antipodal station pairs
 GEOPHYSICAL RESEARCH LETTERS, VOL. 4, 1 5, doi:1.12/grl.597, 213 Seismic interferometry with antipodal station pairs Fan-Chi Lin 1 and Victor C. Tsai 1 Received 25 June 213; revised 19 August 213; accepted
Broad-band ambient noise surface wave tomography across the United States
 JOURNAL OF GEOPHYSICAL RESEARCH, VOL.???, XXXX, DOI:10.1029/, 1 2 Broad-band ambient noise surface wave tomography across the United States G. D. Bensen 3 4 Center for Imaging the Earth s Interior, Department
2008 Monitoring Research Review: Ground-Based Nuclear Explosion Monitoring Technologies
 FINITE-FREQUENCY SEISMIC TOMOGRAPHY OF BODY WAVES AND SURFACE WAVES FROM AMBIENT SEISMIC NOISE: CRUSTAL AND MANTLE STRUCTURE BENEATH EASTERN EURASIA Yong Ren 2, Wei Zhang 2, Ting Yang 3, Yang Shen 2,and
Global surface-wave tomography
 Global surface-wave tomography Lapo Boschi (lapo@erdw.ethz.ch) October 7, 2009 Love and Rayleigh waves, radial anisotropy Whenever an elastic medium is bounded by a free surface, coherent waves arise that
Sendai Earthquake NE Japan March 11, Some explanatory slides Bob Stern, Dave Scholl, others updated March
 Sendai Earthquake NE Japan March 11, 2011 Some explanatory slides Bob Stern, Dave Scholl, others updated March 14 2011 Earth has 11 large plates and many more smaller ones. Plates are 100-200 km thick
Global anisotropy and the thickness of continents
 1 Global anisotropy and the thickness of continents Yuancheng Gung, Barbara Romanowicz and Mark Panning Berkeley Seismological Laboratory and Department of Earth and Planetary Science, Berkeley, CA, 94720,USA.
Geophysical Journal International. Joint inversion of surface wave dispersion and receiver functions: A Bayesian Monte-Carlo approach
 Joint inversion of surface wave dispersion and receiver functions: A Bayesian Monte-Carlo approach Journal: Geophysical Journal International Manuscript ID: GJI-S--0.R Manuscript Type: Research Paper Date
C3.4.1 Vertical (radial) variations in mantle structure
 variations in mantle structure") C3.4 Mantle structure Mantle behaves as a solid on short time scales (seismic waves travel through it and this requires elastic behaviour). Over geological time scales the mantle behaves as a very viscous
C3.4 Mantle structure Mantle behaves as a solid on short time scales (seismic waves travel through it and this requires elastic behaviour). Over geological time scales the mantle behaves as a very viscous
2008 Monitoring Research Review: Ground-Based Nuclear Explosion Monitoring Technologies
 STRUCTURE OF THE KOREAN PENINSULA FROM WAVEFORM TRAVEL-TIME ANALYSIS Roland Gritto 1, Jacob E. Siegel 1, and Winston W. Chan 2 Array Information Technology 1 and Harris Corporation 2 Sponsored by Air Force
Surface-wave studies of the Australian region
 Geol. Soc. Australia Spec. Publ. 22, and Geol. Soc. America Spec. Pap. 372 (2003), 25 40 Surface-wave studies of the Australian region E. DEBAYLE 1 * AND B. L. N. KENNETT 2 1 IPGS Ecole et Observatoire
Directionality of Ambient Noise on the Juan de Fuca Plate: Implications for Source Locations of the Primary and Secondary Microseisms
 Directionality of Ambient Noise on the Juan de Fuca Plate: Implications for Source Locations of the Primary and Secondary Microseisms Journal: Manuscript ID: GJI-S-- Manuscript Type: Research Paper Date
X-2 BENSEN ET AL.: 3D VELOCITY MODEL OF THE US Abstract. In an earlier study, Ben
 JOURNAL OF GEOPHYSICAL RESEARCH, VOL.???, XXXX, DOI:10.1029/, 1 2 3 A 3D Shear Velocity Model of the Crust and Uppermost Mantle Beneath the United States from Ambient Seismic Noise G. D. Bensen 4 5 Center
Toward a generalized plate motion reference frame: Supplementary material
 GEOPHYSICAL RESEARCH LETTERS, VOL.???, XXXX, DOI:.29/, Toward a generalized plate motion reference frame: Supplementary material T. W. Becker University of Southern California, Los Angeles CA, USA A. J.
27th Seismic Research Review: Ground-Based Nuclear Explosion Monitoring Technologies
 SHORT PERIOD SURFACE WAVE DISPERSION MEASUREMENTS FROM AMBIENT SEISMIC NOISE IN NORTH AFRICA, THE MIDDLE EAST, AND CENTRAL ASIA Michael H. Ritzwoller 1, Nikolai M. Shapiro 1, Michael E. Pasyanos 2, Gregory
Stratification of anisotropy in the Pacific upper mantle
 JOURNAL OF GEOPHYSICAL RESEARCH, VOL. 109,, doi:10.1029/2004jb003200, 2004 Stratification of anisotropy in the Pacific upper mantle Daniel B. Smith, Michael H. Ritzwoller, and Nikolai M. Shapiro Center
Geophysical Journal International
 Geophysical Journal International Geophys. J. Int. (215) 21, 429 443 GJI Seismology doi: 1.193/gji/ggv24 Directionality of ambient noise on the Juan de Fuca plate: implications for source locations of
A) B) C) D) 4. Which diagram below best represents the pattern of magnetic orientation in the seafloor on the west (left) side of the ocean ridge?
 B) C) D) 4. Which diagram below best represents the pattern of magnetic orientation in the seafloor on the west (left) side of the ocean ridge?") 1. Crustal formation, which may cause the widening of an ocean, is most likely occurring at the boundary between the A) African Plate and the Eurasian Plate B) Pacific Plate and the Philippine Plate C)
1. Crustal formation, which may cause the widening of an ocean, is most likely occurring at the boundary between the A) African Plate and the Eurasian Plate B) Pacific Plate and the Philippine Plate C)
OCN 201: Seafloor Spreading and Plate Tectonics I
 OCN 201: Seafloor Spreading and Plate Tectonics I Revival of Continental Drift Theory Kiyoo Wadati (1935) speculated that earthquakes and volcanoes may be associated with continental drift. Hugo Benioff
SUPPLEMENTARY INFORMATION
 The major uncertainties in our model predictions arise from the input parameters, which include mantle density models (i.e. seismic tomography and choices about scaling velocities to temperature), crustal
Online material: Updated 3-D tomography model and plotting script with examples
 Model Update January 2010: Upper Mantle Heterogeneity beneath North merica from Traveltime Tomography with Global and usarray Transportable rray Data Scott urdick, Robert D. van der Hilst, Frank L. Vernon,
5: ABSOLUTE PLATE MOTIONS & HOTSPOTS
 5-1 5: ABSOLUTE PLATE MOTIONS & HOTSPOTS 1 Relative motions between plates are most important In some applications important to consider absolute plate motions, those with respect to the deep mantle ABSOLUTE
Earth and Planetary Science Letters
 Earth and Planetary Science Letters 288 (2009) 359 369 Contents lists available at ScienceDirect Earth and Planetary Science Letters journal homepage: www.elsevier.com/locate/epsl Shear wave splitting
Seismology 5: Body wave anisotropy
 Seismology 5: Body wave anisotropy what it is, how we study it, and what it can tell us about flow in the deep Earth Maureen D. Long, Yale University CIDER 7/8/16 Road map for today s talk Part I: Some
4-D Geodynamic Modeling With Data Assimilation: Subduction and Continental Evolution
 4-D Geodynamic Modeling With Data Assimilation: Subduction and Continental Evolution PI: Lijun Liu Department of Geology, University of Illinois at Urbana-Champaign Corresponding author: Lijun Liu, ljliu@illinois.edu
Lateral variation of the D 00 discontinuity beneath the Cocos Plate
 GEOPHYSICAL RESEARCH LETTERS, VOL. 31, L15612, doi:10.1029/2004gl020300, 2004 Lateral variation of the D 00 discontinuity beneath the Cocos Plate T. Lay Earth Sciences Department, University of California,
Tomography of the 2011 Iwaki earthquake (M 7.0) and Fukushima
 and Fukushima") 1 2 3 Auxiliary materials for Tomography of the 2011 Iwaki earthquake (M 7.0) and Fukushima nuclear power plant area 4 5 6 7 8 9 Ping Tong 1,2, Dapeng Zhao 1 and Dinghui Yang 2 [1] {Department of Geophysics,
1 2 3 Auxiliary materials for Tomography of the 2011 Iwaki earthquake (M 7.0) and Fukushima nuclear power plant area 4 5 6 7 8 9 Ping Tong 1,2, Dapeng Zhao 1 and Dinghui Yang 2 [1] {Department of Geophysics,
Mantle structure beneath the western United States and its implications for convection processes
 Click Here for Full Article JOURNAL OF GEOPHYSICAL RESEARCH, VOL. 115,, doi:10.1029/2008jb006079, 2010 Mantle structure beneath the western United States and its implications for convection processes Mei
SUPPLEMENTARY INFORMATION
 SUPPLEMENTARY INFORMATION Seismic evidence for a global low velocity layer within the Earth s upper mantle SUPPLEMENTARY MATERIAL Benoît Tauzin 1, Eric Debayle 2 & Gérard Wittlinger 3 1 Department of Earth
6. In the diagram below, letters A and B represent locations near the edge of a continent.
 1. Base your answer to the following question on the cross section below and on your knowledge of Earth science. The cross section represents the distance and age of ocean-floor bedrock found on both sides
Shear velocity structure and azimuthal anisotropy beneath eastern North America from Rayleigh wave inversion
 JOURNAL OF GEOPHYSICAL RESEARCH, VOL. 108, NO. B8, 2362, doi:10.1029/2002jb002259, 2003 Shear velocity structure and azimuthal anisotropy beneath eastern North America from Rayleigh wave inversion Aibing
Knowledge of in-slab earthquakes needed to improve seismic hazard estimates for southwestern British Columbia
 USGS OPEN FILE REPORT #: Intraslab Earthquakes 1 Knowledge of in-slab earthquakes needed to improve seismic hazard estimates for southwestern British Columbia John Adams and Stephen Halchuk Geological
Deformation in transcurrent and extensional environments with widely spaced weak zones 1
 7 Chapter 2 Deformation in transcurrent and extensional environments with widely spaced weak zones 1 2.1 Abstract Previous mechanical models of the western U.S. have concluded that plate boundary forces
Estimation of S-wave scattering coefficient in the mantle from envelope characteristics before and after the ScS arrival
 GEOPHYSICAL RESEARCH LETTERS, VOL. 30, NO. 24, 2248, doi:10.1029/2003gl018413, 2003 Estimation of S-wave scattering coefficient in the mantle from envelope characteristics before and after the ScS arrival
Chemical Heterogeneity in the Mantle: Inferences from Seismology, Mineral Physics and Geodynamics
 Chemical Heterogeneity in the Mantle: Inferences from Seismology, Mineral Physics and Geodynamics Jeannot Trampert (Utrecht University), Frederic Deschamps (ETH Zurich), Paul Tackley (ETH Zurich) Probabilistic
Regional Resource Area Mapping in Nevada Using the USArray Seismic Network
 Regional Resource Area Mapping in Nevada Using the USArray Seismic Network Glenn Biasi, Ileana Tibuleac, and Leiph Preston Nevada Seismological Laboratory, University of Nevada Reno, Reno, NV 89557 Sandia
The Theory of Plate Tectonics
 Plate Tectonics Objectives Describe how plates move. Explain the features of plate tectonics. Describe the types of plate boundaries and the features that can form and events that can occur at each. The
ANOTHER MEXICAN EARTHQUAKE! Magnitude 7.1, Tuesday Sept. 19, 2017
 ANOTHER MEXICAN EARTHQUAKE! Magnitude 7.1, Tuesday Sept. 19, 2017 Why is there no oceanic crust older than 200 million years? SUBDUCTION If new oceanic crust is being continuously created along the earth
Curriculum Vitae Fan-Chi Lin
 Curriculum Vitae Fan-Chi Lin University of Utah Citizenship: Taiwan Geology and Geophysics Date of Birth: May 31, 1978 271 FASB, 115 S 1460 E (Web) http://noise.earth.utah.edu Salt Lake City, UT 84112
COMPUTATION OF REGIONAL TRAVEL TIMES AND STATION CORRECTIONS FROM THREE-DIMENSIONAL VELOCITY MODELS
 COMPUTATION OF REGIONAL TRAVEL TIMES AND STATION CORRECTIONS FROM THREE-DIMENSIONAL VELOCITY MODELS A. Villaseñor 1,2, M.P. Barmin 1, M.H. Ritzwoller 1, and A.L. Levshin 1 1 Department of Physics, University
Geophysical Journal International
 Geophysical Journal International Geophys. J. Int. (2010) doi: 10.1111/j.1365-246X.2010.04643.x Empirically determined finite frequency sensitivity kernels for surface waves Fan-Chi Lin and Michael H.
Full file at
 Chapter 2 PLATE TECTONICS AND PHYSICAL HAZARDS MULTIPLE-CHOICE QUESTIONS 1. What direction is the Pacific Plate currently moving, based on the chain of Hawaiian Islands with only the easternmost island
Magnitude 6.5 OFFSHORE NORTHERN CALIFORNIA
 A powerful offshore earthquake that struck near the Northern California coast left a hodgepodge of debris for communities to sort through Sunday but spared residents any serious injury. After 25,000 people
Geophysical Journal International
 Geophysical Journal International Geophys. J. Int. (11) doi: 1.1111/j.1365-46X.11.531.x On the interpretation of SKS splitting measurements in the presence of several layers of anisotropy Barbara Romanowicz
Selected Seismic Observations of Upper-Mantle Discontinuities
 Selected Seismic Observations of Upper-Mantle Discontinuities Peter Shearer IGPP/SIO/U.C. San Diego August 31, 2009 Earthquake Research Institute Interface Depth vs. Publication Date Most depths are sampled
Teleseismic waveform modelling of the 2008 Leonidio event
 The 6 January 2008 (Mw6.2) Leonidio (southern Greece) intermediate depth earthquake: teleseismic body wave modelling Anastasia Kiratzi and Christoforos Benetatos Department of Geophysics, Aristotle University
A 3-D Model of the Crust and Uppermost Mantle Beneath the Central and Western US by Joint Inversion of Receiver Functions and Surface Wave Dispersion
 A 3-D Model of the Crust and Uppermost Mantle Beneath the Central and Western US by Joint Inversion of Receiver Functions and Surface Wave Dispersion Weisen Shen 1, Michael H. Ritzwoller 1, and Vera Schulte-Pelkum
Earth and Planetary Science Letters
 EPSL-10034; No of Pages 11 ARTICLE IN PRESS Earth and Planetary Science Letters xxx (2009) xxx xxx Contents lists available at ScienceDirect Earth and Planetary Science Letters journal homepage: www.elsevier.com/locate/epsl
Global variation of body wave attenuation in the upper mantle from teleseismic P wave and S wave spectra
 GEOPHYSICAL RESEARCH LETTERS, VOL. 38,, doi:10.1029/2011gl046812, 2011 Global variation of body wave attenuation in the upper mantle from teleseismic P wave and S wave spectra Y. K. Hwang, 1 J. Ritsema,
Geology of the Hawaiian Islands
 Geology of the Hawaiian Islands Class 3 20 January 2004 Any Questions? IMPORTANT Big Island Field Trip We need a firm commitment PLUS $164 payment for airfare BEFORE January 29th Plate Tectonics Fundamental
Imaging the Gutenberg Seismic Discontinuity beneath the Oceanic Crust of the North American Plate
 Imaging the Gutenberg Seismic Discontinuity beneath the Oceanic Crust of the North American Plate Robbie Burgess 11-25-15 Dr. Nicholas Schmerr GEOL 394 1 1. Abstract: The lithosphere-asthenosphere boundary
Supplementary Figure 1. Distribution of seismic event locations determined using the final 3-D velocity model. We separate the crust-related
 Supplementary Figure 1. Distribution of seismic event locations determined using the final 3-D velocity model. We separate the crust-related seismicity at depths of less than 40 km (panel A) from the deeper
Data Repository Item
 Data Repository Item 2009003 An abrupt transition from magma-starved to magma-rich rifting in the eastern Black Sea Donna J. Shillington, Caroline L. Scott, Timothy A. Minshull, Rosemary A. Edwards, Peter