The structure of the crust and uppermost mantle beneath the western US. revealed by ambient noise and earthquake tomography
|
|
|
- Millicent Walsh
- 6 years ago
- Views:
Transcription
1 The structure of the crust and uppermost mantle beneath the western US revealed by ambient noise and earthquake tomography Yingjie Yang 1, Michael H. Ritzwoller 1, F.-C. Lin 1, M.P.Moschetti 1, and Nikolai M.Shapiro 2 1 Center for Imaging the Earth s Interior, Department of Physics, University of Colorado at Boulder, Boulder, CO , yingjie.yang@colorado.edu, phone: Institut de Physique du Globe de Paris, CNRS, Paris, France, nshapiro@ipp.jussieu.fr Corresponding author is listed in bold. 1
2 Abstract Ambient noise tomography and multiple plane-wave earthquake tomography are new methods of surface wave analysis that yield much more highly refined information about the crust and uppermost mantle than traditional surface wave techniques. Applied together to data observed at more than 300 broad-band seismic stations from the Transportable Array component of the EarthScope USArray, these methods yield surface wave dispersion curves from 8 to 100 sec period across the entire western US with unprecedented resolution. We use the local Rayleigh wave phase speed curves to construct a unified isotropic 3D Vs model to a depth of about 150 km. Crustal and uppermost mantle features that underlie the western US are revealed in striking relief. As the USArray continues to sweep eastward across the US, the substructure of the entire country will be unveiled. 2
3 1 Introduction The western United States is undergoing broad and diverse deformation caused by strike-slip motion (California plate margin), subduction (Juan de Fuca and Gorda plates beneath the Pacific northwest), extension (Basin and Range province), and large-scale uplift (Colorado Plateau) as well as small-scale lithospheric instabilities (southern Sierra Nevada and Transverse ranges) and a hypothesized continental mantle plume (Snake River Plain and Yellowstone). These active tectonic processes are manifest in a variety of crustal and lithospheric structures that have been the subject of intense seismological study using portable seismic instrumentation on a small scale (e.g., Humphreys and Hager, 1990; Boyd et al., 2004; Zandt et al., 2004; Waite et al., 2006; Xue and Allen, 2006) as well as observatory class instrumentation on a continental scale (e.g., van der Lee and Nolet, 1997; Grand, 1994). Traditional P-wave tomography has provided the first tantalizing glimpses at these structures (e.g., Dueker et al., 2001; Burdick et al., 2008; Pollock, 2008) in the mantle and a 3D model has been constructed from ambient noise tomography across the entire US (Bensen et al., 2008), yet no integrated 3D seismological model of the crust and uppermost mantle exists across the western United States on the spatial scale of these features. Such a model is needed to identify the principal structural features across the western US, determine the relations between the features themselves and their surface expressions, and provide clues about their nature and origin. 3
4 Recent improvements in seismic instrumentation in the western US coupled with advancements in seismic methodology now allow for the development of such a 3D seismic model of the crust and uppermost mantle beneath the western US. The Earthscope/USArray Transportable Array (TA), presently being deployed across the western US on a nearly uniform 70-km grid, provides the requisite broad-band seismic data (Fig. 1a). The technical innovations in surface wave tomography include ambient noise tomography (e.g., Shapiro et al., 2005; Sabra et al., 2005) and a recent innovation in earthquake tomography that we call teleseismic multi-plane-wave tomography (MPWT). MPWT is a large-scale generalization of the commonly used two-plane-wave method of Yang and Forsyth (2006a, 2006b) and is applied for the first time here. We use these methods together to produce broad-band surface wave dispersion measurements from 8 to 100 sec period that are then interpreted in terms of 3-D shear velocity variations in the crust and uppermost mantle across more than 1.2 x 10 6 km 2 of the western US. 2. Data and Methods Ambient noise tomography is based on cross-correlating long continuous time series of three-component ambient seismic noise to measure Rayleigh and Love wave group and phase speed curves and the resulting dispersion maps (e.g., Yao et al., 2006; Bensen et al., 2007; Yang et al., 2007; Lin et al., 2007; Cho et al., 2007). The method has been applied across the western US to data from the USArray/TA (Fig. 1a) for time series up to three years in length 4
5 to produce phase speed (Lin et al., 2008) and group speed maps from 6 to 40 sec period (Moschetti et al., 2007). The principal advantage of ambient noise tomography is that surface wave dispersion at short periods (<20 sec), which is difficult to measure using teleseismic earthquake methods due to intrinsic attenuation and scattering from distant sources, can be obtained robustly to provide unique constraints on crustal structure. Information about the mantle is contained in the longer period measurements (>40 sec) obtained from teleseismic earthquakes, but scattering and multi-pathing caused by lateral heterogeneities between the earthquakes and the TA stations distort incoming waves, leading to wavefield complexity. To address this problem, each incoming teleseismic wavefield is fit with a multiple plane wave expansion where each plane wave has an initially unknown amplitude, phase, and propagation direction. This method is a natural extension of the two plane wave method of Yang and Forsyth (2006a, 2006b). Six plane waves are sufficient to model each incoming wavefield across the western US. We interpret the observed phase and amplitude observed across the USArray/TA jointly to model the incoming wavefields and the phase velocity variation across the array. Sixty teleseismic earthquakes are used with Ms > 5.5 and epicentral distances from 30 o to 120 o from the center of the array that occurred in the 21-month period from January 2006 through September Details about the phase velocity maps are presented by Yang and Ritzwoller (2008) which, however, used a two plane wave method in overlapping sub-regions. Their maps are very similar to those produced with the multiple plane wave generalization. 5
6 Ambient noise tomography and teleseismic multiple-plane-wave tomography provide structural information in complementary period bands: ambient noise from 6 to 40 sec and the teleseismic method from 25 to 100 sec. The methods have similar resolution at short and intermediate periods (<40 s), estimated to approach the inter-station spacing (~70 km) at short periods (Fig. 2). In ambient noise tomography, we estimate resolution using the method described by Barmin et al. (2001) with modifications presented by Levshin et al. (2005). The resolution at a spatial node is defined by a resolution surface, which is a row of the resolution matrix from tomography. To summarize this information, we fit a 2-D symmetric spatial Gaussian function to the surface at each node. Resolution is then defined as twice the standard deviation of the Gaussian fit at each node and this information can be plotted as a resolution map. Examples of resolution maps at 12 and 33 sec period are presented in Figure 2. In the multiple-plane-wave tomography, we do not estimate resolution directly. We infer it indirectly based on the similarity of phase speed maps from these two methods (e.g., Fig. 3f). In ambient noise tomography (ANT), uncertainties in the dispersion measurements are determined by repeating the measurements over disjoint time intervals (e.g., Bensen et al., 2007). Uncertainties at different nodes in the dispersion maps, however, are estimated using a new method of tomography called Eikonal tomography (F. Lin, M.H. Ritzwoller, R.Snieder, manuscript in preparation, 2008). This method involves wavefield phase time tracking and the production of a phase travel time map centered on each station. Each station-centered 6
7 phase-time map is interpreted separately with the Eikonal equation (e.g., Kravtsov and Orlov, 1990) to estimate local phase speed from the modulus of the local gradient of the phase-time map. Rayleigh wave uncertainties are estimated at a given location from the multiplicity of phase-time maps centered on different stations. Uncertainties average 5-10 m/s near the center of the study region but increase near its periphery. In multiple-plane-wave tomography, standard errors are taken from the model covariance matrix (Yang and Forsyth, 2006a) and average between m/sec near the center of the region but grow near the edges. Used in combination, ambient noise and multi-plane wave tomography provide Rayleigh wave phase speed maps from 8 to 100 sec period (Fig. 3), a band sensitive to depths from the surface to about 160 km. In the overlapping period range (25-40 sec), the methods produce similar phase speed measurements over most of the study area except near the borders where station coverage is not ideal (Figure 3d, e and f), and we average the measurements. 3. Model Construction The set of Rayleigh wave phase speed maps is inverted for a 3D isotropic shear velocity (Vs) model on a 0.5 o 0.5 o geographic grid using a two-step procedure. Because only Rayleigh waves are used in the inversion, the primary sensitivity is to Vsv and we have no Vsh information. Thus, although we will refer to the model as a Vs-model, it is in fact Vsv. At each point on the grid, the local Rayleigh wave phase speed curve is constructed from the 7
8 dispersion maps and this curve provides the data for the inversion. The first step is a linearized inversion of the Rayleigh wave phase speed curve for the best fitting Vs-model below the grid point. In the linearized inversion, depth-dependent shear wave speeds are parameterized in eleven constant Vs layers from the Earth s surface to 200 km depth with three layers for the crust and eight layers for the upper mantle. Because Rayleigh wave phase speeds depend primarily on Vs, we scale Vp to Vs using a constant Vp/Vs ratio of in the crust and in the mantle (Chulick and Mooney, 2002). Due to the trade-off between Moho depth and Vs in the two layers adjacent to Moho, we fix crustal thickness to that derived from receiver functions (Gilbert and Fouch, 2008). In the second step, a Markov Chain Monte-Carlo resampling of model space (Shapiro and Ritzwoller, 2002; Bensen et al., 2008; Yang et al., 2008) is performed to quantify the uncertainty in shear velocity versus depth. The Markov Chain Monte-Carlo inversion executes a random walk through model space in the neighborhood of the model derived from the linearized inversion. At each spatial node, this generates an ensemble of acceptable 1D shear velocity models that fit the Rayleigh wave dispersion curve within specified uncertainties. To expedite model space sampling, the velocities in the crust and upper mantle are allowed to vary within a ±5% range of the initial model, a range similar to the variation of S-wave speed across the study region. The thicknesses of the upper and middle crustal layers are fixed, but the thickness of the lower crust (and hence Moho depth) is allowed to 8
9 vary from the initial model within ±5 km. If the predicted dispersion curve for a candidate model matches the measured curve with an average misfit of less than twice the data standard deviation, the model is retained and termed acceptable. Further details about the Monte-Carlo inversion can be found in Shapiro and Ritzwoller (2002) and Bensen et al. (2008). For each grid point, the average of the resulting ensemble of acceptable models at each depth is taken as the expected value of the Vs-model and the half-width of the corridor of the ensemble provides an estimate of model uncertainty (Fig.1b). To visualize the uncertainty in the 3D model we use the notion of persistent features (Shapiro and Ritzwoller, 2002). An anomaly relative to the average model across the region is considered to be persistent if it appears in every member of the ensemble of acceptable models; that is, if its value is greater than the half-width of the corridor of models. Acceptability is defined relative to the dispersion measurement uncertainties, which average 5-10 m/s at periods from 8 to 25 sec and m/s at periods from 30 to 100 sec. The final model is isotropic and is composed of three crustal layers and five B-spline functions in the upper mantle to represent mantle velocity to a depth of 200 km. Vs is constrained to increase with depth monotonically in the crust and vary with depth smoothly in the mantle. An example of the output from the process at a single location is plotted in Figure 1b and 1c. 9
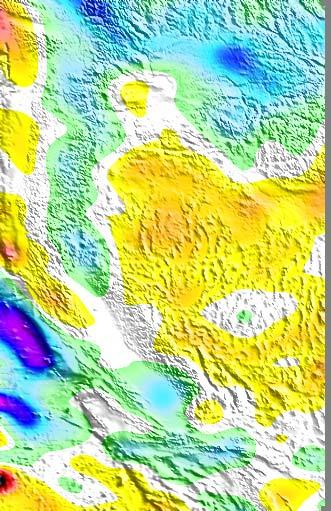
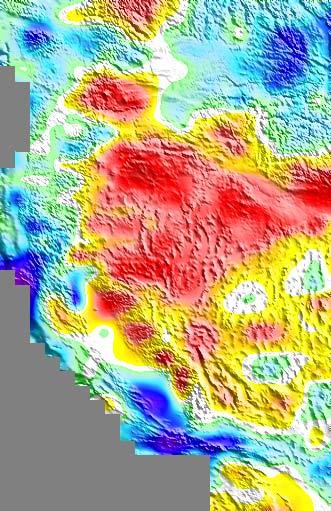
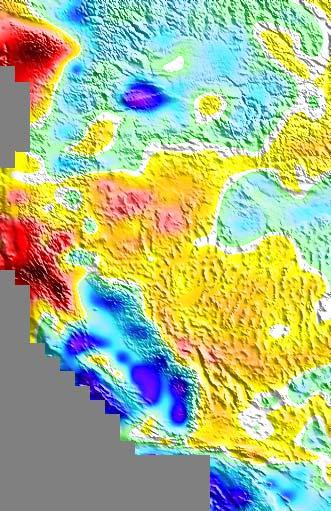
10 4. The 3D Model: Discussion The inversion method is applied across the far western US, including all of California, Oregon, Washington, and the western half of Idaho. The period-averaged misfit to the dispersion measurements by the 3D Vs model is about m/s across most of the study area (Fig. 4). The average uncertainties of the 3D Vs model, defined as the standard deviation among the ensemble of acceptable model averaged over the study region, are about 1% in the upper and middle crust and in the mantle below 50 km (Fig. 5i) and somewhat larger near the Moho discontinuity due to the trade-off of Moho depth with Vs in neighboring depths. These values are about two to three times smaller than the RMS of the shear velocity anomalies at the same depth (Fig. 5i). Below about 160 km depth, the RMS of the recovered anomalies crosses over the uncertainty of the model. We, therefore, interpret features of the recovered model only above about 160 km. The resulting 3D Vs model (Fig. 5) with uncertainties shown in Figure 6 reveals a wealth of structural information correlated closely with regional geological features and tectonics. In the crust, shear velocity anomalies typically are similar with depth, except beneath the principal sedimentary basins such as the Central Valley of California, the Salton Trough in the Imperial Valley, the Los Angeles Basin, and the Columbia River Basin (Yakima Fold Belt) near the Washington Oregon border. These basins exhibit pronounced low shear wave speeds in the upper crust due to the slowness of the sediments. Low wave speeds are also 10
11 observed along the Coast Ranges from California through Washington due to continuous deformation in California along the San Andreas fault, south of the Mendocino Transform, and the accumulation of off-scraped and metamorphosed sediments resulting from past and ongoing subduction north of the transform. The most significant difference between velocity anomalies in the upper and the middle/lower crusts (10 km Moho) (Fig. 5b) is that high velocities underlie the principal sedimentary basins, which is qualitatively consistent with crustal isostasy. Throughout the crust, shear wave speeds are high in the Sierra Nevada and the Peninsular Ranges which are composed primarily of higher velocity granitic batholiths. The non-granitic Cascade Range is characterized by nearly average wave speeds. Modest low velocities are observed throughout the Basin and Range province, probably due to elevated crustal temperatures resulting from relatively thin lithosphere (Zandt et al., 1995). The northern Columbia Plateau and the western Snake River Plain are characterized by high wave speeds throughout the entire crust, presumably caused by compositional heterogeneity resulting from igneous intrusions related to basalt flows ( Peng and Humphreys, 1998; Hales et al. 2005). In the upper mantle (Fig. 5c, d), velocity anomalies are distinct from those observed in the overlying crust, reflecting decoupling between the crust and upper mantle. Three sets of prominent high velocity features are observed, respectively, beneath (1) the Cascade Range associated with subduction of oceanic lithosphere, (2) the southern Great Valley of California and the Transverse Range associated with lithospheric instability, and (3) eastern Washington 11
12 and the northern Rocky Mountains associated with thick, stable Proterozoic lithosphere. The high velocity lithosphere of the subducting Juan de Fuca and Gorda plates has an apparent thickness of km (Fig. 5e and 5f), consistent with its relatively young age, and persists to a depth greater than our resolvable depth of ~160 km. The edge of the high velocity slab is seen as a sharp north-south velocity contrast near the Mendocino Transform (Fig. 5d), coincident with the location of the southern edge of the Gorda plate. High velocity anomalies in southern California are consistent with previous surface wave studies (e.g., Yang and Forsyth, 2006a, 2006b) and regional P-wave tomography (Humphreys and Clayton, 1990), and have been interpreted as lithospheric downwellings or drips caused by a Rayleigh-Taylor instability (Humphreys and Hager, 1990; Biasi and Humphreys, 1992; Zandt and Carrigan, 1993). The lithospheric drip beneath the southern Central Valley can be seen to reach a depth of km (Fig. 5g, Profile C-C ), which is somewhat deeper than that beneath the Transverse Range. High wave speeds beneath the northern Rocky Mountains extend deeper than 160 km (Fig. 5e), which implies that the Proterozoic lithosphere there was not completely eroded by past tectonic events such as the Laramide Orogeny, consistent with earlier P-wave tomography (e.g., Dueker et al., 2001). Slow mantle wave speeds are imaged beneath the Cascadia arc of northern California, Oregon, and Washington, above and to the east of the subducting Juan de Fuca and Gorda plates. These low wave speeds reflect the influence of subduction on the overlying mantle wedge and perhaps also the interaction between a continental plume (the Yellowstone plume) 12
13 and the upper mantle. In the northern part of the arc (Fig. 5e, profile A-A ), low speeds are confined to the mantle wedge overlying the subducting plate with the lowest speeds directly underlying recently active Cascade volcanoes (Mt. St. Helens, Mt. Hood). These low wave speeds are coincident with the source volume of the volcanic magmas and may be caused by partial melting produced when volatiles released from the subducting slab rise into the overlying upper mantle (Peacock, 1990). In contrast, in southern Oregon (Fig. 5f, profile B-B ) low wave speeds extend much further east, underlying the extensive extrusive volcanism of the high lava plains of southern Oregon and the northern Basin and Range province. This broad low velocity anomaly, appearing at depths above ~120 km, probably reflects high temperatures in the upper mantle (Camp and Ross, 2004). The warm lithosphere in this region encompasses both the Yellowstone and Newberry hotspot tracks, but is much broader and may reflect plume-fed asthenospheric flow (Yamamoto and Morgan, 2007) following the impact of the mantle plume head beneath the lithosphere that occurred near the boundary of Oregon and Nevada at ~16.6 Ma (Camp and Ross, 2004; Xue and Allen, 2007). As the Yellowstone plume moved northeast relative to the North American plate to its current location beneath Yellowstone, low velocities imprinted the upper mantle along the Snake River Plain (Saltzer and Humphreys, 1997). The low wave speeds observed in the mantle beneath the western Snake River Plain slow further toward the east (Fig. 5f), as the date of the last volcanic event approaches the present. Low seismic waves speeds also underlie the Basin and Range province, but are weaker and may reflect lithospheric thinning consistent with the buoyant upwelling of asthenospheric material in response to the 13
14 detachment of the Farallon plate in the post-laramide era from ~ 50 to 20 Ma (Humphreys et al., 2003). 5. Conclusions This study merges new methods in seismic imaging using surface waves with a new kind of seismic array, the extensive broad-band Transportable Array component of EarthScope/USArray. Ambient noise tomography (ANT) and multiple plane-wave tomography (MPWT) provide higher resolution information than traditional methods of surface wave tomography, with ANT producing information about the crust and uppermost mantle and MPWT generating information about the mantle. Used together, these methods deliver dispersion curves across the western US from 8 to 100 sec period, which impose constraints on the crust and uppermost mantle to a depth of about 150 km. Inversion of these Rayleigh wave phase speed curves with a Markov Chain Monte Carlo method generates an isotropic 3D model with attendant uncertainties. The structural features that result cohere with known geological structures. Future advancements will result from incorporating Love waves and other kinds of seismic information and investigating the generalization of the model to include low velocity zones in the crust (if needed) and anisotropy. By the year 2012, the USArray/TA will have been moved systematically across the conterminous United States. The application of the methods presented in this paper to these data promises to continuously reveal structural images of the crust and uppermost mantle 14
15 across the entire US in previously unprecedented detail. Acknowledgments: All data used were obtained from the IRIS Data Management Center. The authors are grateful to Hersh Gilbert for providing his crustal thickness map prior to publication. This research was supported by NSF grants EAR and EAR References: Barmin, M.P., Ritzwoller, M.H. and Levshin, A.L. (2001). A fast and reliable method for surface wave tomography, Pure appl. Geophys., 158, Bensen, G. D., M. H. Ritzwoller and Y. Yang (2008), A 3D velocity model of the crust and uppermost mantle beneath the United States from ambient seismic noise, submitted to Geophys. J. Int. Bensen, G.D., M.H. Ritzwoller, M.P. Barmin, A.L. Levshin, F. Lin, M.P. Moschetti, N.M.Shapiro, and Y. Yang (2007), Processing seismic ambient noise data to obtain reliable broad-band surface wave dispersion measurements, Geophys. J. Int., 169,
16 Biasi, G. P., and E. D. Humphreys (1992), P-wave image of the upper mantle structure of Central California and southern Nevada, Geophys. Res. Lett., 19, , Boyd, O. S., C. H. Jones, and A. F. Sheehan (2004), Foundering lithosphere imaged beneath the southern Sierra Nevada, California, USA, Science, 305, Burdick, S., Li, C., Martynov, V., Cox, T., Eakins, J., Astiz, L, Vernon, F.L., Pavlis, G.L., Van der Hilst, R.D. (2008), Upper mantle heterogeneity beneath North America from travel time tomography with global and USArray transportable array data, Seismological Research Letters, 79, ,. Camp, V. E., and M. E. Ross (2004), Mantle dynamics and genesis of mafic magmatism in the intermontane Pacific Northwest, J. Geophys. Res., 109, B08204, doi: /2003jb Cho, K. H., R. B. Herrmann, C. J. Ammon, and K. Lee (2007), Imaging the upper crust of the Korean Peninsula by surface-wave tomography, Bull. Seismol. Soc. Am., 97(1B), Chulick, G. S., and W. D. Mooney (2002), Seismic structure of the crust and uppermost mantle of North America and adjacent oceanic basins: A synthesis, Bull. Seis. Soc. Am., 92 (6), Dueker K, Yuan H, and Zurek B (2001), Thick-Structured Proterozoic Lithosphere of the Rocky Mountain Region. GSA Today, 11(12), 4 9. Gilbert, H. and M.J. Fouch, Complex Upper Mantle Seismic Structure Across the Southern Colorado Plateau / Basin and Range II: Results from Receiver Function Analysis, Eos 16
17 Trans. AGU 88, S41B-0558, Grand, S. P.(1994), Mantle shear structure beneath the Americas and surrounding oceans, J. Geophys. Res., 99, 11,591-11,621. Hales, T.C., D. Abt, E. Humphreys, and J. Roering (2005), A lithospheric instability origin for Columbia River flood basalts and Willowa Mountains uplift in northeast Oregon, Nature, 438, Humphreys, E., E. Hessler, K. Dueker, E. Erslev, G. L. Farmer, and T. Atwater (2007), How Laramide-age hydration of North America by the Farallon slab controlled subsequent activity in the western U.S., The George A. Thompson volume, International Book Series, 7 (invited), S. L. Klemperer and W. G. Ernst, editors, , Geol. Soc. Am., Boulder Colorado, 2003 Humphreys, E.D. and Hager, B.H. (1990), A kinematic model for the late Cenozoic development of southern California crust and upper mantle, J. geophys. Res., 95, 19,747 19,762. Humphreys, E.D., and R.W. Clayton (1990), Tomographic image of the southern California mantle, J. Geophys. Res., 95, Kravtsov, Y.A. and Y.I Orlov, Geometrical Optics of Inhomogeneous Media, Springer-Verlag, New York, Levshin, A.L., Barmin, M.P., Ritzwoller, M.H. and Trampert, J. (2005), Minorarc and major-arc global surface wave diffraction tomography, Phys. Earth planet. Ints., 149,
18 Lin, F., M. H. Ritzwoller, J. Townend, M. Savage, and S. Bannister (2007), Ambient noise Rayleigh wave tomography of New Zealand, Geophys. J. Int., 170(2), doi: /j x x. Lin, F., M.P. Moschetti, and M.H. Ritzwoller (2008), Surface wave tomography of the western United States from ambient seismic noise: Rayleigh and Love wave phase velocity maps, Geophys. J. Int., doi: /j x x. Moschetti, M. P., M. H. Ritzwoller, and N. M. Shapiro (2007), Surface wave tomography of the western United States from ambient seismic noise: Rayleigh wave group velocity maps, Geochem. Geophys. Geosyst., 8, Q08010, doi: /2007gc Peacock, S.M. (1990), Fluid processes in subduction zones, Science,248, Peng, X., and E. Humphreys (1997), Crustal velocity structure of northwest Nevada from teleseismic receiver function analysis, Bull. Seis. Soc. Am., 87, Pollitz, F. (2008), Observations and interpretation of fundamental-model Rayleigh wavefields recorded by the Transportable Array (USArray), J. Geophys. Res, in press. Sabra, K. G., P. Gerstoft, P. Roux, W. Kuperman, and M. C. Fehler (2005),Surface wave tomography from microseisms in Southern California, Geophys. Res. Lett., 32, L14311, doi: /2005gl Saltzer, R., and E. Humphreys (1997), Upper mantle P wave velocity structure of the eastern Snake River Plain and its relationship to geodynamic models of the region, J. Geophys. Res., 102(B6), Shapiro, N.M. and M.H. Ritzwoller (2002), Monte-Carlo inversion for a global shear velocity 18
19 model of the crust and upper mantle, Geophys. J. Int., 151, Shapiro, N.M. M. Campillo, L. Stehly, and M.H. Ritzwoller (2005), High resolution surface wave tomography from ambient seismic noise, Science, 307, Van der Lee, S. and G. Nolet (1998), Upper mantle S velocity structure of North America, J. Geophys. Res. 102, Waite, G.P., R.B. Smith, and R.M. Allen (2006), Vp and Vs structure of the Yellowstone hot spot: evidence for an upper mantle plume, J. Geophys. Res., 111, B04303, doi: /2005jb Xue, M., and R. M. Allen (2007), The fate of the Juan de Fuca plate: Implications for a Yellowstone plume head, Earth Planet. Sci. Lett., 264, , Yamamoto M, J.P. Morgan and W.J. Morgan (2007), Global plume-fed asthenosphere flow I: Motivation and model development. Special Paper 430: Plates, Plumes and Planetary Processes, 430, Yang, Y., A. Li, M. H. Ritzwoller (2008), Crustal and uppermost mantle structure in southern Africa revealed from ambient noise and teleseismic tomography doi: /j x x Yang, Y., and D.W. Forsyth (2006a), Rayleigh wave phase velocities, small-scale convection and azimuthal anisotropy beneath southern California, J. Geophys. Res., 111, B07306, doi: /2005jb Yang, Y., and D.W. Forsyth (2006b), Regional tomographic inversion of amplitude and phase of Rayleigh waves with 2-D sensitivity kernels, Geophys. J. Int., 166,
20 Yang, Y., and M. H. Ritzwoller (2008), Teleseismic surface wave tomography in the western U.S. using the Transportable Array component of USArray, Geophys. Res. Lett., 35, L04308, doi: /2007gl Yang, Y., M. H. Ritzwoller, A. L. Levshin, and N. M. Shapiro (2007), Ambient noise Rayleigh wave tomography across Europe, Geophys. J. Int., 168(1), Yao, H., R. D. van der Hilst, and M. V. de Hoop (2006), Surface-wave array tomography in SE Tibet from ambient seismic noise and two-station analysis-i. Phase velocity maps, Geophys. J. Int., 166(2), Zandt, G. and C. R. Carrigan (1993). Small-scale convective instability and upper mantle viscosity under California,Science 261, Zandt, G., H. Gilbert, T. J. Owens, M. Ducea, J. Saleeby, and C. H. Jones (2004), Active foundering of a continental arc root beneath the southern Sierra Nevada in California, Nature, 431, Zandt, G., S. C. Myers, and T. C. Wallace (1995), Crust and mantle structure across the Basin and Range-Colorado Plateau boundary at 37 N latitude and implications for Cenozoic extensional mechanism, J. Geophys. Res., 100(B6), 10,529 10,
21 Figure Captions: Figure 1. (a) Station used in this study (west of 114 o W). The principal large-scale geological features of the western United States are identified, including the Cascade Range (CR), the Columbia River Flood Basalts (CRFB), the Rocky Mountains (RM), the High Lava Plains (HLP), the Snake River Plain (SRP), the Great Valley (GV), the Sierra Nevada Range (SN), the Basin and Range province (BR), the Transverse Range (TR), the Peninsular Range (PR), and the Salton Trough (ST). Triangles mark the locations of the EarthScope TA seismic stations used in this study. The red lines outline the boundaries between major tectonic units. (b) & (c) An example of the Monte-Carlo inversion for the point identified by the red star in the Basin and Range province in Fig.1a. (b) The resulting ensemble of acceptable Vs models (gray lines) and the average of the ensemble (red line). (c) Gray lines are predicted dispersion curves from the ensemble of Vs models shown in Fig. 1b. The dark grey line is the observed dispersion curve with error bars at individual periods. Figure 2. Resolution maps from ambient noise tomography for Rayleigh wave phase speed at periods of 12 and 33 sec. Resolution is defined as twice the standard deviation of a 2-D Gaussian function fit to the resolution matrix at each point (16). The 70 km resolution contour is shown with a thick black line. Resolution at other periods is similar. 21
22 Figure 3. (a-d) Rayleigh wave phase speed maps derived from ambient noise tomography (ANT) at periods of 8, 16, 25, and 33 sec, and (e,g-i) teleseismic multiple-plane-wave tomography (MPWT) at 33, 50, 66, and 100 sec. The 100 km resolution contour (the bold gray contours) is plotted for reference on the ANT maps. (f) The difference between the phase speeds determined by ANT and MPWT at 33 sec period. Anomalies are presented as the percent deviation from the average speed across the region. Figure 4. Period-averaged misfit map presenting the average of the difference between the observed dispersion curves and the curves computed from the 3D Vs model. Largest misfit occurs west of the Cascade Range where the ambient noise and multiple plane wave earthquake tomography are most discordant in the period band of overlap (Fig. 3f). Figure 5. (a)-(d) Shear wave speed maps at depths of 5, 15, 50 and 100 km. (e)-(g) Vertical cross sections of shear wave speed along three profiles delineated by the white lines in Fig. 3d. Black contours outline the persistent upper mantle velocity anomalies. Topography is over-plotted above individual cross sections with major tectonic units labeled using abbreviations defined in Fig. 1 caption. The black triangles in (c)-(f) represent active volcanoes in the Cascade Range. Shear velocity anomalies are computed relative to the average 1D model plotted in (h). (i) The standard deviation of the ensemble of acceptable models (i.e., average uncertainty, dashed line) and the root mean square (RMS) of the velocity perturbations (solid line) taken across the entire region. 22
23 Figure 6. Maps of the estimated uncertainty of the 3D Vs model derived from the ensemble of acceptable models produced by the Monte-Carlo inversion at the depths of 5, 15, 50 and 100 km. Largest uncertainties are in the lower crust and uppermost mantle due to trade-off between Moho depth and Vs in adjacent layers. 23

24

25


26

27


28


29
Ambient Noise Tomography in the Western US using Data from the EarthScope/USArray Transportable Array
 Ambient Noise Tomography in the Western US using Data from the EarthScope/USArray Transportable Array Michael H. Ritzwoller Center for Imaging the Earth s Interior Department of Physics University of Colorado
G 3. AN ELECTRONIC JOURNAL OF THE EARTH SCIENCES Published by AGU and the Geochemical Society
 Geosystems G 3 AN ELECTRONIC JOURNAL OF THE EARTH SCIENCES Published by AGU and the Geochemical Society Article Volume 8, Number 8 21 August 2007 Q08010, doi:10.1029/2007gc001655 ISSN: 1525-2027 Click
The stratification of seismic azimuthal anisotropy in the western US
 The stratification of seismic azimuthal anisotropy in the western US Fan-Chi Lin 1, Michael H. Ritzwoller 1, Yingjie Yang 1, Morgan P. Moschetti 1, and Matthew J. Fouch 2 1 - Center for Imaging the Earth's
Crustal shear velocity structure of the western US inferred from ambient seismic noise and earthquake data
 JOURNAL OF GEOPHYSICAL RESEARCH, VOL.???, XXXX, DOI:10.1029/, 1 2 3 Crustal shear velocity structure of the western US inferred from ambient seismic noise and earthquake data M. P. Moschetti, 1 M. H. Ritzwoller,
SUPPLEMENTARY INFORMATION
 Inability of additional parameters to resolve the Rayleigh-Love discrepancy Radial anisotropy is introduced to resolve the Rayleigh-Love misfit discrepancy that exists across large regions of the western
Regional 3D velocity structure
 Seismic imaging: Regional 3D velocity structure 3 Seismic anisotropy courtesy of Ed Garnero This is birefringence: tells us about the preferential orientation of minerals 1 Anisotropy beneath the East
SHORT PERIOD SURFACE WAVE DISPERSION FROM AMBIENT NOISE TOMOGRAPHY IN WESTERN CHINA. Sponsored by National Nuclear Security Administration 1,2
 SHORT PERIOD SURFACE WAVE DISPERSION FROM AMBIENT NOISE TOMOGRAPHY IN WESTERN CHINA Michael H. Ritzwoller 1, Yingjie Yang 1, Michael Pasyanos 2, Sihua Zheng 3, University of Colorado at Boulder 1, Lawrence
Dynamic Subsidence and Uplift of the Colorado Plateau. Supplementary Material
 GSA DATA REPOSITORY 2010177 Liu and Gurnis Dynamic Subsidence and Uplift of the Colorado Plateau Supplementary Material Lijun Liu and Michael Gurnis Seismological Laboratory California Institute of Technology
Parts of the Sevier/ Laramide Orogeny
 Parts of the Sevier/ Laramide Orogeny AA. Accretionary Prism BB. Forearc Basin Sediment scraped off of subducting plate Sediment derived from the volcanic arc CC. Volcanic Arc Magmatic intrusion into the
2008 Monitoring Research Review: Ground-Based Nuclear Explosion Monitoring Technologies
 FINITE-FREQUENCY SEISMIC TOMOGRAPHY OF BODY WAVES AND SURFACE WAVES FROM AMBIENT SEISMIC NOISE: CRUSTAL AND MANTLE STRUCTURE BENEATH EASTERN EURASIA Yong Ren 2, Wei Zhang 2, Ting Yang 3, Yang Shen 2,and
Seismic evidence for widespread deep crustal deformation caused by extension in the western US
 Seismic evidence for widespread deep crustal deformation caused by extension in the western US M.P. Moschetti 1,2, M.H. Ritzwoller 1, F.-C. Lin 1 and Y. Yang 1 1 - Center for Imaging the Earth s Interior,
Crustal and uppermost mantle structure in southern Africa revealed from ambient noise and teleseismic tomography
 Geophys. J. Int. (2008) doi: 10.1111/j.1365-246X.2008.03779.x Crustal and uppermost mantle structure in southern Africa revealed from ambient noise and teleseismic tomography Yingjie Yang 1, Aibing Li
Constraints on the causes of mid-miocene volcanism in the Pacific Northwest US from ambient noise tomography
 GEOPHYSICAL RESEARCH LETTERS, VOL. 39,, doi:10.1029/2012gl051108, 2012 Constraints on the causes of mid-miocene volcanism in the Pacific Northwest US from ambient noise tomography Sara Hanson-Hedgecock,
Evolution of Continents Chapter 20
 Evolution of Continents Chapter 20 Does not contain complete lecture notes. Mountain belts Orogenesis the processes that collectively produce a mountain belt Includes folding, thrust faulting, metamorphism,
CURRICULUM VITAE WEISEN SHEN EDUCATION
 CURRICULUM VITAE WEISEN SHEN Center for Imaging the Earth s Interior, Department of Physics, CU Boulder Boulder, CO, 80309 Research ID: J-3969-2012 http://www.researcherid.com/rid/j-3969-2012 Citizenship:
Geophysical Journal International
 Geophysical Journal International Geophys. J. Int. (2014) 198, 656 670 Advance Access publication 2014 May 31 GJI Seismology doi: 10.1093/gji/ggu160 3-D crustal structure of the western United States:
Late Tertiary Volcanism. North Washington. Other Andesite Volcanoes. Southern Washington. High Cascades. High Cascades. Mid-Miocene Miocene to present
 Miocene to Present Late Tertiary Volcanism Mid-Miocene Miocene to present Reading: DNAG volume G3, Ch. 7 High Cascade Range Columbia River Snake River Plain Basin and Range Southwestern California Sierra
Imaging sharp lateral velocity gradients using scattered waves on dense arrays: faults and basin edges
 2017 SCEC Proposal Report #17133 Imaging sharp lateral velocity gradients using scattered waves on dense arrays: faults and basin edges Principal Investigator Zhongwen Zhan Seismological Laboratory, California
Estimation of S-wave scattering coefficient in the mantle from envelope characteristics before and after the ScS arrival
 GEOPHYSICAL RESEARCH LETTERS, VOL. 30, NO. 24, 2248, doi:10.1029/2003gl018413, 2003 Estimation of S-wave scattering coefficient in the mantle from envelope characteristics before and after the ScS arrival
2008 Monitoring Research Review: Ground-Based Nuclear Explosion Monitoring Technologies
 STRUCTURE OF THE KOREAN PENINSULA FROM WAVEFORM TRAVEL-TIME ANALYSIS Roland Gritto 1, Jacob E. Siegel 1, and Winston W. Chan 2 Array Information Technology 1 and Harris Corporation 2 Sponsored by Air Force
Joint inversion of Rayleigh wave phase velocity and ellipticity using USArray: Constraining velocity and density structure in the upper crust
 GEOPHYSICAL RESEARCH LETTERS, VOL. 39,, doi:10.109/01gl05196, 01 Joint inversion of Rayleigh wave phase velocity and ellipticity using USArray: Constraining velocity and density structure in the upper
Travel time tomography of western North America with a new arrival time data set
 Chapter 7 Travel time tomography of western North America with a new arrival time data set 7.1 Introduction The west coast of North America has been, and still continues to be, a site of complex deformation
X-2 BENSEN ET AL.: 3D VELOCITY MODEL OF THE US Abstract. In an earlier study, Ben
 JOURNAL OF GEOPHYSICAL RESEARCH, VOL.???, XXXX, DOI:10.1029/, 1 2 3 A 3D Shear Velocity Model of the Crust and Uppermost Mantle Beneath the United States from Ambient Seismic Noise G. D. Bensen 4 5 Center
12. The diagram below shows the collision of an oceanic plate and a continental plate.
 Review 1. Base your answer to the following question on the cross section below, which shows the boundary between two lithospheric plates. Point X is a location in the continental lithosphere. The depth
Copyright McGraw-Hill Education. All rights reserved. No reproduction or distribution without the prior written consent of McGraw-Hill Education
 Copyright McGraw-Hill Education. All rights reserved. No reproduction or distribution without the prior written consent of McGraw-Hill Education Tibetan Plateau and Himalaya -southern Asia 11.00.a VE 10X
Mt St Helens was know to have entered into active periods that lasted from years once every years over the last 500 years, (Figure 5).
.") Lecture #8 notes; Geology 3950, Spring 2006; CR Stern May 1980 eruption of Mt St Helens volcano (text pages 183-192 in the 4 th edition and 206-222 in the 5 th edition) Mt St Helens in southwest Washington
Lecture #8 notes; Geology 3950, Spring 2006; CR Stern May 1980 eruption of Mt St Helens volcano (text pages 183-192 in the 4 th edition and 206-222 in the 5 th edition) Mt St Helens in southwest Washington
4-D Geodynamic Modeling With Data Assimilation: Subduction and Continental Evolution
 4-D Geodynamic Modeling With Data Assimilation: Subduction and Continental Evolution PI: Lijun Liu Department of Geology, University of Illinois at Urbana-Champaign Corresponding author: Lijun Liu, ljliu@illinois.edu
Peer Reviewed Publications
 Peer Reviewed Publications Moucha, R., A. M. Forte, D. B. Rowley, J. X. Mitrovica, N. A. Simmons, and S. P. Grand (2009),Deep mantle forces and the uplift of the Colorado Plateau,Geophys. Res. Lett., doi:10.1029/2009gl039778,
Curriculum Vitae Fan-Chi Lin
 Curriculum Vitae Fan-Chi Lin University of Utah Citizenship: Taiwan Geology and Geophysics Date of Birth: May 31, 1978 271 FASB, 115 S 1460 E (Web) http://noise.earth.utah.edu Salt Lake City, UT 84112
Mountain Building. Mountain Building
 Mountain Building Mountain building has occurred during the recent geologic past American Cordillera the western margin of the Americas from Cape Horn to Alaska Includes the Andes and Rocky Mountains Alpine
Full file at
 Chapter 2 PLATE TECTONICS AND PHYSICAL HAZARDS MULTIPLE-CHOICE QUESTIONS 1. What direction is the Pacific Plate currently moving, based on the chain of Hawaiian Islands with only the easternmost island
Plate Tectonics. entirely rock both and rock
 Plate Tectonics I. Tectonics A. Tectonic Forces are forces generated from within Earth causing rock to become. B. 1. The study of the origin and arrangement of Earth surface including mountain belts, continents,
USU 1360 TECTONICS / PROCESSES
 USU 1360 TECTONICS / PROCESSES Observe the world map and each enlargement Pacific Northwest Tibet South America Japan 03.00.a1 South Atlantic Arabian Peninsula Observe features near the Pacific Northwest
Section 10.1 The Nature of Volcanic Eruptions This section discusses volcanic eruptions, types of volcanoes, and other volcanic landforms.
 Chapter 10 Section 10.1 The Nature of Volcanic Eruptions This section discusses volcanic eruptions, types of volcanoes, and other volcanic landforms. Reading Strategy Previewing Before you read the section,
Dynamic Crust Practice
 1. Base your answer to the following question on the cross section below and on your knowledge of Earth science. The cross section represents the distance and age of ocean-floor bedrock found on both sides
Seismic interferometry with antipodal station pairs
 GEOPHYSICAL RESEARCH LETTERS, VOL. 4, 1 5, doi:1.12/grl.597, 213 Seismic interferometry with antipodal station pairs Fan-Chi Lin 1 and Victor C. Tsai 1 Received 25 June 213; revised 19 August 213; accepted
The Earth s Structure from Travel Times
 from Travel Times Spherically symmetric structure: PREM - Crustal Structure - Upper Mantle structure Phase transitions Anisotropy - Lower Mantle Structure D D - Structure of of the Outer and Inner Core
A 3-D Model of the Crust and Uppermost Mantle Beneath the Central and Western US by Joint Inversion of Receiver Functions and Surface Wave Dispersion
 A 3-D Model of the Crust and Uppermost Mantle Beneath the Central and Western US by Joint Inversion of Receiver Functions and Surface Wave Dispersion Weisen Shen 1, Michael H. Ritzwoller 1, and Vera Schulte-Pelkum
1. A few words about EarthScope and USArray. 3. Tomography using noise and Aki s method
 1. A few words about EarthScope and USArray 2. Surface-wave studies of the crust and mantle 3. Tomography using noise and Aki s method 4. Remarkable images of US crust (and basins)! Unlocking the Secrets
Three-dimensional seismic velocity structure of the northwestern United States
 Click Here for Full Article GEOPHYSICAL RESEARCH LETTERS, VOL. 35, L15304, doi:10.1029/2008gl034669, 2008 Three-dimensional seismic velocity structure of the northwestern United States Jeffrey B. Roth,
Chapter 10: Volcanoes and Other Igneous Activity Section 1: The Nature of Volcanic Eruptions I. Factors Affecting Eruptions Group # Main Idea:
 Chapter 10: Volcanoes and Other Igneous Activity Section 1: The Nature of Volcanic Eruptions I. Factors Affecting Eruptions Group # A. Viscosity Group # B. Dissolved Gases Group # II. Volcanic Material
High Resolution Surface Wave Tomography From Ambient Seismic Noise
 High Resolution Surface Wave Tomography From Ambient Seismic Noise Nikolai M. Shapiro 1, Michel Campillo, Laurent Stehly, Michael H. Ritzwoller 1 1 Center for Imaging the Earth s Interior, Department of
The continental lithosphere
 Simplicity to complexity: The continental lithosphere Reading: Fowler p350-377 Sampling techniques Seismic refraction Bulk crustal properties, thickness velocity profiles Seismic reflection To image specific
Upper Mantle P-Wave Velocity Structure from Passcal Teleseismic Transects Across Idaho, Wyoming and Colorado
 University of Wyoming Wyoming Scholars Repository Geology and Geophysics Faculty Publications Geology and Geophysics 4-17-2004 Upper Mantle P-Wave Velocity Structure from Passcal Teleseismic Transects
A) B) C) D) 4. Which diagram below best represents the pattern of magnetic orientation in the seafloor on the west (left) side of the ocean ridge?
 B) C) D) 4. Which diagram below best represents the pattern of magnetic orientation in the seafloor on the west (left) side of the ocean ridge?") 1. Crustal formation, which may cause the widening of an ocean, is most likely occurring at the boundary between the A) African Plate and the Eurasian Plate B) Pacific Plate and the Philippine Plate C)
1. Crustal formation, which may cause the widening of an ocean, is most likely occurring at the boundary between the A) African Plate and the Eurasian Plate B) Pacific Plate and the Philippine Plate C)
Why is the North America Cordillera high? Hot backarcs, thermal isostasy and
 Why is the North America Cordillera high? Hot backarcs, thermal isostasy and 1 mountain belts R.D. Hyndman 1 and C.A. Currie 2 1 Pacific Geoscience Centre, Geological Survey of Canada, Sidney, B.C., Canada
USArray the first five years
 www.earthscope.org USArray the first five years USArray A Continental-Scale Seismic By the Numbers (2003 2008) More than 600 Transportable Array sites have been occupied and more than 535 permits acquired
1/9/08. Toroidal Mantle Flow Through the Western U.S. Slab Window. G. Zandt 1 and E. Humphreys 2
 1 2 3 4 5 6 7 8 9 10 11 12 13 14 15 16 17 18 19 20 21 22 23 24 25 26 27 28 29 30 31 32 33 34 35 36 37 38 39 40 41 42 43 44 45 46 47 48 49 50 51 Toroidal Mantle Flow Through the Western U.S. Slab Window
5: ABSOLUTE PLATE MOTIONS & HOTSPOTS
 5-1 5: ABSOLUTE PLATE MOTIONS & HOTSPOTS 1 Relative motions between plates are most important In some applications important to consider absolute plate motions, those with respect to the deep mantle ABSOLUTE
Phase velocities from seismic noise using beamforming and cross correlation in Costa Rica and Nicaragua
 Click Here for Full Article GEOPHYSICAL RESEARCH LETTERS, VOL. 35, L19303, doi:10.1029/2008gl035387, 2008 Phase velocities from seismic noise using beamforming and cross correlation in Costa Rica and Nicaragua
27th Seismic Research Review: Ground-Based Nuclear Explosion Monitoring Technologies
 SHORT PERIOD SURFACE WAVE DISPERSION MEASUREMENTS FROM AMBIENT SEISMIC NOISE IN NORTH AFRICA, THE MIDDLE EAST, AND CENTRAL ASIA Michael H. Ritzwoller 1, Nikolai M. Shapiro 1, Michael E. Pasyanos 2, Gregory
Plate Tectonics Lab II: Background Information
 Plate Tectonics Lab II: Background Information This lab is based on a UW ESS101 Lab. Note: Hand in only the Answer Sheet at the back of this guide to your Instructor Introduction One of the more fundamental
Yellowstone Hotspot Component of the Plate Boundary Observatory
 Yellowstone Hotspot Component of the Plate Boundary Observatory (Investigators: Smith, Thatcher, Meertens, Humphreys, Dzurisin, Oldow Co-Investigators: Christiansen, Doss, Schwartz, Machette, Wong, Olig,
SURFACE WAVE GROUP VELOCITY MEASUREMENTS ACROSS EURASIA
 SURFACE WAVE GROUP VELOCITY MEASUREMENTS ACROSS EURASIA A. L. Levshin, M. H. Ritzwoller, and L. I. Ratnikova Department of Physics, University of Colorado at Boulder -Contract Number F49620-95-1-0139 Sponsored
6. In the diagram below, letters A and B represent locations near the edge of a continent.
 1. Base your answer to the following question on the cross section below and on your knowledge of Earth science. The cross section represents the distance and age of ocean-floor bedrock found on both sides
Lab 1: Plate Tectonics April 2, 2009
 Name: Lab 1: Plate Tectonics April 2, 2009 Objective: Students will be introduced to the theory of plate tectonics and different styles of plate margins and interactions. Introduction The planet can be
Activity Pacific Northwest Tectonic Block Model
 Activity Pacific Northwest Tectonic Block Model The Cascadia tectonic margin is caught between several tectonic forces, during the relentless motions of the giant Pacific Plate, the smaller subducting
Plate Tectonics: The New Paradigm
 Earth s major plates Plate Tectonics: The New Paradigm Associated with Earth's strong, rigid outer layer: Known as the lithosphere Consists of uppermost mantle and overlying crust Overlies a weaker region
Mantle structure beneath the western United States and its implications for convection processes
 Click Here for Full Article JOURNAL OF GEOPHYSICAL RESEARCH, VOL. 115,, doi:10.1029/2008jb006079, 2010 Mantle structure beneath the western United States and its implications for convection processes Mei
Beneath our Feet: The 4 Layers of the Earty by Kelly Hashway
 Beneath our Feet: The 4 Layers of the Earty by Kelly Hashway The Earth is more than a giant ball made up of dirt, rocks, and minerals. The Earth may look like a giant ball from when looking at it from
Edge Driven Convection and Iceland
 Edge Driven Convection and Iceland Scott D. King Department of Earth and Atmospheric Sciences Purdue University, West Lafayette, Indiana One of the alternative hypotheses for hotspot volcanism is Edge-Driven
Empirical Green s Function Analysis of the Wells, Nevada, Earthquake Source
 Nevada Bureau of Mines and Geology Special Publication 36 Empirical Green s Function Analysis of the Wells, Nevada, Earthquake Source by Mendoza, C. 1 and Hartzell S. 2 1 Centro de Geociencias, Universidad
Contents of this file
 Geophysical Research Letters Supporting Information for Intraplate volcanism controlled by back-arc and continental structures in NE Asia inferred from trans-dimensional ambient noise tomography Seongryong
EPICENTRAL LOCATION OF REGIONAL SEISMIC EVENTS BASED ON LOVE WAVE EMPIRICAL GREEN S FUNCTIONS FROM AMBIENT NOISE
 EPICENTRAL LOCATION OF REGIONAL SEISMIC EVENTS BASED ON LOVE WAVE EMPIRICAL GREEN S FUNCTIONS FROM AMBIENT NOISE Anatoli L. Levshin, Mikhail P. Barmin, and Michael H. Ritzwoller University of Colorado
Directionality of Ambient Noise on the Juan de Fuca Plate: Implications for Source Locations of the Primary and Secondary Microseisms
 Directionality of Ambient Noise on the Juan de Fuca Plate: Implications for Source Locations of the Primary and Secondary Microseisms Journal: Manuscript ID: GJI-S-- Manuscript Type: Research Paper Date
Supporting Information for An automatically updated S-wave model of the upper mantle and the depth extent of azimuthal anisotropy
 GEOPHYSICAL RESEARCH LETTERS Supporting Information for An automatically updated S-wave model of the upper mantle and the depth extent of azimuthal anisotropy Eric Debayle 1, Fabien Dubuffet 1 and Stéphanie
Effects of Surface Geology on Seismic Motion
 4 th IASPEI / IAEE International Symposium: Effects of Surface Geology on Seismic Motion August 23 26, 2011 University of California Santa Barbara TOMOGRAPHIC ESTIMATION OF SURFACE-WAVE GROUP VELOCITY
Directed Reading. Section: How Mountains Form MOUNTAIN RANGES AND SYSTEMS. Skills Worksheet
 Skills Worksheet Directed Reading Section: How Mountains Form 1. How high is Mount Everest? a. about 1980 km above sea level b. more than 8 km below sea level c. more than 8 km above sea level d. more
PLATE TECTONICS. Continental Drift. Continental Drift. Continental Drift. Continental Drift- Wegener s Evidence
 Continental Drift PLATE TECTONICS E.B. Taylor (1910) and Alfred Wegener (1915) published on Continental Drift. Continental Drift Wegener s evidence 1. Fit of the Continents 2. Fossil Evidence 3. Rock Type
Deformation in transcurrent and extensional environments with widely spaced weak zones 1
 7 Chapter 2 Deformation in transcurrent and extensional environments with widely spaced weak zones 1 2.1 Abstract Previous mechanical models of the western U.S. have concluded that plate boundary forces
Broad-band ambient noise surface wave tomography across the United States
 JOURNAL OF GEOPHYSICAL RESEARCH, VOL.???, XXXX, DOI:10.1029/, Broad-band ambient noise surface wave tomography across the United States G. D. Bensen Center for Imaging the Earth s Interior, Department
Downloaded 08/29/13 to Redistribution subject to SEG license or copyright; see Terms of Use at
 Large-scale 3D integral equation based inversion of EarthScope MT data using a variable sensitivity domain Martin Čuma*, Michael S. Zhdanov and Alexander V. Gribenko, University of Utah and TechnoImaging
Continent-sized anomalous zones with low seismic velocity at the base of Earth s mantle
 SUPPLEMENTARY INFORMATION DOI: 10.1038/NGEO2733 Continent-sized anomalous zones with low seismic velocity at the base of Earth s mantle Edward J. Garnero 1, Allen K. McNamara 1, and Sang-Heon D. Shim 1
ANOTHER MEXICAN EARTHQUAKE! Magnitude 7.1, Tuesday Sept. 19, 2017
 ANOTHER MEXICAN EARTHQUAKE! Magnitude 7.1, Tuesday Sept. 19, 2017 Why is there no oceanic crust older than 200 million years? SUBDUCTION If new oceanic crust is being continuously created along the earth
Geology 101 Reading Guide for Plate Tectonics
 Geology 101 Reading Guide for Plate Tectonics Name The readings for plate tectonics will be in four different chapters: 2, 4, 10 and 11. If you have questions, please let me know. Chapter 2: Plate Tectonics:
10. Paleomagnetism and Polar Wandering Curves.
 Map of ocean floor Evidence in Support of the Theory of Plate Tectonics 10. Paleomagnetism and Polar Wandering Curves. The Earth's magnetic field behaves as if there were a bar magnet in the center of
Distinctive upper mantle anisotropy beneath the High Lava Plains and Eastern Snake River Plain, Pacific Northwest, USA
 Article Volume 14, Number 10 21 October 2013 doi: ISSN: 1525-2027 Distinctive upper mantle anisotropy beneath the High Lava Plains and Eastern Snake River Plain, Pacific Northwest, USA Lara S. Wagner Department
29th Monitoring Research Review: Ground-Based Nuclear Explosion Monitoring Technologies
 SHORT PERIOD SURFACE WAVE DISPERSION ACROSS THE MEDITERRANEAN REGION: IMPROVEMENTS USING REGIONAL SEISMIC NETWORKS Michael H. Ritzwoller 1, Yingjie Yang 1, Rachelle M. Richmond 1, Michael E. Pasyanos 2,
Plate Tectonics. Essentials of Geology, 11 th edition Chapter 15
 1 Plate Tectonics Essentials of Geology, 11 th edition Chapter 15 2 3 4 5 6 7 8 9 10 11 12 13 14 15 Plate Tectonics: summary in haiku form Alfred Wegener gave us Continental Drift. Fifty years later...
COMPUTATION OF REGIONAL TRAVEL TIMES AND STATION CORRECTIONS FROM THREE-DIMENSIONAL VELOCITY MODELS
 COMPUTATION OF REGIONAL TRAVEL TIMES AND STATION CORRECTIONS FROM THREE-DIMENSIONAL VELOCITY MODELS A. Villaseñor 1,2, M.P. Barmin 1, M.H. Ritzwoller 1, and A.L. Levshin 1 1 Department of Physics, University
Questions and Topics
 Plate Tectonics and Continental Drift Questions and Topics 1. What are the theories of Plate Tectonics and Continental Drift? 2. What is the evidence that Continents move? 3. What are the forces that
PLATE TECTONIC PROCESSES
 Lab 9 Name Sec PLATE TECTONIC PROCESSES 1. Fill in the blank spaces on the chart with the correct answers. Refer to figures 2.3, 2.4 p.33 (2.2 and 2.3 on p. 23) as needed. 2. With your knowledge of different
Mantle Transition Zone Topography and Structure Beneath the Yellowstone Hotspot
 University of Wyoming Wyoming Scholars Repository Geology and Geophysics Faculty Publications Geology and Geophysics 9-17-2004 Mantle Transition Zone Topography and Structure Beneath the Yellowstone Hotspot
A 3-D model of the crust and uppermost mantle beneath the Central and Western US by joint inversion of receiver functions and surface wave dispersion
 JOURNAL OF GEOPHYSICAL RESEARCH: SOLID EARTH, VOL. 118, 1 15, doi:1.129/212jb962, 213 A 3-D model of the crust and uppermost mantle beneath the Central and Western US by joint inversion of receiver functions
Earth and Planetary Science Letters
 Earth and Planetary Science Letters 288 (2009) 359 369 Contents lists available at ScienceDirect Earth and Planetary Science Letters journal homepage: www.elsevier.com/locate/epsl Shear wave splitting
Geophysical Journal International. Joint inversion of surface wave dispersion and receiver functions: A Bayesian Monte-Carlo approach
 Joint inversion of surface wave dispersion and receiver functions: A Bayesian Monte-Carlo approach Journal: Geophysical Journal International Manuscript ID: GJI-S--0.R Manuscript Type: Research Paper Date
Whole Earth Structure and Plate Tectonics
 Whole Earth Structure and Plate Tectonics Processes in Structural Geology & Tectonics Ben van der Pluijm WW Norton+Authors, unless noted otherwise 4/5/2017 14:45 We Discuss Whole Earth Structure and Plate
Global variation of body wave attenuation in the upper mantle from teleseismic P wave and S wave spectra
 GEOPHYSICAL RESEARCH LETTERS, VOL. 38,, doi:10.1029/2011gl046812, 2011 Global variation of body wave attenuation in the upper mantle from teleseismic P wave and S wave spectra Y. K. Hwang, 1 J. Ritsema,
NC Earth Science Essential Standards
 NC Earth Science Essential Standards EEn. 2.1 Explain how processes and forces affect the Lithosphere. EEn. 2.1.1 Explain how the rock cycle, plate tectonics, volcanoes, and earthquakes impact the Lithosphere.
SUPPLEMENTARY INFORMATION
 The major uncertainties in our model predictions arise from the input parameters, which include mantle density models (i.e. seismic tomography and choices about scaling velocities to temperature), crustal
OCN 201: Seafloor Spreading and Plate Tectonics I
 OCN 201: Seafloor Spreading and Plate Tectonics I Revival of Continental Drift Theory Kiyoo Wadati (1935) speculated that earthquakes and volcanoes may be associated with continental drift. Hugo Benioff
Cenozoic Earth History I
 Cenozoic Earth History I Cenozoic plate tectonics Tertiary, Quaternary, Paleogene, Neogene Tejas Transgression North America s east coast geology Laramide Orogeny Post-Laramide mountain building and volcanism
The High Lava Plains Project: Understanding the Causes of Continental Intraplate Tectonomagmatism
 The High Lava Plains Project: Understanding the Causes of Continental Intraplate Tectonomagmatism The High Lava Plains (HLP) of the northwestern USA is one of the most accessible yet least understood examples
UNIT 6 PLATE TECTONICS
 UNIT 6 PLATE TECTONICS CONTINENTAL DRIFT Alfred Wegner proposed the theory that the crustal plates are moving over the mantle. He argued that today s continents once formed a single landmass, called Pangaea
Evidence from the Surface. Chapter 02. Continental Drift. Fossil Evidence for Pangaea. Seafloor Spreading. Seafloor Spreading 1/31/2012
 Evidence from the Surface Surface landforms Continental shelf and slope Abyssal Plane Mid-oceanic ridge Oceanic Trenches Chapter 02 Continental Drift Continental Drift - a hypothesis that the continents
Topics Laramide Orogeny: Late Cretaceous to Early Eocene Reading: GSA DNAG volume 3, Ch. 6
 Topics Laramide Orogeny: Late Cretaceous to Early Eocene Reading: GSA DNAG volume 3, Ch. 6 Late Cretaceous to early Eocene New patterns developed 5 main regions Tectonic interpretations Post-Laramide events
Geophysical Journal International
 Geophysical Journal International Geophys. J. Int. (2014) 198, 1504 1513 GJI Seismology doi: 10.1093/gji/ggu215 High-resolution phase-velocity maps using data from an earthquake recorded at regional distances
24th Seismic Research Review Nuclear Explosion Monitoring: Innovation and Integration
 A REFERENCE DATA SET FOR VALIDATING 3-D MODELS E. R. Engdahl, Eric A. Bergman, Michael H. Ritzwoller, Nikolai M. Shapiro and Anatoli L. Levshin University of Colorado, Boulder Sponsored by Defense Threat
Geophysical Journal International
 Geophysical Journal International Geophys. J. Int. (2011) doi: 10.1111/j.1365-246X.2011.05100.x Apparent anisotropy in inhomogeneous isotropic media Fan-Chi Lin and Michael H. Ritzwoller Center for Imaging
Plate Tectonics. By Destiny, Jarrek, Kaidence, and Autumn
 Plate Tectonics By Destiny, Jarrek, Kaidence, and Autumn .The Denali Fault and San Andreas Fault - The San Andreas Fault is a continental transform fault that extends roughly 1300 km (810 miles) through