Continent-sized anomalous zones with low seismic velocity at the base of Earth s mantle
|
|
|
- Felix Robbins
- 5 years ago
- Views:
Transcription
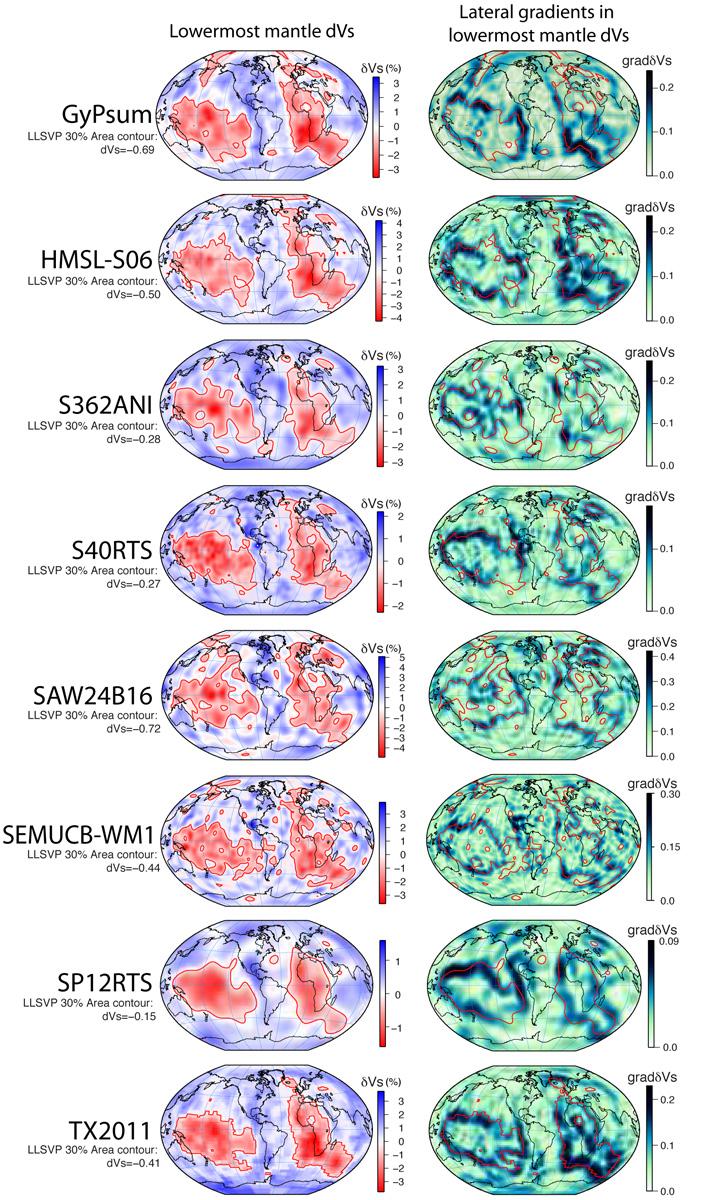
1 SUPPLEMENTARY INFORMATION DOI: /NGEO2733 Continent-sized anomalous zones with low seismic velocity at the base of Earth s mantle Edward J. Garnero 1, Allen K. McNamara 1, and Sang-Heon D. Shim 1 1 School of Earth and Space Exploration, Arizona State University, Tempe AZ, USA In this paper, we discuss large low velocity provinces (LLVPs) in Earth s lowermost mantle, explore their dynamics and possible composition, and consider evolutionary scenarios. The question of thermochemical piles as the origin to LLVPs is important, as it forms the foundation for our understanding of the thermal state of the mantle, the thermal and chemical evolution of Earth s interior, the dynamics and geochemical significance of mantle plumes, and link to the driving forces causing plate tectonics. This supplementary material presents additional figures to support discussions presented in the main text. Supplementary Figure S1 presents a number of tomography models, and compares details of LLSVPs, in particular, for 30% of the core-mantle boundary s (CMB s) area. For each model, the specific shear velocity reduction which, when a contour is computed, surrounds 30% of the CMB s area, is determined (and listed to the left of the models in Figure S1). The similarity among models of the long wavelength character of LLSVPs is striking. However, when scale lengths smaller than LLSVP dimensions are considered, significant variability (differences) among models is present (right column, Figure S1). This is not unexpected, given that different models use different methods and data. Resolution from region to region is typically non-uniform in NATURE GEOSCIENCE 1
2 2 the tomographic approach. For example, Earth s southern hemisphere is significantly more poorly sampled 101. Figure S3 shows the locations where forward modeling studies have mapped strong changes in Vs occurring over short lateral distances, such as < 100 km. These are considered sharp in comparison to smoothly varying tomographically derived velocities. We consider a related comparison of the first 8 tomographic models of Figure S1. We compare the lowest shear velocities in each model that occupy a defined percent of the CMB s area, and then we count the number of models having those lowest velocities in 1 1 cells (Figure S2). When mapping the 10% of the CMB s area containing the lowest velocities in tomography models (top panel in Figure S2), we find that these regions are generally correlated with the interior of 30% area LLSVPs (red contours in Figure S1), with some geographical differences. For greater area percentages of the CMB (e.g., 20, 30, 40, and 50% areas, the other panels in Figure S2), a larger area of similarity between models is present, but differences in the perimeters of the low velocities are readily apparent. These differences are highlighted for the 30% area LLSVPs in Figure 1c (in the main text). The vertical extent of LLSVP low velocities varies from model to model (in both forward and inverse modeling), and depends on assumptions of the velocity value associated with their margins. Though, analyses of the depth distribution of shear velocity heterogeneity (δv S ) over the bottom 1800 km of the mantle (averaged laterally in 4 4 cells) show strong similarity between models in their geographic distribution of their high-versus-low velocity clusters over that depth range 2.
3 3 Lateral gradients in the shear velocity perturbation maps were computed. Gradients were measured by computing the change in shear velocity over different lateral distances (from 3 to 10 degrees, which at the CMB corresponds to ~182 km and ~607 km, respectively). We display the amplitude of the gradient field for 10 degree measurement length in Figure S5. The strongest gradients are most commonly associated with the margins of LLSVPs. This is consistent with abrupt changes in shear velocity at those locations (and the thermochemical pile hypothesis). A time snapshot from the geodynamic calculations of Li et al. (2014) (ref. 19) is explored in Figure S6. Composition and temperature fields are shown for a calculation with distinct thermochemical pile material, former oceanic crust material, and background mantle material. The zoomed in panels show that crust can enter the piles and add to compositional complexities, and that the temperature variability within thermochemical piles can be strong, which might be an explanation for observed seismic heterogeneity within LLSVPs. While the details depend strongly on model assumptions, we expect a similar result that thermal and potentially chemical heterogeneity can persist within thermochemical piles, especially over long time periods.
4 4 Additional References 101. Simmons, N. A., Forte, A., Boschi, L. & Grand, S. P. GyPSuM: a joint tomographic model of mantle density and seismic wave speeds. J. Geophys. Res. 115, B12310 (2010) Houser, C., Masters, G., Shearer, P. & Laske, G. Shear and compressional velocity models of the mantle from cluster analysis of long-period waveforms. Geophys. J. Int. 174, (2008) Kustowski, B., Ekstrom, G. & Dziewonski, A. M. Anisotropic shear-wave velocity structure of the Earth s mantle: a global model. J. Geophys. Res. 113, B06306 (2008) Mégnin, C., & Romanowicz, B. The shear velocity structure of the mantle from the inversion of body, surface, and higher modes waveforms. Geophys. J. Int. 143, (2000) Grand, S. P. Mantle shear wave tomography and the fate of subducted slabs. Phil. Trans. R. Soc. Lond. A 360, (2002) Becker, T. W. & Boschi, L. A comparison of tomographic and geodynamic mantle models. Geochem. Geophys. Geosyst. 3, 2001GC (2002) Bréger, L. & Romanowicz, B. Thermal and chemical 3D heterogeneity in D. Science 282, (1998) Luo, S., Ni, S., & Helmberger, D. V. Evidence for a sharp lateral variation of velocity at the core mantle boundary from multipathed PKPab. Earth Planet. Sci. Lett., 189, (2001) Ni, S., Tan, E., Gurnis, M. & Helmberger, D. V. Sharp Sides to the African Superplume. Science 296, (2002) Ni, S. & Helmberger, D. V. Further constraints on the African superplume structure. Phys. Earth Planet. Int. 140, (2003) Ni, S. & Helmberger, D. V. Ridge-like lower mantle structure beneath South Africa. J. Geophys. Res. 108, 2094 (2003) Ni, S. & Helmberger, D. V. Seismological constraints on the South African superplume: could be the oldest distinct structure on Earth. Earth Planet. Sci. Lett. 206, (2003) Ni, S., Helmberger, D. V. & Tromp, J. Three-dimensional structure of the African superplume from waveform modeling. Geophys. J. Int. 161, (2005) Wang, Y. & Wen, L. Mapping the geometry and geographic distribution of a verylow velocity province at the base of the Earth's mantle. J. Geophys. Res. 109, B10305 (2004) To, A., Romanowicz, B., Capdeville, Y. & N. Takeuchi. 3D effects of sharp boundaries at the borders of the African and Pacific Superplumes: Observation and modeling. Earth Planet. Sci. Lett. 233, (2005) He, Y., Wen, L. & Zheng, T. Geographic boundary and shear wave velocity structure of the Pacific anomaly near the core mantle boundary beneath western Pacific. Earth Planet. Sci. Lett. 244, (2006) Ford, S. R., Garnero, E. J. & McNamara, A. K. A strong lateral shear velocity gradient and anisotropy heterogeneity in the lowermost mantle beneath the southern Pacific. J. Geophys. Res. 111, 1-14 (2006).
5 Sun, D., Tan, E., Helmberger, D. V. & M. Gurnis. Seismological support for the metastable superplume model, sharp features, and phase changes within the lower mantle. Proc. Natl. Acad. Sci. 104, (2007) Sun, D., Helmberger, D. V., Ni, S. & Bower, D. Direct measures of lateral velocity variation in the deep Earth. J. Geophys. Res. 114, 1-18 (2009) He, Y. & Wen, L. Structural features and shear-velocity structure of the Pacific Anomaly. J. Geophys. Res. 114, B02309 (2009).
, S362ANI (ref. 103), S40RTS (ref. 1), SAW24B16 (ref. 104), SEMUCB-WM1 (ref. 8), SP12RTS (ref. 4), TX2011 (ref. 105)), and SMEAN, an average of models (ref.")
6 6 Figure S1 Comparison of tomography model lowermost mantle velocities. (All scale bars in % δvs). For 8 tomographic models (GyPsum (ref. 101), HML-S06 (ref. 102), S362ANI (ref. 103), S40RTS (ref. 1), SAW24B16 (ref. 104), SEMUCB-WM1 (ref. 8), SP12RTS (ref. 4), TX2011 (ref. 105)), and SMEAN, an average of models (ref. 106), the
7 7 lowest 200 km depth in each model is plotted. In the left column, the color scale extremes correspond to each model s extremes in high (blue) and low (red) shear velocity perturbations. A red contour is drawn at a velocity level for each model that surrounds 30% of the CMB containing the lowest shear velocities. Thus, the same CMB area (30%) is contoured for each model. The velocity reduction value that this corresponds to is shown on the left for each model. The middle column is the same as the left column, except the color scales are the same for all model renderings, and set at +/- 5%, to show the amplitude differences between models. In the right column, only the area within the red contours of the left columns is considered (i.e., the 30% area LLSVPs), and the color scale is chosen to highlight shear velocity heterogeneity within LLSVPs for the CMB area coverage (again, 30%). The intermediate and small scale LLSVP heterogeneity differs from model to model.

8 8 Figure S2 Comparison of tomography model lowest velocity regions for specific CMB areas of coverage. For the first 8 tomographic models shown in Figure S1, the lowest velocities in each model are considered according to specific percentages of the area of the CMB. The CMB is gridded into 1 1 cells, and models with lowest velocities
9 9 (for given CMB areas of consideration) are counted in all cells, and displayed in vote maps. Since 8 models are considered, a black color (as in the color scale) represents an area where all 8 models have some part of their lowest velocities at that location. Conversely, the color gray indicates that no model had its lowest velocities at that location, for the amount of LLSVP area considered. Five lowest velocity areas are considered 10, 20, 30, 40, and 50%.
 107, Luo et al. (2001) 108, Ni & Helmberger (2003abc) and Ni et al. (2002, 2005) 109-112, Wang & Wen (2004, 2007) 24,114, To et al.")
10 10 Figure S3 Locations of sharp LLSVP edges. Waveform and travel time studies have presented evidence for sharp transitions in shear velocity at the margins of LLSVPs. The studies listed are Breger & Romanowicz (1998) 107, Luo et al. (2001) 108, Ni & Helmberger (2003abc) and Ni et al. (2002, 2005) , Wang & Wen (2004, 2007) 24,114, To et al. (2005)115, He et al. (2006)116, Ford et al. (2006) 117, Sun et al. (2007, 2009) 118,119, He & Wen (2009,2012) 5,120, Lekic et al. (2012) 2, Sun & Miller (2013) 10, Zhao et al. (2015) 9, and Yumei He (2006, personal comm.).
 and S-wave (orange) LLVPs are displayed for 3 tomography studies that simultaneously inverted for Vp and Vs: SP12RTS (ref.")
11 11 Figure S4 Comparison of P-wave and S-wave LLVPs. The lowermost mantle velocity reductions for both P-wave (green) and S-wave (orange) LLVPs are displayed for 3 tomography studies that simultaneously inverted for Vp and Vs: SP12RTS (ref. 4), GyPsum (ref. 101), HMSL (ref. 102), and an average of P and S models, from PMEAN and SMEAN (ref. 106). LLVPs that occupy 30% of the CMB s area is displayed.
12 12
13 13 Figure S5 Comparison of tomography model LLSVPs and strongest lateral gradients (previous page). (Left column) As with the left column in Figure S1, the shear velocity perturbations are shown in the lowest 200 km of the mantle, for 8 tomography models. The color scale is set for each model s extreme high or low shear velocities. The LLSVP contour is drawn for the 30% CMB area level. (Right column) Lateral gradients in the shear velocity perturbation field are plotted, where the darkest colors correspond to strongest gradients. The color scale for each model is different, and set by that model s maximum gradient. The LLSVP contour from the left column is reproduced on the gradient field, and shows the strongest gradients are commonly at the 30% area LLSVP margins. The maximum lateral gradient is computed over a 10 degree lateral length at every 1 deg by 1 deg location, which is plotted.
19 the dynamics, composition, and temperature are shown for a 3 chemistry system: a thermochemical reservoir at the base of the mantle ( R ), former basaltic oceanic crust ( C ), and background")
14 14 Figure S6 Predictions of internal structure of thermochemical piles. From the calculations of Li et al. (2014)19 the dynamics, composition, and temperature are shown for a 3 chemistry system: a thermochemical reservoir at the base of the mantle ( R ), former basaltic oceanic crust ( C ), and background mantle ( M ). a, The compositional field is displayed for a time snapshot with thermochemical piles (turquoise color) well developed. Former oceanic crust (yellow color) is well mixed into the mantle (black color is the mantle), and has also been downward entrained into the piles. b, The temperature field for the time snapshot of a is shown. Panels c and d correspond to the zoom boxes in a and b, and show the composition and temperature. The temperature field in d is modified to show a complete color scale just within the thermochemical pile to highlight internal convection. The pile margin based on chemistry is indicated by the black line; flow directions are indicated by the arrows. For this example, the temperature field between.7 and 1 is colorized, with the rest plotted as gray.
Supplementary Online Material for. Seismic evidence for a chemically distinct thermochemical reservoir in Earth s deep mantle beneath Hawaii
 Supplementary Online Material for Seismic evidence for a chemically distinct thermochemical reservoir in Earth s deep mantle beneath Hawaii Authors: Chunpeng Zhao 1, Edward J. Garnero 1,*, Allen K. McNamara
Possible reservoirs of radioactivity in the deep mantle. Ed Garnero School of Earth and Space Exploration Arizona State University
 Possible reservoirs of radioactivity in the deep mantle Ed Garnero School of Earth and Space Exploration Arizona State University Outline Brief overview: motivation for investigating interiors; how seismology
Lower Mantle Structure & Geo-neutrinos
 Lower Mantle Structure & Geo-neutrinos Geo-neutrino working group meeting, KITP July 1 st, 2014 Vedran Lekic University of Maryland, College Park + Sanne Cottaar (Cambridge) + Edwin Kite (Princeton / U
Thorne, Garnero, Jahnke, Igel, McNamara Supplementary Material - 1 -
 Supplementary Material S1. Bin Location Map Location of 2.5 2.5 bins for which data was obtained to infer the ULVZ distribution. The preferred ULVZ model is drawn (yellow areas). Gray shaded regions indicate
Seismic anisotropy in the lowermost mantle near the Perm Anomaly
 1 2 3 4 5 6 7 8 9 10 11 12 13 14 15 16 17 18 19 20 21 22 23 Seismic anisotropy in the lowermost mantle near the Perm Anomaly Maureen D. Long* and Colton Lynner Department of Geology and Geophysics, Yale
Earth and Planetary Science Letters
 Earth and Planetary Science Letters 319-32 (212) 55 64 Contents lists available at SciVerse ScienceDirect Earth and Planetary Science Letters journal homepage: www.elsevier.com/locate/epsl Detection of
Physics of the Earth and Planetary Interiors
 Physics of the Earth and Planetary Interiors 176 (2009) 187 197 Contents lists available at ScienceDirect Physics of the Earth and Planetary Interiors journal h o mepage: www. e lsevier. com/ l o cate/
Structural features and shear-velocity structure of the Pacific Anomaly. Lianxing Wen a. Yumei He a,b
 Structural features and shear-velocity structure of the Pacific Anomaly Yumei He a,b Lianxing Wen a a Department of Geosciences, State University of New York at Stony Brook, Stony Brook, New York, USA
The Earth is Red; Dominance of large wavelength features in mantle boundary layers. Adam M. Dziewonski
 The Earth is Red; Dominance of large wavelength features in mantle boundary layers Adam M. Dziewonski KITP, EARTH08, July 2, 2008 Kircher, 1665 Imagining ca. Earth s 2005 Interior from E. Garnero s files
Figures S1 S4 show the measurements taken from the synthetic vespagrams where a)
") Figures S1 S4 show the measurements taken from the synthetic vespagrams where a) is the differential travel time versus the Dʺ discontinuity height, b) is the differential travel time versus δv S, c) is
Figures S1 S4 show the measurements taken from the synthetic vespagrams where a) is the differential travel time versus the Dʺ discontinuity height, b) is the differential travel time versus δv S, c) is
Peer Reviewed Publications
 Peer Reviewed Publications Moucha, R., A. M. Forte, D. B. Rowley, J. X. Mitrovica, N. A. Simmons, and S. P. Grand (2009),Deep mantle forces and the uplift of the Colorado Plateau,Geophys. Res. Lett., doi:10.1029/2009gl039778,
Three-dimensional structure of the African superplume from waveform modelling
 Geophys. J. Int. (5) 161, 283 294 doi: 1.1111/j.1365-X.5.258.x Three-dimensional structure of the African superplume from waveform modelling Sidao Ni, 1,2 Don V. Helmberger 2 and Jeroen Tromp 2 1 School
3D IMAGING OF THE EARTH S MANTLE: FROM SLABS TO PLUMES
 3D IMAGING OF THE EARTH S MANTLE: FROM SLABS TO PLUMES Barbara Romanowicz Department of Earth and Planetary Science, U. C. Berkeley Dr. Barbara Romanowicz, UC Berkeley (KITP Colloquium 9/11/02) 1 Cartoon
C3.4.1 Vertical (radial) variations in mantle structure
 variations in mantle structure") C3.4 Mantle structure Mantle behaves as a solid on short time scales (seismic waves travel through it and this requires elastic behaviour). Over geological time scales the mantle behaves as a very viscous
C3.4 Mantle structure Mantle behaves as a solid on short time scales (seismic waves travel through it and this requires elastic behaviour). Over geological time scales the mantle behaves as a very viscous
Mantle plumes as presently imaged by seismic tomography. Barbara Romanowicz 1,2
 Mantle plumes as presently imaged by seismic tomography Barbara Romanowicz 1,2 1 Collège de France, Paris 2 Univ. of California, Berkeley Contributors: V. Lekic, S. French, S. Cottaar, Kaiqing Yuan Collège
Vertical coherence in mantle heterogeneity from global seismic data
 GEOPHYSICAL RESEARCH LETTERS, VOL. 38,, doi:10.1029/2011gl049281, 2011 Vertical coherence in mantle heterogeneity from global seismic data L. Boschi 1,2 and T. W. Becker 3 Received 11 August 2011; revised
Earth and Planetary Science Letters
 Earth and Planetary Science Letters 353-354 (2012) 253 269 Contents lists available at SciVerse ScienceDirect Earth and Planetary Science Letters journal homepage: www.elsevier.com/locate/epsl Reconciling
The difficulty for subducted oceanic crust to accumulate at the Earth s core-mantle boundary
 JOURNAL OF GEOPHYSICAL RESEARCH: SOLID EARTH, VOL. 118, 1 10, doi:10.1002/jgrb.50156, 2013 The difficulty for subducted oceanic crust to accumulate at the Earth s core-mantle boundary Mingming Li 1 and
SUPPLEMENTARY INFORMATION
 DOI: 1.138/NGEO1521 Possible links between long-term geomagnetic variations and whole-mantle convection processes Biggin, A.J., Steinberger, B., Aubert, J., Suttie, N., Holme, R., Torsvik, T.H., van der
Supplementary Material for. Mantle induced subsidence and compression in SE Asia
 Supplementary Material for Mantle induced subsidence and compression in SE Asia Ting Yang 1 *, Michael Gurnis 1, Sabin Zahirovic 2 1 Seismological Laboratory, California Institute of Technology, Pasadena,
Continent-sized anomalous zones with low seismic velocity at the base of Earth s mantle
 REVIEW ARTICLE PUBLISHED ONLINE: 20 JUNE 2016 DOI: Continent-sized anomalous zones with low seismic velocity at the base of Earth s mantle Edward J. Garnero*, Allen K. McNamara and Sang-Heon Shim Seismic
Influence of thermochemical piles on topography at Earth's core mantle boundary
 Earth and Planetary Science Letters 261 (2007) 443 455 www.elsevier.com/locate/epsl Influence of thermochemical piles on topography at Earth's core mantle boundary Teresa Mae Lassak a,, Allen K. McNamara
On the Statistical Distribution of Seismic Velocities in Earth s Deep Mantle
 Hernlund and Houser, submitted to EPSL, 2007 1 On the Statistical Distribution of Seismic Velocities in Earth s Deep Mantle John W. Hernlund 1,2, and Christine Houser 3 1 Institut de Physique du Globe
University of Colorado Boulder Phone: (480)
") Mingming Li University of Colorado Boulder Phone: (480) 280-4695 Duan F737 Email: Mingming.Li.Geo@gmail.com Department of Physics 390 UCB Homepage: ciei.colorado.edu/~mli Boulder, CO 80309-0390 Research
Mingming Li University of Colorado Boulder Phone: (480) 280-4695 Duan F737 Email: Mingming.Li.Geo@gmail.com Department of Physics 390 UCB Homepage: ciei.colorado.edu/~mli Boulder, CO 80309-0390 Research
Seismological constraints on the South African superplume; could be the oldest distinct structure on earth
 Earth and Planetary Science Letters 206 (2003) 119^131 www.elsevier.com/locate/epsl Seismological constraints on the South African superplume; could be the oldest distinct structure on earth Sidao Ni,
Geographic boundary and shear wave velocity structure of the Pacific anomaly near the core mantle boundary beneath western Pacific
 Earth and Planetary Science Letters 244 (2006) 302 314 www.elsevier.com/locate/epsl Geographic boundary and shear wave velocity structure of the Pacific anomaly near the core mantle boundary beneath western
Supporting Online Material for
 www.sciencemag.org/cgi/content/full/326/5949/112/dc1 Supporting Online Material for Global Surface Wave Tomography Using Seismic Hum Kiwamu Nishida,* Jean-Paul Montagner, Hitoshi Kawakatsu *To whom correspondence
Global surface-wave tomography
 Global surface-wave tomography Lapo Boschi (lapo@erdw.ethz.ch) October 7, 2009 Love and Rayleigh waves, radial anisotropy Whenever an elastic medium is bounded by a free surface, coherent waves arise that
SUPPLEMENTARY INFORMATION
 The major uncertainties in our model predictions arise from the input parameters, which include mantle density models (i.e. seismic tomography and choices about scaling velocities to temperature), crustal
Tomography of core-mantle boundary and lowermost mantle coupled by geodynamics: joint models of shear and compressional velocity
 1 2 3 4 5 6 7 8 9 10 11 12 Tomography of core-mantle boundary and lowermost mantle coupled by geodynamics: joint models of shear and compressional velocity Gaia Soldati 1, Lapo Boschi 2,3, Steve Della
Some aspects of seismic tomography
 Some aspects of seismic tomography Peter Shearer IGPP/SIO/U.C. San Diego September 7, 2009 Earthquake Research Institute Part 1: Global Tomography P velocity perturbations 200 km 1000 km 2700 km MIT 2006
SP12RTS: a degree-12 model of shear- and compressional-wave. velocity for Earth s mantle
 submitted to Geophys. J. Int. SP12RTS: a degree-12 model of shear- and compressional-wave velocity for Earth s mantle P. Koelemeijer 1,2, J. Ritsema 3, A. Deuss 4, & H.-J. van Heijst 5 1 Bullard Laboratories,
Chapter 15 Large-Scale Thermo-chemical Structure of the Deep Mantle: Observations and Models
 Chapter 15 Large-Scale Thermo-chemical Structure of the Deep Mantle: Observations and Models Frédéric Deschamps, Yang Li and P.J. Tackley Abstract Seismic tomography indicates that the lowermost mantle,
SUPPLEMENTARY INFORMATION
 SUPPLEMENTARY INFORMATION Seismic evidence for a global low velocity layer within the Earth s upper mantle SUPPLEMENTARY MATERIAL Benoît Tauzin 1, Eric Debayle 2 & Gérard Wittlinger 3 1 Department of Earth
Lithospheric Rheology and Stress, Dynamics of Plate Tectonics, and Long-wavelength Mantle Convection
 Lithospheric Rheology and Stress, Dynamics of Plate Tectonics, and Long-wavelength Mantle Convection Shijie Zhong and Xi Liu Dept. of Physics, University of Colorado Boulder, Colorado, USA A. B. Watts,
4-D Geodynamic Modeling With Data Assimilation: Subduction and Continental Evolution
 4-D Geodynamic Modeling With Data Assimilation: Subduction and Continental Evolution PI: Lijun Liu Department of Geology, University of Illinois at Urbana-Champaign Corresponding author: Lijun Liu, ljliu@illinois.edu
The Earth s Structure from Travel Times
 from Travel Times Spherically symmetric structure: PREM - Crustal Structure - Upper Mantle structure Phase transitions Anisotropy - Lower Mantle Structure D D - Structure of of the Outer and Inner Core
Supporting Information for An automatically updated S-wave model of the upper mantle and the depth extent of azimuthal anisotropy
 GEOPHYSICAL RESEARCH LETTERS Supporting Information for An automatically updated S-wave model of the upper mantle and the depth extent of azimuthal anisotropy Eric Debayle 1, Fabien Dubuffet 1 and Stéphanie
Dynamic Subsidence and Uplift of the Colorado Plateau. Supplementary Material
 GSA DATA REPOSITORY 2010177 Liu and Gurnis Dynamic Subsidence and Uplift of the Colorado Plateau Supplementary Material Lijun Liu and Michael Gurnis Seismological Laboratory California Institute of Technology
Implications of lower-mantle structural heterogeneity for existence and nature of whole-mantle plumes
 The Geological Society of America Special Paper 430 2007 Implications of lower-mantle structural heterogeneity for existence and nature of whole-mantle plumes Edward J. Garnero School of Earth and Space
Icelandic Lithosphere & Upper Mantle Structure. Natalia Solomatova
 Icelandic Lithosphere & Upper Mantle Structure Natalia Solomatova Location of Iceland maps.google.com Lithosphere Thickness Anomalously thick lithosphere beneath Greenland and Baltic shield may be due
Chemical Heterogeneity in the Mantle: Inferences from Seismology, Mineral Physics and Geodynamics
 Chemical Heterogeneity in the Mantle: Inferences from Seismology, Mineral Physics and Geodynamics Jeannot Trampert (Utrecht University), Frederic Deschamps (ETH Zurich), Paul Tackley (ETH Zurich) Probabilistic
SURFACE WAVE GROUP VELOCITY MEASUREMENTS ACROSS EURASIA
 SURFACE WAVE GROUP VELOCITY MEASUREMENTS ACROSS EURASIA A. L. Levshin, M. H. Ritzwoller, and L. I. Ratnikova Department of Physics, University of Colorado at Boulder -Contract Number F49620-95-1-0139 Sponsored
The Earth s crustal structure is amazingly complex, consisting of
 Deep mantle structure and the postperovskite phase transition D. Helmberger*, T. Lay, S. Ni*, and M. Gurnis* *Seismological Laboratory, California Institute of Technology, Pasadena, CA 91125; and Department
Slabs, plumes and their interaction: new insights from global anisotropy tomography
 Slabs, plumes and their interaction: new insights from global anisotropy tomography Ana M G Ferreira Seismological Laboratory, Department of Earth Sciences University College London, UK Sung-Joon Chang,
Recent Advances and Road Ahead for Global Seismology
 Long Range Science Plan for Seismology, Denver, 18-19 September 2008 Recent Advances and Road Ahead for Global Seismology (Opportunities and Challenges for Next Decade) Rob van der Hilst Massachusetts
Seismology 5: Body wave anisotropy
 Seismology 5: Body wave anisotropy what it is, how we study it, and what it can tell us about flow in the deep Earth Maureen D. Long, Yale University CIDER 7/8/16 Road map for today s talk Part I: Some
Edge Driven Convection and Iceland
 Edge Driven Convection and Iceland Scott D. King Department of Earth and Atmospheric Sciences Purdue University, West Lafayette, Indiana One of the alternative hypotheses for hotspot volcanism is Edge-Driven
Nathan A. Simmons Lawrence Livermore National Laboratory, California Alessandro M. Forte Université du Québec à Montréal Lapo Boschi
 Nathan A. Simmons Lawrence Livermore National Laboratory, California Alessandro M. Forte Université du Québec à Montréal Lapo Boschi ETH Zurich Stephen P. Grand University of Texas at Austin LLNL-PRES-598995
(This is a sample cover image for this issue. The actual cover is not yet available at this time.)
") (This is a sample cover image for this issue. The actual cover is not yet available at this time.) This article appeared in a journal published by Elsevier. The attached copy is furnished to the author
(This is a sample cover image for this issue. The actual cover is not yet available at this time.) This article appeared in a journal published by Elsevier. The attached copy is furnished to the author
1. University of Ottawa 2. Dublin Institute for Advanced Studies 3. University of Texas at Austin
 Supplementary Figures: Azimuthal seismic anisotropy in the Earth s upper mantle and the thickness of tectonic plates A.J. Schaeffer 1, S. Lebedev 2 and T.W. Becker 3 Geophysical Journal International July
Seismology and Deep Mantle Temperature Structure. Thorne Lay
 Seismology and Deep Mantle Temperature Structure Thorne Lay Travel time of seismic phases vs. angular distance PREM Preliminary Reference Earth Model Dziewonski and Anderson [1981, PEPI] Basic fact:
Supplementary Figure 1. Distribution of seismic event locations determined using the final 3-D velocity model. We separate the crust-related
 Supplementary Figure 1. Distribution of seismic event locations determined using the final 3-D velocity model. We separate the crust-related seismicity at depths of less than 40 km (panel A) from the deeper
Geographic correlation between hot spots and deep mantle lateral shear-wave velocity gradients
 Physics of the Earth and Planetary Interiors 146 (2004) 47 63 Geographic correlation between hot spots and deep mantle lateral shear-wave velocity gradients Michael S. Thorne a,, Edward J. Garnero a, Stephen
(This is a sample cover image for this issue. The actual cover is not yet available at this time.)
") (This is a sample cover image for this issue. The actual cover is not yet available at this time.) This article appeared in a journal published by Elsevier. The attached copy is furnished to the author
(This is a sample cover image for this issue. The actual cover is not yet available at this time.) This article appeared in a journal published by Elsevier. The attached copy is furnished to the author
Seismic ray path variations in a 3D global velocity model
 Physics of the Earth and Planetary Interiors 141 (2004) 153 166 Seismic ray path variations in a 3D global velocity model Dapeng Zhao, Jianshe Lei Geodynamics Research Center, Ehime University, Matsuyama
Earth and Planetary Science Letters
 Earth and Planetary Science Letters 299 (2010) 1 9 Contents lists available at ScienceDirect Earth and Planetary Science Letters journal homepage: www.elsevier.com/locate/epsl Tracking deep mantle reservoirs
MYRES Seismic Constraints on Boundary Layers. Christine Thomas
 MYRES 2004 Seismic Constraints on Boundary Layers Christine Thomas Outline Seismic constraints: what can we resolve? how can we detect seismic structures? how well can we resolve these structures? (resolution
Lateral variation of the D 00 discontinuity beneath the Cocos Plate
 GEOPHYSICAL RESEARCH LETTERS, VOL. 31, L15612, doi:10.1029/2004gl020300, 2004 Lateral variation of the D 00 discontinuity beneath the Cocos Plate T. Lay Earth Sciences Department, University of California,
Global variation of body wave attenuation in the upper mantle from teleseismic P wave and S wave spectra
 GEOPHYSICAL RESEARCH LETTERS, VOL. 38,, doi:10.1029/2011gl046812, 2011 Global variation of body wave attenuation in the upper mantle from teleseismic P wave and S wave spectra Y. K. Hwang, 1 J. Ritsema,
Earth and Planetary Science Letters
 Earth and Planetary Science Letters 299 (2) 69 79 Contents lists available at ScienceDirect Earth and Planetary Science Letters journal homepage: www.elsevier.com/locate/epsl Mantle Anchor Structure: An
Existence of finite rigidity layer at the base of the Earth s liquid outer core inferred from anomalous splitting of normal modes
 LETTER Earth Planets Space, 54, 67 7, 22 Existence of finite rigidity layer at the base of the Earth s liquid outer core inferred from anomalous splitting of normal modes Seiji Tsuboi,2 and Masanori Saito
Characterization of the D beneath the Galapagos Islands using SKKS and SKS waveforms
 Earthq Sci (2011)24: 87 99 87 doi:10.1007/s11589-011-0772-8 Characterization of the D beneath the Galapagos Islands using SKKS and SKS waveforms Elizabeth Vanacore 1,2, and Fenglin Niu 1 1 Department of
Topographic asymmetry of the South Atlantic from global models of mantle flow and lithospheric stretching
 Supplementary material for Topographic asymmetry of the South Atlantic from global models of mantle flow and lithospheric stretching Flament et al. Earth and Planetary Science Letters. Kinematic models
TOMOGRAPHIC EVIDENCE FOR COMPOSITIONAL HETEROGENEITY DEEP IN EARTH S MANTLE
 TOMOGRAPHIC EVIDENCE FOR COMPOSITIONAL HETEROGENEITY DEEP IN EARTH S MANTLE Robert D. van der Hilst Massachusetts Institute of Technology (E.A.P.S.), Room 54-514 Cambridge, MA 02319 (hilst@mit.edu; 617-253-6977)
Whole Mantle Convection
 Whole Mantle Convection Overview 1. Evidence for whole mantle convection 2. Model of whole mantle convection reconciling geophysical and geochemical data Transition Zone Water Filter Model 3. Evidence
Importance of crustal corrections in the development of a new global model of radial anisotropy
 JOURNAL OF GEOPHYSICAL RESEARCH, VOL. 115,, doi:10.1029/2010jb007520, 2010 Importance of crustal corrections in the development of a new global model of radial anisotropy M. P. Panning, 1 V. Lekić, 2,3
ANEWJOINTP AND S VELOCITY MODEL OF THE MANTLE PARAMETERIZED IN CUBIC B-SPLINES
 ANEWJOINTP AND S VELOCITY MODEL OF THE MANTLE PARAMETERIZED IN CUBIC B-SPLINES Michael Antolik, Göran Ekström, Adam M. Dziewonski, Yu J. Gu, Jian-feng Pan, and Lapo Boschi Department of Earth and Planetary
Lower mantle tomography and phase change mapping
 Click Here for Full Article JOURNAL OF GEOPHYSICAL RESEARCH, VOL. 113,, doi: 10.1029/2007JB005289, 2008 Lower mantle tomography and phase change mapping Daoyuan Sun 1 and Don Helmberger 1 Received 23 July
Data Repository Item
 Data Repository Item 2009003 An abrupt transition from magma-starved to magma-rich rifting in the eastern Black Sea Donna J. Shillington, Caroline L. Scott, Timothy A. Minshull, Rosemary A. Edwards, Peter
CHAPTER 2. Seismology (continued)
") CHAPTER 2 Seismology (continued) 2.1 A tour through the Earth. The gross structure of the Earth and its division into core, mantle and crust were determined by seismologists early in this century. More
CHAPTER 2 Seismology (continued) 2.1 A tour through the Earth. The gross structure of the Earth and its division into core, mantle and crust were determined by seismologists early in this century. More
Geophysical Journal International
 Geophysical Journal International Geophys. J. Int. (2012) 188, 293 300 doi: 10.1111/j.1365-246X.2011.05256.x An analysis of SS precursors using spectral-element method seismograms L. Bai, Y. Zhang and
THERMO-CHEMICAL STRUCTURE OF THE LOWER MANTLE: SEISMOLOGICAL EVIDENCE AND CONSEQUENCES FOR GEODYNAMICS
 CHAPTER 11 THERMO-CHEMICAL STRUCTURE OF THE LOWER MANTLE: SEISMOLOGICAL EVIDENCE AND CONSEQUENCES FOR GEODYNAMICS FRÉDÉRIC DESCHAMPS 1,3, JEANNOT TRAMPERT 1, AND PAUL J. TACKLEY 2 1 Department of Earth
Short scale heterogeneity in the lowermost mantle: insights from PcP-P and ScS-S data
 Earth and Planetary Science Letters 201 (2002) 57^68 www.elsevier.com/locate/epsl Short scale heterogeneity in the lowermost mantle: insights from PcP-P and ScS-S data Hrvoje Tkalc ic, Barbara Romanowicz
Supporting Online Material for
 www.sciencemag.org/cgi/content/full/1131692/dc1 Supporting Online Material for Localized Temporal Change of the Earth s Inner Core Boundary This PDF file includes: Materials and Methods Figs. S1 to S3
GLOBAL MANTLE TOMOGRAPHY: Progress Status in the Past 10 Years
 Annu. Rev. Earth Planet. Sci. 2003. 31:303 28 doi: 10.1146/annurev.earth.31.091602.113555 Copyright c 2003 by Annual Reviews. All rights reserved First published online as a Review in Advance on February
Tomography of the 2011 Iwaki earthquake (M 7.0) and Fukushima
 and Fukushima") 1 2 3 Auxiliary materials for Tomography of the 2011 Iwaki earthquake (M 7.0) and Fukushima nuclear power plant area 4 5 6 7 8 9 Ping Tong 1,2, Dapeng Zhao 1 and Dinghui Yang 2 [1] {Department of Geophysics,
1 2 3 Auxiliary materials for Tomography of the 2011 Iwaki earthquake (M 7.0) and Fukushima nuclear power plant area 4 5 6 7 8 9 Ping Tong 1,2, Dapeng Zhao 1 and Dinghui Yang 2 [1] {Department of Geophysics,
Geophysical Journal International
 Geophysical Journal International Geophys. J. Int. (2012) doi: 10.1111/j.1365-246X.2012.05499.x Normal mode sensitivity to Earth s D layer and topography on the core mantle boundary: what we can and cannot
Chapter 12 Lecture. Earth: An Introduction to Physical Geology. Eleventh Edition. Earth s Interior. Tarbuck and Lutgens Pearson Education, Inc.
 Chapter 12 Lecture Earth: An Introduction to Physical Geology Eleventh Edition Earth s Interior Tarbuck and Lutgens Earth s Internal Structure Earth s interior can be divided into three major layers defined
Plaattektoniek en Mickey Mouse: de bewegingen van de Aarde en de geologie van Marokko. G. Bertotti - TUDelft
 Plaattektoniek en Mickey Mouse: de bewegingen van de Aarde en de geologie van Marokko G. Bertotti - TUDelft Moving continents Continent with matching boundaries Same fauna in different continents Similar
Robust Normal Mode Constraints on Inner Core Anisotropy From Model Space Search
 Robust Normal Mode Constraints on Inner Core Anisotropy From Model Space Search Caroline Beghein, Jeannot Trampert, Faculty of Earth Sciences, Utrecht University, Post Office Box 821, 358 TA utrecht, Netherlands
On the location of plumes and lateral movement of thermochemical structures with high bulk modulus in the 3 D compressible mantle
 Article Volume 12, Number 7 12 July 2011 Q07005, doi:10.1029/2011gc003665 ISSN: 1525 2027 On the location of plumes and lateral movement of thermochemical structures with high bulk modulus in the 3 D compressible
Global anisotropy and the thickness of continents
 1 Global anisotropy and the thickness of continents Yuancheng Gung, Barbara Romanowicz and Mark Panning Berkeley Seismological Laboratory and Department of Earth and Planetary Science, Berkeley, CA, 94720,USA.
Imaging the Gutenberg Seismic Discontinuity beneath the Oceanic Crust of the North American Plate
 Imaging the Gutenberg Seismic Discontinuity beneath the Oceanic Crust of the North American Plate Robbie Burgess 11-25-15 Dr. Nicholas Schmerr GEOL 394 1 1. Abstract: The lithosphere-asthenosphere boundary
Non-linear crustal corrections in high-resolution regional waveform seismic tomography
 Geophys. J. Int. (27) 17, 46 467 doi: 1.1111/j.1365-246X.27.3399.x Non-linear crustal corrections in high-resolution regional waveform seismic tomography Federica Marone and Barbara Romanowicz Berkeley
Global Tectonics. Kearey, Philip. Table of Contents ISBN-13: Historical perspective. 2. The interior of the Earth.
 Global Tectonics Kearey, Philip ISBN-13: 9781405107778 Table of Contents Preface. Acknowledgments. 1. Historical perspective. 1.1 Continental drift. 1.2 Sea floor spreading and the birth of plate tectonics.
SUPPLEMENTARY INFORMATION
 Inability of additional parameters to resolve the Rayleigh-Love discrepancy Radial anisotropy is introduced to resolve the Rayleigh-Love misfit discrepancy that exists across large regions of the western
Multi-disciplinary Impact of the Deep Mantle Postperovskite
 Multi-disciplinary Impact of the Deep Mantle Postperovskite Phase Transition Thorne Lay 1 Dion Heinz 2 Miaki Ishii 3 Sang-Heon Shim 4 Jun Tsuchiya 5 Taku Tsuchiya 5 Renata Wentzcovitch 5 David Yuen 6 1
Middle Mantle Seismic Structure of the African Superplume
 Pure Appl. Geophys. Ó 2012 Springer Basel AG DOI 10.1007/s00024-012-0589-y Pure and Applied Geophysics Middle Mantle Seismic Structure of the African Superplume MARTIN B. C. BRANDT 1,2 Abstract I present
Widespread seismic anisotropy in Earth s lowermost mantle beneath the Atlantic and Siberia
 Geology GSA Data Repository 21949 Widespread seismic anisotropy in Earth s lowermost mantle beneath the Atlantic and Siberia DOI:1.113/G45514.1 Michael Grund, Joachim R. R. Ritter (Email: michael.grund@kit.edu)
boundaries with additional record sections, as emphasized in Fig. S2. The observations at the
 Data used to Sample African Anomaly. The great circle paths of the source-receiver combinations used in this study are shown in Fig. S1. The event information is given in Table S1. Abrupt Changes across
Subduction zones are complex plate boundaries in which variable geometry and structure can be
 1 Chapter 1 Introduction Subduction zones are complex plate boundaries in which variable geometry and structure can be seismically observed. The along-strike transition from flat to normal subduction is
Shear velocity variation within the D 00 region beneath the central Pacific
 JOURNAL OF GEOPHYSICAL RESEARCH, VOL. 111,, doi:10.1029/2004jb003270, 2006 Shear velocity variation within the D 00 region beneath the central Pacific Megan Avants, 1 Thorne Lay, 2 Sara A. Russell, 3,4,5
G 3. AN ELECTRONIC JOURNAL OF THE EARTH SCIENCES Published by AGU and the Geochemical Society
 Geosystems G 3 AN ELECTRONIC JOURNAL OF THE EARTH SCIENCES Published by AGU and the Geochemical Society Article Volume 3 January 1, 22 Paper number 21GC168 ISSN: 1525-227 A comparison of tomographic and
SUPPLEMENTARY INFORMATION
 SUPPLEMENTARY INFORMATION Patterns of intraplate volcanism controlled by asthenospheric shear Clinton P. Conrad 1,,*, Todd A. Bianco 1,, Eugene I. Smith 2, and Paul Wessel 1 1 Department of Geology & Geophysics,
GEOL540: The Mantle System
 GEOL540: The Mantle System Instructor Prof. Thorsten Becker (ZHS269; (213)740-8365; twb@usc.edu) Times Two 1.5 hours, 3 units Objective This graduate class discusses the structure, dynamics, and evolution
Geophysical Journal International
 Geophysical Journal International Geophys. J. Int. (2017) 210, 774 786 Advance Access publication 2017 May 5 GJI Seismology doi: 10.1093/gji/ggx190 Lowermost mantle anisotropy near the eastern edge of
A three-dimensional radially anisotropic model of shear velocity in the whole mantle
 Geophys. J. Int. (2006) 167, 361 379 doi: 10.1111/j.1365-246X.2006.03100.x A three-dimensional radially anisotropic model of shear velocity in the whole mantle Mark Panning and Barbara Romanowicz Berkeley
Global Mid-Ocean Ridges Mantle Tomography Profiles
 Earth Sciences 2015; 4(2): 80-88 Published online April 9, 2015 (http://www.sciencepublishinggroup.com/j/earth) doi: 10.11648/j.earth.20150402.13 ISSN: 2328-5974 (Print); ISSN: 2328-5982 (Online) Global
Tracing rays through the Earth
 Tracing rays through the Earth Ray parameter p: source receiv er i 1 V 1 sin i 1 = sin i 2 = = sin i n = const. = p V 1 V 2 V n p is constant for a given ray i 2 i 3 i 4 V 2 V 3 V 4 i critical If V increases