Supplementary Online Material for. Seismic evidence for a chemically distinct thermochemical reservoir in Earth s deep mantle beneath Hawaii
|
|
|
- Joy Hines
- 6 years ago
- Views:
Transcription
1 Supplementary Online Material for Seismic evidence for a chemically distinct thermochemical reservoir in Earth s deep mantle beneath Hawaii Authors: Chunpeng Zhao 1, Edward J. Garnero 1,*, Allen K. McNamara 1, Nicholas Schmerr 2, and Richard W. Carlson 3 Affiliations: 1 School of Earth and Space Exploration, Arizona State University, Tempe, Arizona , USA. 2 NASA Goddard Space Flight Center, Planetary Geodynamics Laboratory, Greenbelt, MD 20771, USA. 3 Department of Terrestrial Magnetism, Carnegie Institution of Washington, 5241 Broad Branch Road, NW, Washington, DC , USA *Correspondence to: garnero@asu.edu Supplementary Discussions Over a dozen high-resolution seismic analyses of detected either sharp lateral boundaries in the lowermost mantle, or strong heterogeneous structures with abrupt transition to the surrounding mantle. Table S1 lists studies that are plotted as thick black lines in Figure S1 on five different shear velocity models and their lateral gradient maps. As seen in Figure S1, the general LLSVP properties are similar from model to model, but the details differ (including tomographically predicted LLSVP height, not shown). Other models that are derivative of collections of models, such as averaging past models (Becker and Boschi 2002) or cluster analysis of models (Lekic et al 2012) also give LLSVP shapes similar to this, especially in our study area. Our results depend on the 1
2 waveform broadening (misfits) observations, and the patterns do not depend on specifics of any particular tomographic model. Earthquake information for the high quality data of this study is given in Table S2, with epicenters, stations, and ray paths presented in Figure S3. The lowest parts of ray paths are plotted, showing a dense sampling of the deepest mantle beneath the Hawaiian hotspot. The misfit measurement in this study measures relative waveform broadening (Figure 3d of the main text), and along with travel time anomalies (Figure S4), are central to detection of the abrupt transition of LLSVP material to surrounding mantle. Waveform misfits and travel time delays relative to PREM predictions are plotted relative to the S-wave bottoming depth above the CMB for all data in Figure 4 of the main text. We have fairly dense sampling up to 900 km above the CMB with sampling density decreasing above that. The overall trend of the misfits and times are emphasized by the mean values (colored symbols in Figure 4 of the main text) plotted every 30 km in depth. One standard deviation is also plotted (horizontal lines). Waveform misfits increase below 200 km due to ScS entering the time window of the S wave: S and ScS become asymptotic to each other, and our S windowing scheme erroneously includes some ScS energy for delayed S waves. Thus, measurements in this study are most robust for S waves bottoming between ~ km above the CMB. Strong variability is seen in the misfit and time plots at any given depth in Figure 4, most plausibly caused by lateral variations of the sampled mantle structure. Interesting variations with depth are also present: increased waveform misfits near 600 km above the CMB correspond to an onset in increasing travel time delays (see the averages of misfits and times in Figure 4c), 2
3 although the exact nature of this increasing trend depends upon the reference model. Figure S9 demonstrates this latter point by comparing the travel time anomalies relative to the M1 model (Ritsema et al., 1997), which has a reduced shear wave velocity gradient in the lowest ~200 km of the mantle. Systematics of the lateral distance of ray path bottoming locations from the crosssection of interest in this study is illustrated in Figure S5. Most rays do not bottom far enough away from the cross-section to greatly affect the depth of the cross-section piercing location. Fig. S11 (Supplementary Material) provides information on travel times, ray sampling density, and standard deviation of travel times and misfits on the main crosssection investigated in this study. Fig. S12 (Supplementary Material) shows the misfits projected to the cross-section on top of lateral gradients estimated from the tomographic model TBXW (Grand, 2002). Fig. S13 compares broadening for S waves and SS waves at similar stations, and shows how the S waves are disproportionately broadened, arguing for a deep mantle source over the structure beneath stations. Fig. S14 shows misfits projected to the surface, and compares it to velocity structure near the surface. The inconsistency of misfit comparisons to mantle structure suggests near surface structure is not the source of the broadening. This also infers station structure would not conspire to make the consistent pattern of misfits with deep mantle LLSVP structure. Fig S15 shows synthetic experiments with deep mantle attenuation, and Fig. S16 relates broadening (misfits) to differential t* operators. 3
4 Additional References Gu, Y. J., Dziewonski, A. M., Su, W., Ekström, G., Models of the mantle shear velocity and discontinuities in the pattern of lateral heterogeneities. J. Geophys. Res. 106, ,199, doi: /2001jb He, Y., Wen, L., Zheng, T., Geographic boundary and shear wave velocity structure of the Pacific anomaly near the core mantle boundary beneath western Pacific. Earth Planet. Sci. Lett. 244, , doi: /j.epsl Ni, S., Helmberger, D. V., 2003a. Further constraints on the African superplume structure. Phys. Earth Planet. Inter. 140, , doi: /j.pepi Ni, S., Helmberger, D. V., 2003b. Ridge-like lower mantle structure beneath South Africa. J. Geophys. Res. 108, 2094, doi: /2001jb Ni, S., Helmberger, D. V., 2003c. Seismological constraints on the South African superplume: could be the oldest distinct structure on Earth. Earth Planet. Sci. Lett. 206, , doi: /s x(02) Ni, S., Helmberger, D. V., Tromp, J., Three-dimensional structure of the African superplume from waveform modeling. Geophys. J. Int. 161, , doi: /j x x. Porritt, R.W., R.M. Allen, and F.F. Pollitz, Seismic imaging east of the Rocky Mountains with USArray, Earth Planet. Sci. Lett., 401, Sun, D., and M. S. Miller, Study of the western edge of the African large low shear velocity province. Geochem.Geophys. Geosyst., 14,
5 Sun, D., Helmberger, D. V., Ni, S., Bower, D., Direct measures of lateral velocity variation in the deep Earth. J. Geophys. Res. 114, 1-18, doi: /2008jb (2009). Thorne, M. S., Garnero, E. J., Inferences on ultralow-velocity zone structure from a global analysis of SPdKS waves. J. Geophys. Res. 109, B08301, doi: /2004jb Wang, Y., Wen, L., Mapping the geometry and geographic distribution of a very low velocity province at the base of the Earth s mantle. J. Geophys. Res. 109, 1-18, doi: /2003jb
6 Table S1. Past seismic studies that image Large Low Shear Velocity Province (LLSVP) margins. The Location Number corresponds to Figure 1b and 1c in the main text. Location Region (Reference) Seismic Phases Used Number 1 West Pacific (He et al., 2006) S, ScS 2 North Pacific (Luo et al., 2001) PKP 3 North Pacific (Bréger and Romanowicz, 1998) S, SKS, SKKS 4 East Pacific (Sun et al., 2007) PKP 5 South Pacific (To et al., 2005) S, SKS, SKKS 6 South Pacific (Ford et al., 2006) S, SKS, SKKS 7 Middle Pacific (He and Wen, 2009) S, ScS, SKS, SKKS 8 South Africa and Atlantic (Wang and Wen, 2004) S, ScS, SKS, SKKS 9 South Africa (Sun et al., 2007) S, ScS, SKS, SKKS 9 South Africa (Sun et al., 2009) S, ScS, SKS, SKKS 10 South Africa (Ni and Helmberger, 2003a) S, ScS, SKS, SKKS 10 South Africa (Ni and Helmberger, 2003b) S, ScS, SKS 10 South Africa (Ni and Helmberger, 2003c) S, ScS, SKS, P, PcP 10 South Africa (Ni et al., 2005) S, ScS, SKS 11 West Africa (Sun and Miller, 2013) S, ScS, SKS, SKKS 6
7 Table S2. Earthquake information (from NEIC) for events used in this study. Date Latitude (deg) Longitude (deg) Depth (km) Mag. 07 Aug Aug Oct Oct Jan Jul Jul Oct Nov Nov Apr
 Mégnin and Romanowicz, 2000; (e) Ritsema et al. 2011.")
8 Figure S1. Geographic correlation of hotspots and edges with different tomography models. (a) Grand, 2002; (b) Gu et al. 2001; (c) Masters et al. 2000; (d) Mégnin and Romanowicz, 2000; (e) Ritsema et al Left column: hotspot locations (orange circles) are plotted on top of 5 different global tomography shear velocity models at 2750 km depth. Blue and red colors represent higher and lower velocities, respectively. 8
9 Hotspot size is scaled to the flux of each hotspot (Sleep, 1990). Lateral shear velocity gradients are shown in the right column (red = strongest gradients). The locations of LLSVP margins found in forward modeling studies are shown in all the panels as thick black lines (the lines are dashed if from travel time analyses). The source studies are indicated in Figure 1 of the main text, and in Table S1. 9
10 Figure S2. Examples of seismic waveform broadening from S-waves that propagate near LLSVP margins. Globes display earthquakes (stars), receivers (triangles), ray path geometries (black lines; red segments indicate lower mantle part of path for broadened 10
11 pulses), for the studies of (a) Ni et al. 2005, (b) Ford et al. 2006, and (c) this study. Shaded regions are LLSVPs (all areas with shear velocity < -1.1%, from model TXBW (Grand, 2002)). Corresponding waveforms are numbered according to ray paths in globes. Numbers on the right of waveforms are the bottoming depth of ray paths in km. Panels (a) and (b) have broadened waveforms from propagation nearly tangent to LLSVP margin, at the base of the mantle (thus the waves are diffracted S-waves). Panel (c) shows broadening up off the core-mantle boundary, for paths that are nearly orthogonal to the LLSVP margin. 11
, receivers (blue-filled triangles), and the lowermost 50 km segments of all the S-wave raypaths (red line segments) are plotted along")
12 Figure S3. Distribution of our data. Distributions of earthquake sources (yellow-filled black stars), receivers (blue-filled triangles), and the lowermost 50 km segments of all the S-wave raypaths (red line segments) are plotted along with the location of our study region (black box). Large red-filled circle denotes the Hawaiian hotspot. Thick tan lines indicate plate boundaries. Earthquake information is provided in Table S2. Green lines emphasize azimuth from a common source, the dominant geometric factor in distinguishing ray path segments in our study region. 12
, along with the standard deviation (light blue shading).")
13 Figure S4. Waveforms, misfits, and travel times for an example earthquake. (a) Example transverse component displacement S-wave recordings from the August 26, 2007 earthquake (left column). The empirical source shape is shown at the top of the distance profile (as in Figure 2 of the main text), along with the standard deviation (light blue shading). Records are aligned according to their maximum cross-correlation with the empirical source, in the 12-second window shown (yellow shaded region). (b) The middle panel displays measured misfits for the data of panel (a) with circles around measurements that correspond to the ten broadened records shown in Figure 2 of the main text. (c) Travel time anomalies are plotted relative to the PREM-predicted S wave times. Nearly all of these data display travel time delays associated with the Pacific 13
14 LLSVP. 14
 Sampling of the NW Pacific is shown with gray lines representing the bottom 50 km of ray path bottoming locations, underlain by the lowermost mantle shear velocity tomography model of TXBW")
15 Figure S5. Ray path bottoming location geometry relative to cross-section. (a) Sampling of the NW Pacific is shown with gray lines representing the bottom 50 km of ray path bottoming locations, underlain by the lowermost mantle shear velocity tomography model of TXBW (Grand, 2002). Colored dots represent the turning depth location of raypaths, with color denoting the perpendicular distance between ray path bottoming location and the thick black cross section line, and black dots are for distances greater than 700 km. Thick gray cross-section lines are parallel to black cross-section line, roughly separated in 500 km intervals. (b) Histogram displaying perpendicular horizontal distance between ray path bottoming depths and the black cross section line. Most of the 15
16 data are within several 100 km of the cross section. (c) Histogram displaying the vertical offset of ray path bottoming depth, and the depth that each ray path intersects the crosssection. Here it is seen that ray paths do not turn at depths remarkably different from cross-section piercing depths. 16
. Yellow shaded region denotes the misfit measurement time window.")
17 Figure S6. Synthetic seismograms showing misfit effects from other seismic phases. (a) The empirical source stack (red trace at top) is obtained using the same method as we do with data. All displacement synthetic seismograms are aligned on the peak of S wave (blue line). Yellow shaded region denotes the misfit measurement time window. Red curve indicates the PREM predicted arrival time of ScS relative to the S-wave. Red crosses are the arrival time of a phase refracting along the top of the LLSVP low velocity layer, and red circles denote when this phase begins diffracting along the top of the layer. Ray path bottom depth predictions are printed in green on the right side of the panel. (b) Misfit measurements (black crosses) are computed for the synthetic seismograms of panel (a). Distance ranges of ScS contamination to the misfit measurement have orange 17
18 shading, and distances where contamination occurs from an S-wave refracting or diffracting along the top of the LLSVP (above the LLSVP in the mantle) are plotted in blue. (c) Travel time delays measured for the S-waves of panel (a). (d) The LLSVP model (red) and PREM (black) are plotted with respect to the height above the CMB in kilometers. 18
19 19
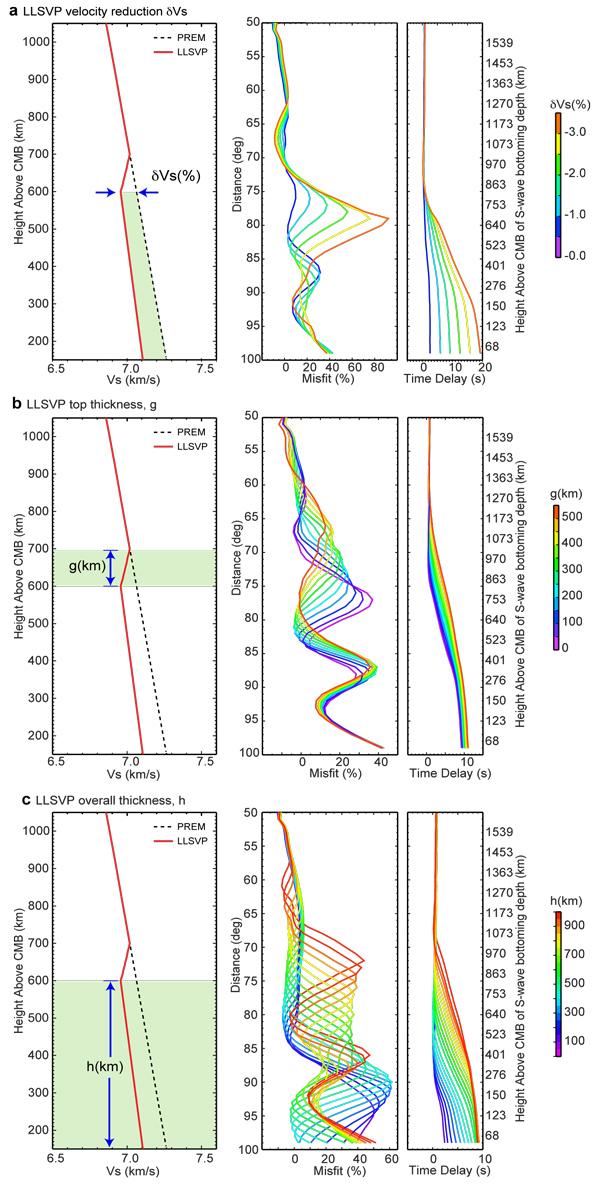
20 Figure S7. LLSVP Synthetic Tests. Waveform misfits and travel time delays for synthetic models are measured using the same method as we do with data. Each row of this figure corresponds to a specific LLSVP model attribute, with the model (left), the misfit (center), and travel time delay (right) being shown. (a) Shear velocity reduction within the LLSVP (δvs): constant reductions are tested, from 0 to 3.5%. Here the LLSVP is 600 km thick, with a 100 km thick taper zone back to the PREM model. (b) Varying thickness of a gradient zone from normal (PREM) mantle to LLSVP mantle (g) is tested. The LLSVP velocity reduction is fixed at 1.5% for the models shown, and the depth at the top of the linear gradient is at 700 km above the CMB. (c) The thickness of the LLSVP from the CMB up to the base of the gradient zone (h) is tested. A 1.5% LLSVP velocity drop and a 100 km gradient zone at the top are used for these models. While only end-member models are shown, all combinations of parameters where computed (over 1000 models). 20
21 Figure S8. Stacking data for the restricted azimuth sector of Figure 6a. (left) Records are binned in 25 km bottoming depth groupings, and stacked via an iterative cross-correlation algorithm (black traces). The number of traces in each stack is shown to the right of this panel. The stack at 860 km is used as a reference, and plotted in red beneath all stacks, which shows the broadening of the stacked traces in the km range, especially near 600 km above the CMB (the orange shading highlights this region). (right) Stacks at 21
22 210, 610, and 830 are enlarged to demonstrate the deeper (210) and shallower (830) stacks are similar to the reference, but the stack at 610 is significantly broadened. These stacks are a waveform equivalent of misfit information plotted in Figure 6d of the main text. 22
23 Figure S9. Dependency of travel time delays on 1D reference model. (left) Absolute travel time anomalies of S-waves (gray dots) are shown referenced to predictions of the M1 model (Ritsema et al., 1997). As with Figures 4b and 6e in the main text, times are plotted at bottoming depths computed for the PREM model. Depth-bin averages (red squares for M1, blue circles for PREM) and +/- one standard deviation (horizontal bars) are calculated in 30 km depth intervals. Open symbols correspond to depth bins with fewer than 20 measurements. (right) The M1 (red) and PREM (blue) shear velocity models are shown. 23
 is often near LLSVPs (yellow shading), particularly the boundaries. However, many ULVZs are outside LLSVPs.")
24 Figure S10. LLSVP in relationship to ULVZs and other phenomena. The CMB is not uniformly sampled in ULVZ studies (McNamara et al., 2010; Thorne and Garnero, 2004). But where it is studied, it appears that ULVZ detection (red spots) is often near LLSVPs (yellow shading), particularly the boundaries. However, many ULVZs are outside LLSVPs. ULVZ non-detections are usually outside LLSVPs, and close to regions beneath present-day subduction zones (see blue lines). Hotspots are commonly near LLSVP boundaries (Thorne et al., 2004), but exceptions exist. ULVZ regions are from McNamara et al. (McNamara, et al., 2010). Hotspots are from Sleep (Montelli et al., 2004). 24
 S-wave travel time delay anomalies (relative to PREM) projected on to the same cross-section used in previous figures.")
25 Figure S11. Distribution of data delay times, hitcount, and standard deviation. (a) S-wave travel time delay anomalies (relative to PREM) projected on to the same cross-section used in previous figures. Travel time delays (red regions) mimic the shape of the 25
26 tomographically derived LLSVP shown in other figures (e.g., Figure 6b of the main text). Gray areas represent no coverage. (b) Number of sampling ray paths on this crosssection. Much of the LLSVP region is well sampled. Regions without wave sampling are shaded gray. (c) Standard deviation of misfits, which shows that for the region with best coverage (the LLSVP region), the misfit measurements do not significantly vary. (d) As in (c) except the standard deviation of travel time anomalies is shown. 26
.")
27 Figure S12. Correlation between waveform misfits and tomography gradients. Waveform misfits are plotted on the NW-to-SE cross-section (as with Figure S11). Here, the background displays lateral gradients in shear velocity heterogeneity in the TXBW model (Grand, 2002). The strongest gradients in TXBW are red, and in the lowest 600 km of the mantle agree well with either the boundary or location of the largest misfits. 27
, and standard deviation (black bars) are plotted on top of tomography model corrected travel times (gray crosses).")
28 Figure S13. (a) S travel times within the azimuthal bin in Fig. 6 are corrected by TXBW relative to PREM using PREM predicted ray paths. Depth bin average (red dots), and standard deviation (black bars) are plotted on top of tomography model corrected travel times (gray crosses). Some data in the km depth range above the CMB differ from the general trend of travel time delays, and may be due to sampling in the northeast of our study region, plausibly just outside the LLSVP in higher velocities. (b) SS waveform bin stacks for the same azimuthal bin as in Fig. 6, and the same records (where possible) from which S waves are studied, are plotted for 25 km bottoming depth bins (thicker black traces) -- here, the bottoming depths correspond to the S waves; SS waves for the same records are grouped similarly. Gray traces are copied from the 3 rd bin from the top as a reference to illustrate that the SS depth bin stacks show little or no broadening with depth. (c) S wave depth bin stacks, as done in panel (b). Gray traces are copied from the 4 th bin stack from the top as a reference, which shows that the S stacks broaden most strongly between km above the CMB (whereas SS waves do not broaden for those bins). 28
; these are ten overlaid on the TXBW shear velocity model in the upper mantle. Number in the lower left corner stands for the depth of the tomography model perturbations.")
29 Figure S14a. S misfit measurements have been projected to the locations of the stations, then smoothed onto a 1.5 deg by 1.5 deg grid (black crosses); these are ten overlaid on the TXBW shear velocity model in the upper mantle. Number in the lower left corner stands for the depth of the tomography model perturbations. The strong misfits are not seen in the western US (which corresponds to S-waves bottoming above the LLSVP). In the eastern half of the US, discreet and unconnected patches of broadening are seen. The large misfits appear more spatially correlated to LLSVP edges (e.g., Fig 6). 29

30 Figure S14b. As in Fig. S14a, except comparisons are made for an upper mantle tomography model of Porritt et al. (2014). 30
, 85 deg (middle row), and 90 deg (bottom row).")
31 Figure S15. Synthetic tests of low Q (high attenuation) models in the lowest 600 km of the mantle. Synthetics are computed for SH traces using the reflectivity method, and a 500 km deep source. Each row of panels corresponds to different distances: 80 deg (top row), 85 deg (middle row), and 90 deg (bottom row). Each column corresponds to a different lower mantle Q model, where the PREM model is used for the synthetics except the shear Q value is lowered to a constant value in the lowest 600 km of the mantle as follows: Q02=200 (column 1), Q03=100 (column 2), Q04=50 (column 3), Q05=25 (column 4); The PREM value for Q in this depth range is 312. All red traces are synthetics for that corresponding Q model (column) and distance (row). The secondary peak at small distances is ScS, the main peak is direct S. Green traces are a result of convolving PREM traces (with PREM s Q=312) with a differential t* operator that gives a best fit to the particular reduced Q model. Best-fit differential t* values (in seconds) are listed in each panel in the upper left. Differential t* values are smallest for the more 31
32 shallow diving waves (e.g., 80 deg), and for milder Q drops (e.g., Q02). Cross-correlation coefficients between low Q traces and best-fit green traces are also shown. Traces are plotted with peaks aligned to show that the upswing and downswing portion of pulses increasingly differs for the lowest Q models, which reduces the cross-correlation coefficient. 32
33 Figure S16. An example empirical source wavelet from one of our events (blue top trace) convolved with a suite of t* ( t_star ) values (listed on the right, in seconds), black traces. The empirical source wavelet is reproduced with each black trace, and misfit values (as defined in the main text) are computed, and listed on the right. S 33
Continent-sized anomalous zones with low seismic velocity at the base of Earth s mantle
 SUPPLEMENTARY INFORMATION DOI: 10.1038/NGEO2733 Continent-sized anomalous zones with low seismic velocity at the base of Earth s mantle Edward J. Garnero 1, Allen K. McNamara 1, and Sang-Heon D. Shim 1
Thorne, Garnero, Jahnke, Igel, McNamara Supplementary Material - 1 -
 Supplementary Material S1. Bin Location Map Location of 2.5 2.5 bins for which data was obtained to infer the ULVZ distribution. The preferred ULVZ model is drawn (yellow areas). Gray shaded regions indicate
BRIEF ARTICLE THE AUTHOR
 BRIEF ARTICLE THE AUTHOR 1 2 THE AUTHOR S Pd K Pd S mantle OC IC CMB Figure 1 Figure 1. Illustration of the SPdKS / SKPdS ray-paths with sub-segments labeled. SPdKS is an SKS that intersects the source-side
Figures S1 S4 show the measurements taken from the synthetic vespagrams where a)
") Figures S1 S4 show the measurements taken from the synthetic vespagrams where a) is the differential travel time versus the Dʺ discontinuity height, b) is the differential travel time versus δv S, c) is
Figures S1 S4 show the measurements taken from the synthetic vespagrams where a) is the differential travel time versus the Dʺ discontinuity height, b) is the differential travel time versus δv S, c) is
Structural features and shear-velocity structure of the Pacific Anomaly. Lianxing Wen a. Yumei He a,b
 Structural features and shear-velocity structure of the Pacific Anomaly Yumei He a,b Lianxing Wen a a Department of Geosciences, State University of New York at Stony Brook, Stony Brook, New York, USA
Possible reservoirs of radioactivity in the deep mantle. Ed Garnero School of Earth and Space Exploration Arizona State University
 Possible reservoirs of radioactivity in the deep mantle Ed Garnero School of Earth and Space Exploration Arizona State University Outline Brief overview: motivation for investigating interiors; how seismology
Three-dimensional structure of the African superplume from waveform modelling
 Geophys. J. Int. (5) 161, 283 294 doi: 1.1111/j.1365-X.5.258.x Three-dimensional structure of the African superplume from waveform modelling Sidao Ni, 1,2 Don V. Helmberger 2 and Jeroen Tromp 2 1 School
Seismic anisotropy in the lowermost mantle near the Perm Anomaly
 1 2 3 4 5 6 7 8 9 10 11 12 13 14 15 16 17 18 19 20 21 22 23 Seismic anisotropy in the lowermost mantle near the Perm Anomaly Maureen D. Long* and Colton Lynner Department of Geology and Geophysics, Yale
boundaries with additional record sections, as emphasized in Fig. S2. The observations at the
 Data used to Sample African Anomaly. The great circle paths of the source-receiver combinations used in this study are shown in Fig. S1. The event information is given in Table S1. Abrupt Changes across
Mantle plumes as presently imaged by seismic tomography. Barbara Romanowicz 1,2
 Mantle plumes as presently imaged by seismic tomography Barbara Romanowicz 1,2 1 Collège de France, Paris 2 Univ. of California, Berkeley Contributors: V. Lekic, S. French, S. Cottaar, Kaiqing Yuan Collège
3D IMAGING OF THE EARTH S MANTLE: FROM SLABS TO PLUMES
 3D IMAGING OF THE EARTH S MANTLE: FROM SLABS TO PLUMES Barbara Romanowicz Department of Earth and Planetary Science, U. C. Berkeley Dr. Barbara Romanowicz, UC Berkeley (KITP Colloquium 9/11/02) 1 Cartoon
Lateral variation of the D 00 discontinuity beneath the Cocos Plate
 GEOPHYSICAL RESEARCH LETTERS, VOL. 31, L15612, doi:10.1029/2004gl020300, 2004 Lateral variation of the D 00 discontinuity beneath the Cocos Plate T. Lay Earth Sciences Department, University of California,
Supporting Online Material for
 www.sciencemag.org/cgi/content/full/1131692/dc1 Supporting Online Material for Localized Temporal Change of the Earth s Inner Core Boundary This PDF file includes: Materials and Methods Figs. S1 to S3
Geographic boundary and shear wave velocity structure of the Pacific anomaly near the core mantle boundary beneath western Pacific
 Earth and Planetary Science Letters 244 (2006) 302 314 www.elsevier.com/locate/epsl Geographic boundary and shear wave velocity structure of the Pacific anomaly near the core mantle boundary beneath western
SUPPLEMENTARY INFORMATION
 doi:10.1038/nature11492 Figure S1 Short-period Seismic Energy Release Pattern Imaged by F-net. (a) Locations of broadband seismograph stations in Japanese F-net used for the 0.5-2.0 Hz P wave back-projection
Estimation of S-wave scattering coefficient in the mantle from envelope characteristics before and after the ScS arrival
 GEOPHYSICAL RESEARCH LETTERS, VOL. 30, NO. 24, 2248, doi:10.1029/2003gl018413, 2003 Estimation of S-wave scattering coefficient in the mantle from envelope characteristics before and after the ScS arrival
Earth and Planetary Science Letters
 Earth and Planetary Science Letters 319-32 (212) 55 64 Contents lists available at SciVerse ScienceDirect Earth and Planetary Science Letters journal homepage: www.elsevier.com/locate/epsl Detection of
Supporting Information for An automatically updated S-wave model of the upper mantle and the depth extent of azimuthal anisotropy
 GEOPHYSICAL RESEARCH LETTERS Supporting Information for An automatically updated S-wave model of the upper mantle and the depth extent of azimuthal anisotropy Eric Debayle 1, Fabien Dubuffet 1 and Stéphanie
ANEWJOINTP AND S VELOCITY MODEL OF THE MANTLE PARAMETERIZED IN CUBIC B-SPLINES
 ANEWJOINTP AND S VELOCITY MODEL OF THE MANTLE PARAMETERIZED IN CUBIC B-SPLINES Michael Antolik, Göran Ekström, Adam M. Dziewonski, Yu J. Gu, Jian-feng Pan, and Lapo Boschi Department of Earth and Planetary
Data Repository Item
 Data Repository Item 2009003 An abrupt transition from magma-starved to magma-rich rifting in the eastern Black Sea Donna J. Shillington, Caroline L. Scott, Timothy A. Minshull, Rosemary A. Edwards, Peter
An SH hybrid method and shear velocity structures in the lowermost mantle beneath the central Pacific and South Atlantic Oceans
 JOURNAL OF GEOPSICAL RESEARCH, VOL. 7, NO. B,.9/JB499, An SH hybrid method and shear velocity structures in the lowermost mantle beneath the central Pacific and South Atlantic Oceans Lianxing Wen Department
Lower Mantle Structure & Geo-neutrinos
 Lower Mantle Structure & Geo-neutrinos Geo-neutrino working group meeting, KITP July 1 st, 2014 Vedran Lekic University of Maryland, College Park + Sanne Cottaar (Cambridge) + Edwin Kite (Princeton / U
29th Monitoring Research Review: Ground-Based Nuclear Explosion Monitoring Technologies
 TRANSITION ZONE WAVE PROPAGATION: CHARACTERIZING TRAVEL-TIME AND AMPLITUDE INFORMATION Peter M. Shearer and Jesse F. Lawrence University of California San Diego, Institute of Geophysics and Planetary Physics
MYRES Seismic Constraints on Boundary Layers. Christine Thomas
 MYRES 2004 Seismic Constraints on Boundary Layers Christine Thomas Outline Seismic constraints: what can we resolve? how can we detect seismic structures? how well can we resolve these structures? (resolution
Supporting Online Material for
 www.sciencemag.org/cgi/content/full/326/5949/112/dc1 Supporting Online Material for Global Surface Wave Tomography Using Seismic Hum Kiwamu Nishida,* Jean-Paul Montagner, Hitoshi Kawakatsu *To whom correspondence
Global surface-wave tomography
 Global surface-wave tomography Lapo Boschi (lapo@erdw.ethz.ch) October 7, 2009 Love and Rayleigh waves, radial anisotropy Whenever an elastic medium is bounded by a free surface, coherent waves arise that
(This is a sample cover image for this issue. The actual cover is not yet available at this time.)
") (This is a sample cover image for this issue. The actual cover is not yet available at this time.) This article appeared in a journal published by Elsevier. The attached copy is furnished to the author
(This is a sample cover image for this issue. The actual cover is not yet available at this time.) This article appeared in a journal published by Elsevier. The attached copy is furnished to the author
Imaging sharp lateral velocity gradients using scattered waves on dense arrays: faults and basin edges
 2017 SCEC Proposal Report #17133 Imaging sharp lateral velocity gradients using scattered waves on dense arrays: faults and basin edges Principal Investigator Zhongwen Zhan Seismological Laboratory, California
Geophysical Journal International
 Geophysical Journal International Geophys. J. Int. (2012) 188, 293 300 doi: 10.1111/j.1365-246X.2011.05256.x An analysis of SS precursors using spectral-element method seismograms L. Bai, Y. Zhang and
Lower mantle tomography and phase change mapping
 Click Here for Full Article JOURNAL OF GEOPHYSICAL RESEARCH, VOL. 113,, doi: 10.1029/2007JB005289, 2008 Lower mantle tomography and phase change mapping Daoyuan Sun 1 and Don Helmberger 1 Received 23 July
Seismological constraints on the South African superplume; could be the oldest distinct structure on earth
 Earth and Planetary Science Letters 206 (2003) 119^131 www.elsevier.com/locate/epsl Seismological constraints on the South African superplume; could be the oldest distinct structure on earth Sidao Ni,
Characterization of the D beneath the Galapagos Islands using SKKS and SKS waveforms
 Earthq Sci (2011)24: 87 99 87 doi:10.1007/s11589-011-0772-8 Characterization of the D beneath the Galapagos Islands using SKKS and SKS waveforms Elizabeth Vanacore 1,2, and Fenglin Niu 1 1 Department of
Seismic ray path variations in a 3D global velocity model
 Physics of the Earth and Planetary Interiors 141 (2004) 153 166 Seismic ray path variations in a 3D global velocity model Dapeng Zhao, Jianshe Lei Geodynamics Research Center, Ehime University, Matsuyama
SUPPLEMENTARY INFORMATION
 SUPPLEMENTARY INFORMATION Seismic evidence for a global low velocity layer within the Earth s upper mantle SUPPLEMENTARY MATERIAL Benoît Tauzin 1, Eric Debayle 2 & Gérard Wittlinger 3 1 Department of Earth
The Earth is Red; Dominance of large wavelength features in mantle boundary layers. Adam M. Dziewonski
 The Earth is Red; Dominance of large wavelength features in mantle boundary layers Adam M. Dziewonski KITP, EARTH08, July 2, 2008 Kircher, 1665 Imagining ca. Earth s 2005 Interior from E. Garnero s files
Seismogram Interpretation. Seismogram Interpretation
 Travel times in the Earth Ray paths, phases and their name Wavefields in the Earth: SH waves, P-SV waves Seismic Tomography Receiver Functions Seismogram Example Long-period transverse displacement for
Waveform search for the innermost inner core
 Waveform search for the innermost inner core Vernon F. Cormier 1 and Anastasia Stroujkova 1,2 University of Connecticut Storrs, CT 06269-3046 Abstract Waveforms of the PKIKP seismic phase in the distance
Supplementary Figure 1. Distribution of seismic event locations determined using the final 3-D velocity model. We separate the crust-related
 Supplementary Figure 1. Distribution of seismic event locations determined using the final 3-D velocity model. We separate the crust-related seismicity at depths of less than 40 km (panel A) from the deeper
Seismology and Deep Mantle Temperature Structure. Thorne Lay
 Seismology and Deep Mantle Temperature Structure Thorne Lay Travel time of seismic phases vs. angular distance PREM Preliminary Reference Earth Model Dziewonski and Anderson [1981, PEPI] Basic fact:
Changbaishan volcanism in northeast China linked to subduction-induced mantle upwelling
 SUPPLEMENTARY INFORMATION DOI: 10.1038/NGEO2166 Changbaishan volcanism in northeast China linked to subduction-induced mantle upwelling Youcai Tang, Masayuki Obayashi, Fenglin Niu, Stephen P. Grand, Yongshun
Shear velocity variation within the D 00 region beneath the central Pacific
 JOURNAL OF GEOPHYSICAL RESEARCH, VOL. 111,, doi:10.1029/2004jb003270, 2006 Shear velocity variation within the D 00 region beneath the central Pacific Megan Avants, 1 Thorne Lay, 2 Sara A. Russell, 3,4,5
Tomography of the 2011 Iwaki earthquake (M 7.0) and Fukushima
 and Fukushima") 1 2 3 Auxiliary materials for Tomography of the 2011 Iwaki earthquake (M 7.0) and Fukushima nuclear power plant area 4 5 6 7 8 9 Ping Tong 1,2, Dapeng Zhao 1 and Dinghui Yang 2 [1] {Department of Geophysics,
1 2 3 Auxiliary materials for Tomography of the 2011 Iwaki earthquake (M 7.0) and Fukushima nuclear power plant area 4 5 6 7 8 9 Ping Tong 1,2, Dapeng Zhao 1 and Dinghui Yang 2 [1] {Department of Geophysics,
Data Repository: Seismic and Geodetic Evidence For Extensive, Long-Lived Fault Damage Zones
 DR2009082 Data Repository: Seismic and Geodetic Evidence For Extensive, Long-Lived Fault Damage Zones Fault Zone Trapped Wave Data and Methods Fault zone trapped waves observed for 2 shots and 5 local
Vertical coherence in mantle heterogeneity from global seismic data
 GEOPHYSICAL RESEARCH LETTERS, VOL. 38,, doi:10.1029/2011gl049281, 2011 Vertical coherence in mantle heterogeneity from global seismic data L. Boschi 1,2 and T. W. Becker 3 Received 11 August 2011; revised
Inner core attenuation anisotropy
 Earth and Planetary Science Letters 245 (2006) 581 594 www.elsevier.com/locate/epsl Inner core attenuation anisotropy Wen-che Yu, Lianxing Wen Department of Geosciences, State University of New York at
Peer Reviewed Publications
 Peer Reviewed Publications Moucha, R., A. M. Forte, D. B. Rowley, J. X. Mitrovica, N. A. Simmons, and S. P. Grand (2009),Deep mantle forces and the uplift of the Colorado Plateau,Geophys. Res. Lett., doi:10.1029/2009gl039778,
Probing Mid-Mantle Heterogeneity Using PKP Coda Waves
 Probing Mid-Mantle Heterogeneity Using PKP Coda Waves Michael A.H. Hedlin and Peter M. Shearer Cecil H. and Ida M. Green Institute of Geophysics and Planetary Physics Scripps Institution of Oceanography,
Short scale heterogeneity in the lowermost mantle: insights from PcP-P and ScS-S data
 Earth and Planetary Science Letters 201 (2002) 57^68 www.elsevier.com/locate/epsl Short scale heterogeneity in the lowermost mantle: insights from PcP-P and ScS-S data Hrvoje Tkalc ic, Barbara Romanowicz
Geophysical Journal International
 Geophysical Journal International Geophys. J. Int. (2) 85, 385 42 doi:./j.365-246x.2.4945.x Tomographic errors from wave front healing: more than just afastbias Alison E. Malcolm and Jeannot Trampert 2
Recent Advances and Road Ahead for Global Seismology
 Long Range Science Plan for Seismology, Denver, 18-19 September 2008 Recent Advances and Road Ahead for Global Seismology (Opportunities and Challenges for Next Decade) Rob van der Hilst Massachusetts
Selected Seismic Observations of Upper-Mantle Discontinuities
 Selected Seismic Observations of Upper-Mantle Discontinuities Peter Shearer IGPP/SIO/U.C. San Diego August 31, 2009 Earthquake Research Institute Interface Depth vs. Publication Date Most depths are sampled
1. University of Ottawa 2. Dublin Institute for Advanced Studies 3. University of Texas at Austin
 Supplementary Figures: Azimuthal seismic anisotropy in the Earth s upper mantle and the thickness of tectonic plates A.J. Schaeffer 1, S. Lebedev 2 and T.W. Becker 3 Geophysical Journal International July
2008 Monitoring Research Review: Ground-Based Nuclear Explosion Monitoring Technologies
 STRUCTURE OF THE KOREAN PENINSULA FROM WAVEFORM TRAVEL-TIME ANALYSIS Roland Gritto 1, Jacob E. Siegel 1, and Winston W. Chan 2 Array Information Technology 1 and Harris Corporation 2 Sponsored by Air Force
Seismology 5: Body wave anisotropy
 Seismology 5: Body wave anisotropy what it is, how we study it, and what it can tell us about flow in the deep Earth Maureen D. Long, Yale University CIDER 7/8/16 Road map for today s talk Part I: Some
Shear wave splitting and waveform complexity for lowermost mantle structures with low-velocity lamellae and transverse isotropy
 JOURNAL OF GEOPHYSICAL RESEARCH, VOL. 109,, doi:10.1029/2003jb002546, 2004 Shear wave splitting and waveform complexity for lowermost mantle structures with low-velocity lamellae and transverse isotropy
Icelandic Lithosphere & Upper Mantle Structure. Natalia Solomatova
 Icelandic Lithosphere & Upper Mantle Structure Natalia Solomatova Location of Iceland maps.google.com Lithosphere Thickness Anomalously thick lithosphere beneath Greenland and Baltic shield may be due
Evaluation of 1-D and 3-D seismic models of the Pacific lower mantle with S, SKS, and SKKS traveltimes and amplitudes
 JOURNAL OF GEOPHYICAL REEARCH: OLID EARTH, VOL. 8,, doi:./jgrb.4, 3 Evaluation of -D and 3-D seismic models of the Pacific lower mantle with, K, and KK traveltimes and amplitudes Michael. Thorne, Yang
Azimuthal anisotropy in the D 00 layer beneath the Caribbean
 JOURNAL OF GEOPHYSICAL RESEARCH, VOL. 110,, doi:10.1029/2004jb003506, 2005 Azimuthal anisotropy in the D 00 layer beneath the Caribbean Valérie Maupin, 1 Edward J. Garnero, 2 Thorne Lay, 3 and Matthew
Tomographic Errors from Wavefront Healing: more than
 Geophys. J. Int. (2) 42, Tomographic Errors from Wavefront Healing: more than just a fast bias Alison E. Malcolm, Jeannot Trampert 2 Department of Earth, Atmospheric and Planetary Sciences, Massachusetts
Middle Mantle Seismic Structure of the African Superplume
 Pure Appl. Geophys. Ó 2012 Springer Basel AG DOI 10.1007/s00024-012-0589-y Pure and Applied Geophysics Middle Mantle Seismic Structure of the African Superplume MARTIN B. C. BRANDT 1,2 Abstract I present
Thin and Intermittent Ultra-Low Velocity Zones. School of Earth and Environment. University of Leeds. Leeds, LS2 9JT.
 Thin and Intermittent Ultra-Low Velocity Zones Sebastian Rost 1, Edward J. Garnero 2, Wolfgang Stefan 3 1 Institute of Geophysics and Tectonics School of Earth and Environment University of Leeds Leeds,
Seismic interferometry with antipodal station pairs
 GEOPHYSICAL RESEARCH LETTERS, VOL. 4, 1 5, doi:1.12/grl.597, 213 Seismic interferometry with antipodal station pairs Fan-Chi Lin 1 and Victor C. Tsai 1 Received 25 June 213; revised 19 August 213; accepted
Isotropy or weak vertical transverse isotropy in D 00 beneath the Atlantic Ocean
 JOURNAL OF GEOPHYSICAL RESEARCH, VOL. 109,, doi:10.1029/2004jb003004, 2004 Isotropy or weak vertical transverse isotropy in D 00 beneath the Atlantic Ocean Edward J. Garnero and Melissa M. Moore Department
SUPPLEMENTARY INFORMATION
 The major uncertainties in our model predictions arise from the input parameters, which include mantle density models (i.e. seismic tomography and choices about scaling velocities to temperature), crustal
Citation. As Published Publisher. Version. Accessed Fri Nov 24 02:47:25 EST 2017 Citable Link Terms of Use. Detailed Terms
 SKS and SPdKS sensitivity to two-dimensional ultralowvelocity zones The MIT Faculty has made this article openly available. Please share how this access benefits you. Your story matters. Citation As Published
Widespread seismic anisotropy in Earth s lowermost mantle beneath the Atlantic and Siberia
 Geology GSA Data Repository 21949 Widespread seismic anisotropy in Earth s lowermost mantle beneath the Atlantic and Siberia DOI:1.113/G45514.1 Michael Grund, Joachim R. R. Ritter (Email: michael.grund@kit.edu)
High-precision location of North Korea s 2009 nuclear test
 Copyright, Seismological Research Letters, Seismological Society of America 1 High-precision location of North Korea s 2009 nuclear test Lianxing Wen & Hui Long Department of Geosciences State University
Empirical Green s Function Analysis of the Wells, Nevada, Earthquake Source
 Nevada Bureau of Mines and Geology Special Publication 36 Empirical Green s Function Analysis of the Wells, Nevada, Earthquake Source by Mendoza, C. 1 and Hartzell S. 2 1 Centro de Geociencias, Universidad
Imaging the Gutenberg Seismic Discontinuity beneath the Oceanic Crust of the North American Plate
 Imaging the Gutenberg Seismic Discontinuity beneath the Oceanic Crust of the North American Plate Robbie Burgess 11-25-15 Dr. Nicholas Schmerr GEOL 394 1 1. Abstract: The lithosphere-asthenosphere boundary
Signal restoration through deconvolution applied to deep
 Geophys. J. Int. Preprint, June 27, 2006 Signal restoration through deconvolution applied to deep mantle seismic probes W. Stefan, E. Garnero, and R. A. Renaut Resubmitted June 27, 2006 SUMMARY We present
Contents of this file
 Geophysical Research Letters Supporting Information for Intraplate volcanism controlled by back-arc and continental structures in NE Asia inferred from trans-dimensional ambient noise tomography Seongryong
Physics of the Earth and Planetary Interiors
 Physics of the Earth and Planetary Interiors 176 (2009) 187 197 Contents lists available at ScienceDirect Physics of the Earth and Planetary Interiors journal h o mepage: www. e lsevier. com/ l o cate/
Slabs, plumes and their interaction: new insights from global anisotropy tomography
 Slabs, plumes and their interaction: new insights from global anisotropy tomography Ana M G Ferreira Seismological Laboratory, Department of Earth Sciences University College London, UK Sung-Joon Chang,
Sharpness of the D 00 discontinuity beneath the Cocos Plate: Implications for the perovskite to post-perovskite phase transition
 Click Here for Full Article GEOPHYSICAL RESEARCH LETTERS, VOL. 35, L03304, doi:10.1029/2007gl032465, 2008 Sharpness of the D 00 discontinuity beneath the Cocos Plate: Implications for the perovskite to
Geographic correlation between hot spots and deep mantle lateral shear-wave velocity gradients
 Physics of the Earth and Planetary Interiors 146 (2004) 47 63 Geographic correlation between hot spots and deep mantle lateral shear-wave velocity gradients Michael S. Thorne a,, Edward J. Garnero a, Stephen
Small-scale ultralow-velocity zone structure imaged by ScP
 JOURNAL OF GEOPHYSICAL RESEARCH, VOL. 108, NO. B1, 2056, doi:10.1029/2001jb001627, 2003 Small-scale ultralow-velocity zone structure imaged by ScP Sebastian Rost and Justin Revenaugh Department of Earth
Tomographic imaging of P wave velocity structure beneath the region around Beijing
 403 Doi: 10.1007/s11589-009-0403-9 Tomographic imaging of P wave velocity structure beneath the region around Beijing Zhifeng Ding Xiaofeng Zhou Yan Wu Guiyin Li and Hong Zhang Institute of Geophysics,
Observation of a Mid-Mantle Discontinuity beneath Northeast China from S to P Converted Waves Recorded by the USArray Stations
 Observation of a Mid-Mantle Discontinuity beneath Northeast China from S to P Converted Waves Recorded by the USArray Stations Fenglin Niu (Department of Earth Science, Rice University) Strong and localized
Evidence for P P asymmetrical scattering at near podal distances
 GEOPHYSICAL RESEARCH LETTERS, VOL. 39,, doi:10.1029/2012gl052179, 2012 Evidence for P P asymmetrical scattering at near podal distances Wenbo Wu, 1,2 Sidao Ni, 2 and Xiangfang Zeng 1 Received 3 May 2012;
C3.4.1 Vertical (radial) variations in mantle structure
 variations in mantle structure") C3.4 Mantle structure Mantle behaves as a solid on short time scales (seismic waves travel through it and this requires elastic behaviour). Over geological time scales the mantle behaves as a very viscous
C3.4 Mantle structure Mantle behaves as a solid on short time scales (seismic waves travel through it and this requires elastic behaviour). Over geological time scales the mantle behaves as a very viscous
Rupture Process of the Great 2004 Sumatra-Andaman Earthquake
 Rupture Process of the Great 2004 Sumatra-Andaman Earthquake Supporting Online Materials Submitted to Science, March 12, 2005 Charles J. Ammon 1, Ji Chen 2, Hong-Kie Thio 3, David Robinson 5, Sidao Ni
Some aspects of seismic tomography
 Some aspects of seismic tomography Peter Shearer IGPP/SIO/U.C. San Diego September 7, 2009 Earthquake Research Institute Part 1: Global Tomography P velocity perturbations 200 km 1000 km 2700 km MIT 2006
Complex seismic anisotropy in the top of the Earth s inner core beneath Africa
 Click Here for Full Article JOURNAL OF GEOPHYSICAL RESEARCH, VOL. 112,, doi:10.1029/2006jb004868, 2007 Complex seismic anisotropy in the top of the Earth s inner core beneath Africa Wen-che Yu 1 and Lianxing
Scattering objects in the lower mantle beneath northeastern China observed with a short-period seismic array
 Physics of the Earth and Planetary Interiors 138 (2003) 55 69 Scattering objects in the lower mantle beneath northeastern China observed with a short-period seismic array Tadashi Kito a,, Takuo Shibutani
The Earth s crustal structure is amazingly complex, consisting of
 Deep mantle structure and the postperovskite phase transition D. Helmberger*, T. Lay, S. Ni*, and M. Gurnis* *Seismological Laboratory, California Institute of Technology, Pasadena, CA 91125; and Department
Structural Cause of Missed Eruption in the Lunayyir Basaltic
 GSA DATA REPOSITORY 2015140 Supplementary information for the paper Structural Cause of Missed Eruption in the Lunayyir Basaltic Field (Saudi Arabia) in 2009 Koulakov, I., El Khrepy, S., Al-Arifi, N.,
Finite-frequency tomography
 Finite-frequency tomography Lapo Boschi (lapo@erdw.ethz.ch) October 14, 2009 Application of Born theory (scattering theory) to the ray-theory solution (the forward problem) In earlier lectures we have
Geophysical Journal International
 Geophysical Journal International Geophys. J. Int. (2016) 206, 659 674 Advance Access publication 2016 March 30 GJI Seismology doi: 10.1093/gji/ggw114 Ultralow-velocity zone geometries resolved by multidimensional
Constraints on the Presence or Absence of Post-Perovskite in the Lowermost Mantle From Long-Period Seismology
 GM01018_CH14.qxd 20/10/07 1:56 PM Page 191 Constraints on the Presence or Absence of Post-Perovskite in the Lowermost Mantle From Long-Period Seismology Christine Houser* Department of Earth and Planetary
The Earth s Structure from Travel Times
 from Travel Times Spherically symmetric structure: PREM - Crustal Structure - Upper Mantle structure Phase transitions Anisotropy - Lower Mantle Structure D D - Structure of of the Outer and Inner Core
SOEE3250/5675/5115 Inverse Theory Lecture 10; notes by G. Houseman
 SOEE3250/5675/5115 Inverse Theory Lecture 10; notes by G. Houseman Travel-time tomography Examples of regional lithospheric tomography CBP / SCP projects data acquisition: array / sources arrival time
Tracing rays through the Earth
 Tracing rays through the Earth Ray parameter p: source receiv er i 1 V 1 sin i 1 = sin i 2 = = sin i n = const. = p V 1 V 2 V n p is constant for a given ray i 2 i 3 i 4 V 2 V 3 V 4 i critical If V increases
Characterization of Induced Seismicity in a Petroleum Reservoir: A Case Study
 Characterization of Induced Seismicity in a Petroleum Reservoir: A Case Study Edmond Sze, M. Nafi Toksöz, and Daniel R. Burns Earth Resources Laboratory Dept. of Earth, Atmospheric and Planetary Sciences
Geophysical Journal International
 Geophysical Journal International Geophys. J. Int. (2017) 210, 774 786 Advance Access publication 2017 May 5 GJI Seismology doi: 10.1093/gji/ggx190 Lowermost mantle anisotropy near the eastern edge of
9th Workshop on Three-Dimensional Modelling of Seismic Waves Generation, Propagation and their Inversion
 1965-36 9th Workshop on Three-Dimensional Modelling of Seismic Waves Generation, Propagation and their Inversion 22 September - 4 October, 2008 Tomography and Active Tectonics in Kanto, Japan Francis T.
Distinct layering in the hemispherical seismic velocity structure of Earth s upper inner core
 JOURNAL OF GEOPHYSICAL RESEARCH, VOL. 116,, doi:10.1029/2011jb008650, 2011 Distinct layering in the hemispherical seismic velocity structure of Earth s upper inner core Lauren Waszek 1 and Arwen Deuss
Body Wave Tomography. Matt Fouch. ASU EarthScope Seminar January 26, 2010
 Body Wave Tomography Matt Fouch ASU EarthScope Seminar January 26, 2010 Seismic Tomography Mini-FAQ What is it? Earth sciences CAT-scan Measure of seismic wavespeeds or wavespeed variations Why do we care?
Mantle Anisotropy at Mid-Ocean Ridges
 Mantle Anisotropy at Mid-Ocean Ridges Andy Nowacki, Michael Kendall, James Wookey (Nowacki et al., EPSL, 2011) Plate spreading and seismic anisotropy Hess, 1964 MOR Anisotropy Anisotropy due to LPO versus
Earthquake location at teleseismic distances from 3-component records (Tutorial with exercise by hand)
") Topic Author Version Earthquake location at teleseismic distances from 3-component records (Tutorial with exercise by hand) Peter Bormann (formerly GFZ German Research Centre for Geosciences, D-14473 Potsdam,
Topic Author Version Earthquake location at teleseismic distances from 3-component records (Tutorial with exercise by hand) Peter Bormann (formerly GFZ German Research Centre for Geosciences, D-14473 Potsdam,
Detection of motion and heterogeneity in Earth s liquid outer core
 GEOPHYSICAL RESEARCH LETTERS, VOL. 35, L16311, doi:10.1029/2008gl034895, 2008 Detection of motion and heterogeneity in Earth s liquid outer core Wei Dai 1 and Xiaodong Song 1 Received 5 June 2008; revised