Figures S1 S4 show the measurements taken from the synthetic vespagrams where a)
|
|
|
- Michael Evan Rice
- 5 years ago
- Views:
Transcription
1
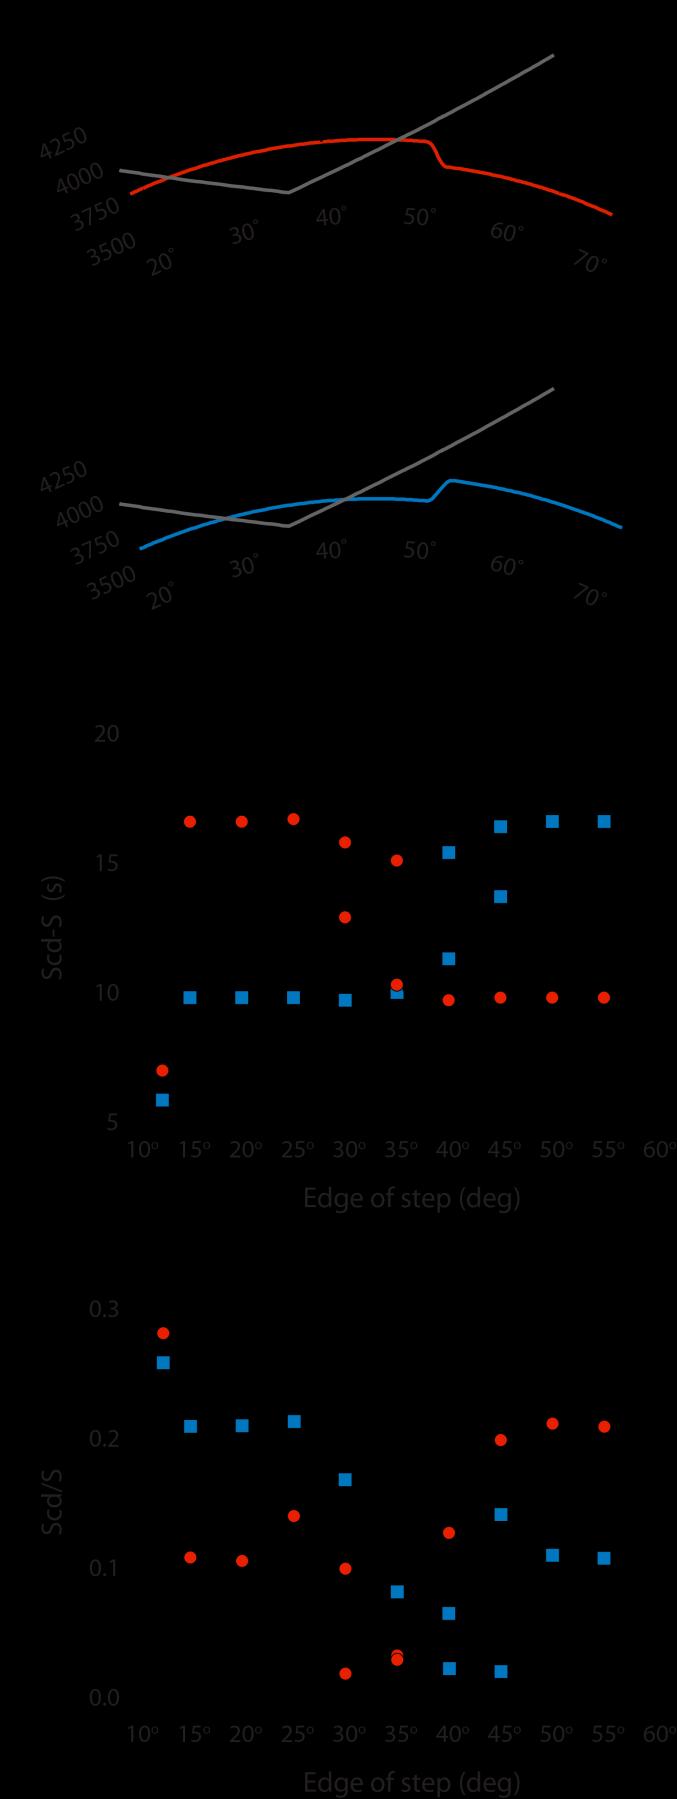
2 Figures S1 S4 show the measurements taken from the synthetic vespagrams where a) is the differential travel time versus the Dʺ discontinuity height, b) is the differential travel time versus δv S, c) is the differential slowness versus the Dʺ discontinuity height, d) is the differential slowness versus δv S, e) is the amplitude ratio versus the Dʺ discontinuity height, and f) is the amplitude ratio versus δv S for the bins 58-64, 64-70, 70-76, and respectively. The lines are best fit lines through the data points. Figure S1. Epicentral distance range: 58-64

3 Figure S2. Epicentral distance range:
4 Figure S3. Epicentral distance range: 70-76
5 Figure S4. Epicentral distance range: 76-82

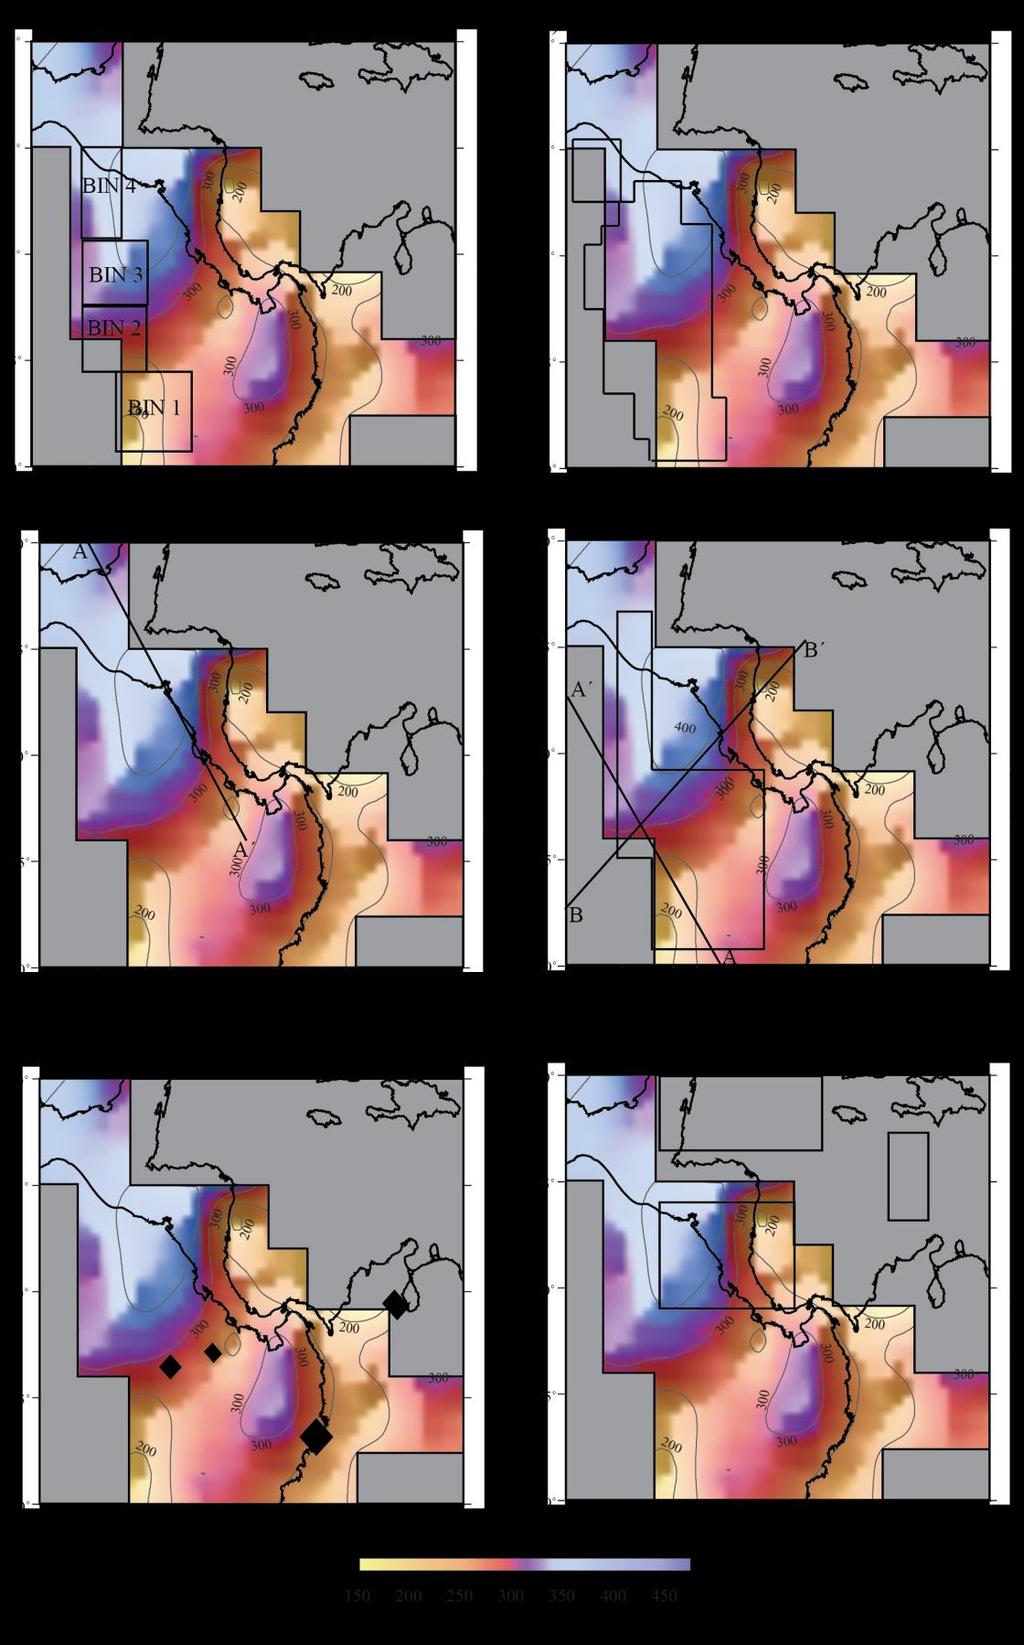
6 Figure S5. Contour map of the weighted average height of the Dʺ discontinuity using only the highest quality Scd picks. Figure S6. Contour map of the weighted average Dʺ discontinuity height using the low estimate of the double Scd arrival.

")


7 Figure S7. Contour map of the weighted average Dʺ discontinuity height using a) the original array bin centers, and b) shifting the bin centers in latitude and longitude by 1.5. Figure S8. Contour map of the weighted average Dʺ discontinuity height using a minimum of 20 stations per array bin.

8 8
9 Figure S9. Comparison of D" discontinuity height with previous study regions. The background is our results from Fig. 6b of the main paper. a) Displays the 4 bins used in the study of Lay et al., [2004]. b) The black boxes shows the area where positive arrivals were observed by Thomas et al., [2004]. c) Shows the position of the Shang et al., [2014] cross-section. d) Shows the positions of the cross-sections shown in the Hutko et al. [2006] study. e) The locations of ScS bouncepoints from the study of Kendall and Shearer [1994] are shown as black diamonds. f) The black boxes outline where the D" discontinuity was observed in the study of Kendall and Nangini [1996]. 9
10 10
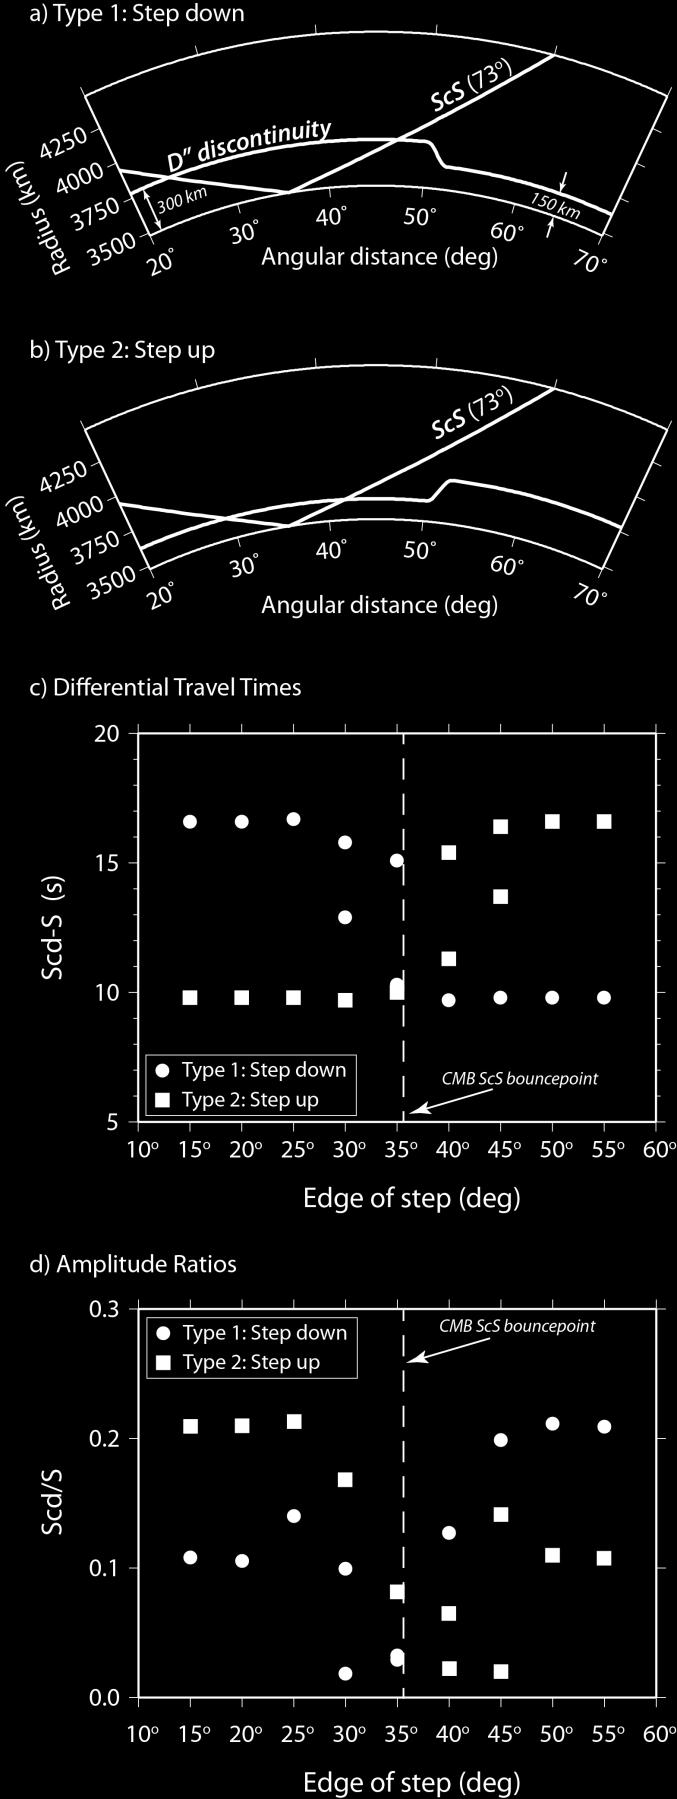
11 Figure S10. We computed synthetic seismograms for two types of models with step-like topography as shown in panels a) and b). In both panels the source is on the left-hand side of the plot and the receiver is on the right-hand side. a) The discontinuity is drawn for a step down in topography with a red line. b) The discontinuity is drawn for a step up in topography with a blue line. The ray path for an ScS arrival at a distance of 73 is drawn with the gray line. In both panels a) and b) the step occurs at an angular distance of 50. In both types of models the D" discontinuity has a height of 150 and 300 km for the two regions (shallowest height or greatest height above the CMB) and the synthetics are computed for a model with an S-wave velocity increase of 2% relative to PREM. c) Differential travel-times for Scd-S are shown for an array centered at 73 in epicentral distance as a function of the position of the step in discontinuity height. The results for models with a step down in topography are shown by the red circles, and the results for models with a step up in topography are shown by the blue squares. For the step down models, two Scd arrivals are observed when the edge of the step in the discontinuity lies between 30 and 35. For the step up models, two Scd arrivals are observed when the edge of the step in the discontinuity lies between 40 and 45. The position of the theoretical ScS bouncepoint for a 73 ScS arrival is indicated by the dashed line. d) Scd/S amplitude ratios are shown. As an example, consider the step down model in panel a). The edge of the step is located at an angular distance of 50. Here and ScS arrival at 73 encounters the portion of the discontinuity with the maximum height above the CMB. Consequently, Scd will arrive at its closest time with respect to the direct S-wave arrival. Thus the differential time Scd-S will be at a minimum when the positon of the step is at 50. This is reflected in panel c). 11
![Figure S11. Vespagrams and record sections are shown for data (left hand side) and synthetic seismograms through S-wave velocity model TXBW [Grand, 2002] (right hand side).](/docs-images/92/108026921/images/12-0.jpg "Data and synthetics are both for an event depth of 587 km, and sample a central ScS bounce point at 5 N, 75 W.")
12 Figure S11. Vespagrams and record sections are shown for data (left hand side) and synthetic seismograms through S-wave velocity model TXBW [Grand, 2002] (right hand side). Data and synthetics are both for an event depth of 587 km, and sample a central ScS bounce point at 5 N, 75 W. The peaks in the vespagrams for data are drawn with red crosses and the peaks in the synthetic vespagrams are drawn with blue crosses. The 12
13 red crosses for data are repeated in the synthetic vespagram for direct comparison. Note that absolute time and slowness of data peaks are shifted to be aligned with the direct S- wave arrival in the synthetic vespagram. All traces are displacement transverse component seismograms aligned and normalized to unity on the direct S-wave arrival. Approximate arrival times for the Scd and ScS arrivals for data are indicated by the dashed red lines and repeated in the right-hand column for comparison with synthetic predictions. Synthetic seismograms are shown for a dominant period of 10 s to match the dominant period of data shown in the left-hand column. 13
![Figure S12. Vespagrams and record sections are shown for data (left hand side) and synthetic seismograms through S-wave velocity model TXBW [Grand, 2002] (right hand side).](/docs-images/92/108026921/images/14-1.jpg "Data and synthetics are both for an event depth of 577 km, and sample a central ScS bounce point at 10 N, 80 W.")
14 Figure S12. Vespagrams and record sections are shown for data (left hand side) and synthetic seismograms through S-wave velocity model TXBW [Grand, 2002] (right hand side). Data and synthetics are both for an event depth of 577 km, and sample a central ScS bounce point at 10 N, 80 W. The peaks in the vespagrams for data are drawn with red crosses and the peaks in the synthetic vespagrams are drawn with blue crosses. The red crosses for data are repeated in the synthetic vespagram for direct comparison. Note 14
15 that absolute time and slowness of data peaks are shifted to be aligned with the direct S- wave arrival in the synthetic vespagram. All traces are displacement transverse component seismograms aligned and normalized to unity on the direct S-wave arrival. Approximate arrival times for the Scd and ScS arrivals for data are indicated by the dashed red lines and repeated in the right-hand column for comparison with synthetic predictions. Synthetic seismograms are shown for a dominant period of 7 s to match the dominant period of data shown in the left-hand column. 15
16 Figure S13. Vespagrams and record sections are shown for data (left hand side) and synthetic seismograms through S-wave velocity model TXBW [Grand, 2002] (right hand side). Data and synthetics are both for an event depth of 290 km, and sample a central ScS bounce point at 10 N, 85 W. The peaks in the vespagrams for data are drawn with red crosses and the peaks in the synthetic vespagrams are drawn with blue crosses. The red crosses for data are repeated in the synthetic vespagram for direct comparison. Note 16
17 that absolute time and slowness of data peaks are shifted to be aligned with the direct S- wave arrival in the synthetic vespagram. All traces are displacement transverse component seismograms aligned and normalized to unity on the direct S-wave arrival. Approximate arrival times for the Scd and ScS arrivals for data are indicated by the dashed red lines and repeated in the right-hand column for comparison with synthetic predictions. Synthetic seismograms are shown for a dominant period of 7 s to match the dominant period of data shown in the left-hand column. 17
18 Figure S14. Vespagrams and record sections are shown for data (left hand side) and synthetic seismograms through S-wave velocity model TXBW [Grand, 2002] (right hand side). Data and synthetics are both for an event depth of 120 km, and sample a central ScS bounce point at 10 N, 90 W. The peaks in the vespagrams for data are drawn with red crosses and the peaks in the synthetic vespagrams are drawn with blue crosses. The red crosses for data are repeated in the synthetic vespagram for direct comparison. Note 18
19 that absolute time and slowness of data peaks are shifted to be aligned with the direct S- wave arrival in the synthetic vespagram. All traces are displacement transverse component seismograms aligned and normalized to unity on the direct S-wave arrival. Approximate arrival times for the Scd, ScS, and ss arrivals for data are indicated by the dashed red lines and repeated in the right-hand column for comparison with synthetic predictions. Synthetic seismograms are shown for a dominant period of 10 s to match the dominant period of data shown in the left-hand column. 19
20 Figure S15. Vespagrams and record sections are shown for data (left hand column) and synthetic seismograms in the middle and right-hand columns. Data and synthetics are both for an event depth of 587 km, and sample a central ScS bounce point at 5 N, 75 W. The peaks in the vespagrams for data are drawn with red crosses and the peaks in the synthetic vespagrams are drawn with blue crosses. The red crosses for data are repeated in the synthetic vespagram for direct comparison. Note that absolute time and slowness of data peaks are shifted to be aligned with the direct S-wave arrival in the synthetic vespagram. All traces are displacement transverse component seismograms aligned and normalized to unity on the direct S-wave arrival. Approximate arrival times for the Scd and ScS arrivals for data are indicated by the dashed red lines and repeated in the righthand column for comparison with synthetic predictions. Synthetic seismograms are 20
21 shown for a dominant period of 10 s to match the dominant period of data shown in the left-hand column. Synthetics for the middle column are for a D" discontinuity model as inferred from this study with an S-wave velocity jump = +1% and a 50 km thick low velocity gradient zone at the bottom of the mantle. Synthetics for the right-hand column are for a D" discontinuity model as inferred from this study with an S-wave velocity jump = +2% and a 100 km thick low velocity gradient zone at the bottom of the mantle. 21

22 Figure S16. Vespagrams and record sections are shown for data (left hand column) and synthetic seismograms in the middle and right-hand columns. Data and synthetics are both for an event depth of 577 km, and sample a central ScS bounce point at 10 N, 80 W. The peaks in the vespagrams for data are drawn with red crosses and the peaks in the synthetic vespagrams are drawn with blue crosses. The red crosses for data are repeated in the synthetic vespagram for direct comparison. Note that absolute time and slowness of data peaks are shifted to be aligned with the direct S-wave arrival in the synthetic vespagram. All traces are displacement transverse component seismograms aligned and normalized to unity on the direct S-wave arrival. Approximate arrival times for the Scd and ScS arrivals for data are indicated by the dashed red lines and repeated in the righthand column for comparison with synthetic predictions. Synthetic seismograms are 22
23 shown for a dominant period of 7 s to match the dominant period of data shown in the left-hand column. Synthetics for the middle column are for a D" discontinuity model as inferred from this study with an S-wave velocity jump = +1% and a 50 km thick low velocity gradient zone at the bottom of the mantle. Synthetics for the right-hand column are for a D" discontinuity model as inferred from this study with an S-wave velocity jump = +2% and a 100 km thick low velocity gradient zone at the bottom of the mantle. 23
24 Figure S17. Vespagrams and record sections are shown for data (left hand column) and synthetic seismograms in the middle and right-hand columns. Data and synthetics are both for an event depth of 290 km, and sample a central ScS bounce point at 10 N, 85 W. The peaks in the vespagrams for data are drawn with red crosses and the peaks in the synthetic vespagrams are drawn with blue crosses. The red crosses for data are repeated in the synthetic vespagram for direct comparison. Note that absolute time and slowness of data peaks are shifted to be aligned with the direct S-wave arrival in the synthetic vespagram. All traces are displacement transverse component seismograms aligned and normalized to unity on the direct S-wave arrival. Approximate arrival times for the Scd and ScS arrivals for data are indicated by the dashed red lines and repeated in the righthand column for comparison with synthetic predictions. Synthetic seismograms are 24
25 shown for a dominant period of 7 s to match the dominant period of data shown in the left-hand column. Synthetics for the middle column are for a D" discontinuity model as inferred from this study with an S-wave velocity jump = +1% and a 50 km thick low velocity gradient zone at the bottom of the mantle. Synthetics for the right-hand column are for a D" discontinuity model as inferred from this study with an S-wave velocity jump = +2% and a 100 km thick low velocity gradient zone at the bottom of the mantle. 25

26 Figure S18. Vespagrams and record sections are shown for data (left hand column) and synthetic seismograms in the middle and right-hand columns. Data and synthetics are both for an event depth of 120 km, and sample a central ScS bounce point at 10 N, 90 W. The peaks in the vespagrams for data are drawn with red crosses and the peaks in the synthetic vespagrams are drawn with blue crosses. The red crosses for data are repeated in the synthetic vespagram for direct comparison. Note that absolute time and slowness of data peaks are shifted to be aligned with the direct S-wave arrival in the synthetic vespagram. All traces are displacement transverse component seismograms aligned and normalized to unity on the direct S-wave arrival. Approximate arrival times for the Scd, ScS, and ss arrivals for data are indicated by the dashed red lines and repeated in the right-hand column for comparison with synthetic predictions. Synthetic seismograms are shown for a dominant period of 10 s to match the dominant period of data shown in the 26
27 left-hand column. Synthetics for the middle column are for a D" discontinuity model as inferred from this study with an S-wave velocity jump = +1% and a 50 km thick low velocity gradient zone at the bottom of the mantle. Synthetics for the right-hand column are for a D" discontinuity model as inferred from this study with an S-wave velocity jump = +2% and a 100 km thick low velocity gradient zone at the bottom of the mantle. 27

28 Figure S19. Vespagrams and record sections are shown for two examples that indicate a possible negative impedance reflector above the D" discontinuity. All traces are displacement transverse component seismograms aligned and normalized to unity on the direct S-wave arrival. Approximate arrival times for the Scd and ScS arrivals for data are indicated by the dashed red lines. 28

29 Figure S20. S-wave velocity model (orange line) compared to PREM model (gray line) used for double-crossing synthetics shown in Fig. 7b. The model has a D" discontinuity at 300 km above the CMB with a δv S of 2% and a second discontinuity 50 km above the CMB with a δv S of 0% with respect to the PREM model. 29
 Average epicentral distance is shown considering all observations used in this study.")
30 Figure S21. Shown is the average epicentral distance between events and array centroid. The epicentral distances are averaged in 3 3 geographic bins at the ScS bounce point location. Great circle arc distances are shifted to a common event depth of 500 km. (a) Average epicentral distance is shown considering all observations used in this study. (b) Average epicentral distance is shown only considering good Scd observations. (c) Average epicentral distance is shown considering all observations that showed no Scd arrival. 30

31 31
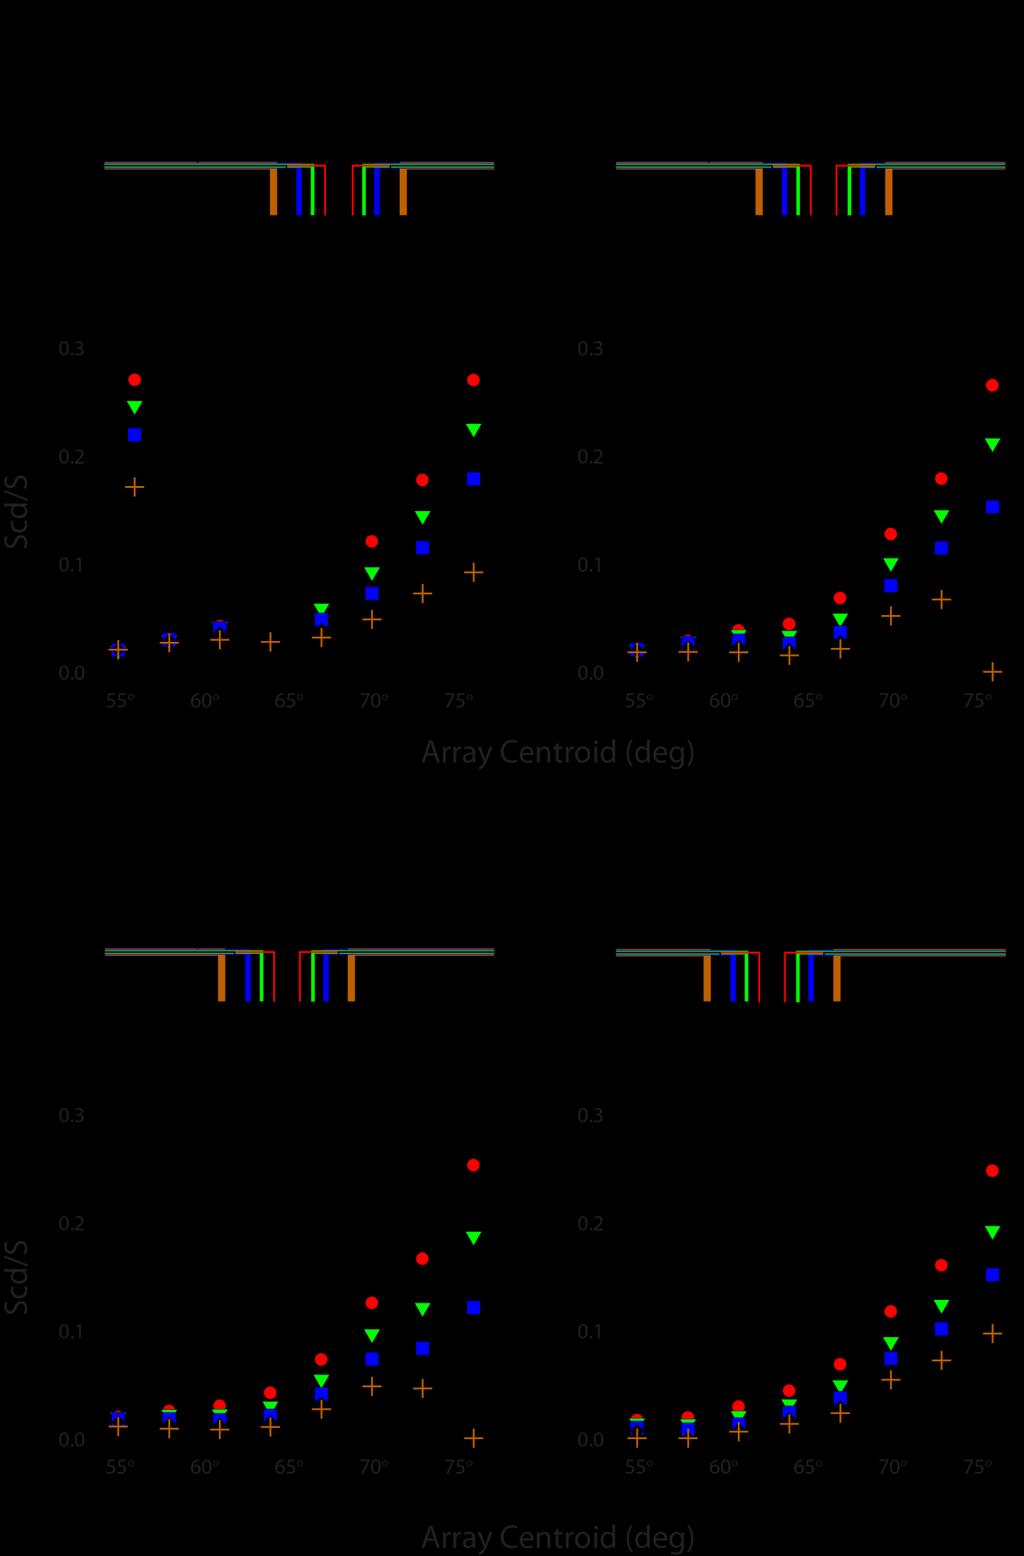
32 Figure S22. In each panel the top plot shows a cartoon of the position of the D" discontinuity. It is drawn where the length of the hole in the discontinuity is either 2 (red), 4 (green), 6 (blue), 8 (black), or 10 (orange). The discontinuity hole is centered for an ScS bounce point on the CMB of a) 38, b) 36, c) 34, and d) 32. The lower plot of each panel shows the Scd/S amplitude ratio for each model as a function of the array centroid. In each plot the black line shows the Scd/S amplitude ratio for a 1-D D" discontinuity model with a height of 300 km and S-wave velocity increase of 2%. The colored points correspond to models where the hole has a length of: 2 (red), 4 (green), 6 (blue), 8 (black), or 10 (orange). 32
![Figure S23. Comparison between our inferred zones (northern, central, and southern regions) with anisotropy results from Rokosky et al., [2004].](/docs-images/92/108026921/images/33-0.jpg "The anisotropy results suggest two areas where SH- is predominantly fast (areas approximately outlined by purple areas) and one area with a mixture of SH- and SV-fast (area approximately outlined in")
33 Figure S23. Comparison between our inferred zones (northern, central, and southern regions) with anisotropy results from Rokosky et al., [2004]. The anisotropy results suggest two areas where SH- is predominantly fast (areas approximately outlined by purple areas) and one area with a mixture of SH- and SV-fast (area approximately outlined in green). These areas are overlain with our observations for discontinuity height for the Scd observations recorded within the epicentral distance range: 70 Δ 82. The red circles show the locations of ScS bounce points for event-array pairs that show strong Scd arrivals. The blue circles show possible Scd arrivals and the black dots show non-observations. The dashed blue line separates three possible distinct regions of waveform behavior. 33
34 Tables Table 1. Events used in this study EVENT ID Latitude Longitude Depth (km) M w Records
35 EVENT ID Latitude Longitude Depth (km) M w Records
36 References Grand, S. P. (2002), Mantle shear-wave tomography and the fate of subducted slabs, Philosophical Transactions of the Royal Society London A, 360, , doi: /rsta Hutko, A. R., T. Lay, E. J. Garnero, and J. Revenaugh (2006), Seismic detection of folded, subducted lithosphere at the core mantle boundary, Nature, 441, , doi: /nature Kendall, J.-M., and P. M. Shearer (1994), Lateral variations in D" thickness from longperiod shear wave data, J. Geophys. Res., 99(B6), 11, ,590. Kendall, J.-M., and C. Nangini (1996), Lateral variations in D" below the Caribbean, Geophys. Res. Lett., 23(4), Lay, T., E. J. Garnero, and S. A. Russell (2004), Lateral variation of the D" discontinuity beneath the Cocos Plate, Geophys. Res. Lett., 31(L15612), doi: /2004GL Rokosky, J. M., T. Lay, E. J. Garnero, and S. A. Russell (2004), High-resolution investigation of shear wave anisotropy in D" beneath the Cocos Plate, Geophys. Res. Lett., 31, L07605, doi: /2003GL Shang, X., S.-H. Shim, M. V. De Hoop, and R. D. Van der Hilst (2014), Multiple seismic reflectors in Earth's lowermost mantle, Proc. Nat. Acad. Sci. U.S.A., doi: /pnas Thomas, C., E. J. Garnero, and T. Lay (2004), High-resolution imaging of lowermost mantle structure under the Cocos plate, J. Geophys. Res., 109(B08307), doi: /2004JB
37 37
Lateral variation of the D 00 discontinuity beneath the Cocos Plate
 GEOPHYSICAL RESEARCH LETTERS, VOL. 31, L15612, doi:10.1029/2004gl020300, 2004 Lateral variation of the D 00 discontinuity beneath the Cocos Plate T. Lay Earth Sciences Department, University of California,
Thorne, Garnero, Jahnke, Igel, McNamara Supplementary Material - 1 -
 Supplementary Material S1. Bin Location Map Location of 2.5 2.5 bins for which data was obtained to infer the ULVZ distribution. The preferred ULVZ model is drawn (yellow areas). Gray shaded regions indicate
Seismology and Deep Mantle Temperature Structure. Thorne Lay
 Seismology and Deep Mantle Temperature Structure Thorne Lay Travel time of seismic phases vs. angular distance PREM Preliminary Reference Earth Model Dziewonski and Anderson [1981, PEPI] Basic fact:
MYRES Seismic Constraints on Boundary Layers. Christine Thomas
 MYRES 2004 Seismic Constraints on Boundary Layers Christine Thomas Outline Seismic constraints: what can we resolve? how can we detect seismic structures? how well can we resolve these structures? (resolution
Sharpness of the D 00 discontinuity beneath the Cocos Plate: Implications for the perovskite to post-perovskite phase transition
 Click Here for Full Article GEOPHYSICAL RESEARCH LETTERS, VOL. 35, L03304, doi:10.1029/2007gl032465, 2008 Sharpness of the D 00 discontinuity beneath the Cocos Plate: Implications for the perovskite to
Selected Seismic Observations of Upper-Mantle Discontinuities
 Selected Seismic Observations of Upper-Mantle Discontinuities Peter Shearer IGPP/SIO/U.C. San Diego August 31, 2009 Earthquake Research Institute Interface Depth vs. Publication Date Most depths are sampled
3D IMAGING OF THE EARTH S MANTLE: FROM SLABS TO PLUMES
 3D IMAGING OF THE EARTH S MANTLE: FROM SLABS TO PLUMES Barbara Romanowicz Department of Earth and Planetary Science, U. C. Berkeley Dr. Barbara Romanowicz, UC Berkeley (KITP Colloquium 9/11/02) 1 Cartoon
Continent-sized anomalous zones with low seismic velocity at the base of Earth s mantle
 SUPPLEMENTARY INFORMATION DOI: 10.1038/NGEO2733 Continent-sized anomalous zones with low seismic velocity at the base of Earth s mantle Edward J. Garnero 1, Allen K. McNamara 1, and Sang-Heon D. Shim 1
BRIEF ARTICLE THE AUTHOR
 BRIEF ARTICLE THE AUTHOR 1 2 THE AUTHOR S Pd K Pd S mantle OC IC CMB Figure 1 Figure 1. Illustration of the SPdKS / SKPdS ray-paths with sub-segments labeled. SPdKS is an SKS that intersects the source-side
Seismogram Interpretation. Seismogram Interpretation
 Travel times in the Earth Ray paths, phases and their name Wavefields in the Earth: SH waves, P-SV waves Seismic Tomography Receiver Functions Seismogram Example Long-period transverse displacement for
Supplementary Online Material for. Seismic evidence for a chemically distinct thermochemical reservoir in Earth s deep mantle beneath Hawaii
 Supplementary Online Material for Seismic evidence for a chemically distinct thermochemical reservoir in Earth s deep mantle beneath Hawaii Authors: Chunpeng Zhao 1, Edward J. Garnero 1,*, Allen K. McNamara
Geographic boundary and shear wave velocity structure of the Pacific anomaly near the core mantle boundary beneath western Pacific
 Earth and Planetary Science Letters 244 (2006) 302 314 www.elsevier.com/locate/epsl Geographic boundary and shear wave velocity structure of the Pacific anomaly near the core mantle boundary beneath western
Characterization of the D beneath the Galapagos Islands using SKKS and SKS waveforms
 Earthq Sci (2011)24: 87 99 87 doi:10.1007/s11589-011-0772-8 Characterization of the D beneath the Galapagos Islands using SKKS and SKS waveforms Elizabeth Vanacore 1,2, and Fenglin Niu 1 1 Department of
boundaries with additional record sections, as emphasized in Fig. S2. The observations at the
 Data used to Sample African Anomaly. The great circle paths of the source-receiver combinations used in this study are shown in Fig. S1. The event information is given in Table S1. Abrupt Changes across
SUPPLEMENTARY INFORMATION
 SUPPLEMENTARY INFORMATION Seismic evidence for a global low velocity layer within the Earth s upper mantle SUPPLEMENTARY MATERIAL Benoît Tauzin 1, Eric Debayle 2 & Gérard Wittlinger 3 1 Department of Earth
Lower mantle tomography and phase change mapping
 Click Here for Full Article JOURNAL OF GEOPHYSICAL RESEARCH, VOL. 113,, doi: 10.1029/2007JB005289, 2008 Lower mantle tomography and phase change mapping Daoyuan Sun 1 and Don Helmberger 1 Received 23 July
Investigating Causes of D Anisotropy
 Investigating Causes of D Anisotropy J.-M. Kendall and P. G. Silver in: The Core-Mantle Boundary Region, AGU, 1998. MDL 3/15/04 Although most of the lower mantle (below 660km) appears to be isotropic,
Estimation of S-wave scattering coefficient in the mantle from envelope characteristics before and after the ScS arrival
 GEOPHYSICAL RESEARCH LETTERS, VOL. 30, NO. 24, 2248, doi:10.1029/2003gl018413, 2003 Estimation of S-wave scattering coefficient in the mantle from envelope characteristics before and after the ScS arrival
Some aspects of seismic tomography
 Some aspects of seismic tomography Peter Shearer IGPP/SIO/U.C. San Diego September 7, 2009 Earthquake Research Institute Part 1: Global Tomography P velocity perturbations 200 km 1000 km 2700 km MIT 2006
Structural features and shear-velocity structure of the Pacific Anomaly. Lianxing Wen a. Yumei He a,b
 Structural features and shear-velocity structure of the Pacific Anomaly Yumei He a,b Lianxing Wen a a Department of Geosciences, State University of New York at Stony Brook, Stony Brook, New York, USA
Shear velocity variation within the D 00 region beneath the central Pacific
 JOURNAL OF GEOPHYSICAL RESEARCH, VOL. 111,, doi:10.1029/2004jb003270, 2006 Shear velocity variation within the D 00 region beneath the central Pacific Megan Avants, 1 Thorne Lay, 2 Sara A. Russell, 3,4,5
Imaging the Gutenberg Seismic Discontinuity beneath the Oceanic Crust of the North American Plate
 Imaging the Gutenberg Seismic Discontinuity beneath the Oceanic Crust of the North American Plate Robbie Burgess 11-25-15 Dr. Nicholas Schmerr GEOL 394 1 1. Abstract: The lithosphere-asthenosphere boundary
A magnitude 7.4 earthquake struck 255 km (158 miles) southwest of Tonga, according to the US Geological Survey, but there were no reports of damage.
 southwest of Tonga, according to the US Geological Survey, but there were no reports of damage.") A magnitude 7.4 earthquake struck 255 km (158 miles) southwest of Tonga, according to the US Geological Survey, but there were no reports of damage. The earthquake hit at 5:19 am local time and was centered
A magnitude 7.4 earthquake struck 255 km (158 miles) southwest of Tonga, according to the US Geological Survey, but there were no reports of damage. The earthquake hit at 5:19 am local time and was centered
An SH hybrid method and shear velocity structures in the lowermost mantle beneath the central Pacific and South Atlantic Oceans
 JOURNAL OF GEOPSICAL RESEARCH, VOL. 7, NO. B,.9/JB499, An SH hybrid method and shear velocity structures in the lowermost mantle beneath the central Pacific and South Atlantic Oceans Lianxing Wen Department
Data Repository: Seismic and Geodetic Evidence For Extensive, Long-Lived Fault Damage Zones
 DR2009082 Data Repository: Seismic and Geodetic Evidence For Extensive, Long-Lived Fault Damage Zones Fault Zone Trapped Wave Data and Methods Fault zone trapped waves observed for 2 shots and 5 local
Supplementary Figure 1. Distribution of seismic event locations determined using the final 3-D velocity model. We separate the crust-related
 Supplementary Figure 1. Distribution of seismic event locations determined using the final 3-D velocity model. We separate the crust-related seismicity at depths of less than 40 km (panel A) from the deeper
C3.4.1 Vertical (radial) variations in mantle structure
 variations in mantle structure") C3.4 Mantle structure Mantle behaves as a solid on short time scales (seismic waves travel through it and this requires elastic behaviour). Over geological time scales the mantle behaves as a very viscous
C3.4 Mantle structure Mantle behaves as a solid on short time scales (seismic waves travel through it and this requires elastic behaviour). Over geological time scales the mantle behaves as a very viscous
29th Monitoring Research Review: Ground-Based Nuclear Explosion Monitoring Technologies MODELING P WAVE MULTIPATHING IN SOUTHEAST ASIA
 MODELING P WAVE MULTIPATHING IN SOUTHEAST ASIA Ali Fatehi and Keith D. Koper Saint Louis University Sponsored by the Air Force Research Laboratory ABSTRACT Contract No. FA8718-06-C-0003 We have used data
Azimuthal anisotropy in the D 00 layer beneath the Caribbean
 JOURNAL OF GEOPHYSICAL RESEARCH, VOL. 110,, doi:10.1029/2004jb003506, 2005 Azimuthal anisotropy in the D 00 layer beneath the Caribbean Valérie Maupin, 1 Edward J. Garnero, 2 Thorne Lay, 3 and Matthew
Three-dimensional structure of the African superplume from waveform modelling
 Geophys. J. Int. (5) 161, 283 294 doi: 1.1111/j.1365-X.5.258.x Three-dimensional structure of the African superplume from waveform modelling Sidao Ni, 1,2 Don V. Helmberger 2 and Jeroen Tromp 2 1 School
Imaging sharp lateral velocity gradients using scattered waves on dense arrays: faults and basin edges
 2017 SCEC Proposal Report #17133 Imaging sharp lateral velocity gradients using scattered waves on dense arrays: faults and basin edges Principal Investigator Zhongwen Zhan Seismological Laboratory, California
The Earth is Red; Dominance of large wavelength features in mantle boundary layers. Adam M. Dziewonski
 The Earth is Red; Dominance of large wavelength features in mantle boundary layers Adam M. Dziewonski KITP, EARTH08, July 2, 2008 Kircher, 1665 Imagining ca. Earth s 2005 Interior from E. Garnero s files
SUPPLEMENTARY INFORMATION
 doi:10.1038/nature11492 Figure S1 Short-period Seismic Energy Release Pattern Imaged by F-net. (a) Locations of broadband seismograph stations in Japanese F-net used for the 0.5-2.0 Hz P wave back-projection
Reconciling the Post-Perovskite Phase With Seismological Observations of Lowermost Mantle Structure
 GM01018_CH11.qxd 20/10/07 1:53 PM Page 129 Reconciling the Post-Perovskite Phase With Seismological Observations of Lowermost Mantle Structure Thorne Lay Department of Earth and Planetary Sciences, University
29th Monitoring Research Review: Ground-Based Nuclear Explosion Monitoring Technologies
 TRANSITION ZONE WAVE PROPAGATION: CHARACTERIZING TRAVEL-TIME AND AMPLITUDE INFORMATION Peter M. Shearer and Jesse F. Lawrence University of California San Diego, Institute of Geophysics and Planetary Physics
CHAPTER 2. Seismology (continued)
") CHAPTER 2 Seismology (continued) 2.1 A tour through the Earth. The gross structure of the Earth and its division into core, mantle and crust were determined by seismologists early in this century. More
CHAPTER 2 Seismology (continued) 2.1 A tour through the Earth. The gross structure of the Earth and its division into core, mantle and crust were determined by seismologists early in this century. More
Fenglin Niu and Hitoshi Kawakatsu. Earthquake Research Institute, University of Tokyo, Yayoi, Bunkyo-ku, Tokyo , Japan
 Earth Planets Space, 50, 965 975, 1998 Determination of the absolute depths of the mantle transition zone discontinuities beneath China: Effect of stagnant slabs on transition zone discontinuities Fenglin
Whole Mantle Convection
 Whole Mantle Convection Overview 1. Evidence for whole mantle convection 2. Model of whole mantle convection reconciling geophysical and geochemical data Transition Zone Water Filter Model 3. Evidence
Geophysical Journal International
 Geophysical Journal International Geophys. J. Int. (2013) 194, 1091 1118 Advance Access publication 2013 May 29 doi: 10.1093/gji/ggt152 The origin of D reflections: a systematic study of seismic array
Shear wave splitting and waveform complexity for lowermost mantle structures with low-velocity lamellae and transverse isotropy
 JOURNAL OF GEOPHYSICAL RESEARCH, VOL. 109,, doi:10.1029/2003jb002546, 2004 Shear wave splitting and waveform complexity for lowermost mantle structures with low-velocity lamellae and transverse isotropy
Complex seismic anisotropy in the top of the Earth s inner core beneath Africa
 Click Here for Full Article JOURNAL OF GEOPHYSICAL RESEARCH, VOL. 112,, doi:10.1029/2006jb004868, 2007 Complex seismic anisotropy in the top of the Earth s inner core beneath Africa Wen-che Yu 1 and Lianxing
Survey of precursors to P 0 P 0 : Fine structure of mantle discontinuities
 JOURNAL OF GEOPHYSICAL RESEARCH, VOL. 108, NO. B1, 2024, doi:10.1029/2001jb000817, 2003 Survey of precursors to P 0 P 0 : Fine structure of mantle discontinuities Fei Xu and John E. Vidale Department of
Small-scale lateral variations in azimuthally anisotropic D structure beneath the Cocos Plate
 Earth and Planetary Science Letters 248 (2006) 411 425 www.elsevier.com/locate/epsl Small-scale lateral variations in azimuthally anisotropic D structure beneath the Cocos Plate Juliana M. Rokosky a,,
Nonparametric Methods for Detecting Structure and Dynamics of Earth s Deep Interior. The Wahba Conference June 6, 2014
 Nonparametric Methods for Detecting Structure and Dynamics of Earth s Deep Interior The Wahba Conference June 6, 2014 Connection with Grace Ph.D with Chong Gu (First generation) Postdoc with Jun S Liu
Supporting Information for An automatically updated S-wave model of the upper mantle and the depth extent of azimuthal anisotropy
 GEOPHYSICAL RESEARCH LETTERS Supporting Information for An automatically updated S-wave model of the upper mantle and the depth extent of azimuthal anisotropy Eric Debayle 1, Fabien Dubuffet 1 and Stéphanie
Global 1-D Earth models
 Topic Global 1-D Earth models Compiled Peter Bormann (formerly GeoForschungsZentrum Potsdam, Telegrafenberg, by D-14473 Potsdam, Germany); E-mail: pb65@gmx.net Version March 2002 Below, data and background
The Earth s crustal structure is amazingly complex, consisting of
 Deep mantle structure and the postperovskite phase transition D. Helmberger*, T. Lay, S. Ni*, and M. Gurnis* *Seismological Laboratory, California Institute of Technology, Pasadena, CA 91125; and Department
1. University of Ottawa 2. Dublin Institute for Advanced Studies 3. University of Texas at Austin
 Supplementary Figures: Azimuthal seismic anisotropy in the Earth s upper mantle and the thickness of tectonic plates A.J. Schaeffer 1, S. Lebedev 2 and T.W. Becker 3 Geophysical Journal International July
Observation of shear-wave splitting from microseismicity induced by hydraulic fracturing: A non-vti story
 Observation of shear-wave splitting from microseismicity induced by hydraulic fracturing: A non-vti story Petr Kolinsky 1, Leo Eisner 1, Vladimir Grechka 2, Dana Jurick 3, Peter Duncan 1 Summary Shear
Vertical coherence in mantle heterogeneity from global seismic data
 GEOPHYSICAL RESEARCH LETTERS, VOL. 38,, doi:10.1029/2011gl049281, 2011 Vertical coherence in mantle heterogeneity from global seismic data L. Boschi 1,2 and T. W. Becker 3 Received 11 August 2011; revised
Dynamic Subsidence and Uplift of the Colorado Plateau. Supplementary Material
 GSA DATA REPOSITORY 2010177 Liu and Gurnis Dynamic Subsidence and Uplift of the Colorado Plateau Supplementary Material Lijun Liu and Michael Gurnis Seismological Laboratory California Institute of Technology
Observation of a Mid-Mantle Discontinuity beneath Northeast China from S to P Converted Waves Recorded by the USArray Stations
 Observation of a Mid-Mantle Discontinuity beneath Northeast China from S to P Converted Waves Recorded by the USArray Stations Fenglin Niu (Department of Earth Science, Rice University) Strong and localized
Isotropy or weak vertical transverse isotropy in D 00 beneath the Atlantic Ocean
 JOURNAL OF GEOPHYSICAL RESEARCH, VOL. 109,, doi:10.1029/2004jb003004, 2004 Isotropy or weak vertical transverse isotropy in D 00 beneath the Atlantic Ocean Edward J. Garnero and Melissa M. Moore Department
Changbaishan volcanism in northeast China linked to subduction-induced mantle upwelling
 SUPPLEMENTARY INFORMATION DOI: 10.1038/NGEO2166 Changbaishan volcanism in northeast China linked to subduction-induced mantle upwelling Youcai Tang, Masayuki Obayashi, Fenglin Niu, Stephen P. Grand, Yongshun
Global surface-wave tomography
 Global surface-wave tomography Lapo Boschi (lapo@erdw.ethz.ch) October 7, 2009 Love and Rayleigh waves, radial anisotropy Whenever an elastic medium is bounded by a free surface, coherent waves arise that
ANEWJOINTP AND S VELOCITY MODEL OF THE MANTLE PARAMETERIZED IN CUBIC B-SPLINES
 ANEWJOINTP AND S VELOCITY MODEL OF THE MANTLE PARAMETERIZED IN CUBIC B-SPLINES Michael Antolik, Göran Ekström, Adam M. Dziewonski, Yu J. Gu, Jian-feng Pan, and Lapo Boschi Department of Earth and Planetary
Broadband converted phases from midmantle discontinuities
 Earth Planets Space, 50, 987 997, 1998 Broadband converted phases from midmantle discontinuities Lev Vinnik 1,2, Fenglin Niu 1, and Hitoshi Kawakatsu 1 1 Earthquake Research Institute, University of Tokyo,
Thermal and compositional variations in the mantle inferred from the impedance contrast at the 410-km and 660-km discontinuities
 2018/04/9 Thermal and compositional variations in the mantle inferred from the impedance contrast at the 410-km and 660-km discontinuities AUTHOR: YOUCHUAN WANG ADVISOR: NICHOLAS SCHMERR AND QUANCHENG
Magnitude 7.1 SOUTH SANDWICH ISLANDS
 A magnitude 7.1 earthquake occurred at a depth of 164.7 km (102 miles) in the South Sandwich Islands, an uninhabited British territory off the coast of Argentina in the southern Atlantic Ocean. Antarctica
Geophysical Journal International
 Geophysical Journal International Geophys. J. Int. (2012) 191, 1361 1373 doi: 10.1111/j.1365-246X.2012.05683.x Do double SS precursors mean double discontinuities? Zhao Zheng 1 and Barbara Romanowicz 1,2
The Earth s Structure from Travel Times
 from Travel Times Spherically symmetric structure: PREM - Crustal Structure - Upper Mantle structure Phase transitions Anisotropy - Lower Mantle Structure D D - Structure of of the Outer and Inner Core
Magnitude 7.3 OFFSHORE EL SALVADOR
 A magnitude 7.3 earthquake struck off the Pacific coast of Central America late Monday night, early reports indicate one death. The earthquake occurred at a depth of 40 km (24.9 miles). Its epicenter was
Scattering objects in the lower mantle beneath northeastern China observed with a short-period seismic array
 Physics of the Earth and Planetary Interiors 138 (2003) 55 69 Scattering objects in the lower mantle beneath northeastern China observed with a short-period seismic array Tadashi Kito a,, Takuo Shibutani
Tomography of the 2011 Iwaki earthquake (M 7.0) and Fukushima
 and Fukushima") 1 2 3 Auxiliary materials for Tomography of the 2011 Iwaki earthquake (M 7.0) and Fukushima nuclear power plant area 4 5 6 7 8 9 Ping Tong 1,2, Dapeng Zhao 1 and Dinghui Yang 2 [1] {Department of Geophysics,
1 2 3 Auxiliary materials for Tomography of the 2011 Iwaki earthquake (M 7.0) and Fukushima nuclear power plant area 4 5 6 7 8 9 Ping Tong 1,2, Dapeng Zhao 1 and Dinghui Yang 2 [1] {Department of Geophysics,
Constraints on the Presence or Absence of Post-Perovskite in the Lowermost Mantle From Long-Period Seismology
 GM01018_CH14.qxd 20/10/07 1:56 PM Page 191 Constraints on the Presence or Absence of Post-Perovskite in the Lowermost Mantle From Long-Period Seismology Christine Houser* Department of Earth and Planetary
Reflection Seismic Method
 Reflection Seismic Method Data and Image sort orders; Seismic Impedance; -D field acquisition geometries; CMP binning and fold; Resolution, Stacking charts; Normal Moveout and correction for it; Stacking;
Trans-Pacific upper mantle shear velocity structure
 Click Here for Full Article JOURNAL OF GEOPHYSICAL RESEARCH, VOL. 112,, doi:10.1029/2006jb004853, 2007 Trans-Pacific upper mantle shear velocity structure Ying Tan 1 and Don V. Helmberger 1 Received 10
Seismic ray path variations in a 3D global velocity model
 Physics of the Earth and Planetary Interiors 141 (2004) 153 166 Seismic ray path variations in a 3D global velocity model Dapeng Zhao, Jianshe Lei Geodynamics Research Center, Ehime University, Matsuyama
Magnitude 7.1 NEAR THE EAST COAST OF HONSHU, JAPAN
 Japan was rattled by a strong aftershock and tsunami warning Thursday night nearly a month after a devastating earthquake and tsunami flattened the northeastern coast. This earthquake can be considered
2008 Monitoring Research Review: Ground-Based Nuclear Explosion Monitoring Technologies
 STRUCTURE OF THE KOREAN PENINSULA FROM WAVEFORM TRAVEL-TIME ANALYSIS Roland Gritto 1, Jacob E. Siegel 1, and Winston W. Chan 2 Array Information Technology 1 and Harris Corporation 2 Sponsored by Air Force
The lowermost mantle beneath northern Asia II. Evidence for lower-mantle anisotropy
 Geophys. J. Int. (22) 151, 296 38 he lowermost mantle beneath northern Asia II. Evidence for lower-mantle anisotropy Ch. homas 1, and J.-M. Kendall 2 1 Department of Earth Sciences, University of Liverpool,
Data Repository Item
 Data Repository Item 2009003 An abrupt transition from magma-starved to magma-rich rifting in the eastern Black Sea Donna J. Shillington, Caroline L. Scott, Timothy A. Minshull, Rosemary A. Edwards, Peter
Aspects of Observational Seismology
 Aspects of Observational Seismology Peter M. Shearer Institute of Geophysics and Planetary Physics Scripps Institution of Oceanography University of California, San Diego Notes for Caltech class January
Simultaneous inversion for mantle shear velocity and topography of transition zone discontinuities
 Geophys. J. Int. (23) 154, 559 583 Simultaneous inversion for mantle shear velocity and topography of transition zone discontinuities Yu J. Gu, Adam M. Dziewoński and Göran Ekström Department of Earth
Magnitude 8.3 SEA OF OKHOTSK
 A powerful earthquake in Russia's Far East was felt as far away as Moscow, about 7,000 kilometers (4,400 miles) west of the epicenter, but no casualties or damage were reported. The epicenter was in the
SUPPLEMENTARY INFORMATION
 The major uncertainties in our model predictions arise from the input parameters, which include mantle density models (i.e. seismic tomography and choices about scaling velocities to temperature), crustal
Tracing rays through the Earth
 Tracing rays through the Earth Ray parameter p: source receiv er i 1 V 1 sin i 1 = sin i 2 = = sin i n = const. = p V 1 V 2 V n p is constant for a given ray i 2 i 3 i 4 V 2 V 3 V 4 i critical If V increases
Geophysical Journal International
 Geophysical Journal International Geophys. J. Int. (2012) 188, 293 300 doi: 10.1111/j.1365-246X.2011.05256.x An analysis of SS precursors using spectral-element method seismograms L. Bai, Y. Zhang and
Small-scale ultralow-velocity zone structure imaged by ScP
 JOURNAL OF GEOPHYSICAL RESEARCH, VOL. 108, NO. B1, 2056, doi:10.1029/2001jb001627, 2003 Small-scale ultralow-velocity zone structure imaged by ScP Sebastian Rost and Justin Revenaugh Department of Earth
7.1 FIJI 1, :57:22 UTC
 A magnitude 7.1 earthquake struck 141 km (88 miles) northeast of Ndoi Island, Fiji, and 313 km (194 mi) west-northwest of Nuku alofa, Tonga according to the US Geological Survey, but there were no reports
Supporting Online Material for
 www.sciencemag.org/cgi/content/full/1131692/dc1 Supporting Online Material for Localized Temporal Change of the Earth s Inner Core Boundary This PDF file includes: Materials and Methods Figs. S1 to S3
PKP travel times at near antipodal distances: implications for inner core anisotropy and lowermost mantle structure
 Earth and Planetary Science Letters 199 (2002) 429^445 www.elsevier.com/locate/epsl PKP travel times at near antipodal distances: implications for inner core anisotropy and lowermost mantle structure Xinlei
Imagerie de la Terre profonde avec le bruit sismique. Michel Campillo (ISTERRE, Grenoble)
") Imagerie de la Terre profonde avec le bruit sismique Michel Campillo (ISTERRE, Grenoble) Body waves in the ambient noise: microseisms (Gutenberg, Vinnik..) The origin of the noise in the period band 5-10s:
Imagerie de la Terre profonde avec le bruit sismique Michel Campillo (ISTERRE, Grenoble) Body waves in the ambient noise: microseisms (Gutenberg, Vinnik..) The origin of the noise in the period band 5-10s:
Imaging Global Seismic Phase Arrivals by Stacking Array Processed Short-Period Data
 Imaging Global Seismic Phase Arrivals by Stacking Array Processed Short-Period Data Sebastian Rost, Michael S. Thorne, and Edward J. Garnero Sebastian Rost, 1, Michael S. Thorne,,3 and Edward J. Garnero
Peer Reviewed Publications
 Peer Reviewed Publications Moucha, R., A. M. Forte, D. B. Rowley, J. X. Mitrovica, N. A. Simmons, and S. P. Grand (2009),Deep mantle forces and the uplift of the Colorado Plateau,Geophys. Res. Lett., doi:10.1029/2009gl039778,
Determination and Analysis of Long-Wavelength Transition Zone Structure using SS Precursors
 Determination and Analysis of Long-Wavelength Transition Zone Structure using SS Precursors Christine Reif 1, Guy Masters 1, Megan Flanagan 2, Peter Shearer 1 1 Institute of Geophysics and Planetary Physics,
Data Repository Item For: Kinematics and geometry of active detachment faulting beneath the TAG hydrothermal field on the Mid-Atlantic Ridge
 GSA Data Repository Item: 2007183 Data Repository Item For: Kinematics and geometry of active detachment faulting beneath the TAG hydrothermal field on the Mid-Atlantic Ridge Brian J. demartin 1*, Robert
Geophysical Journal International
 Geophysical Journal International Geophys. J. Int. (2) 85, 385 42 doi:./j.365-246x.2.4945.x Tomographic errors from wave front healing: more than just afastbias Alison E. Malcolm and Jeannot Trampert 2
Can seismic anisotropy in Dʺ be used to constrain flow patterns in the lowermost mantle?
 Can seismic anisotropy in Dʺ be used to constrain flow patterns in the lowermost mantle? Andrew Walker 1, Andy Nowacki 1, Alessandro Forte 2, James Wookey 1 and J.-Michael Kendall 1 1 School of Earth Sciences,
(This is a sample cover image for this issue. The actual cover is not yet available at this time.)
") (This is a sample cover image for this issue. The actual cover is not yet available at this time.) This article appeared in a journal published by Elsevier. The attached copy is furnished to the author
(This is a sample cover image for this issue. The actual cover is not yet available at this time.) This article appeared in a journal published by Elsevier. The attached copy is furnished to the author
Auxiliary Material. Subduction of oceanic asthenosphere: evidence from sub-slab seismic anisotropy. Teh-Ru Alex Song, Hitoshi Kawakatsu
 Auxiliary Material Subduction of oceanic asthenosphere: evidence from sub-slab seismic anisotropy Teh-Ru Alex Song, Hitoshi Kawakatsu correspondence to: tehrusong@gmail.com 1 1. The effect of anisotropy
Evidence for P P asymmetrical scattering at near podal distances
 GEOPHYSICAL RESEARCH LETTERS, VOL. 39,, doi:10.1029/2012gl052179, 2012 Evidence for P P asymmetrical scattering at near podal distances Wenbo Wu, 1,2 Sidao Ni, 2 and Xiangfang Zeng 1 Received 3 May 2012;
Magnitude 7.6 HONDURAS
 A magnitude 7.6 earthquake has occurred in the Caribbean between Honduras and the Cayman Islands approximately 125 miles (202 km) north-northeast of Barra Patuca, Honduras, and 188 miles (303 km) southwest
Insights from ScS-S measurements on deep mantle attenuation
 Insights from ScS-S measurements on deep mantle attenuation S. Durand a,, J. Matas a, S. Ford b, Y. Ricard a, B. Romanowicz c,d,e, J-P. Montagner d a Laboratoire de Géologie de Lyon - Terre Planète Environnement,
Page 1. Name:
 Name: 6185-1 - Page 1 1) Which statement correctly compares seismic P-waves with seismic S-waves? A) P-waves travel faster than S-waves and pass through Earth's liquid zones. B) P-waves travel slower than
A shear-wave traveling through an anisotropic medium is split into two perpendicular
 GSA Supplemental Data Item 2015006 X. Tian and M. Santosh: Fossilized lithospheric deformation revealed by teleseismic shear wave splitting in eastern China Appendix: Methods and Results 1. Methods A shear-wave
Seismic anisotropy in the lowermost mantle near the Perm Anomaly
 1 2 3 4 5 6 7 8 9 10 11 12 13 14 15 16 17 18 19 20 21 22 23 Seismic anisotropy in the lowermost mantle near the Perm Anomaly Maureen D. Long* and Colton Lynner Department of Geology and Geophysics, Yale
Mantle Transition Zone Topography and Structure Beneath the Yellowstone Hotspot
 University of Wyoming Wyoming Scholars Repository Geology and Geophysics Faculty Publications Geology and Geophysics 9-17-2004 Mantle Transition Zone Topography and Structure Beneath the Yellowstone Hotspot
Gross errors in upper-mantle discontinuity topography from underside reflection data
 Geophys. J. lnt. (1997) 129, 194-204 Gross errors in upper-mantle discontinuity topography from underside reflection data Filip Neele,'." Han de Regt' and John VanDecar2 department oftheoretica1 Geophysics,
TOMOGRAPHY S VELOCITY STRUCTURE BETWEEN WASHINGTON S EARTHQUAKE C022801L AND OBSERVATIONAL STATION TUC THROUGH SEISMOGRAM ANALYSIS
 70 TOMOGRAPHY S VELOCITY STRUCTURE BETWEEN WASHINGTON S EARTHQUAKE C022801L AND OBSERVATIONAL STATION TUC THROUGH SEISMOGRAM ANALYSIS Bagus Jaya Santosa Jurusan Fisika, FMIPA, Institut Teknologi Sepuluh