Species distribution modelling with MAXENT Mikael von Numers Åbo Akademi
|
|
|
- Clarence Dennis
- 5 years ago
- Views:
Transcription
1 Species distribution modelling with MAXENT Mikael von Numers Åbo Akademi
2 Why model species distribution? Knowledge about the geographical distribution of species is crucial for conservation and spatial planning. Detailed data on species distribution is usually not available and collecting such data is costly and labor intensive. Conservationists have in many cases to rely on predictive models for estimating patterns of species distribution and for making conservation strategies. SDMs provide one of the best ways to overcome sparseness typical of distributional data, by relating them to a set of geographic or environmental predictors.


3 What do we need for SDM? Reliable data on species presences (and absences) Environmental data as GIS rasters (predictors)
4 Typical workflow:
5 Maxent A short introduction Maxent is a presence-only (po) modelling method, which means that no absence data is needed. Maxent (or other po methods) might be a good choice for instance when: There is no absence data is available (which is often the case (absences are not recorded, data from museums, herbaria etc.) There is reason to believe that the absence data is not reliable. Several other reasons, for instance: The species is not stationary (satellite tagged animals (e.g. porpoises), radiotelemetry data) The species hard to detect (e.g. reptiles) The species is temporarily absent. The species occurs in patches. You have only a single observation within a large suitable territory (for instance singing bird males)
6 How it works The Maxent method does not need species absences; instead it uses background environmental data for the entire study area. The method focuses on how the environment where the species is known to occur, relates on the environment across the rest of the study area. The idea is find the probability distribution of maximum entropy (most spread out), subject to constraints imposed by information available regarding the species presences and the environmental conditions across the study area (more in Phillips et al and Elith et al. 2011: A statistical explanation of MaxEnt for ecologists. Maxent has similarities to GAM and GLM but Maxent models a probability distribution over all pixels in the study area, and in no sense are pixels without species interpreted as absences, meaning that pseudoabsences are not used.
7 Advantages: Maxent can use both continuous and categorical environmental variables (predictors) Maxent is able to fit complex relationships between the species and the environmental variables (features in Maxent), also including interactions between the predictors. Produces test statistics, measures of variable importance and response curves. A possibility to make cross-validations. A possibility to shift regularization parameters. These determine how focused the output distribution is. A larger parameter will give a less localized prediction. Works well together with, for instance, ArcView. Is reported to be effective with a relatively small number of presences. The output raster represents a continuous measure of probability of occurrence. Maxent is a quite new method, but it has performed excellently in tests compared to other similar methods. It is quite easy to use and has an nice user friendly interface. Shareware, active discussion group, lots of published papers recently. Download from: Major conclusions drawn from Elith et al. 2006: Presence-only data are useful for modelling species distributions Presence-only data can be sufficiently accurate to be used in conservation planning New modelling methods, such as MAXENT, generally outperforms established methods
8 Drawbacks: a black box ; not easy to understand how the method works, compared to, for instance, to GLM or GAM According to the literature not as mature a statistical method as GAM or GLM. Sample selection bias is a bigger problem for presence-only methods than for presence -absence methods. If there is a bias you will get a model that combines the species distribution with the distribution of sampling effort. There are methods to deal with this problem: you can provide Maxent with a bias raster to correct for the bias in sampling effort. If absence data are available, a presence-absence method is a better choice than a po-method.

9 In this case a fitted model might be closer to a model of survey effort than of distribution.

10 The Maxent user interface

11 Zostera marina

12

13

14

15 Species data: 75 presence points of Zostera marina in the S. Archipelago Sea
16 Species X_coord Y_coord Zostera, , Zostera, , Zostera, , Zostera, , Zostera, , Zostera, , Zostera, , Zostera, , Zostera, , Zostera, , Zostera, , Zostera, , Zostera, , Zostera, , Zostera, , Zostera, , Zostera, , Zostera, , Fucus, , Fucus, , Fucus, , Fucus, , Species data format: data as a comma delimited *.csv file (use Excel). only 3 columns needed: species name(s) and co-ordinates.

17 Predictor layers describing the environmental variables the grids has to be in ascii raster format (ESRI.asc) the grids must have the same geographic bounds and cell size. the layers can be continuous or categorical. ncols 1827 nrows 2044 xllcorner llcorner cellsize 25 NODATA_value
")
18 Predictors: Depth (DEM)
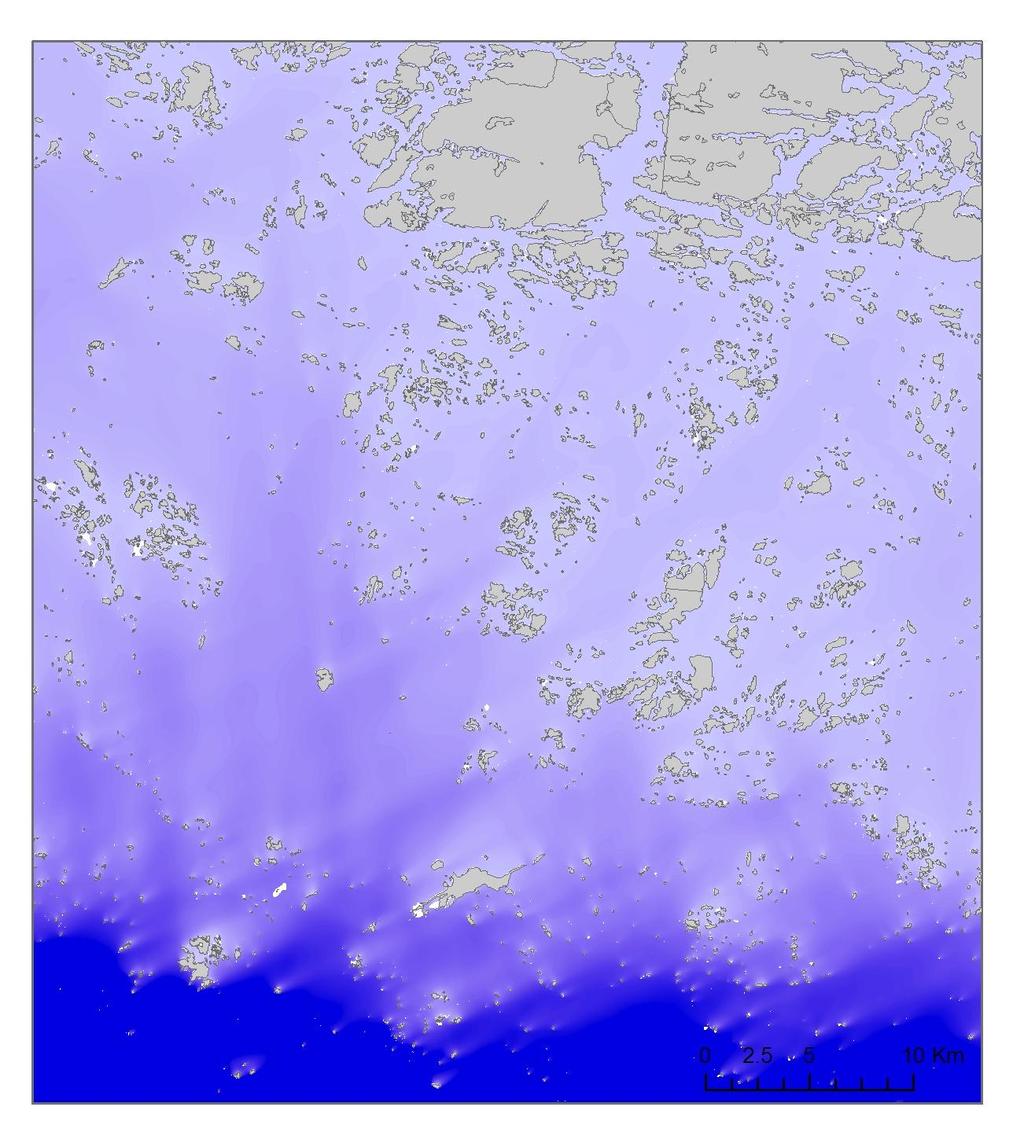
19 Predictors: exposure

20 Predictors: distance from sand. A proxy for sandy substrate (that is not available).

21 Predictors: Slope (derived from the DEM)
 raster, which is easy to exported to ArcView for further")
22 The Maxent output probability raster is an ascii (.asc) raster, which is easy to exported to ArcView for further analysis and symbolisation.

23 Substrate data = categorical data

24 Cormorant fishing areas Substrate included as a categorical variable
25 Worth to remember when modelling: 1. Garbage in garbage out. 2. Use a sufficient number of records. No algorithm can model extremely sparse species data. Guideline > 30 records. 3. Each record should bring new information to the model; clusters of observations -> one observation. 4. Samples should spread across the whole area of interest. -> Stratified sampling. 5. Beware of sampling bias especially in po-methods. 6. Pre-process the predictors carefully. Resolution, collinearity etc. 7. Check the model fit. ( AUC, cross validation, learn-test datasets). Large literature available. 8. Many sources of error. -> predictions will always be uncertain. -> Be realistic and cautious when interpreting the results.
26 Workflow: 1. The Maxent program 2. The Maxent output 3. Do a Maxent run using Zostera data and four predictor layers (individually or together) 4. Import the Maxent predictions to ArcView (together) 5. Use ArcView to mask out part of the study area (together). 6. Do a new Maxent run and compare the results.
Managing Uncertainty in Habitat Suitability Models. Jim Graham and Jake Nelson Oregon State University
 Managing Uncertainty in Habitat Suitability Models Jim Graham and Jake Nelson Oregon State University Habitat Suitability Modeling (HSM) Also known as: Ecological Niche Modeling (ENM) Species Distribution
Welcome to NR502 GIS Applications in Natural Resources. You can take this course for 1 or 2 credits. There is also an option for 3 credits.
 Welcome to NR502 GIS Applications in Natural Resources. You can take this course for 1 or 2 credits. There is also an option for 3 credits. The 1st credit consists of a series of readings, demonstration,
ArcGIS Role in Maxent Modeling
 ArcGIS Role in Maxent Modeling Christopher Woods Christopher.R.Woods @leidos.com Carpinteria, CA Modeling Remember that all models are wrong; the practical question is how wrong do they have to be to not
Digital Terrain Model GRID Width 50 m DGM50
 Digital Terrain Model GRID Width 50 m Status of documentation: 23.02.2015 Federal Agency for Cartography and Geodesy page 1 Contents DGM-D page 1 Overview of dataset 3 2 Description of the dataset contents
Digital Terrain Model Grid Width 200 m DGM200
 Digital Terrain Model Grid Width 200 m Status of documentation: 23.02.2015 Bundesamt für Kartographie und Geodäsie Seite 1 Contents DGM1000 page 1 Overview of dataset 3 2 Description of the dataset contents
Outline. - Background of coastal and marine conservation - Species distribution modeling (SDM) - Reserve selection analysis. - Results & discussion
 - Reserve selection analysis. - Results & discussion") Application of GIS for data preparation and modeling for coastal and marine conservation planning in Madagascar Rija Rajaonson Technical Assistant, REBIOMA Wildlife Conservation Society Madagascar Outline
Application of GIS for data preparation and modeling for coastal and marine conservation planning in Madagascar Rija Rajaonson Technical Assistant, REBIOMA Wildlife Conservation Society Madagascar Outline
The usage of GIS to track the movement of black bears in Minnesota due to climate change
 The usage of GIS to track the movement of black bears in Minnesota due to climate change Introduction In northeastern Minnesota, black bears migrate from 1971-1991. I chose to focus on the black bears
Introduction to Geographic Information Systems (GIS): Environmental Science Focus
: Environmental Science Focus") Introduction to Geographic Information Systems (GIS): Environmental Science Focus September 9, 2013 We will begin at 9:10 AM. Login info: Username:!cnrguest Password: gocal_bears Instructor: Domain: CAMPUS
Introduction to Geographic Information Systems (GIS): Environmental Science Focus September 9, 2013 We will begin at 9:10 AM. Login info: Username:!cnrguest Password: gocal_bears Instructor: Domain: CAMPUS
Display data in a map-like format so that geographic patterns and interrelationships are visible
 Vilmaliz Rodríguez Guzmán M.S. Student, Department of Geology University of Puerto Rico at Mayagüez Remote Sensing and Geographic Information Systems (GIS) Reference: James B. Campbell. Introduction to
Geographical Information Systems
 Geographical Information Systems Geographical Information Systems (GIS) is a relatively new technology that is now prominent in the ecological sciences. This tool allows users to map geographic features
European Commission STUDY ON INTERIM EVALUATION OF EUROPEAN MARINE OBSERVATION AND DATA NETWORK. Executive Summary
 European Commission STUDY ON INTERIM EVALUATION OF EUROPEAN MARINE OBSERVATION AND DATA NETWORK Executive Summary by NILOS Netherlands Institute for the Law of the Sea June 2011 Page ii Study on Interim
Introduction-Overview. Why use a GIS? What can a GIS do? Spatial (coordinate) data model Relational (tabular) data model
 data model Relational (tabular) data model") Introduction-Overview Why use a GIS? What can a GIS do? How does a GIS work? GIS definitions Spatial (coordinate) data model Relational (tabular) data model intro_gis.ppt 1 Why use a GIS? An extension
Introduction-Overview Why use a GIS? What can a GIS do? How does a GIS work? GIS definitions Spatial (coordinate) data model Relational (tabular) data model intro_gis.ppt 1 Why use a GIS? An extension
Maximum entropy modeling of species geographic distributions. Steven Phillips. with Miro Dudik & Rob Schapire
 Maximum entropy modeling of species geographic distributions Steven Phillips with Miro Dudik & Rob Schapire Modeling species distributions Yellow-throated Vireo occurrence points environmental variables
In this exercise we will learn how to use the analysis tools in ArcGIS with vector and raster data to further examine potential building sites.
 GIS Level 2 In the Introduction to GIS workshop we filtered data and visually examined it to determine where to potentially build a new mixed use facility. In order to get a low interest loan, the building
WORKING WITH DMTI DIGITAL ELEVATION MODELS (DEM)
") WORKING WITH DMTI DIGITAL ELEVATION MODELS (DEM) Contents (Ctrl-Click to jump to a specific page) Manipulating the DEM Step 1: Finding the DEM Tiles You Need... 2 Step 2: Importing the DEM Tiles into ArcMap...
WORKING WITH DMTI DIGITAL ELEVATION MODELS (DEM) Contents (Ctrl-Click to jump to a specific page) Manipulating the DEM Step 1: Finding the DEM Tiles You Need... 2 Step 2: Importing the DEM Tiles into ArcMap...
Course overview. Grading and Evaluation. Final project. Where and When? Welcome to REM402 Applied Spatial Analysis in Natural Resources.
 Welcome to REM402 Applied Spatial Analysis in Natural Resources Eva Strand, University of Idaho Map of the Pacific Northwest from http://www.or.blm.gov/gis/ Where and When? Lectures Monday & Wednesday
INTRODUCTION TO GIS. Dr. Ori Gudes
 INTRODUCTION TO GIS Dr. Ori Gudes Outline of the Presentation What is GIS? What s the rational for using GIS, and how GIS can be used to solve problems? Explore a GIS map and get information about map
Aldo Ferrero, Francesco Vidotto, Fernando De Palo. RUNOFF team
 TOPPS ACADEMY 15-1818 th June 2015 Grugliasco (TO) Aldo Ferrero, Francesco Vidotto, Fernando De Palo RUNOFF team DIAGNOSIS what data do we need? collection of territorial data (soils, elevation, slope,
Intro to GIS In Review
 Intro to GIS In Review GIS Analysis Winter 2016 GIS A quarter in review Geographic data types Acquiring GIS data Projections / Coordinate systems Working with attribute tables Data classification Map design
ENMTools: a toolbox for comparative studies of environmental niche models
 Ecography 33: 607611, 2010 doi: 10.1111/j.1600-0587.2009.06142.x # 2010 The Authors. Journal compilation # 2010 Ecography Subject Editor: Thiago Rangel. Accepted 4 September 2009 ENMTools: a toolbox for
MODELLING AND UNDERSTANDING MULTI-TEMPORAL LAND USE CHANGES
 MODELLING AND UNDERSTANDING MULTI-TEMPORAL LAND USE CHANGES Jianquan Cheng Department of Environmental & Geographical Sciences, Manchester Metropolitan University, John Dalton Building, Chester Street,
IDENTIFYING POTENTIAL CURRENT DISTRIBUTION FOR BENDIRE'S THRASHER (Toxostoma bendirei) Final Report
 Final Report") Professional Services Contract# 14 516 0000 00038 IDENTIFYING POTENTIAL CURRENT DISTRIBUTION FOR BENDIRE'S THRASHER (Toxostoma bendirei) Final Report Submitted by: Kurt A. Menke, GISP and Kerrie Bushway
Professional Services Contract# 14 516 0000 00038 IDENTIFYING POTENTIAL CURRENT DISTRIBUTION FOR BENDIRE'S THRASHER (Toxostoma bendirei) Final Report Submitted by: Kurt A. Menke, GISP and Kerrie Bushway
GIS CONCEPTS ARCGIS METHODS AND. 3 rd Edition, July David M. Theobald, Ph.D. Warner College of Natural Resources Colorado State University
 GIS CONCEPTS AND ARCGIS METHODS 3 rd Edition, July 2007 David M. Theobald, Ph.D. Warner College of Natural Resources Colorado State University Copyright Copyright 2007 by David M. Theobald. All rights
Overview Objectives Materials Background Activity Procedure
 Overview In this activity, students will explore how to determine how to assemble information about plant distributions, and relate those distributional to the environment by assembling information on
Popular Mechanics, 1954
 Introduction to GIS Popular Mechanics, 1954 1986 $2,599 1 MB of RAM 2017, $750, 128 GB memory, 2 GB of RAM Computing power has increased exponentially over the past 30 years, Allowing the existence of
ABSTRACT. by Alexa Marie Mainella
 ABSTRACT COMPARISON OF MAXENT AND BOOSTED REGRESSION TREE MODEL PERFORMANCE IN PREDICTING THE SPATIAL DISTRIBUTION OF THREATENED PLANT, TELEPHUS SPURGE (EUPHORBIA TELEPHIOIDES) by Alexa Marie Mainella
SPATIAL DISTRIBUTION OF THE GREATER SAGE-GROUSE IN THE POWDER RIVER BASIN IN NORTHEASTERN WYOMING. Audra Smolek
 SPATIAL DISTRIBUTION OF THE GREATER SAGE-GROUSE IN THE POWDER RIVER BASIN IN NORTHEASTERN WYOMING by Audra Smolek A Thesis Presented to the FACULTY OF THE USC GRADUATE SCHOOL UNIVERSITY OF SOUTHERN CALIFORNIA
Determining the difference in the geographic overlap of the potential distribution of the green and ocellated lizards at continental and regional
 Determining the difference in the geographic overlap of the potential distribution of the green and ocellated lizards at continental and regional extents in the Mediterranean Basin Mauricio Xavier González
Relate Attributes and Counts
 Relate Attributes and Counts This procedure is designed to summarize data that classifies observations according to two categorical factors. The data may consist of either: 1. Two Attribute variables.
envision Technical Report Archaeological Prediction Maps Kapiti Coast
 envision Technical Report Archaeological Prediction Maps Kapiti Coast Elise Smith September 2012 Contents HYPOTHESIS:... 3 Technical challenges... 3 Alternative methods of analysis considered:... 3 Approach
Introduction to Field Data Collection
 Introduction to Field Data Collection Dr. Yuji Murayama (Professor) Dr. Ko Ko Lwin (JSPS Postdoctoral Researcher) Division of Spatial Information Science Graduate School of Life and Environmental Sciences
Watershed Sciences 4930 & 6920 Advanced GIS
 Slides by Wheaton et al. (2009-2014) are licensed under a Creative Commons Attribution-NonCommercial-ShareAlike 3.0 Unported License Watershed Sciences 4930 & 6920 Advanced GIS WEEK TWO Lecture 3 Data
Class 9. Query, Measurement & Transformation; Spatial Buffers; Descriptive Summary, Design & Inference
 Class 9 Query, Measurement & Transformation; Spatial Buffers; Descriptive Summary, Design & Inference Spatial Analysis Turns raw data into useful information by adding greater informative content and value
"MODEL COMPLEXITY AND VARIABLE SELECTION IN MAXENT NICHE MODELS: ANALYSES FOR RODENTS IN MADAGASCAR"
 City University of New York (CUNY) CUNY Academic Works Master's Theses City College of New York 2015 "MODEL COMPLEXITY AND VARIABLE SELECTION IN MAXENT NICHE MODELS: ANALYSES FOR RODENTS IN MADAGASCAR"
Among various open-source GIS programs, QGIS can be the best suitable option which can be used across partners for reasons outlined below.
 Comparison of Geographic Information Systems (GIS) software As of January 2018, WHO has reached an agreement with ESRI (an international supplier of GIS software) for an unlimited use of ArcGIS Desktop
Current and Future Plans. R. Srinivasan
 Current and Future Plans R. Srinivasan Contents 1 The ArcSWAT Interface 2 VizSWAT: Output Visualization 3 User online support 4 MapWindows SWAT interface 5 ArcGIS SWAT/APEX interfaces 6 Radar Rainfall
Predicted herring (Clupea harengus) spawning grounds on the Lithuanian coast
 spawning grounds on the Lithuanian coast") Predicted herring (Clupea harengus) spawning grounds on the Lithuanian coast Johan Näslund 1, Tomas Didrikas 1,2 and Aleksej Šaškov 2 1 AquaBiota Water Research 2 Coastal Research and Planning Institute,
Predicted herring (Clupea harengus) spawning grounds on the Lithuanian coast Johan Näslund 1, Tomas Didrikas 1,2 and Aleksej Šaškov 2 1 AquaBiota Water Research 2 Coastal Research and Planning Institute,
RAPPORT LNR Wave exposure calculations for the Finnish coast
 RAPPORT LNR 5075-2005 Wave exposure calculations for the Finnish coast Wave exposure calculations for the Finnish coast Performed by NIVA at the request of Finnish Environment Institute, SYKE Preface
Using the Stock Hydrology Tools in ArcGIS
 Using the Stock Hydrology Tools in ArcGIS This lab exercise contains a homework assignment, detailed at the bottom, which is due Wednesday, October 6th. Several hydrology tools are part of the basic ArcGIS
Search for the Gulf of Carpentaria in the remap search bar:
 This tutorial is aimed at getting you started with making maps in Remap (). In this tutorial we are going to develop a simple classification of mangroves in northern Australia. Before getting started with
Conquering the Cold: Climate suitability predictions for the Asian clam in cold temperate North America
 Conquering the Cold: Climate suitability predictions for the Asian clam in cold temperate North America Morden AL, Ricciardi A Redpath Museum McGill University International Conference on Aquatic Invasive
NR402 GIS Applications in Natural Resources
 NR402 GIS Applications in Natural Resources Lesson 1 Introduction to GIS Eva Strand, University of Idaho Map of the Pacific Northwest from http://www.or.blm.gov/gis/ Welcome to NR402 GIS Applications in
Trail Flow: Analysis of Drainage Patterns Affecting a Mountain Bike Trail
 Andy Belcher BAE 590 Professor Huffman 12.9.11 Location Trail Flow: Analysis of Drainage Patterns Affecting a Mountain Bike Trail The location of the project area rests in the Cary area of Wake County,
Utilization of Global Map for Societal Benefit Areas
 Utilization of Global Map for Societal Benefit Areas The Fourth GEOSS AP Symposium Bali Indonesia, 11th March 2010 Shuhei Kojima Geographical Survey Institute Ministry of Land, Infrastructure, Transport
GIS in Water Resources Midterm Exam Fall 2008 There are 4 questions on this exam. Please do all 4.
 Page 1 of 8 Name: GIS in Water Resources Midterm Exam Fall 2008 There are 4 questions on this exam. Please do all 4. 1. Basic Concepts [20 points] Find the letter with the best answer for each term: 1.
Spatial Effects on Current and Future Climate of Ipomopsis aggregata Populations in Colorado Patterns of Precipitation and Maximum Temperature
 A. Kenney GIS Project Spring 2010 Amanda Kenney GEO 386 Spring 2010 Spatial Effects on Current and Future Climate of Ipomopsis aggregata Populations in Colorado Patterns of Precipitation and Maximum Temperature
Automatic Watershed Delineation using ArcSWAT/Arc GIS
 Automatic Watershed Delineation using ArcSWAT/Arc GIS By: - Endager G. and Yalelet.F 1. Watershed Delineation This tool allows the user to delineate sub watersheds based on an automatic procedure using
A GIS Approach to Modeling Native American Influence on Camas Distribution:
 A GIS Approach to Modeling Native American Influence on Camas Distribution: Humans as Environmental Variable Braden Elliott Oregon State University 29 March 2013 Northwest Anthropological Conference Portland,
Integrated Hydrodynamic Modeling System
 Integrated Hydrodynamic Modeling System Applied Science Associates, Inc. 70 Dean Knauss Drive Narragansett, RI USA 02882 www.asascience.com support@asascience.com 1 Introduction HYDROMAP is a globally
SDMtoolbox 2.0 User Guide
 SDMtoolbox 2.0 User Guide By Jason L. Brown, Southern Illinois University Last updated: 11/13/2017 The SDMtoolbox 2.0 consists of a series of python scripts designed to automate complicated ArcGIS analyses
Model Integration - How WEPP inputs are calculated from GIS data. ( ArcGIS,TOPAZ, Topwepp)
") Model Integration - How WEPP inputs are calculated from GIS data. ( ArcGIS,TOPAZ, Topwepp) ArcGIS 9.1-9.3 Allows user to locate area of interest, assemble grids, visualize outputs. TOPAZ Performs DEM
Model Integration - How WEPP inputs are calculated from GIS data. ( ArcGIS,TOPAZ, Topwepp) ArcGIS 9.1-9.3 Allows user to locate area of interest, assemble grids, visualize outputs. TOPAZ Performs DEM
GIS CONCEPTS ARCGIS METHODS AND. 2 nd Edition, July David M. Theobald, Ph.D. Natural Resource Ecology Laboratory Colorado State University
 GIS CONCEPTS AND ARCGIS METHODS 2 nd Edition, July 2005 David M. Theobald, Ph.D. Natural Resource Ecology Laboratory Colorado State University Copyright Copyright 2005 by David M. Theobald. All rights
Sampling Populations limited in the scope enumerate
 Sampling Populations Typically, when we collect data, we are somewhat limited in the scope of what information we can reasonably collect Ideally, we would enumerate each and every member of a population
Web Portal to European Soil Database
 Web Portal to European Soil Database A step towards harmonization of Soil Information in Europe Marc Van Liedekerke, Panos Panagos, Jean Dusart Soils Portal: http://eusoils.jrc.it Data The European Soil
Precision Ag. Technologies and Agronomic Crop Management. Spatial data layers can be... Many forms of spatial data
 Components of Precision Agriculture Precision Ag. Technologies and Agronomic Crop Management R.L. (Bob) Nielsen Purdue Univ, Agronomy Dept. West Lafayette, Indiana Equipment control Equipment monitoring
Bryan F.J. Manly and Andrew Merrill Western EcoSystems Technology Inc. Laramie and Cheyenne, Wyoming. Contents. 1. Introduction...
 Comments on Statistical Aspects of the U.S. Fish and Wildlife Service's Modeling Framework for the Proposed Revision of Critical Habitat for the Northern Spotted Owl. Bryan F.J. Manly and Andrew Merrill
Watershed Delineation
 Watershed Delineation Jessica L. Watkins, University of Georgia 2 April 2009 Updated by KC Love February 25, 2011 PURPOSE For this project, I delineated watersheds for the Coweeta synoptic sampling area
Globally Estimating the Population Characteristics of Small Geographic Areas. Tom Fitzwater
 Globally Estimating the Population Characteristics of Small Geographic Areas Tom Fitzwater U.S. Census Bureau Population Division What we know 2 Where do people live? Difficult to measure and quantify.
Modeling the Rural Urban Interface in the South Carolina Piedmont: T. Stephen Eddins Lawrence Gering Jeff Hazelton Molly Espey
 Modeling the Rural Urban Interface in the South Carolina Piedmont: T. Stephen Eddins (teddins@clemson.edu) Lawrence Gering Jeff Hazelton Molly Espey ABSTRACT Continuing growth of America s cities has created
Give 4 advantages of using ICT in the collection of data. Give. Give 4 disadvantages in the use of ICT in the collection of data
 Give 4 advantages of using ICT in the collection of data can use a handheld GPS to get accurate location information which can be used to show data linked to specific locations within a GIS can collect
CPSC 695. Future of GIS. Marina L. Gavrilova
 CPSC 695 Future of GIS Marina L. Gavrilova The future of GIS Overview What is GIS now How GIS was viewed before Current trends and developments Future directions of research What is GIS? Internet's definition
Eva Strand and Leona K. Svancara Landscape Dynamics Lab Idaho Coop. Fish and Wildlife Research Unit
 More on Habitat Models Eva Strand and Leona K. Svancara Landscape Dynamics Lab Idaho Coop. Fish and Wildlife Research Unit Area of occupancy Range - spatial limits within which a species can be found Distribution
General Overview and Facts about the Irobland
 Using Geoinformation Science to Reveal the Impact of the Eritrea-Ethiopia Boundary Commission s Decision on Irobland and People By Alema Tesfaye, Washington DC, USA Part I General Overview and Facts about
TITLE: A statistical explanation of MaxEnt for ecologists
 Elith et al. 2011. A statistical explanation of MaxEnt...Page 1 TITLE: A statistical explanation of MaxEnt for ecologists AUTHORS: Jane Elith 1, Steven Phillips 2, Trevor Hastie 3, Miroslav Dudík 4, Yung
Machine Learning Linear Classification. Prof. Matteo Matteucci
 Machine Learning Linear Classification Prof. Matteo Matteucci Recall from the first lecture 2 X R p Regression Y R Continuous Output X R p Y {Ω 0, Ω 1,, Ω K } Classification Discrete Output X R p Y (X)
Working with Digital Elevation Models in ArcGIS 8.3
 Working with Digital Elevation Models in ArcGIS 8.3 The homework that you need to turn in is found at the end of this document. This lab continues your introduction to using the Spatial Analyst Extension
Digitization of the Beatty Odonata Collection at the Frost Entomological Museum (PSUC): the Terrain of Ecological Niche Modeling
: the Terrain of Ecological Niche Modeling") Digitization of the Beatty Odonata Collection at the Frost Entomological Museum (PSUC): the Terrain of Ecological Niche Modeling Emily Sandall1, Claire Jones2, Briana Ezray3, Andy Deans1 1 Frost Entomological
Digitization of the Beatty Odonata Collection at the Frost Entomological Museum (PSUC): the Terrain of Ecological Niche Modeling Emily Sandall1, Claire Jones2, Briana Ezray3, Andy Deans1 1 Frost Entomological
Applying GIS to Hydraulic Analysis
 Texas A&M University Department of Civil Engineering CVEN689 Applications of GIS to Civil Engineering Instructor: Francisco Olivera, Ph.D., P.E. Applying GIS to Hydraulic Analysis Lim, Chae Kwan April
GIS and Coastal Nutrients Luke Cole
 GIS and Coastal Nutrients Luke Cole Human population density has been widely utilized as a valid predictor of terrestrial nitrogen loads into marine systems. As 50% of the world s population lives within
Geography 38/42:376 GIS II. Topic 1: Spatial Data Representation and an Introduction to Geodatabases. The Nature of Geographic Data
 Geography 38/42:376 GIS II Topic 1: Spatial Data Representation and an Introduction to Geodatabases Chapters 3 & 4: Chang (Chapter 4: DeMers) The Nature of Geographic Data Features or phenomena occur as
Technical Report No. 5 PREDICTED HERRING (CLUPEA HARENGUS) SPAWNING GROUNDS IN THE LITHUANIAN COASTAL WATERS
 SPAWNING GROUNDS IN THE LITHUANIAN COASTAL WATERS") Norwegian Financial Mechanism and Republic of Lithuania Coastal Research and Planning Institute, Klaipėda University Project: A system for the sustainable management of Lithuanian marine resources using
Norwegian Financial Mechanism and Republic of Lithuania Coastal Research and Planning Institute, Klaipėda University Project: A system for the sustainable management of Lithuanian marine resources using
Arctostaphylos hookeri habitat suitability model
 Arctostaphylos hookeri habitat suitability model ANTHONY N. MACHARIA G621-14 9 TH DEC 2004 The objective of this project was to evaluate the habitat characteristics defining the distribution of Arctostaphylos
National Atlas of Groundwater Dependent Ecosystems (GDE)
") National Atlas of Groundwater Dependent Ecosystems (GDE) Dr. Zaffar Sadiq Mohamed-Ghouse Executive Consultant & Practice Head-Spatial SKM, Australia zsadiq@globalskm.com Geospatial World Forum 2013, Rotterdam,
National Atlas of Groundwater Dependent Ecosystems (GDE) Dr. Zaffar Sadiq Mohamed-Ghouse Executive Consultant & Practice Head-Spatial SKM, Australia zsadiq@globalskm.com Geospatial World Forum 2013, Rotterdam,
CHAPTER 6 RESULTS FIGURE 8.- DATA WORK FLOW FOR BACKSCATTER PROCESSING IN HYPACK
 CHAPTER 6 RESULTS 6.1. Backscatter Workflow Comparison Currently, INOCAR owns and operates RESON and Kongsberg multibeam systems for nearshore surveys. The RESON system is integrated with HYPACK Hysweep
Abstract: Contents. Literature review. 2 Methodology.. 2 Applications, results and discussion.. 2 Conclusions 12. Introduction
 Abstract: Landfill is one of the primary methods for municipal solid waste disposal. In order to reduce the environmental damage and to protect the public health and welfare, choosing the site for landfill
Tips and Tricks for Using ArcGIS for Fire Pre-Incident Planning Version II By: Chris Rogers Firefighter Kirkland Fire Department Kirkland Washington
 Tips and Tricks for Using ArcGIS for Fire Pre-Incident Planning Version II By: Chris Rogers Firefighter Kirkland Fire Department Kirkland Washington Abstract: The Kirkland Fire Department has been using
METADATA. Publication Date: Fiscal Year Cooperative Purchase Program Geospatial Data Presentation Form: Map Publication Information:
 METADATA CONTOURS Digital Geospatial Metadata: North Central Texas Orthophotography Identification Information Citation Originator: Publication Date: Fiscal Year 2001-2002 Title: Cooperative Purchase Program
PHYTOPLANKTON AGGREGATE EVENTS AND HOW THEY RELATE TO SEA SURFACE SLOPE
 PHYTOPLANKTON AGGREGATE EVENTS AND HOW THEY RELATE TO SEA SURFACE SLOPE Emily E. Anderson CE 394K.3 Fall 2015 4 December 2015 Objective Using skills gained in this ArcGIS class I wanted to create a map
USING GIS CARTOGRAPHIC MODELING TO ANALYSIS SPATIAL DISTRIBUTION OF LANDSLIDE SENSITIVE AREAS IN YANGMINGSHAN NATIONAL PARK, TAIWAN
 CO-145 USING GIS CARTOGRAPHIC MODELING TO ANALYSIS SPATIAL DISTRIBUTION OF LANDSLIDE SENSITIVE AREAS IN YANGMINGSHAN NATIONAL PARK, TAIWAN DING Y.C. Chinese Culture University., TAIPEI, TAIWAN, PROVINCE
How to use the guidance tool (Producing Guidance and Verification)
") Ex.1 How to use the guidance tool (Producing Guidance and Verification) Masayuki Hirai Tokyo Climate Center (TCC)/ Climate Prediction Division of Japan Meteorological Agency (JMA) Schedule of exercise
Ex.1 How to use the guidance tool (Producing Guidance and Verification) Masayuki Hirai Tokyo Climate Center (TCC)/ Climate Prediction Division of Japan Meteorological Agency (JMA) Schedule of exercise
Determining a Useful Interpolation Method for Surficial Sediments in the Gulf of Maine Ian Cochran
 Determining a Useful Interpolation Method for Surficial Sediments in the Gulf of Maine Ian Cochran ABSTRACT This study was conducted to determine if an interpolation of surficial sediments in the Gulf
Modeling Risk of Japanese
 Modeling Risk of Japanese Encephalitis i in Korea Penny Masuoka, Terry A. Klein, Heung C. Kim, David Claborn, Nicole Achee, Richard Andre, Judith Chamberlin, Kevin Taylor, Susan George, Jennifer Small,
Bentley Map Advancing GIS for the World s Infrastructure
 Bentley Map Advancing GIS for the World s Infrastructure Presentation Overview Why would you need Bentley Map? What is Bentley Map? Where is Bentley Map Used? Why would you need Bentley Map? Because your
Transactions on Information and Communications Technologies vol 18, 1998 WIT Press, ISSN
 STREAM, spatial tools for river basins, environment and analysis of management options Menno Schepel Resource Analysis, Zuiderstraat 110, 2611 SJDelft, the Netherlands; e-mail: menno.schepel@resource.nl
In matrix algebra notation, a linear model is written as
 DM3 Calculation of health disparity Indices Using Data Mining and the SAS Bridge to ESRI Mussie Tesfamicael, University of Louisville, Louisville, KY Abstract Socioeconomic indices are strongly believed
MUDMAP TM. Software Description
 ASA Applied Science Associates, Inc. 70 Dean Knauss Drive Narragansett, RI 02882-1143 U.S.A. Tel: 401-789-6224 Fax: 401-789-1932 asa@asascience.com www.asascience.com MUDMAP TM Software Description MUDMAP
The University of Texas at Austin. Icebox Model Projections for Sea Level Fall in the Gulf Coast and Caribbean Sea Region
 The University of Texas at Austin Icebox Model Projections for Sea Level Fall in the Gulf Coast and Caribbean Sea Region Lizzadro-McPherson, Daniel J. December 3rd, 2015 Introduction Many climate scientists
![)UDQFR54XHQWLQ(DQG'tD]'HOJDGR&](/thumbs/95/125846872.jpg ")UDQFR54XHQWLQ(DQG'tD]'HOJDGR&") &21&(37,21$1',03/(0(17$7,212)$1+
&21&(37,21$1',03/(0(17$7,212)$1+ Incorporating Boosted Regression Trees into Ecological Latent Variable Models
 Incorporating Boosted Regression Trees into Ecological Latent Variable Models Rebecca A. Hutchinson, Li-Ping Liu, Thomas G. Dietterich School of EECS, Oregon State University Motivation Species Distribution
Burn-P3. Version 4.7. User's manual, 2017
 Burn-P3 Version 4.7 User's manual, 2017 Contents Burn-P3 user s manual... 4 Section 1: The Burn-P3 fire simulation model... 5 What is Burn-P3?... 5 Burn-P3 general design... 5 Purpose...5 Entities, state
Software requirements * :
 Title: Product Type: Developer: Target audience: Format: Software requirements * : Using GRACE to evaluate change in Greenland s ice sheet Part I: Download, import and map GRACE data Part II: View and
ARCGIS TRAINING AT KU GIS LABS: INTRODUCTION TO GIS: EXPLORING ARCCATALOG AND ARCGIS TOOLS
 PHASE 1_3 rd SESSION ARCGIS TRAINING AT KU GIS LABS: INTRODUCTION TO GIS: EXPLORING ARCCATALOG AND ARCGIS TOOLS 3 rd SESSION REPORT: 25 TH -27 TH JUNE 2014 SCHOOL OF ENVIRONMENTAL STUDIES COMPUTER LAB
GIS & Remote Sensing in Mapping Sea-Level Rise (SLR)
") Joe McGuire NRS-509 Concepts in GIS & Remote Sensing Professors August & Wang Due 12/10/2015 11:30am GIS & Remote Sensing in Mapping Sea-Level Rise (SLR) The ever-present threat of global warming and a
Joe McGuire NRS-509 Concepts in GIS & Remote Sensing Professors August & Wang Due 12/10/2015 11:30am GIS & Remote Sensing in Mapping Sea-Level Rise (SLR) The ever-present threat of global warming and a
THE WILDLIFE SOCIETY CONFERENCE 2015
 THE WILDLIFE SOCIETY CONFERENCE 2015 Evaluation of Desert Tortoise Habitat Suitability Model Predictions in the Soda Mountain Area, San Bernardino County Susanne Heim Introduction Overview of Species Habitat
Raster Spatial Analysis Specific Theory
 RSATheory.doc 1 Raster Spatial Analysis Specific Theory... 1 Spatial resampling... 1 Mosaic... 3 Reclassification... 4 Slicing... 4 Zonal Operations... 5 References... 5 Raster Spatial Analysis Specific
Presence-only data and the EM algorithm
 Presence-only data and the EM algorithm Gill Ward Department of Statistics, Stanford University, CA 94305, U.S.A. email: gward@stanford.edu and Trevor Hastie Department of Statistics, Stanford University,
Delineating environmental envelopes to improve mapping of species distributions, via a hurdle model with CART &/or MaxEnt
 1st International Congress on Modelling and Simulation, Gold Coast, Australia, 9 Nov to Dec 15 www.mssanz.org.au/modsim15 Delineating environmental envelopes to improve mapping of species distributions,
Data Aggregation with InfraWorks and ArcGIS for Visualization, Analysis, and Planning
 Data Aggregation with InfraWorks and ArcGIS for Visualization, Analysis, and Planning Stephen Brockwell President, Brockwell IT Consulting, Inc. Join the conversation #AU2017 KEYWORD Class Summary Silos
Visualization of Commuter Flow Using CTPP Data and GIS
 Visualization of Commuter Flow Using CTPP Data and GIS Research & Analysis Department Southern California Association of Governments 2015 ESRI User Conference l July 23, 2015 l San Diego, CA Jung Seo,
USING HYPERSPECTRAL IMAGERY
 USING HYPERSPECTRAL IMAGERY AND LIDAR DATA TO DETECT PLANT INVASIONS 2016 ESRI CANADA SCHOLARSHIP APPLICATION CURTIS CHANCE M.SC. CANDIDATE FACULTY OF FORESTRY UNIVERSITY OF BRITISH COLUMBIA CURTIS.CHANCE@ALUMNI.UBC.CA