ArcGIS Role in Maxent Modeling
|
|
|
- Berniece Higgins
- 5 years ago
- Views:
Transcription
1 ArcGIS Role in Maxent Modeling Christopher Woods Carpinteria, CA
2 Modeling Remember that all models are wrong; the practical question is how wrong do they have to be to not be useful Statistician, George E. P. Box Empirical Model-Building and Response Surfaces (1987)
3 What is Maxent Maxent stands for Maximum Entropy Type of inductive modeling that uses presence only occurrence data along with environmental variables to derive a probability of occurrence or potential suitable habitat. Software can be downloaded from
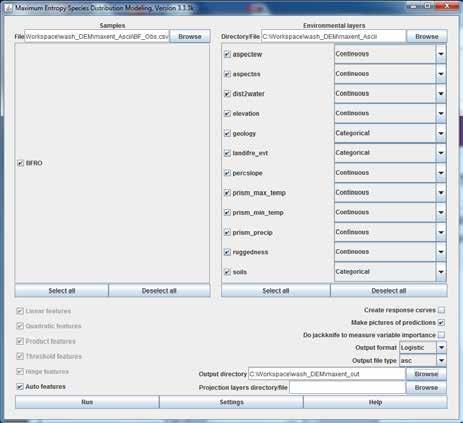
4 About Maxent Runs in a separate application Inputs: CSV file of occurrences ASCII Grid of Environmental Layers Outputs: ASCII Grid of Potential Suitable Habitat
5 Why use Maxent? Limited Range or Habitat data exists for species of interest Occurrence records available Locates Potential Suitable Habitat Subject Matter Experts needed to ground truth results to highlight areas needed for more focused study to determine presence or absence
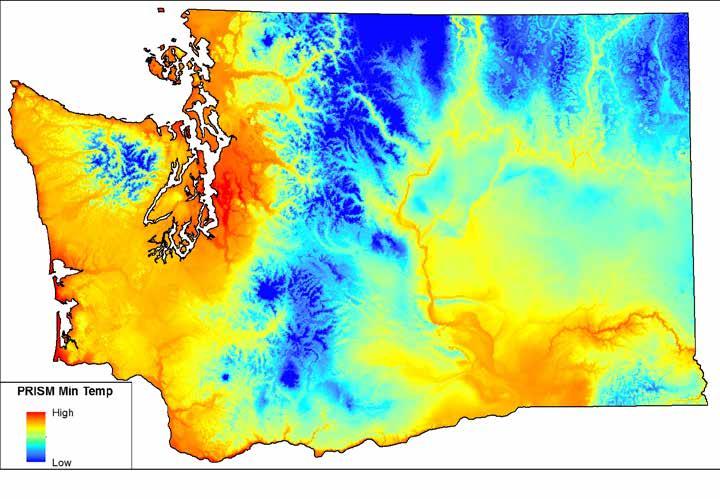
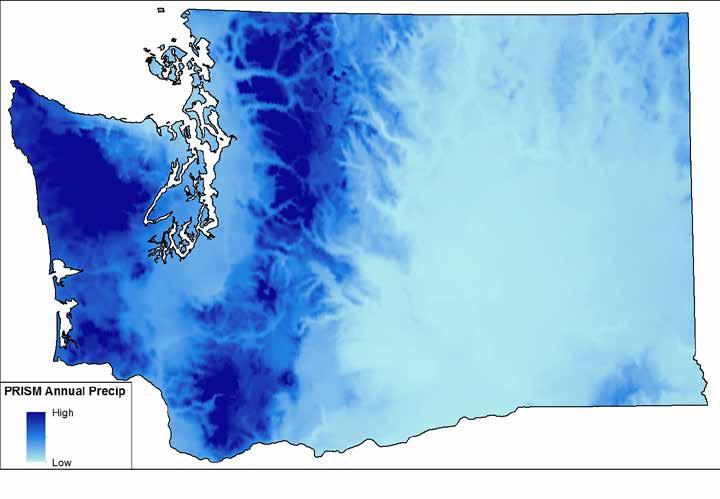
6 Environmental Layers Used in Maxent PRISM Precipitation Example of environmental raster layers used in Maxent Layers are stacked upon each other within the model PRISM Temperature Ruggedness Aspect Vegetation Distance to Water Soils
7 Occurrence Data Used in Maxent Occurrence data (point locations) are added to the model Stored in a CSV file containing X,Y positions in the same coordinate system as environmental layers Species Observation
 are added to the model")


8 Occurrence Data Used in Maxent Occurrence data (point locations) are added to the model Stored in a CSV file containing X,Y positions in same coordinate system as environmental layers Maxent uses the point occurrence data to look for relationships within the stack of environmental layers Aspect Species Observation Ruggedness Prism Temperature Prism Precipitation
9 ArcGIS Role in Maxent Modeling
10 ArcGIS Role Creating Snap Grid for Study Area Create Environmental Layers Align Layers to snap grid using the same projection, pixel size and grid extent Create CSV of Occurrence Data Populate Samples with Data (optional) Convert Environmental Data to ASCII Convert Results from ASCII to Imagine/Tiff/Grid Symbolize Results on Map
11 Using ArcGIS to Create Environmental Layers
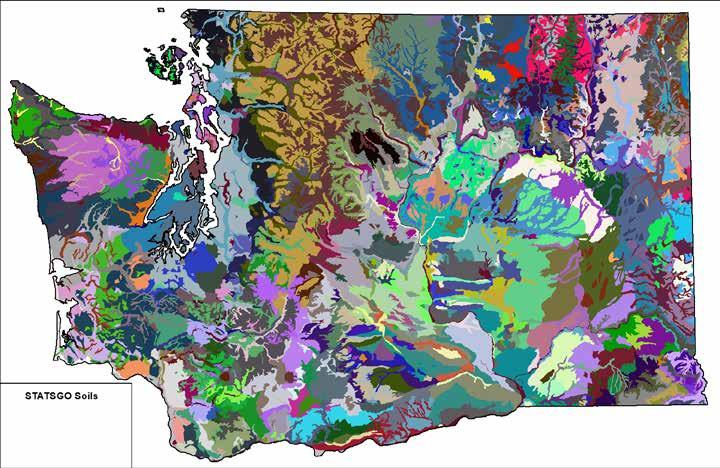
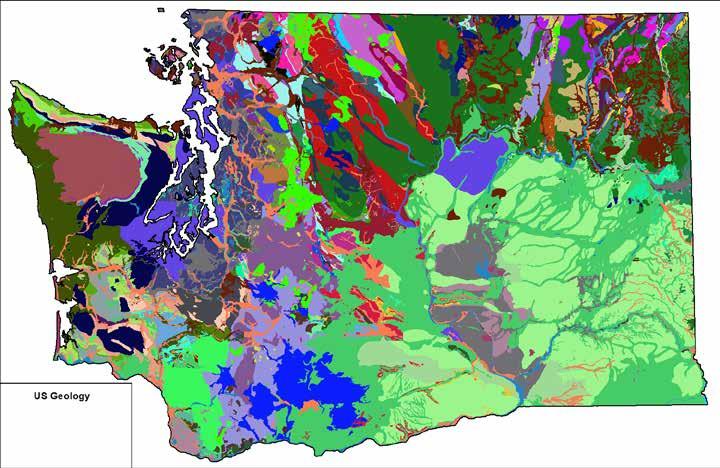
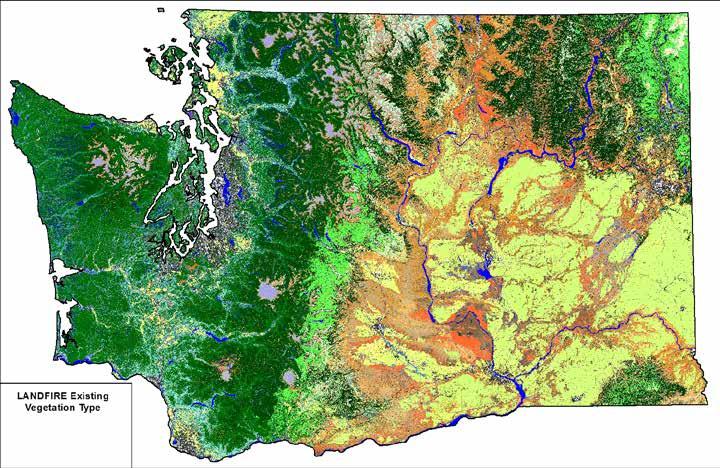
12 Using ArcGIS to Create Environmental Layers Soil, Geology, Vegetation
13 LANDFIRE Existing Vegetation, Geology, Soils LANDFIRE Existing Vegetation type, currently raster dataset (30m cell size resolution) Extract using Snap Grid US Geology, currently a vector dataset Convert to Raster and limit extent using the snap grid STATSGO soils, currently a vector SSURGO is better resolution but gaps can exist when using it for a large area (such as a state) Convert to raster and limit the extent using the snap grid
14 14
15 15
16 16
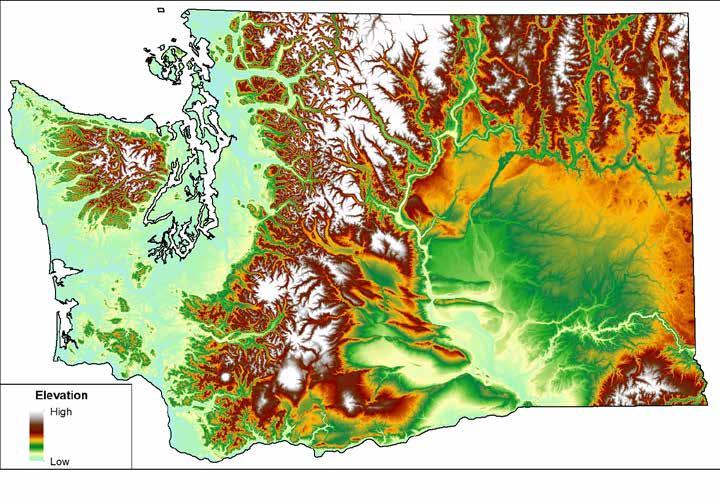
17 Using ArcGIS to Create Environmental Layers Elevation and Slope
18 Elevation and Slope Extract Elevation from the National Elevation Dataset or other gridded dataset to Snap Grid Percent Slope is calculated from the Elevation Dataset using the standard surface toolbox within the Spatial Analyst toolset. Specify Snap Grid in Environment
19 19

20 20
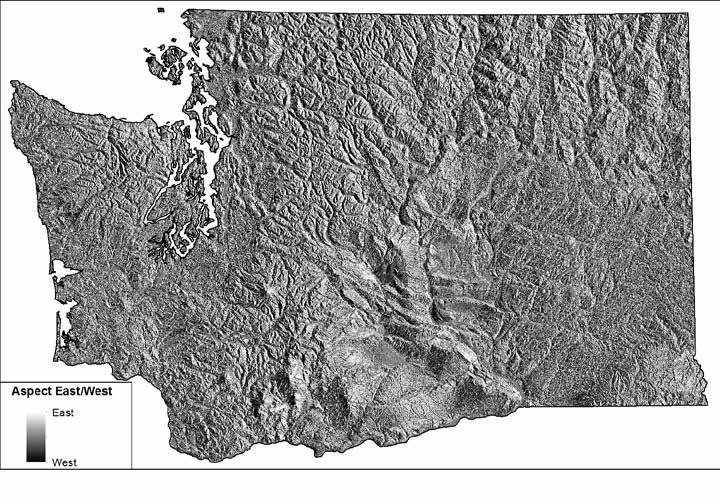
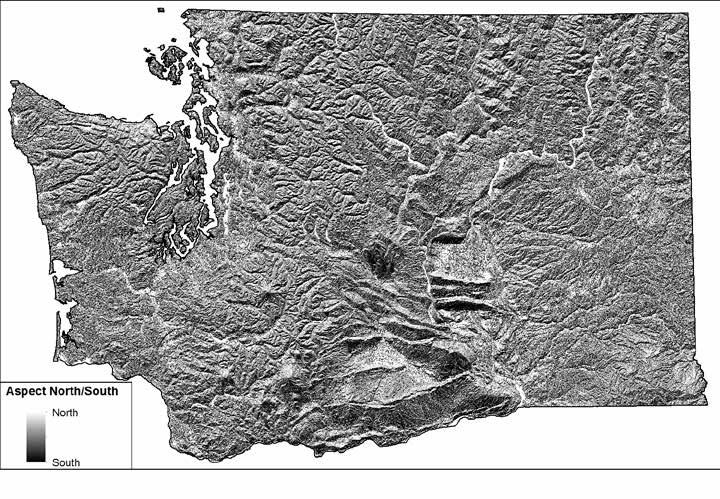
21 Using ArcGIS to Create Environmental Layers Aspect
22 Aspect Aspect is calculated from the Elevation Dataset using the standard surface toolbox within the Spatial Analyst toolset. Specify Snap Grid in Environment Settings Further steps are required to extract North/South Aspect and East/West Aspect
23 Northness and Eastness Variables vs. Aspect in Degrees 1 N E Directionality Score Northness Eastness S W Aspect (Degrees) Eastness = sin ((aspect in degrees * PI)/180) Northness = cos ((aspect in degrees * PI)/180) Zar, J. H Biostatistical Analysis. Prentice Hall, New Jersey. 663 pp.

24 Toolbox to generate the two Aspect Layers 24
25 25
26 26
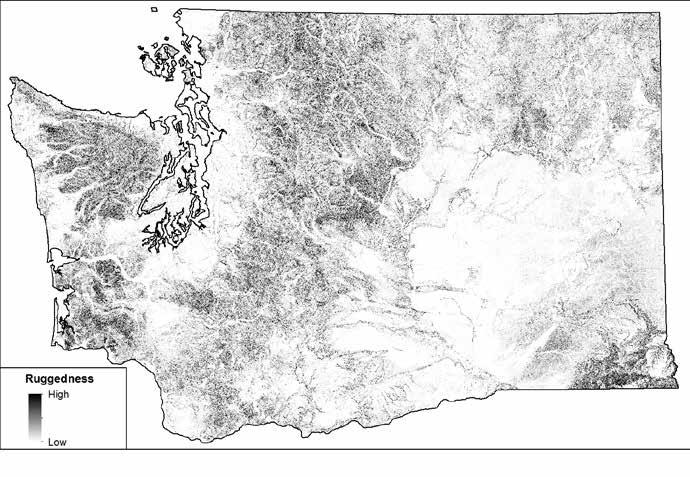
27 Using ArcGIS to Create Environmental Layers Terrain Ruggedness

28 Terrain Ruggedness Calculated from Elevation Python tool for calculating ruggedness based on paper by Sappington et al Sappington, J.M., K.M. Longshore, and D.B. Thomson Quantifiying Landscape Ruggedness for Animal Habitat Anaysis: A case Study Using Bighorn Sheep in the Mojave Desert. Journal of Wildlife Management. 71(5):

29 Terrain Ruggedness calculated from Elevation 29
30 30
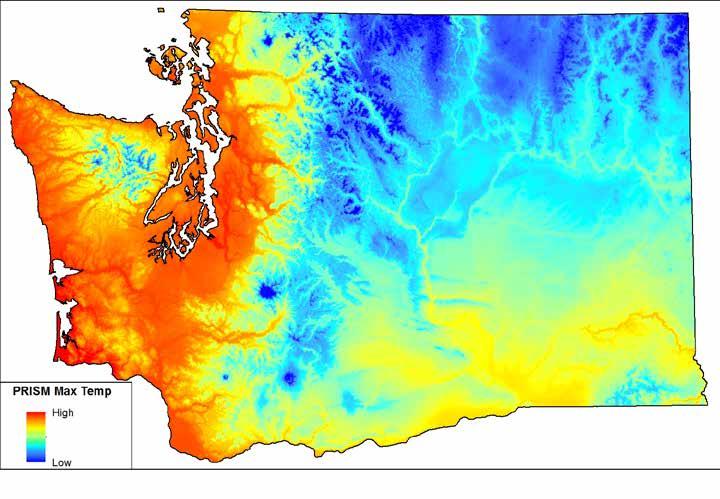
31 Using ArcGIS to Create Environmental Layers Climate
32 Climate Datasets PRISM (Oregon State University) Maximum Temperature Minimum Temperature Annual Precipitation Normals 800m cell size Monthly 4km data Can also use a specific month or bins of months for maximum and minimum temperature Other climate datasets available based on region such as Climate Impacts Group (CIG), National Centers for Environmental Prediction (NCEP), etc.
33 33
34 34
35 35
36 Using ArcGIS to Create Environmental Layers Distance to Water
37 Distance to Water Perennial Waters (Water Bodies and Streams) converted to rasters and mosaiced to create a single layer Euclidean Distance is used to measure distance from perennial water throughout the raster Data Sources: State Datasets, National Hydrographic Dataset, etc.

38 Distance to Water Model 38

39 Distance to Water
40 Using ArcGIS to Create Environmental Layers Solar Radiation
41 Solar Radiation Index The Solar Radiation Index (SRI) was calculated for the Equinox, Winter Solstice and Summer Solstice following the method described by Keating et al in their paper A Simple Solar Radiation Index for Wildlife Habitat Studies. Journal of Wildlife Management 71 (4); ; 2007 SRI = (mean sun-earth distance / daily sun-earth distance)2* {[sin(latitude)cos(slope) cos(latitude)sin(slope)cos(aspect)]sin(declination) + [cos(latitude)cos(slope) + sin(latitude)sin(slope)cos(aspect)]cos(declination)cos(hour angle) + cos(declination)sin(slope)sin(aspect)sin(hour angle)}
42 Solar Radiation Index Mean Sun-Earth Distance = 1 astronomical unit (au) Daily Sun-Earth Distance: Equinox = 1 au, Winter Solstice = au, Summer Solstice = au Hour Angle: All calculations are for the hour surrounding Solar Noon. The Hour Angle during this time = 0. Latitude: $$Ymap command used in Raster Calculator to create a raster with the latitude of each cell center as the cell value. Converted to radians. Slope: Slope raster in degrees converted to radians. Aspect: 180 Aspect raster (converts the degree data set to a degree data set), converted to radians. Declination: Equinox = 0, Winter Solstice = degrees, Summer Solstice = degrees, converted to radians.
43 Solar Radiation Index Equinox: SRI = cos(latitude)cos(slope) + sin(latitude)sin(slope)cos(aspect) Winter Solstice: SRI = (1/ )2* {[sin(latitude)cos(slope) cos(latitude)sin(slope)cos(aspect)] * ( ) + [cos(latitude)cos(slope) + sin(latitude)sin(slope)cos(aspect)] * ( ) Summer Solstice: SRI = (1/ )2* {[sin(latitude)cos(slope) cos(latitude)sin(slope)cos(aspect)] * ( ) + [cos(latitude)cos(slope) + sin(latitude)sin(slope)cos(aspect)] * ( )
44 Using ArcGIS to Create Environmental Layers Conversion to ASCII Raster
45 Conversion to Raster All Environmental Rasters need to be in ASCII raster format for use in the model. All ASCII rasters need to have the same: Extent Cell size Projection Conversion to ASCII can be done from ArcToolbox Conversion toolbox Helpful to specify the snap grid using extent, cells size, snap raster, etc in the Environment settings just to be safe
46 Using ArcGIS to Create Environmental Layers Extract Occurrence Data
47 Occurrence Data Accuracy Timeliness (old data, spatial recording method) Precision (GPS, trapping records, etc.) Relevance road kill data or observations taken from a road (don t necessarily want to have roads modeled as suitable habitat
48 Extract Occurrence Data to CSV Extract occurrence data in the same projection and extent as the raster environmental layers. Needs to be in a specific structure Name (of what is being modeled) X (Easting) Y (Northing) Additional Columns with can be added for Samples with Data
49 Samples with Data Used when the analysis cell size being used within Maxent is greater than the native data. Using 90m cell resolution when your elevation or vegetation datasets originally were in 30m resolution The original value is extracted from the native dataset and stored with the occurrence data in a column with the CSV file. This allows for more accuracy and prevents Maxent from extracting the value from a more coarse dataset when the model is run Samples with data are stored in the CSV file Column name should match the environmental raster layer name Must be in the same order that the environmental layers are stacked within the Maxent model

50 Samples with Data Tools such as Hawth s Tool s Point Intersect Tool or Geospatial Modeling Environment s isectpntrst function Allows for the processing many rasters at once.
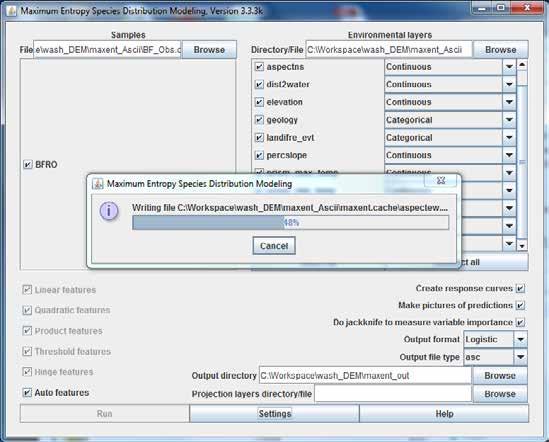
51 Using ArcGIS to Create Environmental Layers Running Maxent
52 52
53 53
54 Maxent Modeled Output The results of a Maxent model run contain values that range from 0 to 1. Values closer to 0 have less potential suitable habitat while values closer to 1 have higher potential suitability. A threshold is defined that determines what value between 0 to 1 is the cutoff for what is potentially suitable habitat and what is not.
55 55
56 56

57 57

58 58
59 Using ArcGIS to Create Environmental Layers Pitfalls
60 Suggestions for Minimizing Headaches Start first by making a snap raster and use it in the environment settings. Make sure all the rasters have the same extent, projection, alignment Error messages will occur if occurrence data doesn t overlap study area. Maxent will still run but will pop up an error message for each one. Use the ArcToolbox Conversion Tool to convert ASCII grid to Raster. Make sure to choose Float instead of the default Integer Careful of Pyramids. Maxent data can be very pixelated so pyramiding data may give a map a different view point. 60
61 Maxent Topics Not Able to Cover Due to time constraints and being a GIS conference I focused on the role of ArcGIS within running Maxent modeling. I purposely glossed over the actual running of the model, validation results, replicates, defining thresholds, etc.
62 Acknowledgments Scott Story: Montana Fish Wildlife and Parks Anthony Titolo: BLM Wildlife Habitat Spatial Analysis Lab Lara Juluisson: BLM Wildlife Habitat Spatial Analysis Lab
Data Structures & Database Queries in GIS
 Data Structures & Database Queries in GIS Objective In this lab we will show you how to use ArcGIS for analysis of digital elevation models (DEM s), in relationship to Rocky Mountain bighorn sheep (Ovis
EXERCISE 12: IMPORTING LIDAR DATA INTO ARCGIS AND USING SPATIAL ANALYST TO MODEL FOREST STRUCTURE
 EXERCISE 12: IMPORTING LIDAR DATA INTO ARCGIS AND USING SPATIAL ANALYST TO MODEL FOREST STRUCTURE Document Updated: December, 2007 Introduction This exercise is designed to provide you with possible silvicultural
Handling Raster Data for Hydrologic Applications
 Handling Raster Data for Hydrologic Applications Prepared by Venkatesh Merwade Lyles School of Civil Engineering, Purdue University vmerwade@purdue.edu January 2018 Objective The objective of this exercise
The Geodatabase Working with Spatial Analyst. Calculating Elevation and Slope Values for Forested Roads, Streams, and Stands.
 GIS LAB 7 The Geodatabase Working with Spatial Analyst. Calculating Elevation and Slope Values for Forested Roads, Streams, and Stands. This lab will ask you to work with the Spatial Analyst extension.
Outcrop suitability analysis of blueschists within the Dry Lakes region of the Condrey Mountain Window, North-central Klamaths, Northern California
 Outcrop suitability analysis of blueschists within the Dry Lakes region of the Condrey Mountain Window, North-central Klamaths, Northern California (1) Introduction: This project proposes to assess the
GIS IN ECOLOGY: ANALYZING RASTER DATA
 GIS IN ECOLOGY: ANALYZING RASTER DATA Contents Introduction... 2 Raster Tools and Functionality... 2 Data Sources... 3 Tasks... 4 Getting Started... 4 Creating Raster Data... 5 Statistics... 8 Surface
Eva Strand and Leona K. Svancara Landscape Dynamics Lab Idaho Coop. Fish and Wildlife Research Unit
 More on Habitat Models Eva Strand and Leona K. Svancara Landscape Dynamics Lab Idaho Coop. Fish and Wildlife Research Unit Area of occupancy Range - spatial limits within which a species can be found Distribution
The Invasion of False Brome in Western Oregon
 The Invasion of False Brome in Western Oregon GIS II Presentation Winter 2006 Will Fellers Kurt Hellerman Kathy Strope Statia Cupit False Brome (Brachypodium sylvaticum) Perennial bunchgrass native to
Exercie 5 Preparing GIS data for simulation with FARSITE REM407 GIS Applications in Fire Ecology and Management
 Exercie 5 Preparing GIS data for simulation with FARSITE REM407 GIS Applications in Fire Ecology and Management Assignment: Make maps of the Fuelmodel layer and the clipped Canopy cover layer and submit
Geography 38/42:376 GIS II. Topic 1: Spatial Data Representation and an Introduction to Geodatabases. The Nature of Geographic Data
 Geography 38/42:376 GIS II Topic 1: Spatial Data Representation and an Introduction to Geodatabases Chapters 3 & 4: Chang (Chapter 4: DeMers) The Nature of Geographic Data Features or phenomena occur as
Open ArcToolbox Spatial Analyst Tools Hydrology. This should display the tools shown at the right:
 Project 2: Watershed Functions Save and close your project, above, if you haven t done so already. Then, open a new project, and add the driftless DEM. We ll be using ArcToolbox for this new project, but
ISU GIS CENTER S ARCSDE USER'S GUIDE AND DATA CATALOG
 ISU GIS CENTER S ARCSDE USER'S GUIDE AND DATA CATALOG 2 TABLE OF CONTENTS 1) INTRODUCTION TO ARCSDE............. 3 2) CONNECTING TO ARCSDE.............. 5 3) ARCSDE LAYERS...................... 9 4) LAYER
Geospatial Fire Behavior Modeling App to Manage Wildfire Risk Online. Kenyatta BaRaKa Jackson US Forest Service - Consultant
 Geospatial Fire Behavior Modeling App to Manage Wildfire Risk Online Kenyatta BaRaKa Jackson US Forest Service - Consultant Fire Behavior Modeling and Forest Fuel Management Modeling Fire Behavior is an
WORKING WITH DMTI DIGITAL ELEVATION MODELS (DEM)
") WORKING WITH DMTI DIGITAL ELEVATION MODELS (DEM) Contents (Ctrl-Click to jump to a specific page) Manipulating the DEM Step 1: Finding the DEM Tiles You Need... 2 Step 2: Importing the DEM Tiles into ArcMap...
WORKING WITH DMTI DIGITAL ELEVATION MODELS (DEM) Contents (Ctrl-Click to jump to a specific page) Manipulating the DEM Step 1: Finding the DEM Tiles You Need... 2 Step 2: Importing the DEM Tiles into ArcMap...
Utility of National Spatial Data for Conservation Design Projects
 Utility of National Spatial Data for Conservation Design Projects Steve Williams Biodiversity and Spatial Information Center North Carolina State University PIF CDW St. Louis, MO April 11, 2006 Types of
Introduction to GIS I
 Introduction to GIS Introduction How to answer geographical questions such as follows: What is the population of a particular city? What are the characteristics of the soils in a particular land parcel?
Exercise 2: Working with Vector Data in ArcGIS 9.3
 Exercise 2: Working with Vector Data in ArcGIS 9.3 There are several tools in ArcGIS 9.3 used for GIS operations on vector data. In this exercise we will use: Analysis Tools in ArcToolbox Overlay Analysis
In order to follow this exercise you need to have completed exercise 1.
 In order to follow this exercise you need to have completed exercise 1. Contents of Exercise 2: Derive new datasets from inputs and carry out Multicriteria analysis in order to Part 1: Use Spatial Analysis
MERGING (MERGE / MOSAIC) GEOSPATIAL DATA
 GEOSPATIAL DATA") This help guide describes how to merge two or more feature classes (vector) or rasters into one single feature class or raster dataset. The Merge Tool The Merge Tool combines input features from input
This help guide describes how to merge two or more feature classes (vector) or rasters into one single feature class or raster dataset. The Merge Tool The Merge Tool combines input features from input
How to Create Stream Networks using DEM and TauDEM
 How to Create Stream Networks using DEM and TauDEM Take note: These procedures do not describe all steps. Knowledge of ArcGIS, DEMs, and TauDEM is required. TauDEM software ( http://hydrology.neng.usu.edu/taudem/
Week 7 Last week: This week s topics. GIS and Forest Engineering Applications. FE 257. GIS and Forest Engineering Applications.
 FE 257. GIS and Forest Engineering Applications Week 7 Week 7 Last week: Spatial Projections Questions? Next week- read: Chapter 10: Updating GIS Databases Chapter 12: Synthesis of Techniques Applied to
Spatial Analyst. By Sumita Rai
 ArcGIS Extentions Spatial Analyst By Sumita Rai Overview What does GIS do? How does GIS work data models Extension to GIS Spatial Analyst Spatial Analyst Tasks & Tools Surface Analysis Surface Creation
Tutorial 8 Raster Data Analysis
 Objectives Tutorial 8 Raster Data Analysis This tutorial is designed to introduce you to a basic set of raster-based analyses including: 1. Displaying Digital Elevation Model (DEM) 2. Slope calculations
Display and analysis of weather data from NCDC using ArcGIS
 Display and analysis of weather data from NCDC using ArcGIS Helen M. Cox Associate Professor Geography Department California State University, Northridge and Stephen Krug Graduate Student Geography Department
Geodatabase An Introduction
 Federal GIS Conference 2014 February 10 11, 2014 Washington DC Geodatabase An Introduction Ralph Denkenberger esri Session Path The Geodatabase - What is it? - Why use it? - What types are there? Inside
Exercise 2: Working with Vector Data in ArcGIS 9.3
 Exercise 2: Working with Vector Data in ArcGIS 9.3 There are several tools in ArcGIS 9.3 used for GIS operations on vector data. In this exercise we will use: Analysis Tools in ArcToolbox Overlay Analysis
Spatial Effects on Current and Future Climate of Ipomopsis aggregata Populations in Colorado Patterns of Precipitation and Maximum Temperature
 A. Kenney GIS Project Spring 2010 Amanda Kenney GEO 386 Spring 2010 Spatial Effects on Current and Future Climate of Ipomopsis aggregata Populations in Colorado Patterns of Precipitation and Maximum Temperature
Welcome to NR502 GIS Applications in Natural Resources. You can take this course for 1 or 2 credits. There is also an option for 3 credits.
 Welcome to NR502 GIS Applications in Natural Resources. You can take this course for 1 or 2 credits. There is also an option for 3 credits. The 1st credit consists of a series of readings, demonstration,
Erin Costello A comparison of Solar Radiation Modeling Tools
 Erin Costello A comparison of Solar Radiation Modeling Tools The Oregon Department of Environmental Quality uses effective shade as an indicator of water quality parameters as well as a target for restoration
Arctostaphylos hookeri habitat suitability model
 Arctostaphylos hookeri habitat suitability model ANTHONY N. MACHARIA G621-14 9 TH DEC 2004 The objective of this project was to evaluate the habitat characteristics defining the distribution of Arctostaphylos
Geodatabase An Overview
 Federal GIS Conference February 9 10, 2015 Washington, DC Geodatabase An Overview Ralph Denkenberger - esri Session Path The Geodatabase - What is it? - Why use it? - What types are there? Inside the Geodatabase
GIS IN ECOLOGY: ANALYZING RASTER DATA
 GIS IN ECOLOGY: ANALYZING RASTER DATA Contents Introduction... 2 Tools and Functionality for Raster Data... 2 Data Sources... 3 Tasks... 4 Getting Started... 4 Creating Raster Data... 5 Summary Statistics...
GEOG4017 Geographical Information Systems Lab 8 Spatial Analysis and Digital Terrain Modeling
 DEPARTMENT OF GEOGRAPHY HONG KONG BAPTIST UNIVERSITY Prof. Q. Zhou GEOG4017 Geographical Information Systems Lab 8 Spatial Analysis and Digital Terrain Modeling Objectives The exercise is designed to familiarize
BSEN 6220 GIS LAB #5
 BSEN 6220 GIS LAB #5 Dustin Till 10/29/2014 INTRODUCTION: ArcGIS is a geographic information system for working with maps and geographic information. It is used for creating and using maps, compiling geographic
IDENTIFYING POTENTIAL CURRENT DISTRIBUTION FOR BENDIRE'S THRASHER (Toxostoma bendirei) Final Report
 Final Report") Professional Services Contract# 14 516 0000 00038 IDENTIFYING POTENTIAL CURRENT DISTRIBUTION FOR BENDIRE'S THRASHER (Toxostoma bendirei) Final Report Submitted by: Kurt A. Menke, GISP and Kerrie Bushway
Professional Services Contract# 14 516 0000 00038 IDENTIFYING POTENTIAL CURRENT DISTRIBUTION FOR BENDIRE'S THRASHER (Toxostoma bendirei) Final Report Submitted by: Kurt A. Menke, GISP and Kerrie Bushway
GIS in Water Resources Midterm Exam Fall 2012 There are five questions on this exam. Please do all five.
 Page 1 of 6 Name: Key GIS in Water Resources Midterm Exam Fall 2012 There are five questions on this exam. Please do all five. Question 1 (a) You have worked with the location of Utah State University
Evaluating Corridors. Jeff Jenness Dan Majka Paul Beier. CorridorDesigner Workshop Fall 2007
 Evaluating Corridors Jeff Jenness Dan Majka Paul Beier CorridorDesigner Workshop Fall 2007 1 1 Evaluating Corridors Test Alternative Corridors Least cost methods always provide a best solution, even when
Supplementary Information B
 1 Supplementary Information B 2 3 IDW-Plus Tutorial 4 5 Erin E. Peterson 1 and Alan R. Pearse 2 6 1 Corresponding Author: Erin.Peterson@qut.edu.au; Principal Research Fellow, ARC Centre for Excellence
Delineation of Watersheds
 Delineation of Watersheds Adirondack Park, New York by Introduction Problem Watershed boundaries are increasingly being used in land and water management, separating the direction of water flow such that
IDW-Plus Tutorial. Erin E. Peterson
 IDW-Plus Tutorial Erin E. Peterson ARC Centre for Excellence in Mathematical & Statistical Frontiers and the Institute for Future Environments, Queensland University of Technology, Brisbane, QLD, Australia,
Creating PET Adjustment Coefficients
 Creating PET Adjustment Coefficients James Dyer Department of Geography Ohio University I. Computing Daily Solar Radiation In ArcToolbox: Spatial Analyst Tools Solar Radiation Area Solar Radiation. Use
Watershed Delineation
 Watershed Delineation Jessica L. Watkins, University of Georgia 2 April 2009 Updated by KC Love February 25, 2011 PURPOSE For this project, I delineated watersheds for the Coweeta synoptic sampling area
A Small Migrating Herd. Mapping Wildlife Distribution 1. Mapping Wildlife Distribution 2. Conservation & Reserve Management
 A Basic Introduction to Wildlife Mapping & Modeling ~~~~~~~~~~ Rev. Ronald J. Wasowski, C.S.C. Associate Professor of Environmental Science University of Portland Portland, Oregon 8 December 2015 Introduction
Course overview. Grading and Evaluation. Final project. Where and When? Welcome to REM402 Applied Spatial Analysis in Natural Resources.
 Welcome to REM402 Applied Spatial Analysis in Natural Resources Eva Strand, University of Idaho Map of the Pacific Northwest from http://www.or.blm.gov/gis/ Where and When? Lectures Monday & Wednesday
One of the many strengths of a GIS is that you can stack several data layers on top of each other for visualization or analysis. For example, if you
 One of the many strengths of a GIS is that you can stack several data layers on top of each other for visualization or analysis. For example, if you overlay a map of the habitat for an endangered species
Global Atmospheric Circulation Patterns Analyzing TRMM data Background Objectives: Overview of Tasks must read Turn in Step 1.
 Global Atmospheric Circulation Patterns Analyzing TRMM data Eugenio Arima arima@hws.edu Hobart and William Smith Colleges Department of Environmental Studies Background: Have you ever wondered why rainforests
The two foundation ideas or concepts that are of vital importance in GIS work (in my humble opinion) are:
 are:") HOME RANGE ESTIMATION AND HABITAT SELECTION USING G.I.S. During this workshop, you will be introduced to ArcGIS 9 software and some of the analytical tools available to go with this software. This workshop
HOME RANGE ESTIMATION AND HABITAT SELECTION USING G.I.S. During this workshop, you will be introduced to ArcGIS 9 software and some of the analytical tools available to go with this software. This workshop
Exercise 6: Working with Raster Data in ArcGIS 9.3
 Exercise 6: Working with Raster Data in ArcGIS 9.3 Why Spatial Analyst? Grid query Grid algebra Grid statistics Summary by zone Proximity mapping Reclassification Histograms Surface analysis Slope, aspect,
Introduction to GIS - 2
 Introduction to GIS - 2 Outline Using GIS Representation of spatial objects in GIS Prof. D. Nagesh Kumar Department of Civil Engineering Indian Institute of Science Bangalore 560 012, India http://www.civil.iisc.ernet.in/~nagesh
Using the Stock Hydrology Tools in ArcGIS
 Using the Stock Hydrology Tools in ArcGIS This lab exercise contains a homework assignment, detailed at the bottom, which is due Wednesday, October 6th. Several hydrology tools are part of the basic ArcGIS
LANDSLIDE HAZARD ANALYSIS AND ITS EFFECT ON ENDANGERED SPECIES HABITATS, GRAND COUNTY, UTAH
 12/5/2016 LANDSLIDE HAZARD ANALYSIS AND ITS EFFECT ON ENDANGERED SPECIES HABITATS, GRAND COUNTY, UTAH GIS Final Project Ashlyn Murphy Fall 2016 1. Introduction and Problem A well-known geologic hazard
ArcGIS Enterprise: What s New. Philip Heede Shannon Kalisky Melanie Summers Shreyas Shinde
 ArcGIS Enterprise: What s New Philip Heede Shannon Kalisky Melanie Summers Shreyas Shinde ArcGIS Enterprise is the new name for ArcGIS for Server ArcGIS Enterprise Software Components ArcGIS Server Portal
Geographical Information Systems
 Geographical Information Systems Geographical Information Systems (GIS) is a relatively new technology that is now prominent in the ecological sciences. This tool allows users to map geographic features
Use of PRISM Data. for Precipitation Estimates. in ESPAM2 AS BUILT
 Use of PRISM Data for Precipitation Estimates in ESPAM2 AS BUILT Prepared by Idaho Water Resources Research Institute In fulfillment of the Water-Budget Component Precipitation of Contract # CON00803 for
GIS INSTRUCTIONAL MANUAL
 GIS INSTRUCTIONAL MANUAL: BEAVER RESTORATION AND ASSESSMENT TOOL (BRAT) CASE STUDY: ESCALANTE RIVER WATERSHED VERSION 1.0 (RELEASE DATE: JANUARY 21, 2013) Prepared by: WILLIAM W. MACFARLANE, Research Associate
Celestial Sphere & Solar Motion Lab (Norton s Star Atlas pages 1-4)
") Name: Date: Celestial Sphere & Solar Motion Lab (Norton s Star Atlas pages 1-4) Italicized topics below will be covered only at the instructor s discretion. 1.0 Purpose: To understand a) the celestial
Name: Date: Celestial Sphere & Solar Motion Lab (Norton s Star Atlas pages 1-4) Italicized topics below will be covered only at the instructor s discretion. 1.0 Purpose: To understand a) the celestial
GIS Topographic Wetness Index (TWI) Exercise Steps
 Exercise Steps") GIS Topographic Wetness Index (TWI) Exercise Steps October 2016 Jeffrey L. Zimmerman, Jr. GIS Analyst James P. Shallenberger Manager, Monitoring & Protection Susquehanna River Basin Commission Table of
GIS Topographic Wetness Index (TWI) Exercise Steps October 2016 Jeffrey L. Zimmerman, Jr. GIS Analyst James P. Shallenberger Manager, Monitoring & Protection Susquehanna River Basin Commission Table of
The Earth is a Rotating Sphere
 The Earth is a Rotating Sphere The Shape of the Earth Earth s Rotation ( and relative movement of the Sun and Moon) The Geographic Grid Map Projections Global Time The Earth s Revolution around the Sun
GIS CONCEPTS ARCGIS METHODS AND. 3 rd Edition, July David M. Theobald, Ph.D. Warner College of Natural Resources Colorado State University
 GIS CONCEPTS AND ARCGIS METHODS 3 rd Edition, July 2007 David M. Theobald, Ph.D. Warner College of Natural Resources Colorado State University Copyright Copyright 2007 by David M. Theobald. All rights
Introduction. Project Summary In 2014 multiple local Otsego county agencies, Otsego County Soil and Water
 Introduction Project Summary In 2014 multiple local Otsego county agencies, Otsego County Soil and Water Conservation District (SWCD), the Otsego County Planning Department (OPD), and the Otsego County
Lab 1: Landuse and Hydrology, learning ArcGIS II. MANIPULATING DATA
 Lab 1: Landuse and Hydrology, learning ArcGIS II. MANIPULATING DATA As you experienced in the first lab session when you created a hillshade, high resolution data can be unwieldy if you are trying to perform
Lab 5 - Introduction to the Geodatabase
 Lab 5 - Introduction to the Geodatabase 1. Design Process GIS is becoming an increasingly accessible and important tool for land managers. In this exercise you will begin creating a Personal Geodatabase
FOREST FIRE HAZARD MODEL DEFINITION FOR LOCAL LAND USE (TUSCANY REGION)
") FOREST FIRE HAZARD MODEL DEFINITION FOR LOCAL LAND USE (TUSCANY REGION) C. Conese 3, L. Bonora 1, M. Romani 1, E. Checcacci 1 and E. Tesi 2 1 National Research Council - Institute of Biometeorology (CNR-
FOREST FIRE HAZARD MODEL DEFINITION FOR LOCAL LAND USE (TUSCANY REGION) C. Conese 3, L. Bonora 1, M. Romani 1, E. Checcacci 1 and E. Tesi 2 1 National Research Council - Institute of Biometeorology (CNR-
Lab 7: Cell, Neighborhood, and Zonal Statistics
 Lab 7: Cell, Neighborhood, and Zonal Statistics Exercise 1: Use the Cell Statistics function to detect change In this exercise, you will use the Spatial Analyst Cell Statistics function to compare the
GIS in Water Resources Midterm Exam Fall 2016 There are four questions on this exam. Please do all four. They are not all of equal weight.
 Page 1 of 7 Name: GIS in Water Resources Midterm Exam Fall 2016 There are four questions on this exam. Please do all four. They are not all of equal weight. Question 1. (20%) (a) Three key functions of
Delineation of high landslide risk areas as a result of land cover, slope, and geology in San Mateo County, California
 Delineation of high landslide risk areas as a result of land cover, slope, and geology in San Mateo County, California Introduction Problem Overview This project attempts to delineate the high-risk areas
Current and Future Plans. R. Srinivasan
 Current and Future Plans R. Srinivasan Contents 1 The ArcSWAT Interface 2 VizSWAT: Output Visualization 3 User online support 4 MapWindows SWAT interface 5 ArcGIS SWAT/APEX interfaces 6 Radar Rainfall
Regents Earth Science Unit 7: Water Cycle and Climate
 Regents Earth Science Unit 7: Water Cycle and Climate Name Section Coastal and Continental Temperature Ranges Lab # Introduction: There are large variations in average monthly temperatures among cities
Celestial Sphere. Altitude [of a celestial object] Zenith. Meridian. Celestial Equator
![Celestial Sphere. Altitude [of a celestial object] Zenith. Meridian. Celestial Equator](/thumbs/83/88077665.jpg "Celestial Sphere. Altitude [of a celestial object] Zenith. Meridian. Celestial Equator") Earth Science Regents Interactive Path of the Sun University of Nebraska Resources Copyright 2011 by Z. Miller Name Period COMPANION WEBSITES: http://www.analemma.com/ http://www.stellarium.org/ INTRODUCTION:
Earth Science Regents Interactive Path of the Sun University of Nebraska Resources Copyright 2011 by Z. Miller Name Period COMPANION WEBSITES: http://www.analemma.com/ http://www.stellarium.org/ INTRODUCTION:
NR402 GIS Applications in Natural Resources
 NR402 GIS Applications in Natural Resources Lesson 1 Introduction to GIS Eva Strand, University of Idaho Map of the Pacific Northwest from http://www.or.blm.gov/gis/ Welcome to NR402 GIS Applications in
Exercise 6: Using Burn Severity Data to Model Erosion Risk
 Exercise 6: Using Burn Severity Data to Model Erosion Risk Document Updated: November 2009 Software Versions: ERDAS Imagine 9.3 and ArcGIS 9.3, Microsoft Office 2007 Introduction A common use of burn severity
Working with Digital Elevation Models in ArcGIS 8.3
 Working with Digital Elevation Models in ArcGIS 8.3 The homework that you need to turn in is found at the end of this document. This lab continues your introduction to using the Spatial Analyst Extension
Today: GEOL 452/552 - GIS for Geoscientists I. Lecture 3 - Chapter 1. GIS vector Data (review) Let s annotate this layer (draw on paper)
 Let s annotate this layer (draw on paper)") Today: GEOL 452/552 - GIS for Geoscientists I Lecture 3 - Chapter 1 GIS vector data - review raster data history: ArcView/ArcINFO - ArcGIS types of GIS data files Lab: finish Ch. 1 tutorial and HW1 Please
Today: GEOL 452/552 - GIS for Geoscientists I Lecture 3 - Chapter 1 GIS vector data - review raster data history: ArcView/ArcINFO - ArcGIS types of GIS data files Lab: finish Ch. 1 tutorial and HW1 Please
Within this document, the term NHDPlus is used when referring to NHDPlus Version 2.1 (unless otherwise noted).
.") Exercise 7 Watershed Delineation Using ArcGIS Spatial Analyst Last Updated 4/6/2017 Within this document, the term NHDPlus is used when referring to NHDPlus Version 2.1 (unless otherwise noted). There
Exercise 7 Watershed Delineation Using ArcGIS Spatial Analyst Last Updated 4/6/2017 Within this document, the term NHDPlus is used when referring to NHDPlus Version 2.1 (unless otherwise noted). There
Introduction to Geographic Information Systems
 Introduction to Geographic Information Systems Lynn_Carlson@brown.edu 401-863-9917 The Environmental And Remote TecHnologies Lab MacMillan Hall, Room 105 http://www.brown.edu/research/earthlab/ Outline
SEASONAL AND DAILY TEMPERATURES
 1 2 3 4 5 6 7 8 9 10 11 12 SEASONAL AND DAILY TEMPERATURES Chapter 3 Earth revolves in elliptical path around sun every 365 days. Earth rotates counterclockwise or eastward every 24 hours. Earth closest
Lab#8: Working With Geodatabases. create a geodatabase with feature datasets, tables, raster datasets, and raster catalogs
 Lab#8: Geodatabase Concepts Page#1 of 25 In this lab, you will learn how to: Lab#8: Working With Geodatabases create a geodatabase with feature datasets, tables, raster datasets, and raster catalogs join
In this exercise we will learn how to use the analysis tools in ArcGIS with vector and raster data to further examine potential building sites.
 GIS Level 2 In the Introduction to GIS workshop we filtered data and visually examined it to determine where to potentially build a new mixed use facility. In order to get a low interest loan, the building
Introduction to Geographic Information Systems (GIS): Environmental Science Focus
: Environmental Science Focus") Introduction to Geographic Information Systems (GIS): Environmental Science Focus September 9, 2013 We will begin at 9:10 AM. Login info: Username:!cnrguest Password: gocal_bears Instructor: Domain: CAMPUS
Introduction to Geographic Information Systems (GIS): Environmental Science Focus September 9, 2013 We will begin at 9:10 AM. Login info: Username:!cnrguest Password: gocal_bears Instructor: Domain: CAMPUS
Physics 312 Introduction to Astrophysics Lecture 3
 Physics 312 Introduction to Astrophysics Lecture 3 James Buckley buckley@wuphys.wustl.edu Lecture 3 Celestial Coordinates the Planets and more History Reason for the Seasons Summer Solstice: Northern Hemisphere
(1) How does the annual average sun angle at solar noon (that is, the sun angle at noon averaged over a full year) depend on latitude?
 How does the annual average sun angle at solar noon (that is, the sun angle at noon averaged over a full year) depend on latitude?") (1) How does the annual average sun angle at solar noon (that is, the sun angle at noon averaged over a full year) depend on latitude? (A) * As latitude increases, average sun angle at solar noon decreases.
(1) How does the annual average sun angle at solar noon (that is, the sun angle at noon averaged over a full year) depend on latitude? (A) * As latitude increases, average sun angle at solar noon decreases.
RESEARCH METHODOLOGY
 III. RESEARCH METHODOLOGY 3.1. Time and Research Area The field work was taken place in primary forest around Toro village in Lore Lindu National Park, Indonesia. The study area located in 120 o 2 53 120
Astro 101 Lab #2. Start up the Stellarium program. If you do not remember how to use the user interface, please refer to Lab#1 or the user s guide.
 Name: Astro 101 Lab #2 Lab objectives 1) Learn about how the Sun s path, through the sky, changes with the changing seasons. 2) Learn about how the Sun s path changes while viewing it at different locations
Chapter 6. Field Trip to Sandia Mountains.
 University of New Mexico Biology 310L Principles of Ecology Lab Manual Page -40 Chapter 6. Field Trip to Sandia Mountains. Outline of activities: 1. Travel to Sandia Mountains 2. Collect forest community
Final Project: Geodatabase of Mule Mountains Area, southeastern Arizona
 R. Aisner 11/24/09 GEO 386G Final Project: Geodatabase of Mule Mountains Area, southeastern Arizona Project goal: Develop a geodatabase with vector and raster data for future data organization and analysis.
What are the five components of a GIS? A typically GIS consists of five elements: - Hardware, Software, Data, People and Procedures (Work Flows)
") LECTURE 1 - INTRODUCTION TO GIS Section I - GIS versus GPS What is a geographic information system (GIS)? GIS can be defined as a computerized application that combines an interactive map with a database
LECTURE 1 - INTRODUCTION TO GIS Section I - GIS versus GPS What is a geographic information system (GIS)? GIS can be defined as a computerized application that combines an interactive map with a database
Modeling Fish Assemblages in Stream Networks Representation of Stream Network Introduction habitat attributes Criteria for Success
 Modeling Fish Assemblages in Stream Networks Joan P. Baker and Denis White Western Ecology Division National Health & Environmental Effects Research Laboratory U.S. Environmental Protection Agency baker.joan@epa.gov
Why the Earth has seasons. Why the Earth has seasons 1/20/11
 Chapter 3 Earth revolves in elliptical path around sun every 365 days. Earth rotates counterclockwise or eastward every 24 hours. Earth closest to Sun (147 million km) in January, farthest from Sun (152
Geog 210C Spring 2011 Lab 6. Geostatistics in ArcMap
 Geog 210C Spring 2011 Lab 6. Geostatistics in ArcMap Overview In this lab you will think critically about the functionality of spatial interpolation, improve your kriging skills, and learn how to use several
THE WILDLIFE SOCIETY CONFERENCE 2015
 THE WILDLIFE SOCIETY CONFERENCE 2015 Evaluation of Desert Tortoise Habitat Suitability Model Predictions in the Soda Mountain Area, San Bernardino County Susanne Heim Introduction Overview of Species Habitat
Popular Mechanics, 1954
 Introduction to GIS Popular Mechanics, 1954 1986 $2,599 1 MB of RAM 2017, $750, 128 GB memory, 2 GB of RAM Computing power has increased exponentially over the past 30 years, Allowing the existence of
PROGRESS REPORT for COOPERATIVE BOBCAT RESEARCH PROJECT. Period Covered: 1 January 31 May Prepared by
 PROGRESS REPORT for COOPERATIVE BOBCAT RESEARCH PROJECT Period Covered: 1 January 31 May 2011 Prepared by John A. Litvaitis, Derek Broman, and Marian K. Litvaitis Department of Natural Resources University
Classification of Erosion Susceptibility
 GEO327G: GIS & GPS Applications in Earth Sciences Classification of Erosion Susceptibility Denali National Park, Alaska Zehao Xue 12 3 2015 2 TABLE OF CONTENTS 1 Abstract... 3 2 Introduction... 3 2.1 Universal
Lecture 5. GIS Data Capture & Editing. Tomislav Sapic GIS Technologist Faculty of Natural Resources Management Lakehead University
 Lecture 5 GIS Data Capture & Editing Tomislav Sapic GIS Technologist Faculty of Natural Resources Management Lakehead University GIS Data Input Surveying/GPS Data capture Facilitate data capture Final
A GIS-based Approach to Watershed Analysis in Texas Author: Allison Guettner
 Texas A&M University Zachry Department of Civil Engineering CVEN 658 Civil Engineering Applications of GIS Instructor: Dr. Francisco Olivera A GIS-based Approach to Watershed Analysis in Texas Author:
Wetland Mapping. Wetland Mapping in the United States. State Wetland Losses 53% in Lower US. Matthew J. Gray University of Tennessee
 Wetland Mapping Caribbean Matthew J. Gray University of Tennessee Wetland Mapping in the United States Shaw and Fredine (1956) National Wetlands Inventory U.S. Fish and Wildlife Service is the principle
Erosion Susceptibility in the area Around the Okanogan Fire Complex, Washington, US
 Erosion Susceptibility in the area Around the Okanogan Fire Complex, Washington, US 1. Problem Construct a raster that represents susceptibility to erosion based on lithology, slope, cover type, burned
Lab Activity: Climate Variables
 Name: Date: Period: Water and Climate The Physical Setting: Earth Science Lab Activity: Climate Variables INTRODUCTION:! The state of the atmosphere continually changes over time in response to the uneven
Applied Cartography and Introduction to GIS GEOG 2017 EL. Lecture-2 Chapters 3 and 4
 Applied Cartography and Introduction to GIS GEOG 2017 EL Lecture-2 Chapters 3 and 4 Vector Data Modeling To prepare spatial data for computer processing: Use x,y coordinates to represent spatial features
SIE 509 Principles of GIS Exercise 5 An Introduction to Spatial Analysis
 SIE 509 Principles of GIS Exercise 5 An Introduction to Spatial Analysis Due: Oct. 31, 2017 Total Points: 50 Introduction: The Governor of Maine is asking communities to look at regionalization for major