IDW-Plus Tutorial. Erin E. Peterson
|
|
|
- Regina Jones
- 6 years ago
- Views:
Transcription
1 IDW-Plus Tutorial Erin E. Peterson ARC Centre for Excellence in Mathematical & Statistical Frontiers and the Institute for Future Environments, Queensland University of Technology, Brisbane, QLD, Australia, 4001 Alan R. Pearse ARC Centre for Excellence in Mathematical & Statistical Frontiers (ACEMS) Queensland University of Technology, Brisbane, QLD, Australia,
2 Table of Contents 1 Introduction Software & Hardware Requirements The IDW-Plus Toolset Structure Data Requirements Example Dataset Description Getting Started Tutorial Directory Structure Pre-processing Steps General Pre-processing Steps Creating the Stream Raster Formatting the DEM Burning in the streams Filling the DEM Creating the Flow Direction and Flow Accumulation Grids Using the IDW-Plus tools Tool Inputs and Arguments Field name Inverse distance weighting power Snap tolerance WHERE clause The iflo Tool The HAiFLO Tool The iedo Tool The ifls Tool The HAiFLS Tool The ieds Tool Output References
3 1 Introduction This tutorial has been written to help users of the Inverse Distance Weighted Percent Land Use for Streams (IDW-Plus) tools recreate the example in Peterson and Pearse (2017). Additional resources may be helpful such as the ArcGIS version 10.5x help pages and the ESRI User Forums ( The last two references will not provide specific information about the IDW-Plus toolset, but may provide help with more general ArcGIS tasks. 2. Software & Hardware Requirements The following software is required for the toolbox: 1. An Advanced licence for ArcGIS 10.5x. 2. A licence for the Spatial Analyst extension. 3. Python (automatically installed with ArcGIS 10.5x). The tools generate intermediate data when calculating the metrics. These data are stored in memory, which considerably improves execution speed. However, this can present problems if the input datasets are large. To avoid complications with in-memory processing, it is recommended that at least 4GB of RAM are installed on your computer. 3
 2. Hydrologically Active Inverse Flow-Length to Stream (HAiFLS) 3. Inverse Euclidean-Distance to Outlet (iedo) 4.")
4 3. The IDW-Plus Toolset Structure IDW-Plus is an ArcGIS custom toolset for calculating a suite of spatially explicit land use metrics described in Peterson et al. (2011). It contains six tools: 1. Hydrologically Active Inverse Flow-Length to Outlet (HAiFLO) 2. Hydrologically Active Inverse Flow-Length to Stream (HAiFLS) 3. Inverse Euclidean-Distance to Outlet (iedo) 4. Inverse Euclidean-Distance to Stream (ieds) 5. Inverse Flow-Length to Outlet (iflo) 6. Inverse Flow-Length to Stream (ifls) 4. Data Requirements At a minimum, five datasets are required to generate spatially explicit watershed attributes: survey sites, a digital elevation model (DEM), a flow direction raster, a flow accumulation raster, and a land use raster (Table 1). A streams raster is an optional input to the tools. Details about how these data are used are provided in the following sections. 4
5 Table 1. Spatial data requirements for the IDW-Plus tools. Data Format Description Required Survey sites Vector Survey site locations Yes DEM Raster Digital elevation model Yes Flow direction Raster Flow direction from the DEM Yes Flow accumulation Raster Flow accumulation from the DEM Yes Land use Raster Land use or landscape attribute Yes Streams Raster Streams Optional 4.1 Example Dataset Description The example dataset used in this tutorial can be downloaded at The data are from the South-East Queensland Ecosystem Health Monitoring Program (EHMP; Bunn et al. 2010). It includes five EHMP survey sites, as well as raster data for streams, elevation, and agricultural pasture land use at a 25 metre spatial resolution (BRS, 2002; Moreton Bay Waterways and Catchments Partnership, 2005; QNRW, 2000) (Figure 1). The intention is for users to work through the tutorial with the example data so they understand the tools and can successfully generate spatially explicit watershed attributes. 5
 survey sites, which are labelled using the corresponding SiteID.")
6 Figure 1. Map of the study area (a), which is located in Southeast Queensland, Australia. Black circles represent the 5 Ecosystem Health and Monitoring Program (EHMP) survey sites, which are labelled using the corresponding SiteID. Sites 1, 4, and 5 are located in the Lower Brisbane subcatchment, while Sites 2 and 3 are located in the Logan catchment. Watersheds for each EHMP site are displayed in varying shades of grey. Lighter shades of grey represent larger watersheds within which the darker watersheds are nested. The streams running through the watersheds are shown in blue. The example folder contains the input data for the IDW-Plus tools. The example_final folder contains the data provided in the example folder, as well as the data derived in this tutorial (Table 2). 6
7 Table 2: Datasets provided in the example and example_final folders. NAME FORMAT DESCRIPTION sites Point A shapefile of survey site locations Shapefile filldem Raster Filled digital elevation model fdgrid Raster Flow direction raster fagrid Raster Flow accumulation raster stream Raster Streams, where NoData = stream and 1 = other lugrid Raster Pasture land use, where 1 = pasture and 0 = other stream_lines Polyline Streams in the study area Shapefile stream_rast Raster A raster representation of streams in the study area, where values streams and NoData = other raw_dem Raster Digital elevation model, unfilled 5. Getting Started This toolbox can be downloaded at Save the toolbox and make sure that there are no spaces in the pathname where the toolbox resides. To add the IDW-Plus toolset, 1. Open ArcMap. 7

8 2. Add the IDW-Plus toolset. In ArcToolbox, right click on ArcToolbox, and select Add Toolbox. Navigate to the IDW-Plus toolset and click OK. Then, right click on ArcToolbox, scroll down, select Save Settings, and click on To Default. 3. Set the Geoprocessing Environment. This ensures that new rasters have the appropriate cell size and extent. It also provides a way to snap, or align, new rasters with existing rasters. On the main menu, click on Geoprocessing, scroll down, and click Environments... This will open the Environment Settings window. 1. Under Processing Extent, set Extent to Same as layer example/raw_dem.tif. 2. Under Raster Analysis, set the cell size to Same as layer example/raw_dem.tif. This will automatically set the cell size. No Mask is used. 3. Click OK. *Note: You may need to enable the Spatial Analyst Extension if it is not available. On the main menu, go to Customize>Extensions. This will open the Extensions window. Make sure that the box next to the Spatial Analyst is checked. 8
9 5.1 Tutorial Directory Structure In this tutorial, we assume that the toolbox files have been saved in a new directory named C:\IDW-Plus. All of the new data created in the tutorial will be saved in a directory called C:/IDW-Plus/example/work create this directory on your computer. It is not a requirement to use this directory structure to complete the tutorial, but it may be less confusing if users employ the same file structure while working through the tutorial. 6. Pre-processing Steps In this section, we provide detailed instructions about how to process the data before running the IDW-Plus tools. For example, we assume that the input data have certain characteristics: 1. The stream grid has NoData values for stream cells and is 0 in every other cell; 2. The cells in the land use grid are 1 where a land use type is present and 0 otherwise; 3. The DEM has had the streams burned in; 4. The DEM has no sinks; and 5. The flow direction and flow accumulation grids are derived from this corrected DEM. Note that (3) is not required if the streams have been derived from the same DEM used to run the tools. It is only necessary when the two layers are from different data sources. We have included these instructions for users who are not overly familiar with ArcGIS, so that they understand how to pre-process their own datasets. However, the pre-processed input datasets have been provided in the example/preprocessed directory so that users who are familiar with ArcGIS may skip to Section General Pre-processing Steps 1. Load the datasets in the example folder into ArcMap 1. Click on the Add data tool and navigate to the example directory (Table 2). 2. Select the input datasets in the example directory and click Add. This includes: lugrid.tif raw_dem.tif 9

10 sites.shp stream_lines.shp stream_rast.tif 2. Project all of the input data to a common projection and datum *Note: the example dataset has already been projected to a common projection. See the Data Management Tools> Projections and Transformations and the ArcGIS help if you need more information. 6.2 Creating the Stream Raster A stream raster with NoData for streams cells and 1 everywhere else is needed to calculate the ifls, HAiFLS and ieds metrics. This can be created from either a polylines feature class or an existing streams raster. To create a stream raster with NoData values from a polyline feature class: 1. Go to ArcToolbox > Conversion Tools > To Raster and open the Polyline to Raster tool. 2. Fill in the arguments as shown below and click OK. 10
,1) Name the Output raster stream1.")
11 Once the tool has completed running, 3. Make sure the newly calculated stream_lines.tif is loaded in the ArcMap Table Of Contents. 4. Open the ArcToolbox> Spatial Analyst Tools> Map Algebra> Raster Calculator tool. 5. Enter the command Con(IsNull( stream_lines.tif ),1) Name the Output raster stream1.tif and save it to the work directory. 6. Click OK and allow the tool to run. The new streams raster, stream1.tif, should appear in the ArcMap Table Of Contents. Examine the data - stream cells should have been assigned NoData values, with 1s for all other cells. 11
12 Note, sometimes an error message will appear if you attempt to paste the command into the Raster Calculator. If you get this error message, make sure to double click on the stream_lines.tif layer to enter it into the expression. To create a stream raster with NoData values from an existing stream raster that has values assigned to stream cells and NoData in all other cells, 1. Open the ArcToolbox> Spatial Analyst Tools> Map Algebra> Raster Calculator tool. 2. Enter the command below, Con(IsNull( stream_rast.tif ),1) name the Output Raster stream2.tif, and click OK to run the tool 3. The raster stream2.tif should appear in the ArcMap Table Of Contents. Examine the data - it should have NoData for streams cells and 1s everywhere else. 12

13 Note: If your streams raster does not contain NoData in non-stream cells, please see the ArcGIS help page for Conditional evaluation with Con: Once you have finished with these steps, remove the following layers from the ArcMap session: stream1.tif stream2.tif stream_lines.tif stream_lines.shp stream_rast.tif This can be done by left-clicking on the data layer, right-clicking, and then selecting Remove. 13
14 6.3 Formatting the DEM Burning in the streams The streams must be burned into the DEM if the streams dataset was derived from a vector of streams or another DEM. If it was derived from the same DEM that will be used to create the spatially explicit watershed attributes, then skip this step. The first step is to create a raster layer of streams that will be subtracted, or burned into the DEM. There is no set rule about how deep to burn the streams in, but typical values range between 5 and 10 meters. In this example, we will burn the streams in 10 meters. 1. Load the preprocessed streams dataset from example/preprocessed/stream.tif. 2. Open ArcToolbox> Spatial Analyst Tools> Map Algebra> Raster Calculator 3. Input the command Con(IsNull( stream.tif ), 10, 0) and name the Output raster burn_10.tif 4. Press OK and wait for the tool to run. 14

15 When the tool finishes running, a raster layer of streams called burn_10.tif is produced, where stream cells have a value of 10 and all other cells have a value of 0. Make sure burn_10.tif is loaded in ArcMap. The next step is to burn these streams into the DEM. 5. Open the Raster Calculator again and input the command raw_dem.tif burn_10.tif and name the output burndem.tif. 6. Press OK. The new raster layer is a DEM, with streams burned in 10 meters. Remove raw_dem.tif and burn_10.tif from the Table of Contents Filling the DEM DEMs may contain sinks, which are cells whose eight neighbours all flow into it. This is problematic for deriving flow direction and accumulation values, which in turn affects some of the distance-weighted watershed attributes. It is therefore necessary to identify and remove sinks in the DEM. 1. Ensure the burndem.tif DEM is loaded in the Table of Contents. 2. Open the ArcToolbox> Spatial Analyst Tools> Hydrology> Fill tool. 15

16 3. Enter the arguments as shown below and click OK to run the tool. For some DEMs a z-limit may need to be specified. More information is available in the ArcGIS documentation for the Fill tool: Remove burndem.tif from the Table Of Contents Creating the Flow Direction and Flow Accumulation Grids The next step is to derive the flow direction and flow accumulation grids from the filled DEM. 1. In ArcMap, load the filldem.tif if it is not already in the Table of Contents. 2. Open the ArcToolbox> Spatial Analyst Tools> Hydrology> Flow Direction tool and provide the tool arguments as shown below. 3. Click OK to run the tool. 16


17 4. Ensure the fdgrid.tif is loaded in the ArcMap Table Of Contents. 5. Examine the values in fdgrid.tif, which may include 1, 2, 4, 8, 16, 32, 64, or 128. If any other values are present, then return to Step because an error has occurred. Please see the ArcGIS help for the Flow Direction tool for additional information: 6. Open the ArcToolbox> Spatial Analyst Tools> Hydrology> Flow Accumulation tool and provide the tool arguments as shown below. 7. Click OK to run the tool. 17
18 8. Ensure fagrid.tif is loaded into the ArcMap TABLE OF CONTENTS. At this point, all of the pre-processing steps are complete and users have the data they need to run the IDW-Plus tools. Remove the following datasets from the Table Of Contents: fagrid.tif fdgrid.tif filldem.tif 7. Using the IDW-Plus tools Each metric produces distinct weighting schemes that capture the proximity and runoff potential of the landscape in different ways (Figure 2). Greater weight is attributed to land use cells in close proximity to the watershed outlet by the iedo and iflo metrics. The percent land use values produced by these two metrics may be strongly correlated (Peterson et. al 2011). However, the iflo metric may still be altered based on the topography of the watershed, which is not the case for the iedo metric. In the ieds and ifls metrics, land use cells in close proximity to the stream have a stronger influence on the percent land use metric. Thus, a larger number of cells in the watershed will strongly influence the land-use metric compared to metrics based on distance to the outlet. For example, the stream usually extends up into the watershed, while the survey site (i.e. outlet) is represented by a single cell. The relative influence of land use cells in the hydrologically active metrics (HAiFLO and HAiFLS) is more complicated than the pure distance-weighted metrics. Land use in close proximity to the stream or outlet, that also has a higher chance of runoff potential (e.g. intermittent streams and gullies) contribute more to the LU% estimate. However, this also means that the HAIDW metrics are less dependent on the spatial resolution of the streams dataset than the iflo and ifls metrics (Peterson et. al 2011). 18
, inverse Euclidean-distance to the stream (ieds),")
19 Figure 2. A schematic showing the relative weight assigned to each cell within a watershed, by metric for: inverse Euclidean-distance to the outlet (iedo), inverse Euclidean-distance to the stream (ieds), inverse flow-length to the outlet (iflo), inverse flow-length to the stream (ifls), hydrologically active inverse-flow-length to the outlet (HAiFLO), and hydrologically active inverse-flow-length to the stream (HAiFLS). The black circle represents the watershed outlet. For plotting purposes, the HAiFLO and HAiFLS metrics were standardised to the same range as the other metrics (0 to 1) and the quantiles of the weights were used to standardise the display between metrics. The IDW-Plus tools are set to run in the foreground, meaning that no other actions can be performed in the ArcMap session while the script is executing. Note that, the tools may take several minutes to run if the DEM, flow direction and flow accumulation rasters (see Table 4) are large. To continue using ArcMap while running the tools, another instance of ArcMap must be opened in a separate window. 7.1 Tool Inputs and Arguments The main data inputs to the IDW-Plus tools were described in 19
20 20

21 Table 1 and the pre-processing steps used to generate them were described in Section 6. However, there are four optional parameters that may be defined in each tool: 1. Field name, 2. Inverse distance weighting power, 3. Snap tolerance, and the 4. WHERE clause. Details about each of the four optional arguments are provided below Field name The user can specify the new field name that will be created in the sites feature class using the Field name argument. There are restrictions on the types and number of letters in field names. Specifically, 21
22 A field in a shapefile attribute table cannot be longer than 10 letters. A field in a feature class attribute table cannot be longer than 64 letters. For restrictions on characters in field names, see: The tool will report an error and immediately stop execution if the applicable character limit is exceeded. To prevent overwrite errors, the tool will also stop execution if the user provides a field name that matches a pre-existing field name in the sites attribute table. Note that field name is an optional argument. If no field name is provided, a default field name is assigned based on the tool name and the land use raster name, up to a maximum of 10 letters. However, for the sake of interpretability, we recommend that users set their own field names, keeping in mind the restrictions above Inverse distance weighting power The contribution of each i th land use cell in the catchment to the final metric score is weighted: w i = (d i + 1) p, where w i is the weighting for the i th cell; d i is the distance (either Euclidean or flow length distance) of the i th cell to the stream or the outlet; and p is the inverse-distance-weighting power (with p 0). The default for the tools is p = 1 since this is true inverse distance, but the user can change p according to their needs. Small changes in p can dramatically affect the weighting scheme and the metric value. Users should consider the spatial resolution of their raster layers when making this decision, as well as the scale at which environmental processes that link the terrestrial landscape to the stream operate Snap tolerance The snap tolerance is passed to the Snap Pour Point tool in the Hydrology toolset (see ESRI 2015). It is used to improve the delineation of watersheds around pour points (i.e. sites), which may not be properly aligned with the stream cells. The argument is a single number expressed in map units. In this tutorial, a snap tolerance of 25m has been used because the raster data has a 25m spatial resolution and the site features were already aligned with the 22
23 stream lines. When the IDW-Plus tools are run, the sites are converted to raster format in the background. However, the newly created source cells may not fall directly on the raster-based stream line if a snap tolerance is not set. Decisions about the snap tolerance value should be based on the user s knowledge about alignment of the sites to the streams, with larger snap tolerance values used when sites have not previously been snapped to stream lines WHERE clause The WHERE clause is used in exactly the same way as the WHERE clause in the Select by Attributes function inside a shapefile or feature class attribute table. It is an SQL query that allows users to select and operate on subsets of the data, rather than the full dataset. The general format of the WHERE clause in SQL queries is: COLUMN_NAME LOGICAL_CRITERION For example, to calculate a metric for the first two sites only, the WHERE clause would be: SiteID < 3 The column names are unique to the data, but examples of logical criteria can be found at To run the tools on the full dataset, simply leave the WHERE clause blank. 7.2 The iflo Tool To use the iflo tool, 1. Open the ArcToolbox> IDW-Plus> Inverse Flow Length to Outlet tool. 2. Input the tool arguments as shown below and click OK to run the tool. Note that, we will be using the input data provided in the example and example/preprocessed directories in this, and subsequent tool demonstrations. 23
24 24
25 7.3 The HAiFLO Tool To use the HAiFLO tool, 1. Open ArcToolbox> IDW-Plus> Hydrologically Active Inverse Flow Length to the Outlet tool. 2. Input the tool arguments as shown below and click OK to run the tool. 25
26 7.4 The iedo Tool To use the iedo tool, 1. Open ArcToolbox > IDW-Plus > Inverse Euclidean Distance to Outlet. 2. Input the tool arguments as shown below and click OK to run the tool. 26
27 7.5 The ifls Tool To use the ifls tool, 1. Open ArcToolbox > IDW-Plus > Inverse Flow Length to Stream. 2. Input the tool arguments as shown below and click OK to run the tool. 27
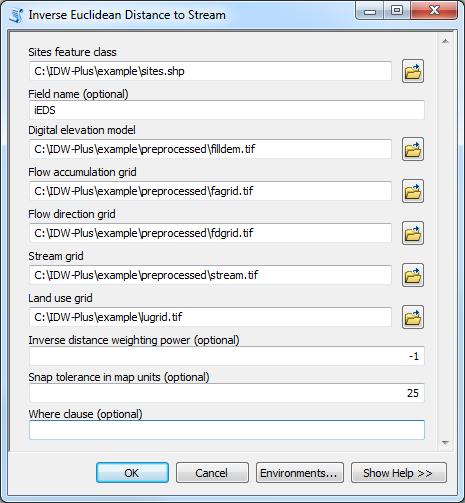
28 7.6 The HAiFLS Tool To use the HAiFLS tool, 1. Open ArcToolbox > IDW-Plus > Hydrologically Active Inverse Flow Length to Stream. 2. Input the tool arguments as shown below and click OK to run the tool. 7.7 The ieds Tool To use the Inverse Euclidean Distance to Stream tool, 1. Open ArcToolbox > IDW-Plus > Inverse Euclidean Distance to Stream. 2. Input the tool arguments as shown below and click OK to run the tool. 28
29 29
, inverse Euclidean-distance")
30 8. Output The spatially explicit landscape representation metrics generated by the IDW-Plus tools are stored in the sites attribute table (Figure 3). Figure 3. The sites attribute table, where the 6 spatially explicit landscape representation metrics have been added, including the inverse Euclidean-distance to the outlet (iedo), inverse Euclidean-distance to the stream (ieds), inverse flow-length to the outlet (iflo), inverse flow-length to the stream (ifls), hydrologically active inverse-flow-length to the outlet (HAiFLO), and hydrologically active inverse-flow-length to the stream (HAiFLS). 30
31 9. References Bunn, S.E., E.G. Abal, M.J. Smith, S.C. Choy, C.S. Fellows, B.D.Harch, M.J. Kennard & F. Sheldon, Investigation of science and monitoring of river ecosystem health to guide in catchment protection and rehabilitation. Freshwater Biology 55: DOI: /j x Bureau of Rural Sciences, Department of Agriculture, Fisheries, and Forestry (BRS), Land use mapping at catchment scale: principles, procedures and definitions, second edition. Bureau of Rural Sciences, Department of Agriculture, Fisheries, and Forestry, Kingston, ACT, Australia. Peterson, E.E. and A.R. Pearse (2017). IDW-Plus: An ArcGIS Toolset for Calculating Spatially Explicit Watershed Attributes for Survey Sites. Journal of the American Water Resources Association. DOI: / Peterson, E.E., F. Sheldon, R. Darnell, S.E. Bunn and B.D. Harch, A comparison of spatially explicit landscape representation methods and their relationship to stream condition. Freshwater Biology 56(3): DOI: /j x Queensland Natural Resources and Water (QNRW), Southeast Queensland 25 meter Digital Elevation Model. Queensland Natural Resources and Water, Indooroopilly, QLD, Australia. 31
Supplementary Information B
 1 Supplementary Information B 2 3 IDW-Plus Tutorial 4 5 Erin E. Peterson 1 and Alan R. Pearse 2 6 1 Corresponding Author: Erin.Peterson@qut.edu.au; Principal Research Fellow, ARC Centre for Excellence
Automatic Watershed Delineation using ArcSWAT/Arc GIS
 Automatic Watershed Delineation using ArcSWAT/Arc GIS By: - Endager G. and Yalelet.F 1. Watershed Delineation This tool allows the user to delineate sub watersheds based on an automatic procedure using
GIS IN ECOLOGY: ANALYZING RASTER DATA
 GIS IN ECOLOGY: ANALYZING RASTER DATA Contents Introduction... 2 Raster Tools and Functionality... 2 Data Sources... 3 Tasks... 4 Getting Started... 4 Creating Raster Data... 5 Statistics... 8 Surface
Creating Watersheds from a DEM
 Creating Watersheds from a DEM These instructions enable you to create watersheds of specified area using a good quality Digital Elevation Model (DEM) in ArcGIS 8.1. The modeling is performed in ArcMap
How to Create Stream Networks using DEM and TauDEM
 How to Create Stream Networks using DEM and TauDEM Take note: These procedures do not describe all steps. Knowledge of ArcGIS, DEMs, and TauDEM is required. TauDEM software ( http://hydrology.neng.usu.edu/taudem/
Using ArcGIS for Hydrology and Watershed Analysis:
 Using ArcGIS 10.2.2 for Hydrology and Watershed Analysis: A guide for running hydrologic analysis using elevation and a suite of ArcGIS tools Anna Nakae Feb. 10, 2015 Introduction Hydrology and watershed
STARS: SPATIAL TOOLS FOR THE ANALYSIS OF RIVER SYSTEMS - A TUTORIAL
 STARS: SPATIAL TOOLS FOR THE ANALYSIS OF RIVER SYSTEMS - A TUTORIAL Dr. Erin E. Peterson EP111313 28 March 2011 Enquiries should be addressed to: Erin E. Peterson 41 Boggo Rd., Dutton Park, QLD, 4102 Erin.Peterson@csiro.au
Delineation of Watersheds
 Delineation of Watersheds Adirondack Park, New York by Introduction Problem Watershed boundaries are increasingly being used in land and water management, separating the direction of water flow such that
WORKING WITH DMTI DIGITAL ELEVATION MODELS (DEM)
") WORKING WITH DMTI DIGITAL ELEVATION MODELS (DEM) Contents (Ctrl-Click to jump to a specific page) Manipulating the DEM Step 1: Finding the DEM Tiles You Need... 2 Step 2: Importing the DEM Tiles into ArcMap...
WORKING WITH DMTI DIGITAL ELEVATION MODELS (DEM) Contents (Ctrl-Click to jump to a specific page) Manipulating the DEM Step 1: Finding the DEM Tiles You Need... 2 Step 2: Importing the DEM Tiles into ArcMap...
The Geodatabase Working with Spatial Analyst. Calculating Elevation and Slope Values for Forested Roads, Streams, and Stands.
 GIS LAB 7 The Geodatabase Working with Spatial Analyst. Calculating Elevation and Slope Values for Forested Roads, Streams, and Stands. This lab will ask you to work with the Spatial Analyst extension.
MERGING (MERGE / MOSAIC) GEOSPATIAL DATA
 GEOSPATIAL DATA") This help guide describes how to merge two or more feature classes (vector) or rasters into one single feature class or raster dataset. The Merge Tool The Merge Tool combines input features from input
This help guide describes how to merge two or more feature classes (vector) or rasters into one single feature class or raster dataset. The Merge Tool The Merge Tool combines input features from input
Creating Watersheds from a DEM in ArcGIS 9.x
 Creating Watersheds from a DEM in ArcGIS 9.x These instructions enable you to create watersheds (a.k.a. catchments or basins) using a good quality Digital Elevation Model (DEM) in ArcGIS 9.1. The modeling
Using the Stock Hydrology Tools in ArcGIS
 Using the Stock Hydrology Tools in ArcGIS This lab exercise contains a homework assignment, detailed at the bottom, which is due Wednesday, October 6th. Several hydrology tools are part of the basic ArcGIS
GIS IN ECOLOGY: ANALYZING RASTER DATA
 GIS IN ECOLOGY: ANALYZING RASTER DATA Contents Introduction... 2 Tools and Functionality for Raster Data... 2 Data Sources... 3 Tasks... 4 Getting Started... 4 Creating Raster Data... 5 Summary Statistics...
GIS Topographic Wetness Index (TWI) Exercise Steps
 Exercise Steps") GIS Topographic Wetness Index (TWI) Exercise Steps October 2016 Jeffrey L. Zimmerman, Jr. GIS Analyst James P. Shallenberger Manager, Monitoring & Protection Susquehanna River Basin Commission Table of
GIS Topographic Wetness Index (TWI) Exercise Steps October 2016 Jeffrey L. Zimmerman, Jr. GIS Analyst James P. Shallenberger Manager, Monitoring & Protection Susquehanna River Basin Commission Table of
Watershed Delineation
 Watershed Delineation Jessica L. Watkins, University of Georgia 2 April 2009 Updated by KC Love February 25, 2011 PURPOSE For this project, I delineated watersheds for the Coweeta synoptic sampling area
Lab 1: Landuse and Hydrology, learning ArcGIS II. MANIPULATING DATA
 Lab 1: Landuse and Hydrology, learning ArcGIS II. MANIPULATING DATA As you experienced in the first lab session when you created a hillshade, high resolution data can be unwieldy if you are trying to perform
Open ArcToolbox Spatial Analyst Tools Hydrology. This should display the tools shown at the right:
 Project 2: Watershed Functions Save and close your project, above, if you haven t done so already. Then, open a new project, and add the driftless DEM. We ll be using ArcToolbox for this new project, but
Tutorial 8 Raster Data Analysis
 Objectives Tutorial 8 Raster Data Analysis This tutorial is designed to introduce you to a basic set of raster-based analyses including: 1. Displaying Digital Elevation Model (DEM) 2. Slope calculations
Within this document, the term NHDPlus is used when referring to NHDPlus Version 2.1 (unless otherwise noted).
.") Exercise 7 Watershed Delineation Using ArcGIS Spatial Analyst Last Updated 4/6/2017 Within this document, the term NHDPlus is used when referring to NHDPlus Version 2.1 (unless otherwise noted). There
Exercise 7 Watershed Delineation Using ArcGIS Spatial Analyst Last Updated 4/6/2017 Within this document, the term NHDPlus is used when referring to NHDPlus Version 2.1 (unless otherwise noted). There
Using a GIS to Calculate Area of Occupancy. Part 1: Creating a Shapefile Grid
 Using a GIS to Calculate Area of Occupancy Part 1: Creating a Shapefile Grid By Ryan Elliott California Natural Diversity Database, A NatureServe network program December 2008 This document describes the
Exercise 6: Working with Raster Data in ArcGIS 9.3
 Exercise 6: Working with Raster Data in ArcGIS 9.3 Why Spatial Analyst? Grid query Grid algebra Grid statistics Summary by zone Proximity mapping Reclassification Histograms Surface analysis Slope, aspect,
ISU GIS CENTER S ARCSDE USER'S GUIDE AND DATA CATALOG
 ISU GIS CENTER S ARCSDE USER'S GUIDE AND DATA CATALOG 2 TABLE OF CONTENTS 1) INTRODUCTION TO ARCSDE............. 3 2) CONNECTING TO ARCSDE.............. 5 3) ARCSDE LAYERS...................... 9 4) LAYER
Watershed Analysis of the Blue Ridge Mountains in Northwestern Virginia
 Watershed Analysis of the Blue Ridge Mountains in Northwestern Virginia Mason Fredericks December 6, 2018 Purpose The Blue Ridge Mountain range is one of the most popular mountain ranges in the United
Determining the Location of the Simav Fault
 Lindsey German May 3, 2012 Determining the Location of the Simav Fault 1. Introduction and Problem Formulation: The issue I will be focusing on involves interpreting the location of the Simav fault in
4. GIS Implementation of the TxDOT Hydrology Extensions
 4. GIS Implementation of the TxDOT Hydrology Extensions A Geographic Information System (GIS) is a computer-assisted system for the capture, storage, retrieval, analysis and display of spatial data. It
Using Earthscope and B4 LiDAR data to analyze Southern California s active faults
 Using Earthscope and B4 LiDAR data to analyze Southern California s active faults Exercise 8: Simple landscape morphometry and stream network delineation Introduction This exercise covers sample activities
Introduction. Project Summary In 2014 multiple local Otsego county agencies, Otsego County Soil and Water
 Introduction Project Summary In 2014 multiple local Otsego county agencies, Otsego County Soil and Water Conservation District (SWCD), the Otsego County Planning Department (OPD), and the Otsego County
June 2018 WORKSHOP SECTION 2 MANUAL: RUNNING PTMAPP-DESKTOP AN INNOVATIVE SOLUTION BY:
 June 2018 WORKSHOP SECTION 2 MANUAL: RUNNING PTMAPP-DESKTOP AN INNOVATIVE SOLUTION BY: TABLE OF CONTENTS 1 PURPOSE... 3 2 SET UP DATA PATHS... 4 2.1 BASE DATA SETUP... 4 3 INGEST DATA... 6 3.1 CLIP WATERSHED...
DEMs Downloading and projecting and using Digital Elevation Models (DEM)
") DEMs Downloading and projecting and using Digital Elevation Models (DEM) Introduction In this exercise, you will work with Digital Elevation Models (DEM). You will download a DEM in geographic coordinates
DEMs Downloading and projecting and using Digital Elevation Models (DEM) Introduction In this exercise, you will work with Digital Elevation Models (DEM). You will download a DEM in geographic coordinates
Handling Raster Data for Hydrologic Applications
 Handling Raster Data for Hydrologic Applications Prepared by Venkatesh Merwade Lyles School of Civil Engineering, Purdue University vmerwade@purdue.edu January 2018 Objective The objective of this exercise
GEOG4017 Geographical Information Systems Lab 8 Spatial Analysis and Digital Terrain Modeling
 DEPARTMENT OF GEOGRAPHY HONG KONG BAPTIST UNIVERSITY Prof. Q. Zhou GEOG4017 Geographical Information Systems Lab 8 Spatial Analysis and Digital Terrain Modeling Objectives The exercise is designed to familiarize
BSEN 6220 GIS LAB #5
 BSEN 6220 GIS LAB #5 Dustin Till 10/29/2014 INTRODUCTION: ArcGIS is a geographic information system for working with maps and geographic information. It is used for creating and using maps, compiling geographic
Recommendations for installation and general overview of available tools
 User guide for FluvialCorridor toolbox Recommendations for installation and general overview of available tools How to cite : Roux., C., Alber, A., Bertrand, M., Vaudor, L., Piégay, H., 2013. General Overview
Watershed Modeling Orange County Hydrology Using GIS Data
 v. 10.0 WMS 10.0 Tutorial Watershed Modeling Orange County Hydrology Using GIS Data Learn how to delineate sub-basins and compute soil losses for Orange County (California) hydrologic modeling Objectives
Watershed and Stream Network Delineation
 Watershed and Stream Network Delineation GIS in Water Resources, Fall 2011 Prepared by David Tarboton, Utah State University Purpose The purpose of this exercise is to illustrate watershed and stream network
Creating Watersheds and Stream Networks. Steve Kopp
 Creating Watersheds and Stream Networks Steve Kopp Workshop Overview Demo Data Understanding the tools Elevation Data Types DEM : Digital Elevation Model bare Earth DSM : Digital Surface Model Data Structure
Exercise 2: Working with Vector Data in ArcGIS 9.3
 Exercise 2: Working with Vector Data in ArcGIS 9.3 There are several tools in ArcGIS 9.3 used for GIS operations on vector data. In this exercise we will use: Analysis Tools in ArcToolbox Overlay Analysis
Working with Digital Elevation Models in ArcGIS 8.3
 Working with Digital Elevation Models in ArcGIS 8.3 The homework that you need to turn in is found at the end of this document. This lab continues your introduction to using the Spatial Analyst Extension
Data Structures & Database Queries in GIS
 Data Structures & Database Queries in GIS Objective In this lab we will show you how to use ArcGIS for analysis of digital elevation models (DEM s), in relationship to Rocky Mountain bighorn sheep (Ovis
Watershed Modeling With DEMs
 Watershed Modeling With DEMs Lesson 6 6-1 Objectives Use DEMs for watershed delineation. Explain the relationship between DEMs and feature objects. Use WMS to compute geometric basin data from a delineated
Exercise 4. Watershed and Stream Network Delineation
 Exercise 4. Watershed and Stream Network Delineation GIS in Water Resources, Fall 2014 Prepared by David G Tarboton and David R. Maidment Purpose The purpose of this exercise is to illustrate watershed
Working with Digital Elevation Models and Spot Heights in ArcMap
 Working with Digital Elevation Models and Spot Heights in ArcMap 10.3.1 1 TABLE OF CONTENTS INTRODUCTION... 3 WORKING WITH SPOT HEIGHTS FROM NRVIS, CITY OF KITCHENER, AND CITY OF TORONTO...4 WORKING WITH
Urban Canopy Tool User Guide `bo`
 Urban Canopy Tool User Guide `bo` ADMS Urban Canopy Tool User Guide Version 2.0 June 2014 Cambridge Environmental Research Consultants Ltd. 3, King s Parade Cambridge CB2 1SJ UK Telephone: +44 (0)1223
Outline. Chapter 1. A history of products. What is ArcGIS? What is GIS? Some GIS applications Introducing the ArcGIS products How does GIS work?
 Outline Chapter 1 Introducing ArcGIS What is GIS? Some GIS applications Introducing the ArcGIS products How does GIS work? Basic data formats The ArcCatalog interface 1-1 1-2 A history of products Arc/Info
GIS Software. Evolution of GIS Software
 GIS Software The geoprocessing engines of GIS Major functions Collect, store, mange, query, analyze and present Key terms Program collections of instructions to manipulate data Package integrated collection
Outcrop suitability analysis of blueschists within the Dry Lakes region of the Condrey Mountain Window, North-central Klamaths, Northern California
 Outcrop suitability analysis of blueschists within the Dry Lakes region of the Condrey Mountain Window, North-central Klamaths, Northern California (1) Introduction: This project proposes to assess the
JJ Munoz. Explanation of the Project/Outline
 JJ Munoz Helper GEO 386G 1 December, 2016 GIS Project: Using ArcHydro and Surface Roughness tools to Determine Alluvial Fan Catchment Area Morphology Statistics from 1-meter resolution LiDAR DEM s. Explanation
SLEEP Soil-Landscape Estimation and Evaluation Program For ArcGIS 10.1
 SLEEP Soil-Landscape Estimation and Evaluation Program For ArcGIS 10.1 USER s GUIDE Feras Ziadat, David Shoemate, Dhanesh Yeganantham, Raghavan Srinivasan, Jaclyn Tech International Center for Agricultural
ST-Links. SpatialKit. Version 3.0.x. For ArcMap. ArcMap Extension for Directly Connecting to Spatial Databases. ST-Links Corporation.
 ST-Links SpatialKit For ArcMap Version 3.0.x ArcMap Extension for Directly Connecting to Spatial Databases ST-Links Corporation www.st-links.com 2012 Contents Introduction... 3 Installation... 3 Database
Modeling Incident Density with Contours in ArcGIS Pro
 Modeling Incident Density with Contours in ArcGIS Pro By Mike Price, Entrada/San Juan, Inc. What you will need ArcGIS Pro 1.4 license or later ArcGIS Spatial Analyst license ArcGIS Online for organizational
CE 365K Exercise 1: GIS Basemap for Design Project Spring 2014 Hydraulic Engineering Design
 CE 365K Exercise 1: GIS Basemap for Design Project Spring 2014 Hydraulic Engineering Design The purpose of this exercise is for you to construct a basemap in ArcGIS for your design project. You may execute
Spatial Data Analysis in Archaeology Anthropology 589b. Kriging Artifact Density Surfaces in ArcGIS
 Spatial Data Analysis in Archaeology Anthropology 589b Fraser D. Neiman University of Virginia 2.19.07 Spring 2007 Kriging Artifact Density Surfaces in ArcGIS 1. The ingredients. -A data file -- in.dbf
v Prerequisite Tutorials GSSHA WMS Basics Watershed Delineation using DEMs and 2D Grid Generation Time minutes
 v. 10.1 WMS 10.1 Tutorial GSSHA WMS Basics Creating Feature Objects and Mapping Attributes to the 2D Grid Populate hydrologic parameters in a GSSHA model using land use and soil data Objectives This tutorial
EXERCISE 12: IMPORTING LIDAR DATA INTO ARCGIS AND USING SPATIAL ANALYST TO MODEL FOREST STRUCTURE
 EXERCISE 12: IMPORTING LIDAR DATA INTO ARCGIS AND USING SPATIAL ANALYST TO MODEL FOREST STRUCTURE Document Updated: December, 2007 Introduction This exercise is designed to provide you with possible silvicultural
Hydrology and Watershed Analysis
 Hydrology and Watershed Analysis Manual By: Elyse Maurer Reference Map Figure 1. This map provides context to the area of Washington State that is being focused on. The red outline indicates the boundary
In this exercise we will learn how to use the analysis tools in ArcGIS with vector and raster data to further examine potential building sites.
 GIS Level 2 In the Introduction to GIS workshop we filtered data and visually examined it to determine where to potentially build a new mixed use facility. In order to get a low interest loan, the building
Exercise 4. Watershed and Stream Network Delineation
 Exercise 4. Watershed and Stream Network Delineation GIS in Water Resources, Fall 2015 Prepared by David G Tarboton and David R. Maidment Purpose The purpose of this exercise is to illustrate watershed
Trail Flow: Analysis of Drainage Patterns Affecting a Mountain Bike Trail
 Andy Belcher BAE 590 Professor Huffman 12.9.11 Location Trail Flow: Analysis of Drainage Patterns Affecting a Mountain Bike Trail The location of the project area rests in the Cary area of Wake County,
Hot Spot / Point Density Analysis: Kernel Smoothing
 Hot Spot / Point Density Analysis: Kernel Smoothing Revised by Carolyn Talmadge on January 15, 2016 SETTING UP... 1 ENABLING THE SPATIAL ANALYST EXTENSION... 1 SET UP YOUR ANALYSIS OPTIONS IN ENVIRONMENTS...
THE CONSERVATION LANDSCAPE CONTEXT TOOLBOX: A Custom ESRI ArcToolbox for the Stewardship of Conservation Lands in Rhode Island
 THE CONSERVATION LANDSCAPE CONTEXT TOOLBOX: A Custom ESRI ArcToolbox for the Stewardship of Conservation Lands in Rhode Island Ann Borowik M.E.S.M. Research Project University of Rhode Island May 2008
Exercise 4. Watershed and Stream Network Delineation
 Exercise 4. Watershed and Stream Network Delineation GIS in Water Resources, Fall 2018 Prepared by David G Tarboton and David R. Maidment Revised 9 October, 2018 Purpose The purpose of this exercise is
Working with Digital Elevation Models and Digital Terrain Models in ArcMap 9
 Working with Digital Elevation Models and Digital Terrain Models in ArcMap 9 1 TABLE OF CONTENTS INTRODUCTION...3 WORKING WITH DIGITAL TERRAIN MODEL (DTM) DATA FROM NRVIS, CITY OF KITCHENER, AND CITY OF
Hot Spot / Kernel Density Analysis: Calculating the Change in Uganda Conflict Zones
 Hot Spot / Kernel Density Analysis: Calculating the Change in Uganda Conflict Zones Created by Patrick Florance; revised by Carolyn Talmadge, Madeline Wrable, Kyle Monahan on March 28, 2017 OVERVIEW...
![)UDQFR54XHQWLQ(DQG'tD]'HOJDGR&](/thumbs/95/125846872.jpg ")UDQFR54XHQWLQ(DQG'tD]'HOJDGR&") &21&(37,21$1',03/(0(17$7,212)$1+
&21&(37,21$1',03/(0(17$7,212)$1+ Esri Exam EADP10 ArcGIS Desktop Professional Version: 6.2 [ Total Questions: 95 ]
![Esri Exam EADP10 ArcGIS Desktop Professional Version: 6.2 [ Total Questions: 95 ]](/thumbs/73/68697597.jpg "Esri Exam EADP10 ArcGIS Desktop Professional Version: 6.2 [ Total Questions: 95 ]") s@lm@n Esri Exam EADP10 ArcGIS Desktop Professional Version: 6.2 [ Total Questions: 95 ] Question No : 1 An ArcGIS user runs the Central Feature geoprocessing tool on a polygon feature class. The output
s@lm@n Esri Exam EADP10 ArcGIS Desktop Professional Version: 6.2 [ Total Questions: 95 ] Question No : 1 An ArcGIS user runs the Central Feature geoprocessing tool on a polygon feature class. The output
Geographical Information Systems
 Geographical Information Systems Geographical Information Systems (GIS) is a relatively new technology that is now prominent in the ecological sciences. This tool allows users to map geographic features
Environmental Systems Research Institute
 Introduction to ArcGIS ESRI Environmental Systems Research Institute Redlands, California 2 ESRI GIS Development Arc/Info (coverage model) Versions 1-7 from 1980 1999 Arc Macro Language (AML) ArcView (shapefile
GIS in Water Resources Midterm Exam Fall 2008 There are 4 questions on this exam. Please do all 4.
 Page 1 of 8 Name: GIS in Water Resources Midterm Exam Fall 2008 There are 4 questions on this exam. Please do all 4. 1. Basic Concepts [20 points] Find the letter with the best answer for each term: 1.
Task 1: Start ArcMap and add the county boundary data from your downloaded dataset to the data frame.
 Exercise 6 Coordinate Systems and Map Projections The following steps describe the general process that you will follow to complete the exercise. Specific steps will be provided later in the step-by-step
Task 1: Open ArcMap and activate the Spatial Analyst extension.
 Exercise 10 Spatial Analyst The following steps describe the general process that you will follow to complete the exercise. Specific steps will be provided later in the step-by-step instructions component
Measuring earthquake-generated surface offsets from high-resolution digital topography
 Measuring earthquake-generated surface offsets from high-resolution digital topography July 19, 2011 David E. Haddad david.e.haddad@asu.edu Active Tectonics, Quantitative Structural Geology, and Geomorphology
GeoWEPP Tutorial Appendix
 GeoWEPP Tutorial Appendix Chris S. Renschler University at Buffalo - The State University of New York Department of Geography, 116 Wilkeson Quad Buffalo, New York 14261, USA Prepared for use at the WEPP/GeoWEPP
Learning ArcGIS: Introduction to ArcCatalog 10.1
 Learning ArcGIS: Introduction to ArcCatalog 10.1 Estimated Time: 1 Hour Information systems help us to manage what we know by making it easier to organize, access, manipulate, and apply knowledge to the
Learning Unit Student Guide. Title: Estimating Areas of Suitable Grazing Land Using GPS, GIS, and Remote Sensing
 Learning Unit Student Guide Name of Creator: Jeff Sun Institution: Casper College Email: jsun@caspercollege.edu Phone: Office (307) 268-3560 Cell (307) 277-9766 Title: Estimating Areas of Suitable Grazing
Exercise 6: Using Burn Severity Data to Model Erosion Risk
 Exercise 6: Using Burn Severity Data to Model Erosion Risk Document Updated: November 2009 Software Versions: ERDAS Imagine 9.3 and ArcGIS 9.3, Microsoft Office 2007 Introduction A common use of burn severity
GIS INSTRUCTIONAL MANUAL
 GIS INSTRUCTIONAL MANUAL: BEAVER RESTORATION AND ASSESSMENT TOOL (BRAT) CASE STUDY: ESCALANTE RIVER WATERSHED VERSION 1.0 (RELEASE DATE: JANUARY 21, 2013) Prepared by: WILLIAM W. MACFARLANE, Research Associate
13 Watershed Delineation & Modeling
 Module 4 (L12 - L18): Watershed Modeling Standard modeling approaches and classifications, system concept for watershed modeling, overall description of different hydrologic processes, modeling of rainfall,
NR402 GIS Applications in Natural Resources
 NR402 GIS Applications in Natural Resources Lesson 1 Introduction to GIS Eva Strand, University of Idaho Map of the Pacific Northwest from http://www.or.blm.gov/gis/ Welcome to NR402 GIS Applications in
Popular Mechanics, 1954
 Introduction to GIS Popular Mechanics, 1954 1986 $2,599 1 MB of RAM 2017, $750, 128 GB memory, 2 GB of RAM Computing power has increased exponentially over the past 30 years, Allowing the existence of
George Mason University Department of Civil, Environmental and Infrastructure Engineering
 George Mason University Department of Civil, Environmental and Infrastructure Engineering Dr. Celso Ferreira Prepared by Lora Baumgartner December 2015 Revised by Brian Ross July 2016 Exercise Topic: Getting
Exercise 2: Working with Vector Data in ArcGIS 9.3
 Exercise 2: Working with Vector Data in ArcGIS 9.3 There are several tools in ArcGIS 9.3 used for GIS operations on vector data. In this exercise we will use: Analysis Tools in ArcToolbox Overlay Analysis
Exercise 4. Watershed and Stream Network Delineation
 Exercise 4. Watershed and Stream Network Delineation GIS in Water Resources, Fall 2016 Prepared by David G Tarboton and David R. Maidment Updated to ArcGIS Pro by Paul Ruess [9/29/16 Further updated to
Workshop: Build a Basic HEC-HMS Model from Scratch
 Workshop: Build a Basic HEC-HMS Model from Scratch This workshop is designed to help new users of HEC-HMS learn how to apply the software. Not all the capabilities in HEC-HMS are demonstrated in the workshop
ArcHYDRO: GIS for Water Resources
 SOCRATES ERASMUS Intensive Programme ArcHYDRO: GIS for Water Resources Source: Center for Research in Water Resources, University of Texas at Austin Tutorial: Watershed and Stream Network Delineation Goals
caused displacement of ocean water resulting in a massive tsunami. II. Purpose
 I. Introduction The Great Sumatra Earthquake event took place on December 26, 2004, and was one of the most notable and devastating natural disasters of the decade. The event consisted of a major initial
Week 7 Last week: This week s topics. GIS and Forest Engineering Applications. FE 257. GIS and Forest Engineering Applications.
 FE 257. GIS and Forest Engineering Applications Week 7 Week 7 Last week: Spatial Projections Questions? Next week- read: Chapter 10: Updating GIS Databases Chapter 12: Synthesis of Techniques Applied to
Lab 7: Cell, Neighborhood, and Zonal Statistics
 Lab 7: Cell, Neighborhood, and Zonal Statistics Exercise 1: Use the Cell Statistics function to detect change In this exercise, you will use the Spatial Analyst Cell Statistics function to compare the
Lab 1: Importing Data, Rectification, Datums, Projections, and Coordinate Systems
 Lab 1: Importing Data, Rectification, Datums, Projections, and Coordinate Systems Topics covered in this lab: i. Importing spatial data to TAS ii. Rectification iii. Conversion from latitude/longitude
SLR Calculator: Sea Level Rise (SLR) Inundation Surface Calculator Add-in for ArcGIS Desktop & 10.4
 Inundation Surface Calculator Add-in for ArcGIS Desktop & 10.4") 1 SLR Calculator: Sea Level Rise (SLR) Inundation Surface Calculator Add-in for ArcGIS Desktop 10.3.1 & 10.4 Florida Sea Level Scenario Sketch Planning Tool Version 1.6, July 2016 University of Florida
1 SLR Calculator: Sea Level Rise (SLR) Inundation Surface Calculator Add-in for ArcGIS Desktop 10.3.1 & 10.4 Florida Sea Level Scenario Sketch Planning Tool Version 1.6, July 2016 University of Florida
Outline Anatomy of ArcGIS Metadata Data Types Vector Raster Conversion Adding Data Navigation Symbolization Methods Layer Files Editing Help Files
 UPlan Training Lab Exercise: Introduction to ArcGIS Outline Anatomy of ArcGIS Metadata Data Types Vector Raster Conversion Adding Data Navigation Symbolization Methods Layer Files Editing Help Files Anatomy
A GIS-based Approach to Watershed Analysis in Texas Author: Allison Guettner
 Texas A&M University Zachry Department of Civil Engineering CVEN 658 Civil Engineering Applications of GIS Instructor: Dr. Francisco Olivera A GIS-based Approach to Watershed Analysis in Texas Author:
Overlay Analysis II: Using Zonal and Extract Tools to Transfer Raster Values in ArcMap
 Overlay Analysis II: Using Zonal and Extract Tools to Transfer Raster Values in ArcMap Created by Patrick Florance and Jonathan Gale, Edited by Catherine Ressijac on March 26, 2018 If you have raster data
GIS Geographic Information System
 GIS Geographic Information System Andrea Petroselli Tuscia University, Italy petro@unitus.it SUMMARY Part 1: Part 2: Part 3: Part 4: What is a GIS? Why do we need a GIS? Which are the possibilities of
Hydrological feature extraction from LiDAR. Grant Pearse 28 March 2017
 Hydrological feature extraction from LiDAR Grant Pearse 28 March 2017 Overview Hydrology and Forestry Background & Motivation Extract more value from LiDAR Case study Geraldine Practical Overview Hydrology
Welcome to NR502 GIS Applications in Natural Resources. You can take this course for 1 or 2 credits. There is also an option for 3 credits.
 Welcome to NR502 GIS Applications in Natural Resources. You can take this course for 1 or 2 credits. There is also an option for 3 credits. The 1st credit consists of a series of readings, demonstration,
Conservation Applications of LiDAR Data
 Program: Funding: Conservation Applications of LiDAR Data http://tsp.umn.edu/lidar Environment and Natural Resources Trust Fund Module: Instructor: Exercise: Hydrologic Applications Sean Vaughn, DNR GIS
Part 1: GIS Data from the Web: Downloading and Projecting Digital Elevation Models (DEM) and BTS Road data
 and BTS Road data") Field Geology I Hometown GIS, Part 1 October 03, 2005 Lab Exercise 2.1 Part 1: GIS Data from the Web: Downloading and Projecting Digital Elevation Models (DEM) and BTS Road data 1. Introduction a. GIS
Field Geology I Hometown GIS, Part 1 October 03, 2005 Lab Exercise 2.1 Part 1: GIS Data from the Web: Downloading and Projecting Digital Elevation Models (DEM) and BTS Road data 1. Introduction a. GIS
SIE 509 Principles of GIS Exercise 5 An Introduction to Spatial Analysis
 SIE 509 Principles of GIS Exercise 5 An Introduction to Spatial Analysis Due: Oct. 31, 2017 Total Points: 50 Introduction: The Governor of Maine is asking communities to look at regionalization for major
Python Raster Analysis. Kevin M. Johnston Nawajish Noman
 Python Raster Analysis Kevin M. Johnston Nawajish Noman Outline Managing rasters and performing analysis with Map Algebra How to access the analysis capability - Demonstration Complex expressions and optimization