Current developments of remote sensing for mapping and monitoring land degradation at regional scale
|
|
|
- Clarence Leonard
- 5 years ago
- Views:
Transcription
1 Current developments of remote sensing for mapping and monitoring land degradation at regional scale Prof Graciela Metternicht Chair, ICA Commission on Mapping from Satellite Imagery Curtin University of Technology Perth, Western Australia UN-Zambia-ESA Regional Workshop on the Applications of GNSS in Sub-Saharan Africa June 2006
2 What is land degradation? Land degradation is the reduction in the capability of the land to produce benefits from a particular land use under a specified form of land management (after Blaikie and Brookfield 1987). Soil degradation is one aspect of land degradation; others are degradation of vegetation or water resources. UNOOSA ESA Regional Workshop, Zambia, June
3 Processes of land degradation Land degradation results in adverse effects of which we like to know the spatial and temporal variation. Knowledge of: processes of land degradation, and hence the process-controlling variables, and the effects of degradation is a pre-requisite to determine which variables can be derived from remotely sensed images. UNOOSA ESA Regional Workshop, Zambia, June
4 The Scale Factor Factors controlling spatial variation of land degradation depend on scale. Macro-scale: 1:1,000,000 climate is considered a very important factor Micro-scale: 1:50,000 and finer scales Climate is fairly uniform Variation of soil properties Lithology Topography Vegetation properties, become important UNOOSA ESA Regional Workshop, Zambia, June
5 The scale factor (cont) At micro-scale the short distance spatial variability of process-controlling factors becomes important. Using vegetation or soil maps with large mapping units doesn t make sense, as local variation has to be captured. Remote sensing can play an important role in capturing local variation UNOOSA ESA Regional Workshop, Zambia, June
6 Methods for assessing land degradation Expert opinion: subjective assessment, using semi-quantitative definitions (e.g. GLASOD survey) Remote sensing: satellite and airborne images, linked to ground observations. Ground-based radiometry Field observations: including stratified soil sampling and analysis, long term field observations of vegetation and biodiversity in specific sites. UNOOSA ESA Regional Workshop, Zambia, June
7 Methods for land degradation assessment (cont.) Productivity changes: observing changes in crop yield Land users opinions and farm level field criteria: studies at farm level are seen as essential on a sample basis, to obtain a view of the severity of degradation and its causes, together with practicable remedial measures Modelling: based on data obtained by other methods, modelling is applied for: Prediction of hazard to degradation (GIS-based models) Extending the range of applicability of results on observed degradation. None of these consist in a single methodology, synergistic use (e.g. Combined approaches) are common. UNOOSA ESA Regional Workshop, Zambia, June
8 Mapping and modelling land degradation Satellite imagery and aerial photographs are recommended tools for: 1. Assessing the spatial and temporal distribution of land degradation features; 2. Collecting input data for process simulation models in order to produce land cover maps, vegetation cover maps, bare soil fraction maps, etc UNOOSA ESA Regional Workshop, Zambia, June
9 1. Assessing spatial and temporal distribution Surveying: to assess the current status of the land in terms of ongoing degradation processes. Aims: Determining the spatial variability and status of: Natural vegetation (coverage and structure) Agricultural crops (performance, coverage) Soil surface (e.g. sealing or crusting) Presence of soil erosion surface features (gullies, rills) Monitoring changes over time: Development of crop canopy over a growing season (indicator of erosion) Long term development of rill and gully formation in an area. UNOOSA ESA Regional Workshop, Zambia, June


, Laboratory analysis,")

10 Detecting and measuring indicators: Techniques Indicators can be detected using a variety of techniques, including Field observations (GPS), Laboratory analysis, Remotely sensed data or a combination thereof. UNOOSA ESA Regional Workshop, Zambia, June
11 2. Input data for modelling Process controlling variables such as: rainfall interception, water canopy storage and changing agricultural land use through the growing season are derived from air- or satellite-borne images to use the information in process simulation models. UNOOSA ESA Regional Workshop, Zambia, June
12 Land degradation processes/ remote sensing requirements: temporal and spatial Changes over extensive areas (regional scale) Low spatial resolution High temporal resolution Low spatial resolution Low temporal resolution Fast changes Slow changes High spatial resolution High Temporal resolution Changes over small areas (local scale) High spatial resolution Low temporal resolution UNOOSA ESA Regional Workshop, Zambia, June
13 Land degradation mapping and monitoring Factors influencing the use of RS as a mapping tool Sensors and platforms commonly used
14 Factors affecting feature discrimination and mapping The one-to-many relationship between surface features and land degradation processes, one feature characterising many degradation process (Figure 1); The spectral similarity among surface component associated with land degradation; and The differences in spatial resolution of various data sources used for mapping purposes, including remotely sensed data, field observations and laboratory determinations. UNOOSA ESA Regional Workshop, Zambia, June
15 Constraints on the use of remote sensing: land salinization example Salts at the terrain surface can be detected from remotely sensed data: Directly: salt efflorescences, salt crusts, bare soils Indirectly: through vegetation type and growth; vegetation health s status UNOOSA ESA Regional Workshop, Zambia, June
16 Remote Sensing Sources: soil salinity as a form of land degradation Satellite Airborne Ground-based
17 Sources of remote sensing data Satellite-borne sensors Sensor No of bands Spectral Range (µm) Spatial resolution Landsat TM4&5 Landsat TM7-ETM+ SPOT 1-3 SPOT 4 LISS-III 4 LISS-II 4 7 ( 1-7) 8 (1-8) 4 (Xs1-3 & Pan) 5 (Xi1-4 and Mono) Visible, NIR, mid- and thermal infrared B1: B2: B3: B4: B5: B6: B7: B8: (pan) Visible, NIR Xs1: Xs2: Xs3: Xi4: Pan: Mono: Visible, NIR, mid-infrared B1: B2: B3: B4: Visible, NIR B1: B2: B3: B4: Bands 1-5 and 7: 30 m Band 6: 120m Band 8: 15m Xs or Xi: 20 m Pan and Mono: 10 m Bands 1-3: 23 m Band 4: 70 m 36.25m IRS-1C (pan) 5.8m JERS-1 1 Microwave m
18 Airborne sensors Aerial photographs B/W; colour infrared variable, depending on flight height Narrow-band videography 3 Visible, NIR m DMSV (Digital Multispectral Video Systems) Visible, NIR AIRSAR-TOPSAR 3 Microwave (full polarimetric) P-, L- and C-bands Hyperspectral Hymap Hyperspectral DAIS Airborne geophysics 128 Visible, NIR, mid-infrared (32 bands) (8 bands) (32 bands) 3-5 (1 band) (6 bands) gravity magnetic electromagnetic gramma-ray variable: 0.25m-2m 10m 2-10 m 3-20 m
19 Mission Launch Year Instrument Spatial Resolution (meters, at nadir) Swath (km) PAN* VNIR* SWIR* TIR* SAR*/ band Repeat Cycle (day) Landsat TM SPOT HRV to 26 ERS AMI-SAR 30/C ATSR IRS-1B 1991 LISS I LISS x2 22 IRS-P LISS Resurs-O1 N MSU-SK to 4 ERS AMI-SAR 30/C ATSR IRS-1C 1995 PAN to 24 LISS WiFS to 24 Radarsat 1995 SAR /C to 6 IRS-P MOS WiFS IRS-1D 1997 PAN to 24 LISS WiFS to 24 SPOT xHRV-IR 10 10, 20 10, Vegetation Landsat ETM Ikonos 1999 Ikonos CBERS 1999 CCD to 26 IR-MSS WFI to 5 Terra (EOS AM-1) 1999 ASTER MISR 240, 480, to 9 960, 1900 MODIS 250, 500, 500, Quickbird Quickbird to 5 ADEOS GLI Aqua (EOS PM-1) 2002 MODIS 250, 500, 500, ENVISAT AATSR ASAR 30/C SPOT-5a 2002 HRG UNOOSA Vegetation ESA Regional Workshop, 1000 Zambia, 1000 June
20 Forthcoming High Resolution Optical Satellite IRS-P5 (CartoSat-1) ALOS CBERS 3 & 4 Sensor Spatial Res olution (meters ) and (# Bands ) PAN VNIR SWIR MWIR TIR Swath (Km) PAN-F PRISM, (70) 46(2) 2005 AVNIR-2 10(4) 70 MUX 20 (4) PAN ISR (2) WFI 73 (4) TopSat 2 RALCam (3) Plèiades 3 1 & 2 HiRI (4) to RapidEye A-E 4 REIS (5) EROS B - C PIC RazakSat 5 MAC (4) China DMC+4 (Tsinghua-1) MS DMC 4 32 (3) Resurs DK-1 6 ESI 1 3 (3) 28.3 N/A DMC (Disaster Monitoring Constellation of 4 satellites) of sun-synchronic circular orbit, daily revisit cycle. 2 Circular, sun-synchronic orbit 3 two-spacecraft constellation of CNES (Space Agency of France), with provision of stereo images. 4 five-satellite constellation 5 near equatorial low Earth orbit (NEO) 6 Near-circular non-sun synchronous UNOOSA orbit ESA Regional Workshop, Zambia, June passes/day Repeat Cycle Ye ar Launch
 Crop Scan multiband radiometer (Skye")

21 Sources of Remote Sensing data Ground-based sensors Electromagnetic induction meter (EM38, EM31, EM34-3, EM39) Crop Scan multiband radiometer (Skye Instruments Ltd, UK) Electromagnetic conductivity meters, measures the bulk electrical conductivity of soils 8 Visible, NIR UNOOSA ESA Regional Workshop, Zambia, June

22 Aerial Photographs Delineation of salt affected features depends from a combination of geomorphic features and grey tones or colors; Field verification is essential to determine variations in salt contents Aerial photographs are still useful in historical studies; UNOOSA ESA Regional Workshop, Zambia, June

23 Airborne Videography & Digital Multispectral cameras It presents the advantages of: High spatial resolution Near real time data acquisition Digital multispectral images Previous studies have demonstrated good correlations between spectral variations and the response of cotton to soil salinity, in the range of the blue to NIR For salt affected areas, colour infrared composites and red narrow band images have proven better than green and NIR bands. UNOOSA ESA Regional Workshop, Zambia, June
24 Microwave Sensing Relatively few studies have investigated the possibility of using microwave for mapping areas degraded by salinization C-, P- and L- bands are considered adequate for detecting salinity Previous studies have focused on the following features: Saline water detection by analysing the dependence of microwave responses on salinity and temperature Soil salinity identification by relating salinity levels to the imaginary parts of the complex dielectric constant Soil salinity mapping, including discrimination of salinity levels by mapping surface roughness and vegetation types related to salinity The info above is then used as ancillary data to estimate the extent of salinity at regional level. UNOOSA ESA Regional Workshop, Zambia, June
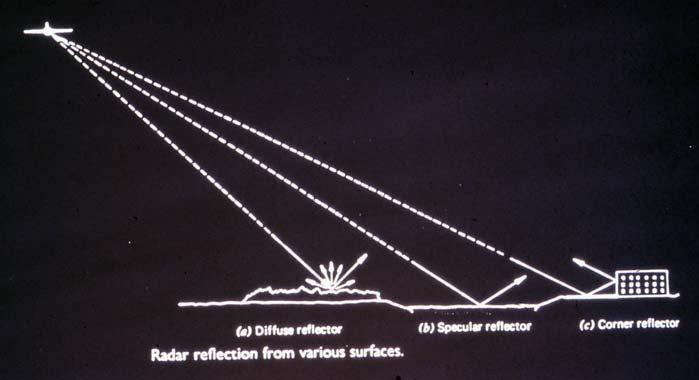


25 Microwave: backscattering UNOOSA ESA Regional Workshop, Zambia, June
26 Forthcoming Satellite SARs SATELLITE3 ERS-1 ERS2 RADARSAT- 1 JERS-1 ENVISAT RADARSAT- 2 ALOS TERRASAR-X COSMO/ SKYMED 1 Sensor AMI AMI SAR SAR ASAR SAR PALSAR TSX-1 SAR Space Agency ESA ESA RadarSat NASDA ESA RadarSat NASDA DLR/Infoterra ASI Int Int GmbH Operational since Out of Service Since Band C C C L C C L X X Wavelength (cm) Polarization VV VV HH HH HH/VV QUAD- All All HH/VV Pol* Incidence angle Variable ( ) Resolution range (m) Resolution azimuth (m) Scene width (km) (up to 350) (up to 1,300) Repeat cycle (days) Orbital elevation (km) UNOOSA ESA Regional Workshop, Zambia, June

27 Hyperspectral sensing Experiments carried out using Hymap (128 bands, nm). Mapped: salt scalds halophytic vegetation and soils with varying salinity degrees and types. Visible and NIR: enable detection of features related to hydrated evaporite minerals. UNOOSA ESA Regional Workshop, Zambia, June
28 Ground sensing: electromagnetic induction The EM series (EM 31, EM34-3, EM38, EM39) estimate soil salinity by measuring the bulk electrical conductivity of the soil, which depends on the salinity of the soil solution, porosity and the type and amount of clay in the soil. The instrument measures the apparent soil salinity (ECa) in a volume of soil below the transmitter and receiver coils. EM surveys are a way for rapid diagnosis and mapping of soil salinity. Survey speed depends on terrain conditions, topography and land use. UNOOSA ESA Regional Workshop, Zambia, June

29 EM: how it works? UNOOSA ESA Regional Workshop, Zambia, June
30 Multi-scale modelling Integrating remote sensing and GIS for defining areas of priority of intervention

31 Modelling at multi-scale level Multi-level approaches are cost-effective and enable decision maker focussing on areas of high priority of intervention UNOOSA ESA Regional Workshop, Zambia, June
 UNOOSA ESA Regional Workshop, Zambia, June 2006")
32 Conceptual Model proposed LEVEL 3 (15,000 larger) LEVEL 2 (1:25,000 1:50,000) LEVEL 1 (1:50,000 1:100,000) UNOOSA ESA Regional Workshop, Zambia, June
33 The model Level 1: Basic detection of diagnostic features over large areas. Sensors: Terra ASTER, Landsat TM, IRS, SPOT, Radarsat, Envisat, ERS. Multi-temporal &/or multi-sensor images can be used for mapping changes of environment-related factors over time. More qualitative assessment: Detect potentially dangerous areas of debris flows and associated hazards. UNOOSA ESA Regional Workshop, Zambia, June
34 The model Level 2: assess hazard potential or diagnostic features at more detail, over areas identified as potentially dangerous in Level 1. Integrates GIS for analysis. Sensors: VHR satellites, & SPOT- 5, IRS CartoSat-1) and satellites with InSAR capabilities. More quantitative assessment: Produce motion maps, etc. UNOOSA ESA Regional Workshop, Zambia, June
35 The model Level 3: detailed investigations of areas identified in L1 & L2. Sensors: mostly limited to sensors with DInSAR or InSAR capabilities, very high res. Images, LiDAR szstems, Ground based DInSAR. Quantitative assessment: deposits thickness, motion, debris distribution along and across the debris flow deposits. UNOOSA ESA Regional Workshop, Zambia, June
36 General conclusions
37 Perspectives: tools MODIS AstroVision Changes over extensive areas (regional scale) Landsat Radarsat ERS Envisat ASTER Low spatial resolution High temporal resolution Low spatial resolution Low temporal resolution Fast changes Slow changes High spatial resolution High Temporal resolution Quickbird Ikonos SPOT-5 Changes over small areas (local scale) High spatial resolution Low temporal resolution Quickbird Ikonos SPOT-5 ASTER Cartosat
38 Assessing Temporal and Spatial Changes Monitoring land degradation changes from past to present faces the difficulty that, in general, there is no ground-truth information available for past situations. Consequently, validation of historical remote sensing data involves uncertainties Fusion of multi-source remote sensing data and their integration with field and laboratory data can overcome part of this problem. UNOOSA ESA Regional Workshop, Zambia, June
39 Issues in remote monitoring of land degradation As salt related surface features change with seasons, time series of remote sensing data must be captured in similar periods of the year, preferably at the end of the dry season if passive remote sensors are used. Geo-referencing and co-registration of multitemporal data are essential Radiometric calibration between images so that digital numbers from different dates can be compared, particularly if direct application of a unique training set is applied to the images. UNOOSA ESA Regional Workshop, Zambia, June
40 Final comments Regardless the land degradation type mapped and/or monitored, the identification of correct indicators or diagnostic features is essential before any Remote Sensing or GIS modelling are applied. Salinity: monitoring of soil salinity and early warning of salinisation cannot be achieved from remote sensing data alone. It requires synergy between remote sensing, field observations, laboratory analysis, and GIS facilities for processing, displaying, modelling. UNOOSA ESA Regional Workshop, Zambia, June
Remote Sensing I: Basics
 Remote Sensing I: Basics Kelly M. Brunt Earth System Science Interdisciplinary Center, University of Maryland Cryospheric Science Laboratory, Goddard Space Flight Center kelly.m.brunt@nasa.gov (Based on
Challenges for the operational assimilation of satellite image data in agrometeorological models
 Challenges for the operational assimilation of satellite image data in agrometeorological models Mark Danson Centre for Environmental Systems Research, University of Salford, UK 0 Objectives The main objective
Geological Mapping Using EO Data for Onshore O&G Exploration
 Geological Mapping Using EO Data for Onshore O&G Exploration Michael Hall ESA Oil and Gas Workshop, Frascati, Italy michael.hall@infoterra-global.com Why use EO data for Geological Mapping? Availability
Towards eenvironment Prague, March GMES Space Component. Josef Aschbacher Head, ESA GMES Space Office
 Towards eenvironment Prague, 25-27 March 2009 GMES Space Component Josef Aschbacher Head, ESA GMES Space Office Prague from Space Segment 2 05 Nov 2003 CNES 2003 GISAT 2007 ESA GSELAND GMES is an EU led
Microwave Remote Sensing of Soil Moisture. Y.S. Rao CSRE, IIT, Bombay
 Microwave Remote Sensing of Soil Moisture Y.S. Rao CSRE, IIT, Bombay Soil Moisture (SM) Agriculture Hydrology Meteorology Measurement Techniques Survey of methods for soil moisture determination, Water
DAMAGE DETECTION OF THE 2008 SICHUAN, CHINA EARTHQUAKE FROM ALOS OPTICAL IMAGES
 DAMAGE DETECTION OF THE 2008 SICHUAN, CHINA EARTHQUAKE FROM ALOS OPTICAL IMAGES Wen Liu, Fumio Yamazaki Department of Urban Environment Systems, Graduate School of Engineering, Chiba University, 1-33,
PRINCIPLES OF REMOTE SENSING. Electromagnetic Energy and Spectral Signatures
 PRINCIPLES OF REMOTE SENSING Electromagnetic Energy and Spectral Signatures Remote sensing is the science and art of acquiring and analyzing information about objects or phenomena from a distance. As humans,
Lesson 4b Remote Sensing and geospatial analysis to integrate observations over larger scales
 Lesson 4b Remote Sensing and geospatial analysis to integrate observations over larger scales We have discussed static sensors, human-based (participatory) sensing, and mobile sensing Remote sensing: Satellite
Fundamentals of Remote Sensing
 Division of Spatial Information Science Graduate School Life and Environment Sciences University of Tsukuba Fundamentals of Remote Sensing Prof. Dr. Yuji Murayama Surantha Dassanayake 10/6/2010 1 Fundamentals
GEOG Lecture 8. Orbits, scale and trade-offs
 Environmental Remote Sensing GEOG 2021 Lecture 8 Orbits, scale and trade-offs Orbits revisit Orbits geostationary (36 000 km altitude) polar orbiting (200-1000 km altitude) Orbits revisit Orbits geostationary
Indian Earth Observation Programme
 Indian Earth Observation Programme Dr. Jai Singh Parihar Dy. Director Remote Sensing Applications Area (RESA) Space Applications Centre (ISRO) Ahmedabad 380 015 India jsparihar@sac.isro.gov.in Presentation
Estimation of Wavelet Based Spatially Enhanced Evapotranspiration Using Energy Balance Approach
 Estimation of Wavelet Based Spatially Enhanced Evapotranspiration Using Energy Balance Approach Dr.Gowri 1 Dr.Thirumalaivasan 2 1 Associate Professor, Jerusalem College of Engineering, Department of Civil
CNES Activity Report. Patrice Henry - CNES WGCV Plenary # 41 Tokyo Sept. 5-7, Working Group on Calibration and Validation
 Activity Report Patrice Henry - Tokyo Sept. 5-7, 2016 Working Group on Calibration and Validation SUMMARY Calibration Monitoring of in-flight Missions Preparation of future Missions Involvement in CEOS/WGCV
GIS and Remote Sensing
 Spring School Land use and the vulnerability of socio-ecosystems to climate change: remote sensing and modelling techniques GIS and Remote Sensing Katerina Tzavella Project Researcher PhD candidate Technology
Identifying Audit, Evidence Methodology and Audit Design Matrix (ADM)
") 11 Identifying Audit, Evidence Methodology and Audit Design Matrix (ADM) 27/10/2012 Exercise XXX 2 LEARNING OBJECTIVES At the end of this session participants will be able to: 1. Identify types and sources
11 Identifying Audit, Evidence Methodology and Audit Design Matrix (ADM) 27/10/2012 Exercise XXX 2 LEARNING OBJECTIVES At the end of this session participants will be able to: 1. Identify types and sources
Permafrost: Earth Observation Applications: Introduction
 Polar Meeting 3 Permafrost: Earth Observation Applications: Introduction Mark Drinkwater CNES, Paris, 22 23 May, 2013 Remote Sensing of Permafrost which Remote Sensing products? applicability to Permafrost
Linking Different Spatial Scales For Retrieval Of Sea Ice Conditions From SAR Images
 Linking Different Spatial Scales For Retrieval Of Sea Ice Conditions From SAR Images Matt Arkett 2, Wolfgang Dierking 1, Jakob Griebel 1, Thomas Hollands 1, Stefanie Linow 1, Eero Rinne 3, Markku Similä
Remote sensing of sea ice
 Remote sensing of sea ice Ice concentration/extent Age/type Drift Melting Thickness Christian Haas Remote Sensing Methods Passive: senses shortwave (visible), thermal (infrared) or microwave radiation
Operational ice charting in mid-latitudes using Near-Real-Time SAR imagery
 Operational ice charting in mid-latitudes using Near-Real-Time SAR imagery Sergey Vernyayev Ice Engineer ICEMAN.KZ Carles Debart Project Manager Energy, Environment and Security Yevgeniy Kadranov Ice charting
Drought Estimation Maps by Means of Multidate Landsat Fused Images
 Remote Sensing for Science, Education, Rainer Reuter (Editor) and Natural and Cultural Heritage EARSeL, 2010 Drought Estimation Maps by Means of Multidate Landsat Fused Images Diego RENZA, Estíbaliz MARTINEZ,
Interferometric Synthetic Aperture Radar (InSAR) and GGOS. Andrea Donnellan NASA/JPL February 21, 2007
 and GGOS. Andrea Donnellan NASA/JPL February 21, 2007") Interferometric Synthetic Aperture Radar (InSAR) and GGOS Andrea Donnellan NASA/JPL February 21, 2007 Sources for Science Objectives Fourth component of EarthScope Involvement: NSF, NASA, USGS, Universities
Interferometric Synthetic Aperture Radar (InSAR) and GGOS Andrea Donnellan NASA/JPL February 21, 2007 Sources for Science Objectives Fourth component of EarthScope Involvement: NSF, NASA, USGS, Universities
RADAR Remote Sensing Application Examples
 RADAR Remote Sensing Application Examples! All-weather capability: Microwave penetrates clouds! Construction of short-interval time series through cloud cover - crop-growth cycle! Roughness - Land cover,
EXTRACTION OF FLOODED AREAS DUE THE 2015 KANTO-TOHOKU HEAVY RAINFALL IN JAPAN USING PALSAR-2 IMAGES
 EXTRACTION OF FLOODED AREAS DUE THE 2015 KANTO-TOHOKU HEAVY RAINFALL IN JAPAN USING PALSAR-2 IMAGES F. Yamazaki a, *, W. Liu a a Chiba University, Graduate School of Engineering, Chiba 263-8522, Japan
Applications of Remote Sensing Systems. to MINERAL DEPOSIT DISCOVERY, DEVELOPMENT
 REMS 6022: Term Project Applications of Remote Sensing Systems to MINERAL DEPOSIT DISCOVERY, DEVELOPMENT and RECLAMATION Venessa Bennett OVERVIEW Remote Sensing data extensively used in all aspects of
GCOS High Resolution Land Cover ECV. Slide 11
 GCOS High Resolution Land Cover ECV Slide 11 Detailed Land Cover and Climate Land cover and its changes modify the goods and services provided to human society force climate by altering water and energy
GEO Joint Experiment for Crop Assessment and Monitoring (JECAM): 2014 Site Progress Report
: 2014 Site Progress Report") GEO Joint Experiment for Crop Assessment and Monitoring (JECAM): JECAM Test Site Name: China - Guangdong 2014 Site Progress Report Team Leader and Members: Prof Wu Bingfang (Leader), Jiratiwan Kruasilp,
GEO Joint Experiment for Crop Assessment and Monitoring (JECAM): JECAM Test Site Name: China - Guangdong 2014 Site Progress Report Team Leader and Members: Prof Wu Bingfang (Leader), Jiratiwan Kruasilp,
ECVs: What s operational and what still requires R&D?
 Glaciers_cci input on ECVs: What s operational and what still requires R&D? Frank Paul* Department of Geography, University of Zurich *on behalf of the Glaciers_cci consortium Google Earth Operational
Remote Sensing of Snow GEOG 454 / 654
 Remote Sensing of Snow GEOG 454 / 654 What crysopheric questions can RS help to answer? 2 o Where is snow lying? (Snow-covered area or extent) o How much is there? o How rapidly is it melting? (Area, depth,
Contribution to global Earth observation from satellites
 Contribution to global Earth observation from satellites - JAXA s Earth Observation strategy - April 16, 2008 Makoto Kajii Japan Aerospace Exploration Agency Earth Observation Summits and GEOSS 1 st EO
Geohazard Supersites and Natural Laboratories
 Geohazard Supersites and Natural Laboratories FRINGE 2011, Frascati, Italy, September 19, 2011 Wolfgang Lengert, ESA Falk Amelung, University of Miami, GEO task lead Craig Dobson, NASA, CEOS task lead
sentinel-2 COLOUR VISION FOR COPERNICUS
 sentinel-2 COLOUR VISION FOR COPERNICUS SATELLITES TO SERVE By providing a set of key information services for a wide range of practical applications, Europe s Copernicus programme is providing a step
Annex VI-1. Draft National Report on Ocean Remote Sensing in China. (Reviewed by the Second Meeting of NOWPAP WG4)
") UNEP/NOWPAP/CEARAC/WG4 2/9 Page1 Draft National Report on Ocean Remote Sensing in China (Reviewed by the Second Meeting of NOWPAP WG4) UNEP/NOWPAP/CEARAC/WG4 2/9 Page1 1. Status of RS utilization in marine
UNEP/NOWPAP/CEARAC/WG4 2/9 Page1 Draft National Report on Ocean Remote Sensing in China (Reviewed by the Second Meeting of NOWPAP WG4) UNEP/NOWPAP/CEARAC/WG4 2/9 Page1 1. Status of RS utilization in marine
This module presents remotely sensed assessment (choice of sensors and resolutions; airborne or ground based sensors; ground truthing)
") This module presents remotely sensed assessment (choice of sensors and resolutions; airborne or ground based sensors; ground truthing) 1 In this presentation you will be introduced to approaches for using
This module presents remotely sensed assessment (choice of sensors and resolutions; airborne or ground based sensors; ground truthing) 1 In this presentation you will be introduced to approaches for using
FUNDAMENTALS OF REMOTE SENSING FOR RISKS ASSESSMENT. 1. Introduction
 FUNDAMENTALS OF REMOTE SENSING FOR RISKS ASSESSMENT FRANÇOIS BECKER International Space University and University Louis Pasteur, Strasbourg, France; E-mail: becker@isu.isunet.edu Abstract. Remote sensing
Chapter 1 INTRODUCTION. 1.1 Introduction to Remote Sensing
 Chapter 1 INTRODUCTION 1.1 Introduction to Remote Sensing In 1859 Gaspard Tournachon took an oblique photograph of a small village near Paris from a balloon, with this picture the era of earth observation
The DEIMOS Earth Observation System and the PanGeo Alliance. Contribution to CSCDA Data WareHouse 2. Fabrizio Pirondini CEO, Elecnor Deimos Imaging
 The DEIMOS Earth Observation System and the PanGeo Alliance Contribution to CSCDA Data WareHouse 2 Fabrizio Pirondini CEO, Elecnor Deimos Imaging Copernicus Space Component Data Access Workshop ESRIN,
Cost-Effective Estimation of Vegetation Regrowth on Anthropogenic Features in NE BC (REMB )
") Cost-Effective Estimation of Vegetation Regrowth on Anthropogenic Features in NE BC (REMB-2017-02) FINAL PROJECT REPORT October 31, 2018 Project [1475-1] Prepared by: Prepared for: Jacqueline Howard Resource
Cost-Effective Estimation of Vegetation Regrowth on Anthropogenic Features in NE BC (REMB-2017-02) FINAL PROJECT REPORT October 31, 2018 Project [1475-1] Prepared by: Prepared for: Jacqueline Howard Resource
Themes for Geomatics Conference. Geodesy Themes
 Themes for Geomatics Conference Geodesy Themes Geodynamics o Modeling the Deformation of the Earth s Crust o Recent Advances in Geometric Approaches to Deformation Analysis o Monitoring Systems (Sensors
Reminder: All answers MUST GO ON ANSWER SHEET! Answers recorded in the exam booklet will not count.
 Reminder: All answers MUST GO ON ANSWER SHEET! Answers recorded in the exam booklet will not count. 1. Identify the following acronyms; compare these platform types; provide situations where one platform
The Copernicus Sentinel-5 Mission: Daily Global Data for Air Quality, Climate and Stratospheric Ozone Applications
 SENTINEL-5 The Copernicus Sentinel-5 Mission: Daily Global Data for Air Quality, Climate and Stratospheric Ozone Applications Yasjka Meijer RHEA for ESA, Noordwijk, NL 15/04/2016 Co-Authors: Jörg Langen,
GEOGG141 Principles & Practice of Remote Sensing (PPRS) RADAR III: Applications Revision
 RADAR III: Applications Revision") UCL DEPARTMENT OF GEOGRAPHY GEOGG141 Principles & Practice of Remote Sensing (PPRS) RADAR III: Applications Revision Dr. Mathias (Mat) Disney UCL Geography Office: 113, Pearson Building Tel: 7670 0592
UCL DEPARTMENT OF GEOGRAPHY GEOGG141 Principles & Practice of Remote Sensing (PPRS) RADAR III: Applications Revision Dr. Mathias (Mat) Disney UCL Geography Office: 113, Pearson Building Tel: 7670 0592
Accuracy and Precision Requirements for Climate-Level Data Sets
 Accuracy and Precision Requirements for Climate-Level Data Sets K. Thome NASA/GSFC Libya-4 Workshop Paris, France October 4-5, 2012 Accuracy requirements Commercial imagers Precision and SNR drive calibration
Assessing Drought in Agricultural Area of central U.S. with the MODIS sensor
 Assessing Drought in Agricultural Area of central U.S. with the MODIS sensor Di Wu George Mason University Oct 17 th, 2012 Introduction: Drought is one of the major natural hazards which has devastating
Indian National (Weather) SATellites for Agrometeorological Applications
 SATellites for Agrometeorological Applications") Indian National (Weather) SATellites for Agrometeorological Applications Bimal K. Bhattacharya Agriculture-Terrestrial Biosphere- Hydrology Group Space Applications Centre (ISRO) Ahmedabad 380015, India
Indian National (Weather) SATellites for Agrometeorological Applications Bimal K. Bhattacharya Agriculture-Terrestrial Biosphere- Hydrology Group Space Applications Centre (ISRO) Ahmedabad 380015, India
The VENμS mission: Earth Observation with High Spatial and Temporal Resolution Capabilities
 Ben Gurion University The VENμS mission: Earth Observation with High Spatial and Temporal Resolution Capabilities G. Dedieu 1, O. Hagolle 2, A. Karnieli 3, S. Cherchali 2 P. Ferrier 2 and Y. Yaniv 4 1
Bonn, Germany MOUTAZ DALATI. General Organization for Remote Sensing ( GORS ), Syria Advisor to the General Director of GORS,
, Syria Advisor to the General Director of GORS,") Bonn, Germany Early Warning System is needed for Earthquakes disaster mitigation in Syria Case Study: Detecting and Monitoring the Active faulting zones along the Afro-Arabian-Syrian Rift System MOUTAZ
Bonn, Germany Early Warning System is needed for Earthquakes disaster mitigation in Syria Case Study: Detecting and Monitoring the Active faulting zones along the Afro-Arabian-Syrian Rift System MOUTAZ
CEOS Overview and JAXA Plans for Water Cycle Observation
 CEOS Overview and JAXA Plans for Water Cycle Observation Asian Water Cycle Symposium November 2-4, 2005 Tokyo, Japan Chu Ishida Japan Aerospace Exploration Agency (JAXA) Contents 1. CEOS overview 2. CEOS
Learning Objectives. Thermal Remote Sensing. Thermal = Emitted Infrared
 November 2014 lava flow on Kilauea (USGS Volcano Observatory) (http://hvo.wr.usgs.gov) Landsat-based thermal change of Nisyros Island (volcanic) Thermal Remote Sensing Distinguishing materials on the ground
Geohazard Supersites and Natural Laboratories
 Geohazard Supersites and Natural Laboratories FRINGE 2011, Frascati, Italy, September 19, 2011 Wolfgang Lengert, ESA Falk Amelung, University of Miami, GEO task lead Craig Dobson, NASA, CEOS task lead
Last date for submission of Assignments is Title of the course: PGD-GARD - II Semester. Third Batch (2018) - ASSIGNMENT
 - ASSIGNMENT") Last date for submission of Assignments is 31-12-2018 Title of the course: PGD-GARD - II Semester Third Batch (2018) - ASSIGNMENT Course No. GARD-507: Course Title: Remote Sensing -II Total Marks: 30 Note:
Last date for submission of Assignments is 31-12-2018 Title of the course: PGD-GARD - II Semester Third Batch (2018) - ASSIGNMENT Course No. GARD-507: Course Title: Remote Sensing -II Total Marks: 30 Note:
Mapping small reservoirs in semi-arid regions using multitemporal SAR: methods and applications
 Mapping small reservoirs in semi-arid regions using multitemporal SAR: methods and applications Donato Amitrano Gerardo Di Martino Antonio Iodice Daniele Riccio Giuseppe Ruello University of Napoli, Italy
Satellite ASTER Global Geoscience Maps
 Satellite ASTER Global Geoscience Maps Michael Abrams Jet Propulsion Laboratory, California Institute of Technology, Pasadena USA (c) 2017 California Institute of Technology. Government sponsorship acknowledged.
World Meterological Organization Polar Space Task Group
 World Meterological Organization Polar Space Task Group Jerry L. Mullins Coordinator, USGS Antarctic, Arctic and Canadian Programs Reston, VA, USA 30 September 2011 1. USGS Landsat Program 11/06 7/07 4/08
Operational systems for SST products. Prof. Chris Merchant University of Reading UK
 Operational systems for SST products Prof. Chris Merchant University of Reading UK Classic Images from ATSR The Gulf Stream ATSR-2 Image, ƛ = 3.7µm Review the steps to get SST using a physical retrieval
Land Surface Temperature Measurements From the Split Window Channels of the NOAA 7 Advanced Very High Resolution Radiometer John C.
 Land Surface Temperature Measurements From the Split Window Channels of the NOAA 7 Advanced Very High Resolution Radiometer John C. Price Published in the Journal of Geophysical Research, 1984 Presented
Asteroids to Agriculture: Carving a Niche in Earth Observation Using Asteroid Prospecting Instruments on an Earth-Orbiting Cubesat Constellation
 SSC16-XI-02 Asteroids to Agriculture: Carving a Niche in Earth Observation Using Asteroid Prospecting Instruments on an Earth-Orbiting Cubesat Constellation Hannah R. Goldberg, Matthew Beasley, Chris Voorhees
Land Use MTRI Documenting Land Use and Land Cover Conditions Synthesis Report
 Colin Brooks, Rick Powell, Laura Bourgeau-Chavez, and Dr. Robert Shuchman Michigan Tech Research Institute (MTRI) Project Introduction Transportation projects require detailed environmental information
USE OF RADIOMETRICS IN SOIL SURVEY
 USE OF RADIOMETRICS IN SOIL SURVEY Brian Tunstall 2003 Abstract The objectives and requirements with soil mapping are summarised. The capacities for different methods to address these objectives and requirements
A Regional Microsatellite Constellation with Electric Propulsion In Support of Tuscan Agriculture
 Berlin, 20 th - 24 th 2015 University of Pisa 10 th IAA Symposium on Small Satellites for Earth Observation Student Conference A Regional Microsatellite Constellation with Electric Propulsion In Support
GEOSC/METEO 597K Kevin Bowley Kaitlin Walsh
 GEOSC/METEO 597K Kevin Bowley Kaitlin Walsh Timeline of Satellites ERS-1 (1991-2000) NSCAT (1996) Envisat (2002) RADARSAT (2007) Seasat (1978) TOPEX/Poseidon (1992-2005) QuikSCAT (1999) Jason-2 (2008)
Related missions and programs for Snowfall and Snow Hydrology of JAXA
 Related missions and programs for Snowfall and Snow Hydrology of JAXA ALOS AVNIR-2 2006/11/05 Shuji Shimizu Japan Aerospace Exploration Agency (JAXA) Earth Observation Research Center (EORC) JAXA Earth
Using MERIS and MODIS for Land Cover Mapping in the Netherlands
 Using MERIS and for Land Cover Mapping in the Netherlands Raul Zurita Milla, Michael Schaepman and Jan Clevers Wageningen University, Centre for Geo-Information, NL Introduction Actual and reliable information
ZRCSAZU. Remote sensing and Earth observation data at ZRC SAZU. dr. Tatjana Veljanovski Atrij ZRC Ljubljana
 ZRCSAZU Remote sensing and Earth observation data at ZRC SAZU dr. Tatjana Veljanovski 2016-06-08 Atrij ZRC Ljubljana Remote Sensing Department Remote Sensing Department 20 years of experience application,
SAR data Sensords and examples
 SAR data Sensords and examples Sar Technical Training for Forest Mapping 2014/2015 Cédric Lardeux Jean-Paul Rudant Pierre-Louis Frison cedric.lardeux@onfinternational.com rudant@univ-mlv.fr frison@univ-mlv.fr
Attention: Jahan Kariyeva. Review of Remote Sensing Methods for Monitoring Wetlands in Northeastern Alberta FINAL REPORT
 Disclaimer The material in this publication does not imply the expression of any opinion on the part of any individual or organization other than the authors. Errors, omissions or inconsistencies in this
Improved sea-ice monitoring for the Baltic Sea Project summary
 Improved sea-ice monitoring for the Baltic Sea Project summary Leif E.B. Eriksson (1), Karin Borenäs (2), Wolfgang Dierking (3), Anders Berg (1) and Per Pemberton (2) (1) Chalmers University of Technology,
JAXA s Contributions to the Climate Change Monitoring
 0 JAXA s Contributions to the Climate Change Monitoring June 7, 2011 Takao Akutsu Planning Manager Japan Aerospace Exploration Agency (JAXA) Japanese Main Activities of Earth Observation 1 GEOSS 10 years
Civil Engineering Journal
 Available online at www.civilejournal.org Civil Engineering Journal Vol. 1, No. 2, December, 2015 Comparative Study of Landsat and Aster Data by Morphometric Analysis Sujit Kumar a*, Tapasi Bhandary b
CGMS Baseline. Sustained contributions to the Global Observing System. Endorsed by CGMS-46 in Bengaluru, June 2018
 CGMS Baseline Sustained contributions to the Global Observing System Best Practices for Achieving User Readiness for New Meteorological Satellites Endorsed by CGMS-46 in Bengaluru, June 2018 CGMS/DOC/18/1028862,
Czech Geological Survey Remote sensing unit
 Czech Geological Survey Remote sensing unit CGS Remote sensing unit Who we are? Part of the Dpt. of Regional geology of crystalline complexes Since 2005 Processing of satellite and airborne data Geoinformation
Satellite Remote Sensing for Ocean
 Satellite Remote Sensing for Ocean August 17, 2017 Masatoshi Kamei RESTEC All rights reserved RESTEC 2015 Contents 1. About RESTEC and Remote Sensing 2. Example of Remote Sensing Technology 3. Remote Sensing
EVALUATION AND MONITORING OF SNOWCOVER WATER RESOURCES IN CARPATHIAN BASINS USING GEOGRAPHIC INFORMATION AND SATELLITE DATA
 EVALUATION AND MONITORING OF SNOWCOVER WATER RESOURCES IN CARPATHIAN BASINS USING GEOGRAPHIC INFORMATION AND SATELLITE DATA Gheorghe Stancalie, Simona Catana, Anisoara Iordache National Institute of Meteorology
indigeo Consultants Pvt Ltd Geophysical Surveys Geological Surveys GIS & Data Solutions Image Processing indigeo Company Profile, Page 1
 indigeo Consultants Pvt Ltd Geophysical Surveys Geological Surveys GIS & Data Solutions Image Processing MM Corner, 3 rd Floor #58, Banaswadi Main Road Bangalore 560033 INDIA Ph: +91 80 41638310 Mob: +91
NEW CGMS BASELINE FOR THE SPACE-BASED GOS. (Submitted by the WMO Secretariat) Summary and Purpose of Document
 Summary and Purpose of Document") WORLD METEOROLOGICAL ORGANIZATION COMMISSION FOR BASIC SYSTEMS OPEN PROGRAMME AREA GROUP ON INTEGRATED OBSERVING SYSTEMS EXPERT TEAM ON SATELLITE SYSTEMS ET-SAT-7/Inf. 2 (12.III.2012) ITEM: 8.1 SEVENTH
WORLD METEOROLOGICAL ORGANIZATION COMMISSION FOR BASIC SYSTEMS OPEN PROGRAMME AREA GROUP ON INTEGRATED OBSERVING SYSTEMS EXPERT TEAM ON SATELLITE SYSTEMS ET-SAT-7/Inf. 2 (12.III.2012) ITEM: 8.1 SEVENTH
Land cover/land use mapping and cha Mongolian plateau using remote sens. Title. Author(s) Bagan, Hasi; Yamagata, Yoshiki. Citation Japan.
 Bagan, Hasi; Yamagata, Yoshiki. Citation Japan.") Title Land cover/land use mapping and cha Mongolian plateau using remote sens Author(s) Bagan, Hasi; Yamagata, Yoshiki International Symposium on "The Imp Citation Region Specific Systems". 6 Nove Japan.
Title Land cover/land use mapping and cha Mongolian plateau using remote sens Author(s) Bagan, Hasi; Yamagata, Yoshiki International Symposium on "The Imp Citation Region Specific Systems". 6 Nove Japan.
C N E S, U M R I R I S A
 M O N I T O R I N G U R B A N A R E A S W I T H S E N T I N E L - 2. APPLICATION TO THE UPDATE OF THE COPERNICUS HIGH RESOLUTION LAYER IMPERVIOUSNESS DEGREE O c t o b e r 2 5 th 2016, Brussels A n t o
Potential and limitations of remote sensing for cadastre and land management
 Potential and limitations of remote sensing for cadastre and land management Potentiel et limites de la télédétection pour les applications foncières Laurent Polidori École Supérieure des Géomètres et
Application of Wavelet Spectrum Analysis to Oil Spill Detection by Using Satellite Observation Data
 PAJ Oil Spill Symposium 2008 Application of Wavelet Spectrum Analysis to Oil Spill Detection by Using Satellite Observation Data February 21, 2008 Tokyo, Japan Masanao Hara Dr., VisionTech Inc. 1. Background
Urban Mapping & Change Detection. Sebastian van der Linden Humboldt-Universität zu Berlin, Germany
 Urban Mapping & Change Detection Sebastian van der Linden Humboldt-Universität zu Berlin, Germany Introduction - The urban millennium Source: United Nations Introduction Text Source: Google Earth Introduction
DLR s TerraSAR-X contributes to international fleet of radar satellites to map the Arctic and Antarctica
 DLR s TerraSAR-X contributes to international fleet of radar satellites to map the Arctic and Antarctica The polar regions play an important role in the Earth system. The snow and ice covered ocean and
Yrd. Doç. Dr. Saygın ABDİKAN Öğretim Yılı Güz Dönemi
 Yabancı Dil III (YDL285) Introduction to Geomatics Yrd. Doç. Dr. Saygın ABDİKAN 2017-2018 Öğretim Yılı Güz Dönemi 1 géomatique Geo (Earth) + informatics Geodesy + Geoinformatics Geomatics: The mathematics
New observations obtained via applying remote sensing methods in geological hazard assessment, Southern Ethiopia
 New observations obtained via applying remote sensing methods in geological hazard assessment, Southern Ethiopia Veronika Kopačková, Jan Mišurec Remote sensing Unit Czech Geological Survey, Klárov 3, Prague
SMAP and SMOS Integrated Soil Moisture Validation. T. J. Jackson USDA ARS
 SMAP and SMOS Integrated Soil Moisture Validation T. J. Jackson USDA ARS Perspective Linkage of SMOS and SMAP soil moisture calibration and validation will have short and long term benefits for both missions.
Introduction of PALSAR and PALSAR Data Application Plan
 Introduction of PALSAR and PALSAR Data Application Plan September 19 th, 2006 Tomonori Deguchi deguchi@ersdac.or.jp Earth Remote Sensing Data Analysis Center (ERSDAC) http://www.ersdac.or.jp Contents 1.
Long-Term Time Series of Water Vapour Total Columns from GOME, SCIAMACHY and GOME-2
 Graphics: ESA Graphics: ESA Graphics: ESA Long-Term Time Series of Water Vapour Total Columns from GOME, SCIAMACHY and GOME-2 S. Noël, S. Mieruch, H. Bovensmann, J. P. Burrows Institute of Environmental
History & Scope of Remote Sensing FOUNDATIONS
 History & Scope of Remote Sensing FOUNDATIONS Lecture Overview Introduction Overview of visual information Power of imagery Definition What is remote sensing? Definition standard for class History of Remote
A1 - Total Land Use by Mining and Milling topographical footprint
 A. LAND-USE A1 - Total Land Use by Mining and Milling topographical footprint Topographical Footprint: The total areal footprint (2-dimensional) used by the mine/mill is an overarching proxy for a variety
REMOTE SENSING KEY!!
 REMOTE SENSING KEY!! This is a really ugly cover page I m sorry. Name Key. Score / 100 Directions: You have 50 minutes to take this test. You may use a cheatsheet (2 pages), a non-graphing calculator,
Sentinel-3 Sea and Land Surface Temperature Radiometer (SLSTR) Mireya Etxaluze (STFC RAL Space)
 Mireya Etxaluze (STFC RAL Space)") Sentinel-3 Sea and Land Surface Temperature Radiometer (SLSTR) Mireya Etxaluze (STFC RAL Space) RAL Space Radiometry Group Dave Smith Mireya Etxaluze, Ed Polehampton, Caroline Cox, Tim Nightingale, Dan
Sentinel-3 Sea and Land Surface Temperature Radiometer (SLSTR) Mireya Etxaluze (STFC RAL Space) RAL Space Radiometry Group Dave Smith Mireya Etxaluze, Ed Polehampton, Caroline Cox, Tim Nightingale, Dan
Module 2.1 Monitoring activity data for forests using remote sensing
 Module 2.1 Monitoring activity data for forests using remote sensing Module developers: Frédéric Achard, European Commission (EC) Joint Research Centre (JRC) Jukka Miettinen, EC JRC Brice Mora, Wageningen
LAND COVER CLASSIFICATION BASED ON SAR DATA IN SOUTHEAST CHINA
 LAND COVER CLASSIFICATION BASED ON SAR DATA IN SOUTHEAST CHINA Mr. Feilong Ling, Dr. Xiaoqin Wang, Mr.Xiaoming Shi Fuzhou University, Level 13, Science Building,No.53 Gongye Rd., 35, Fuzhou, China Email:
Integration & Analysis of EO Data For Exploration in the East Africa Rift
 November 2016 For Exploration in the East Africa Rift Martin Insley Acknowledgements Slide 2 Presentation Outline Application and of EO data within Tullow Oil Brief overview of Remote Sensing data and
Hyperspectral at Leonardo. Ing. Alberto Sarti, CTO Electronic, Defense and Security Sector
 Hyperspectral at Leonardo Ing. Alberto Sarti, CTO Electronic, Defense and Security Sector Leonardo Hyperspectral instruments evolution AVIONIC VIRS SIM.GA 1 SIM.GA 2 SPHYDER
ESRI GIS For Mining Seminar, 10 th August, 2016, Nairobi, Kenya. Spatial DATA Solutions for Mining
 ESRI GIS For Mining Seminar, 10 th August, 2016, Nairobi, Kenya Spatial DATA Solutions for Mining Spatial Data Solutions for Mining Spatial - Data that identifies the geographic location of features &
Lectures 7 and 8: 14, 16 Oct Sea Surface Temperature
 Lectures 7 and 8: 14, 16 Oct 2008 Sea Surface Temperature References: Martin, S., 2004, An Introduction to Ocean Remote Sensing, Cambridge University Press, 454 pp. Chapter 7. Robinson, I. S., 2004, Measuring
Remote Sensing How we know what we know A Brief Tour
 Remote Sensing How we know what we know A Brief Tour Dr. Erik Richard Dr. Jerald Harder LASP Richard 1 Remote Sensing The measurement of physical variables (usually light or sound) from outside of a medium
Remote detection of giant reed invasions in riparian habitats: challenges and opportunities for management planning
 Remote detection of giant reed invasions in riparian habitats: challenges and opportunities for management planning Maria do Rosário Pereira Fernandes Forest Research Centre, University of Lisbon Number
High resolution remotely sensed data and spatial data infrastructure development**
 31 May 2005 English only Eighth United Nations Regional Cartographic Conference for the Americas New York, 27 June-1 July 2005 Item 8 (b) of the provisional agenda* Reports on achievements in geographic
Infrastructure monitoring using SAR interferometry
 Infrastructure monitoring using SAR interferometry Hossein Nahavandchi Roghayeh Shamshiri Norwegian University of Science and Technology (NTNU), Department of Civil and Environmental Engineering Geodesy
URBAN MAPPING AND CHANGE DETECTION
 URBAN MAPPING AND CHANGE DETECTION Sebastian van der Linden with contributions from Akpona Okujeni Humboldt-Unveristät zu Berlin, Germany Introduction Introduction The urban millennium Source: United Nations,