ChIP seq peak calling. Statistical integration between ChIP seq and RNA seq
|
|
|
- Delilah Carson
- 5 years ago
- Views:
Transcription

1 Institute for Computational Biomedicine ChIP seq peak calling Statistical integration between ChIP seq and RNA seq Olivier Elemento, PhD


2 ChIP-seq to map where transcription factors bind DNA Transcription factor of interest Antibody Genome Analyzer II (Illumina)
3 Control: input DNA Genome Analyzer II (Illumina)


4 ACCAATAACCGAGGCTCATGCTAAGGCGTTAGCCACAGATGGAAGTCCGACGGCTTGATCCAGAATGGTGTGTGGATTGCCTTGGAACTGATTAGTGAATTC TGGTTATTGGCTCCGAGTACGATTCCGCAATCGGTGTCTACCTTCAGGCTGCCGAACTAGGTCTTACCACACACCTAACGGAACCTTGACTAATCACTTAAG Average length ~ 250bp
5 25-100bp ACCAATAACCGAGGCTCATGCTAAGGCGTTAGCCACAGATGGAAGTCCGACGGCTTGATCCAGAATGGTGTGTGGATTGCCTTGGAACTGATTAGTGAATTC TGGTTATTGGCTCCGAGTACGATTCCGCAATCGGTGTCTACCTTCAGGCTGCCGAACTAGGTCTTACCACACACCTAACGGAACCTTGACTAATCACTTAAG Average length ~ 250bp
6 25-100bp ACCAATAACCGAGGCTCATGCTAAGGCGTTAGCCACAGATGGAAGTCCGACGGCTTGATCCAGAATGGTGTGTGGATTGCCTTGGAACTGATTAGTGAATTC TGGTTATTGGCTCCGAGTACGATTCCGCAATCGGTGTCTACCTTCAGGCTGCCGAACTAGGTCTTACCACACACCTAACGGAACCTTGACTAATCACTTAAG Average length ~ 250bp
7 BCL6 ChIP-seq Lymphoma cell line (OCI-Ly1) 1 lane for ChIP, 1 for input DNA, 1 for QC 36nt long sequences 30 Million reads Aligned/mapped to hg18 with BWA
8 Read mapping with BWA Illumina Read AAAATACGCGTATTCTCCCAAAACAATATC CCCAAAACAAAAAAATACGCGTATTCTCCCAAAACAATATCTTACAAGATGTAAATATACCCAAGAT Reference Human Genome (hg18)
9 Read mapping with BWA Illumina Read AAAATACGCCTATTCTCCCAAAACAATATC CCCAAAACAAAAAAATACGCGTATTCTCCCAAAACAATATCTTACAAGATGTAAATATACCCAAGAT Reference Human Genome (hg18)
10 Read mapping with BWA Illumina Read AAAATACGCCTATTCTCCCATAACAATATC CCCAAAACAAAAAAATACGCGTATTCTCCCAAAACAATATCTTACAAGATGTAAATATACCCAAGAT Reference Human Genome (hg18)


11 Reads can map to multiple locations/chromosomes Illumina Read 1 Illumina Read 2 Reference Human Genome (hg18)
12 Reads map to one strand or the other Illumina Read 1 Illumina Read 2 hg18
13 011 AGGTCACAAAACAAGTCCTAACAAATTTAAGAGTAT U chr8.fa R DD 245 GTCAGAAAAATCCTTTTTATTATATAAACAATACAT U chr5.fa F DD 15G 20G 45 GTCATCAAACTCCAAGGATTCTGTTTTCAACATACT U chr18.fa R DD 1118 GAAAGTGATTAGCAGATTGTCATTTAATAATTGTCT U chr1.fa F DD 18G 28G 74 GATAAATTTTTTCCTACAATCTTAAATTATTACACA U chr3.fa R DD 10C 28 AAAAATTAAACAATTCTAAAAATATTTTTATCTTAA U chr2.fa R DD 18C 31G 4 GCACATGTCATACTCTTTCTAGCTCTCTTATTTTTC U chr8.fa R DD 015 AAATTAATGTAAAAAATAGGATACTGAATTGTGATA U chr10.fa F DD 30G 26 GTAGTTAACAATAATTTATTTTATACTTCAAAATTC U chrx.fa R DD 7A 702 GTCAGAATTAATTAATCAAAACACCAAATGTACTTC U chr12.fa F DD 003 ATTTTGACTTTATTATTTTTTCTTCAATGTTTTTAA NM GAAAGTACATCAAATACATATTATATACTTTACATA R AATCCATATACATTTCTTTTTAATCATTTCCTCTTT U chr11.fa F DD 20G 330 GTGAGTTTCTTAATCCTGAGTTCTAATTTTATTTCA R ACATTTTATAAATTTTTAATTTCATTTTAATTTATA NM GTTTTTAAAATCAACACTTTTATTATAGAAGTAGCA U chr12.fa R DD 828 GTACTGATGTAAACTTGGTAAAAACATTGACATAAA U chr14.fa F DD 583 GAAGAAAATGACTATGTCAAAATATTATCTCTCAAT U chr5.fa F DD 1653 GTTTTACTGATTTTCTTACTTACTAAACTACCTGTT U chr7.fa F DD 943 AATGATACGGCGACCACCGACAGGTTCAGAGTTCTA NM GAGAATTATTCAGAAGTCAAATCTGTGCTTAGTTTA U chr5.fa R DD 3G 7C 318 GTATGTATCATATATATTTATGTATCATATATATTT R GATTGCTCCATTATTTGTTAAAAACATAGTAAAATA NM ATGAGATCAGTACTTCAAAGAGATATCTGCACTCCC U chr12.fa R DD 178 GTTAGTCCCAATATTCCATTAATCCCAATAAATATA U chr6.fa F DD 15G 19G 972 GAGATAATAATAGCAGTTATGGCATCGAGATAATTT U chr2.fa R DD 341 GTAGAGGGCACACATCACAAACAAGTTTCTGAGAAT R GAATATCCACTTGCAGACTTTACAAACAAATTTTTT R GGCAGATGAAACTTCTATACACTATATTTTAGCCAG U chr13.fa F DD 371 GAAAGAAAAACTATTGAAAAAATAGTTACTTTCCAA U chr1.fa R DD 614 GTGTAGATGATATCGAGGGCATTAGAAGTAAATAGC U chr5.fa F DD 808 GAGAGGAAATAATAAAGATAAAAGTAGAAAAAGTGA U chr1.fa F DD 815 GATAATTATGTTGTTGTAATTATTGTTTGTTTTTTT U chr15.fa R DD 260 GTTGACAATCCAGCTGTCATAGAAACTGACTATTTT U chr12.fa R DD 916 AAAAATTCTCCCAAAACAACAAGATGTAAATATACC U chr3.fa R DD 308 GTTCTTACACTGATATGAAGAAATACCTGAGACTGG U chr2.fa R DD 17 GAGAAACACACATATTTTTGTAAGTGCCATCACATC U chr7.fa R DD 18C 348 GTATTATCTAACACACAAGATGATGTTTGTTTTTAT NM GAGTGTAGAAAATTTTCTGCCCTAAAATATTTGTTA U chr6.fa F DD 13G 729 GTATCCTAAAGTGTATCTTATGTTTTTTCATCTTCT U chr12.fa R DD 9C 64 AATAAAACAAATTCCAATGGCTTAGATTCTACTTAA U chr10.fa R DD 15C 20C 059 AAATGGTCATACTTCCCAAAGCGATCTACAGATTCA U chr3.fa R DD 19C 061 ACATTTCCACATTTCTGTGGAAGCCTCACAATCATT R ATTAATCAACAGCAACATTAATCAACTGAATCAACA U chr2.fa R DD 47 GAATAAATAATCAAAACATATAATACATTTTTTTAT U chr5.fa F DD 32G 731 ATATACACATATATATACATATATATATACACATAT R GAGAAGGAAATGTGTTTTCTAAGTTTCTTTATCTTC U chr4.fa F DD 32G

14

15
16
17 Peak detection Calculate read count at each position (bp) in genome Determine regions (peaks) where read count is greater than expected
18 genome Read count Expected read count T A T T A A T T A T C C C C A T A T A T G A T A T genome Expected read count = total number of reads * extended fragment length / chr length
 =1 x 1 0 x = observed read count λ = expected read count λ x e λ x!")
19 The Poisson distribution Is the observed read count at a given genomic position greater than expected? Frequency P(X x) =1 x 1 0 x = observed read count λ = expected read count λ x e λ x! Read count
20 Is the observed read count at a given genomic position greater than expected? P(X x) =1 x 1 0 x = 10 reads (observed) λ = 0.5 reads (expected) λ x e λ x! genome P(X>=10) = 1.7 x log10 P(X>=10) = The Poisson -log10 P(X>=10) = 9.77
21 Read count Expected read count Expected read count = total number of reads * extended frag len / chr len P c (X x) =1 x 1 0 λ c x e λ c x! Log(p) Threshold peak
22 Non-mappable fraction of the genome We enumerated all 30-mers, counted # occurrences, calculated non-unique fraction of genome chr / (=12%) chr / chr / chr / chr / chr / chr / chr / chr / chr / chr / chr / chr / chrx / chr / chr / chr / chr / chrm 4628/ chr / chr / chr / chr / chr / chry / (=74%)
23 Peak detection Correct for input DNA by looking for peaks in input DNA Merge peaks separated by less than 100bp Output all peaks with length >= 100bp Process 23M reads in <7mins

24

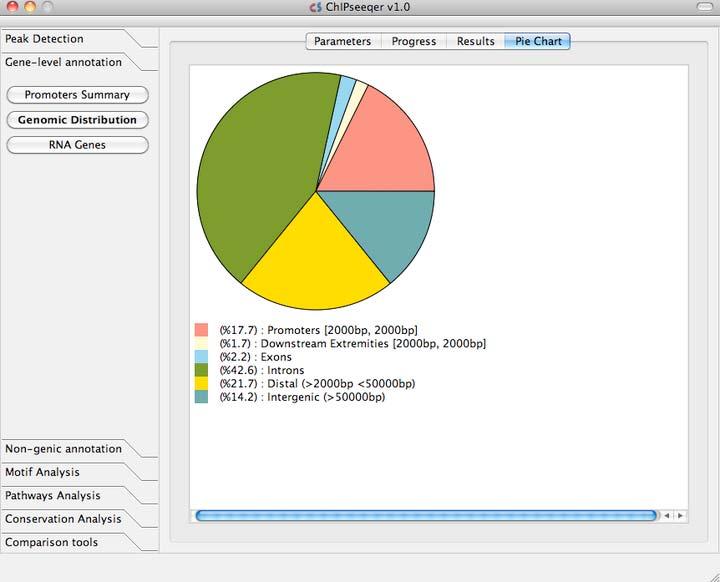

25 Jenny Giannopoulou ChIPseeqer


")
26 ChIP seq in lymphoma cells (LY1 cell line) Yanwen Jiang


27 RNA seq in LY1 cells RPKM RPKM = # reads per kilobase per million reads
28 Modeling the influence of a TF s binding on a promoter h k x TF= i,promoter= j = h k e d k / d 0 Peak height Weight
29 Transcription factors / histone modifications Transcripts GENE BCL6 MTA3 BCOR K4ME1 K4ME3 K79ME2 K79ME3 K79AC... DNAm LY1-RNAseq NM_ NM_ NM_ NM_ NM_ NM_ NM_ NM_ NM_ NM_ NM_ NM_ NM_ NM_ NM_ NM_ NM_ NM_ NM_ NM_ NM_ NM_ NM_ How do you identify transcription factors and histone modifications that frequently work together?
30 Principal Component Analysis H3K4AC H3K4ME3
31 Principal Component Analysis H3K4AC H3K4ME3
32 Principal Component Analysis H3K4AC H3K4ME3
33 Promoter PC1 PC2 PC3 PC4 PC5 PC6 PC7... RNAseq-RPKM NM_ NM_ NM_ NM_ NM_ NM_ NM_ NM_ NM_ NM_ NM_ NM_ NM_ NM_ NM_ NM_ NM_ NM_ NM_ NM_ NM_ NM_ NM_ NM_ NM_ NM_ NM_ NM_ NM_ Model: (~25,000 unique RefSeq promoters) PCs are orthogonal! RPKM i = β 0 + m j =1 β j PC ij
34 Model fitting using ordinary least squares Find ˆ β j that minimize n i=1 (RPKM i ˆ β 0 + m ˆ β j PC ij ) 2 j=1
35 Model assessment R 2 = 1 n ( y ˆ i y i ) 2 / (y i y ) 2 i =1 n i =1 (y = RPKM)


36 7 TF and 8 histone modifications predict 65% of variance in gene expression levels R 2 =0.65, Spearman=0.804
37 Assessing individual coefficients RPKM i = ˆ β 0 + m j=1 ˆ β j PC ij Calculate t-statistic t = ˆ β /se( ˆ β ) j j j Calculate p-value using t-distribution with n-p degrees of freedom P(X t j )
38 attach(m) fit <- lm(log(rpkm+1) ~ PC1 + PC2 + PC3 + PC4 + PC5 + PC6 + PC7 + PC8 + PC9 ) print(summary(fit)) Coefficients: Estimate Std. Error t value Pr(> t ) (Intercept) < 2e-16 *** PC < 2e-16 *** PC < 2e-16 *** PC < 2e-16 *** PC PC < 2e-16 *** PC e-08 *** PC e-06 *** PC e-10 *** PC < 2e-16 *** --- Signif. codes: 0 *** ** 0.01 * Residual standard error: on degrees of freedom (3543 observations deleted due to missingness) Multiple R-squared: , Adjusted R-squared: F-statistic: on 9 and DF, p-value: < 2.2e-16

39
40 BCL6 In silico knockdown 1. Set all BCL6 values to Project new binding data into original PCs 3. Predict RPKMs using original fitted model 4. Compare RPKMs to RPKMs predicted by original binding data and original model
41 Transcription factors / histone modifications Transcripts GENE BCL6 MTA3 BCOR K4ME1 K4ME3 K79ME2 K79ME3 K79AC... DNAm LY1-RNAseq NM_ NM_ NM_ NM_ NM_ NM_ NM_ NM_ NM_ NM_ NM_ NM_ NM_ NM_ NM_ NM_ NM_ NM_ NM_ NM_ NM_ NM_ NM_ RPKM i = β 0 + m j =1 β j PC ij
42 Simulated BCL6 knockdown predicts (correctly) that BCL6 is an obligate repressor No genes are significantly downregulated! Top 250 up regulated genes are enriched with genes with expression higher in NB compared to LY1 (p<0.005)

43 Simulated PU.1 knockdown (activator) rediscovers important PU.1 targets STRING analysis of top 40 down regulated genes + PU.1


44 Do CNVs contribute to the model? RPKM i = β 0 + m j =1 β j PC j + β m+1 CNV i Gene copy number We generated Affymetrix 6.0 SNP array data in LY1 Yanwen Jiang, Huimin Geng
45 Ongoing work Using non negative matrix factorization instead of PCA Integration of DNA looping Integration of post transcriptional regulation (can we improve over 65%?) Experimental validation (knockdowns)
46
47 Can the binding patterns predict what will happen upon sirna knockdown? log(sibcl6/nt ) i = β 0 + m j=1 β j PC ij


48 Ly1 expression sibcl6/nt 24h
49 BCL6 In silico knockdown 1. Set all BCL6 values to Project new binding data into original PCs 3. Predict RPKMs using original fitted model 4. Compare RPKMs to RPKMs predicted by original binding data and original model
50 GENE BCL6 MTA3 BCOR K4ME1 K4ME3 K79ME2 K79ME3 K79AC... DNAm LY1-RNAseq NM_ NM_ NM_ NM_ NM_ NM_ NM_ NM_ NM_ NM_ NM_ NM_ NM_ NM_ NM_ NM_ NM_ NM_ NM_ NM_ NM_ NM_ NM_ (~25,000 unique RefSeq promoters)
51 BCL6 In silico knockdown 1. Set all BCL6 values to Project new binding data into original PCs 3. Predict RPKMs using original fitted model 4. Compare RPKMs to RPKMs predicted by original binding data and original model
Ins?tute for Computa?onal Biomedicine. ChIP- seq. Olivier Elemento, PhD TA: Jenny Giannopoulou, PhD
 Ins?tute for Computa?onal Biomedicine ChIP- seq Olivier Elemento, PhD TA: Jenny Giannopoulou, PhD Plan 1. ChIP- seq 2. Quality Control of ChIP- seq data 3. ChIP- seq Peak detec?on 4. Peak Analysis and
ChIP-seq analysis M. Defrance, C. Herrmann, S. Le Gras, D. Puthier, M. Thomas.Chollier
 ChIP-seq analysis M. Defrance, C. Herrmann, S. Le Gras, D. Puthier, M. Thomas.Chollier Data visualization, quality control, normalization & peak calling Peak annotation Presentation () Practical session
ChIP-seq analysis M. Defrance, C. Herrmann, S. Le Gras, D. Puthier, M. Thomas.Chollier
 ChIP-seq analysis M. Defrance, C. Herrmann, S. Le Gras, D. Puthier, M. Thomas.Chollier Visualization, quality, normalization & peak-calling Presentation (Carl Herrmann) Practical session Peak annotation
Technologie w skali genomowej 2/ Algorytmiczne i statystyczne aspekty sekwencjonowania DNA
 Technologie w skali genomowej 2/ Algorytmiczne i statystyczne aspekty sekwencjonowania DNA Expression analysis for RNA-seq data Ewa Szczurek Instytut Informatyki Uniwersytet Warszawski 1/35 The problem
Genome 541 Gene regulation and epigenomics Lecture 2 Transcription factor binding using functional genomics
 Genome 541 Gene regulation and epigenomics Lecture 2 Transcription factor binding using functional genomics I believe it is helpful to number your slides for easy reference. It's been a while since I took
Gene Regula*on, ChIP- X and DNA Mo*fs. Statistics in Genomics Hongkai Ji
 Gene Regula*on, ChIP- X and DNA Mo*fs Statistics in Genomics Hongkai Ji (hji@jhsph.edu) Genetic information is stored in DNA TCAGTTGGAGCTGCTCCCCCACGGCCTCTCCTCACATTCCACGTCCTGTAGCTCTATGACCTCCACCTTTGAGTCCCTCCTC
Genome 541! Unit 4, lecture 2! Transcription factor binding using functional genomics
 Genome 541 Unit 4, lecture 2 Transcription factor binding using functional genomics Slides vs chalk talk: I m not sure why you chose a chalk talk over ppt. I prefer the latter no issues with readability
Genome Assembly. Sequencing Output. High Throughput Sequencing
 Genome High Throughput Sequencing Sequencing Output Example applications: Sequencing a genome (DNA) Sequencing a transcriptome and gene expression studies (RNA) ChIP (chromatin immunoprecipitation) Example
Complete all warm up questions Focus on operon functioning we will be creating operon models on Monday
 Complete all warm up questions Focus on operon functioning we will be creating operon models on Monday 1. What is the Central Dogma? 2. How does prokaryotic DNA compare to eukaryotic DNA? 3. How is DNA
Genome 541! Unit 4, lecture 3! Genomics assays
 Genome 541! Unit 4, lecture 3! Genomics assays Much easier to follow with slides. Good pace.! Having the slides was really helpful clearer to read and easier to follow the trajectory of the lecture.!!
CHAPTER : Prokaryotic Genetics
 CHAPTER 13.3 13.5: Prokaryotic Genetics 1. Most bacteria are not pathogenic. Identify several important roles they play in the ecosystem and human culture. 2. How do variations arise in bacteria considering
Going Beyond SNPs with Next Genera5on Sequencing Technology Personalized Medicine: Understanding Your Own Genome Fall 2014
 Going Beyond SNPs with Next Genera5on Sequencing Technology 02-223 Personalized Medicine: Understanding Your Own Genome Fall 2014 Next Genera5on Sequencing Technology (NGS) NGS technology Discover more
Linear Regression (1/1/17)
") STA613/CBB540: Statistical methods in computational biology Linear Regression (1/1/17) Lecturer: Barbara Engelhardt Scribe: Ethan Hada 1. Linear regression 1.1. Linear regression basics. Linear regression
STA613/CBB540: Statistical methods in computational biology Linear Regression (1/1/17) Lecturer: Barbara Engelhardt Scribe: Ethan Hada 1. Linear regression 1.1. Linear regression basics. Linear regression
Lecture 18 June 2 nd, Gene Expression Regulation Mutations
 Lecture 18 June 2 nd, 2016 Gene Expression Regulation Mutations From Gene to Protein Central Dogma Replication DNA RNA PROTEIN Transcription Translation RNA Viruses: genome is RNA Reverse Transcriptase
Chapter 15 Active Reading Guide Regulation of Gene Expression
 Name: AP Biology Mr. Croft Chapter 15 Active Reading Guide Regulation of Gene Expression The overview for Chapter 15 introduces the idea that while all cells of an organism have all genes in the genome,
JMJ14-HA. Col. Col. jmj14-1. jmj14-1 JMJ14ΔFYR-HA. Methylene Blue. Methylene Blue
 Fig. S1 JMJ14 JMJ14 JMJ14ΔFYR Methylene Blue Col jmj14-1 JMJ14-HA Methylene Blue Col jmj14-1 JMJ14ΔFYR-HA Fig. S1. The expression level of JMJ14 and truncated JMJ14 with FYR (FYRN + FYRC) domain deletion
Stochastic processes and
 Stochastic processes and Markov chains (part II) Wessel van Wieringen w.n.van.wieringen@vu.nl wieringen@vu nl Department of Epidemiology and Biostatistics, VUmc & Department of Mathematics, VU University
Lecture 7: Simple genetic circuits I
 Lecture 7: Simple genetic circuits I Paul C Bressloff (Fall 2018) 7.1 Transcription and translation In Fig. 20 we show the two main stages in the expression of a single gene according to the central dogma.
Supplementary Figures
 Supplementary Figures Supplementary Figure 1 Principal components analysis (PCA) of all samples analyzed in the discovery phase. Colors represent the phenotype of study populations. a) The first sample
Generalized Linear Models (1/29/13)
") STA613/CBB540: Statistical methods in computational biology Generalized Linear Models (1/29/13) Lecturer: Barbara Engelhardt Scribe: Yangxiaolu Cao When processing discrete data, two commonly used probability
STA613/CBB540: Statistical methods in computational biology Generalized Linear Models (1/29/13) Lecturer: Barbara Engelhardt Scribe: Yangxiaolu Cao When processing discrete data, two commonly used probability
Evolutionary analysis of the well characterized endo16 promoter reveals substantial variation within functional sites
 Evolutionary analysis of the well characterized endo16 promoter reveals substantial variation within functional sites Paper by: James P. Balhoff and Gregory A. Wray Presentation by: Stephanie Lucas Reviewed
SPH 247 Statistical Analysis of Laboratory Data. April 28, 2015 SPH 247 Statistics for Laboratory Data 1
 SPH 247 Statistical Analysis of Laboratory Data April 28, 2015 SPH 247 Statistics for Laboratory Data 1 Outline RNA-Seq for differential expression analysis Statistical methods for RNA-Seq: Structure and
Statistical analysis of genomic binding sites using high-throughput ChIP-seq data
 Statistical analysis of genomic binding sites using high-throughput ChIP-seq data Ibrahim Ali H Nafisah Department of Statistics University of Leeds Submitted in accordance with the requirments for the
Statistical Inferences for Isoform Expression in RNA-Seq
 Statistical Inferences for Isoform Expression in RNA-Seq Hui Jiang and Wing Hung Wong February 25, 2009 Abstract The development of RNA sequencing (RNA-Seq) makes it possible for us to measure transcription
Introduction to Bioinformatics
 CSCI8980: Applied Machine Learning in Computational Biology Introduction to Bioinformatics Rui Kuang Department of Computer Science and Engineering University of Minnesota kuang@cs.umn.edu History of Bioinformatics
Controlling Gene Expression
 Controlling Gene Expression Control Mechanisms Gene regulation involves turning on or off specific genes as required by the cell Determine when to make more proteins and when to stop making more Housekeeping
RNASeq Differential Expression
 12/06/2014 RNASeq Differential Expression Le Corguillé v1.01 1 Introduction RNASeq No previous genomic sequence information is needed In RNA-seq the expression signal of a transcript is limited by the
BIOINFORMATICS ORIGINAL PAPER
 BIOINFORMATICS ORIGINAL PAPER Vol. 25 no. 8 29, pages 126 132 doi:1.193/bioinformatics/btp113 Gene expression Statistical inferences for isoform expression in RNA-Seq Hui Jiang 1 and Wing Hung Wong 2,
MODEL-BASED APPROACHES FOR THE DETECTION OF BIOLOGICALLY ACTIVE GENOMIC REGIONS FROM NEXT GENERATION SEQUENCING DATA. Naim Rashid
 MODEL-BASED APPROACHES FOR THE DETECTION OF BIOLOGICALLY ACTIVE GENOMIC REGIONS FROM NEXT GENERATION SEQUENCING DATA Naim Rashid A dissertation submitted to the faculty of the University of North Carolina
Measuring TF-DNA interactions
 Measuring TF-DNA interactions How is Biological Complexity Achieved? Mediated by Transcription Factors (TFs) 2 Regulation of Gene Expression by Transcription Factors TF trans-acting factors TF TF TF TF
Biology. Biology. Slide 1 of 26. End Show. Copyright Pearson Prentice Hall
 Biology Biology 1 of 26 Fruit fly chromosome 12-5 Gene Regulation Mouse chromosomes Fruit fly embryo Mouse embryo Adult fruit fly Adult mouse 2 of 26 Gene Regulation: An Example Gene Regulation: An Example
Package NarrowPeaks. September 24, 2012
 Package NarrowPeaks September 24, 2012 Version 1.0.1 Date 2012-03-15 Type Package Title Functional Principal Component Analysis to Narrow Down Transcription Factor Binding Site Candidates Author Pedro
Package ChIPtest. July 20, 2016
 Type Package Package ChIPtest July 20, 2016 Title Nonparametric Methods for Identifying Differential Enrichment Regions with ChIP-Seq Data Version 1.0 Date 2017-07-07 Author Vicky Qian Wu ; Kyoung-Jae
Our typical RNA quantification pipeline
 RNA-Seq primer Our typical RNA quantification pipeline Upload your sequence data (fastq) Align to the ribosome (Bow>e) Align remaining reads to genome (TopHat) or transcriptome (RSEM) Make report of quality
Exhaustive search. CS 466 Saurabh Sinha
 Exhaustive search CS 466 Saurabh Sinha Agenda Two different problems Restriction mapping Motif finding Common theme: exhaustive search of solution space Reading: Chapter 4. Restriction Mapping Restriction
Clustering and Network
 Clustering and Network Jing-Dong Jackie Han jdhan@picb.ac.cn http://www.picb.ac.cn/~jdhan Copy Right: Jing-Dong Jackie Han What is clustering? A way of grouping together data samples that are similar in
Genomics and bioinformatics summary. Finding genes -- computer searches
 Genomics and bioinformatics summary 1. Gene finding: computer searches, cdnas, ESTs, 2. Microarrays 3. Use BLAST to find homologous sequences 4. Multiple sequence alignments (MSAs) 5. Trees quantify sequence
Prokaryotic Regulation
 Prokaryotic Regulation Control of transcription initiation can be: Positive control increases transcription when activators bind DNA Negative control reduces transcription when repressors bind to DNA regulatory
David M. Rocke Division of Biostatistics and Department of Biomedical Engineering University of California, Davis
 David M. Rocke Division of Biostatistics and Department of Biomedical Engineering University of California, Davis March 18, 2016 UVA Seminar RNA Seq 1 RNA Seq Gene expression is the transcription of the
Bias in RNA sequencing and what to do about it
 Bias in RNA sequencing and what to do about it Walter L. (Larry) Ruzzo Computer Science and Engineering Genome Sciences University of Washington Fred Hutchinson Cancer Research Center Seattle, WA, USA
12-5 Gene Regulation
 12-5 Gene Regulation Fruit fly chromosome 12-5 Gene Regulation Mouse chromosomes Fruit fly embryo Mouse embryo Adult fruit fly Adult mouse 1 of 26 12-5 Gene Regulation Gene Regulation: An Example Gene
Analyses biostatistiques de données RNA-seq
 Analyses biostatistiques de données RNA-seq Ignacio Gonzàlez, Annick Moisan & Nathalie Villa-Vialaneix prenom.nom@toulouse.inra.fr Toulouse, 18/19 mai 2017 IG, AM, NV 2 (INRA) Biostatistique RNA-seq Toulouse,
13.4 Gene Regulation and Expression
 13.4 Gene Regulation and Expression Lesson Objectives Describe gene regulation in prokaryotes. Explain how most eukaryotic genes are regulated. Relate gene regulation to development in multicellular organisms.
REVIEW SESSION. Wednesday, September 15 5:30 PM SHANTZ 242 E
 REVIEW SESSION Wednesday, September 15 5:30 PM SHANTZ 242 E Gene Regulation Gene Regulation Gene expression can be turned on, turned off, turned up or turned down! For example, as test time approaches,
Regulation of Transcription in Eukaryotes. Nelson Saibo
 Regulation of Transcription in Eukaryotes Nelson Saibo saibo@itqb.unl.pt In eukaryotes gene expression is regulated at different levels 1 - Transcription 2 Post-transcriptional modifications 3 RNA transport
Alignment. Peak Detection
 ChIP seq ChIP Seq Hongkai Ji et al. Nature Biotechnology 26: 1293-1300. 2008 ChIP Seq Analysis Alignment Peak Detection Annotation Visualization Sequence Analysis Motif Analysis Alignment ELAND Bowtie
Optimal State Estimation for Boolean Dynamical Systems using a Boolean Kalman Smoother
 Optimal State Estimation for Boolean Dynamical Systems using a Boolean Kalman Smoother Mahdi Imani and Ulisses Braga-Neto Department of Electrical and Computer Engineering Texas A&M University College
Chapter 3 Class Notes Word Distributions and Occurrences
 Chapter 3 Class Notes Word Distributions and Occurrences 3.1. The Biological Problem: restriction endonucleases provide[s] the means for precisely and reproducibly cutting the DNA into fragments of manageable
Introduction to de novo RNA-seq assembly
 Introduction to de novo RNA-seq assembly Introduction Ideal day for a molecular biologist Ideal Sequencer Any type of biological material Genetic material with high quality and yield Cutting-Edge Technologies
Supplemental Information
 Supplemental Information Combinatorial Readout of Unmodified H3R2 and Acetylated H3K14 by the Tandem PHD Finger of MOZ Reveals a Regulatory Mechanism for HOXA9 Transcription Yu Qiu 1, Lei Liu 1, Chen Zhao
MACFP: Maximal Approximate Consecutive Frequent Pattern Mining under Edit Distance
 MACFP: Maximal Approximate Consecutive Frequent Pattern Mining under Edit Distance Jingbo Shang, Jian Peng, Jiawei Han University of Illinois, Urbana-Champaign May 6, 2016 Presented by Jingbo Shang 2 Outline
Biostatistics for physicists fall Correlation Linear regression Analysis of variance
 Biostatistics for physicists fall 2015 Correlation Linear regression Analysis of variance Correlation Example: Antibody level on 38 newborns and their mothers There is a positive correlation in antibody
Unit-free and robust detection of differential expression from RNA-Seq data
 Unit-free and robust detection of differential expression from RNA-Seq data arxiv:405.4538v [stat.me] 8 May 204 Hui Jiang,2,* Department of Biostatistics, University of Michigan 2 Center for Computational
DEXSeq paper discussion
 DEXSeq paper discussion L Collado-Torres December 10th, 2012 1 / 23 1 Background 2 DEXSeq paper 3 Results 2 / 23 Gene Expression 1 Background 1 Source: http://www.ncbi.nlm.nih.gov/projects/genome/probe/doc/applexpression.shtml
Exam: high-dimensional data analysis February 28, 2014
 Exam: high-dimensional data analysis February 28, 2014 Instructions: - Write clearly. Scribbles will not be deciphered. - Answer each main question (not the subquestions) on a separate piece of paper.
INTEGRATING EPIGENETIC PRIORS FOR IMPROVING COMPUTATIONAL IDENTIFICATION OF TRANSCRIPTION FACTOR BINDING SITES AFFAN SHOUKAT
 INTEGRATING EPIGENETIC PRIORS FOR IMPROVING COMPUTATIONAL IDENTIFICATION OF TRANSCRIPTION FACTOR BINDING SITES AFFAN SHOUKAT A THESIS SUBMITTED TO THE FACULTY OF GRADUATE STUDIES IN PARTIAL FULFILMENT
Name: SBI 4U. Gene Expression Quiz. Overall Expectation:
 Gene Expression Quiz Overall Expectation: - Demonstrate an understanding of concepts related to molecular genetics, and how genetic modification is applied in industry and agriculture Specific Expectation(s):
CS-E5880 Modeling biological networks Gene regulatory networks
 CS-E5880 Modeling biological networks Gene regulatory networks Jukka Intosalmi (based on slides by Harri Lähdesmäki) Department of Computer Science Aalto University January 12, 2018 Outline Modeling gene
Multivariate point process models
 Faculty of Science Multivariate point process models Niels Richard Hansen Department of Mathematical Sciences January 8, 200 Slide /20 Ideas and outline General aim: To build and implement a flexible (non-parametric),
Multiple comparison procedures
 Multiple comparison procedures Cavan Reilly October 5, 2012 Table of contents The null restricted bootstrap The bootstrap Effective number of tests Free step-down resampling While there are functions in
Bacterial Genetics & Operons
 Bacterial Genetics & Operons The Bacterial Genome Because bacteria have simple genomes, they are used most often in molecular genetics studies Most of what we know about bacterial genetics comes from the
GLOBEX Bioinformatics (Summer 2015) Genetic networks and gene expression data
 Genetic networks and gene expression data") GLOBEX Bioinformatics (Summer 2015) Genetic networks and gene expression data 1 Gene Networks Definition: A gene network is a set of molecular components, such as genes and proteins, and interactions between
GLOBEX Bioinformatics (Summer 2015) Genetic networks and gene expression data 1 Gene Networks Definition: A gene network is a set of molecular components, such as genes and proteins, and interactions between
Genetic transcription and regulation
 Genetic transcription and regulation Central dogma of biology DNA codes for DNA DNA codes for RNA RNA codes for proteins not surprisingly, many points for regulation of the process https://www.youtube.com/
Control of Gene Expression in Prokaryotes
 Why? Control of Expression in Prokaryotes How do prokaryotes use operons to control gene expression? Houses usually have a light source in every room, but it would be a waste of energy to leave every light
RNAseq Applications in Genome Studies. Alexander Kanapin, PhD Wellcome Trust Centre for Human Genetics, University of Oxford
 RNAseq Applications in Genome Studies Alexander Kanapin, PhD Wellcome Trust Centre for Human Genetics, University of Oxford RNAseq Protocols } Next generation sequencing protocol } cdna, not RNA sequencing
DEGseq: an R package for identifying differentially expressed genes from RNA-seq data
 DEGseq: an R package for identifying differentially expressed genes from RNA-seq data Likun Wang Zhixing Feng i Wang iaowo Wang * and uegong Zhang * MOE Key Laboratory of Bioinformatics and Bioinformatics
Written Exam 15 December Course name: Introduction to Systems Biology Course no
 Technical University of Denmark Written Exam 15 December 2008 Course name: Introduction to Systems Biology Course no. 27041 Aids allowed: Open book exam Provide your answers and calculations on separate
Transcrip:on factor binding mo:fs
 Transcrip:on factor binding mo:fs BMMB- 597D Lecture 29 Shaun Mahony Transcrip.on factor binding sites Short: Typically between 6 20bp long Degenerate: TFs have favorite binding sequences but don t require
From transcriptome to epigenome, and back? Mattia Pelizzola Center for Genomic Science Istituto Italiano di Tecnologia (IIT), Milano
, Milano") From transcriptome to epigenome, and back? Mattia Pelizzola Center for Genomic Science Istituto Italiano di Tecnologia (IIT), Milano m6a epitranscriptome m6a dynamics synthesis processing degradation m5c
From transcriptome to epigenome, and back? Mattia Pelizzola Center for Genomic Science Istituto Italiano di Tecnologia (IIT), Milano m6a epitranscriptome m6a dynamics synthesis processing degradation m5c
Topic 4 - #14 The Lactose Operon
 Topic 4 - #14 The Lactose Operon The Lactose Operon The lactose operon is an operon which is responsible for the transport and metabolism of the sugar lactose in E. coli. - Lactose is one of many organic
Sequence analysis and comparison
 The aim with sequence identification: Sequence analysis and comparison Marjolein Thunnissen Lund September 2012 Is there any known protein sequence that is homologous to mine? Are there any other species
Newly made RNA is called primary transcript and is modified in three ways before leaving the nucleus:
 m Eukaryotic mrna processing Newly made RNA is called primary transcript and is modified in three ways before leaving the nucleus: Cap structure a modified guanine base is added to the 5 end. Poly-A tail
L3.1: Circuits: Introduction to Transcription Networks. Cellular Design Principles Prof. Jenna Rickus
 L3.1: Circuits: Introduction to Transcription Networks Cellular Design Principles Prof. Jenna Rickus In this lecture Cognitive problem of the Cell Introduce transcription networks Key processing network
10-810: Advanced Algorithms and Models for Computational Biology. microrna and Whole Genome Comparison
 10-810: Advanced Algorithms and Models for Computational Biology microrna and Whole Genome Comparison Central Dogma: 90s Transcription factors DNA transcription mrna translation Proteins Central Dogma:
Linear Regression. In this lecture we will study a particular type of regression model: the linear regression model
 1 Linear Regression 2 Linear Regression In this lecture we will study a particular type of regression model: the linear regression model We will first consider the case of the model with one predictor
Chapter 9 DNA recognition by eukaryotic transcription factors
 Chapter 9 DNA recognition by eukaryotic transcription factors TRANSCRIPTION 101 Eukaryotic RNA polymerases RNA polymerase RNA polymerase I RNA polymerase II RNA polymerase III RNA polymerase IV Function
Lecture 10. Factorial experiments (2-way ANOVA etc)
") Lecture 10. Factorial experiments (2-way ANOVA etc) Jesper Rydén Matematiska institutionen, Uppsala universitet jesper@math.uu.se Regression and Analysis of Variance autumn 2014 A factorial experiment
Lecture 10. Factorial experiments (2-way ANOVA etc) Jesper Rydén Matematiska institutionen, Uppsala universitet jesper@math.uu.se Regression and Analysis of Variance autumn 2014 A factorial experiment
The Eukaryotic Genome and Its Expression. The Eukaryotic Genome and Its Expression. A. The Eukaryotic Genome. Lecture Series 11
 The Eukaryotic Genome and Its Expression Lecture Series 11 The Eukaryotic Genome and Its Expression A. The Eukaryotic Genome B. Repetitive Sequences (rem: teleomeres) C. The Structures of Protein-Coding
Outline for today. Two-way analysis of variance with random effects
 Outline for today Two-way analysis of variance with random effects Rasmus Waagepetersen Department of Mathematics Aalborg University Denmark Two-way ANOVA using orthogonal projections March 4, 2018 1 /
Slide 1 / 7. Free Response
 Slide 1 / 7 Free Response Slide 2 / 7 Slide 3 / 7 1 The above diagrams illustrate the experiments carried out by Griffith and Hershey and Chaserespectively. Describe the hypothesis or conclusion that each
Exercise 2 SISG Association Mapping
 Exercise 2 SISG Association Mapping Load the bpdata.csv data file into your R session. LHON.txt data file into your R session. Can read the data directly from the website if your computer is connected
Control of Gene Expression
 Control of Gene Expression Mechanisms of Gene Control Gene Control in Eukaryotes Master Genes Gene Control In Prokaryotes Epigenetics Gene Expression The overall process by which information flows from
Supplementary Information. Characteristics of Long Non-coding RNAs in the Brown Norway Rat and. Alterations in the Dahl Salt-Sensitive Rat
 Supplementary Information Characteristics of Long Non-coding RNAs in the Brown Norway Rat and Alterations in the Dahl Salt-Sensitive Rat Feng Wang 1,2,3,*, Liping Li 5,*, Haiming Xu 5, Yong Liu 2,3, Chun
Normalization and differential analysis of RNA-seq data
 Normalization and differential analysis of RNA-seq data Nathalie Villa-Vialaneix INRA, Toulouse, MIAT (Mathématiques et Informatique Appliquées de Toulouse) nathalie.villa@toulouse.inra.fr http://www.nathalievilla.org
Statistics for Differential Expression in Sequencing Studies. Naomi Altman
 Statistics for Differential Expression in Sequencing Studies Naomi Altman naomi@stat.psu.edu Outline Preliminaries what you need to do before the DE analysis Stat Background what you need to know to understand
Geert Geeven. April 14, 2010
 iction of Gene Regulatory Interactions NDNS+ Workshop April 14, 2010 Today s talk - Outline Outline Biological Background Construction of Predictors The main aim of my project is to better understand the
(Lys), resulting in translation of a polypeptide without the Lys amino acid. resulting in translation of a polypeptide without the Lys amino acid.
, resulting in translation of a polypeptide without the Lys amino acid. resulting in translation of a polypeptide without the Lys amino acid.") 1. A change that makes a polypeptide defective has been discovered in its amino acid sequence. The normal and defective amino acid sequences are shown below. Researchers are attempting to reproduce the
1. A change that makes a polypeptide defective has been discovered in its amino acid sequence. The normal and defective amino acid sequences are shown below. Researchers are attempting to reproduce the
Annotation of Plant Genomes using RNA-seq. Matteo Pellegrini (UCLA) In collaboration with Sabeeha Merchant (UCLA)
 In collaboration with Sabeeha Merchant (UCLA)") Annotation of Plant Genomes using RNA-seq Matteo Pellegrini (UCLA) In collaboration with Sabeeha Merchant (UCLA) inuscu1-35bp 5 _ 0 _ 5 _ What is Annotation inuscu2-75bp luscu1-75bp 0 _ 5 _ Reconstruction
Annotation of Plant Genomes using RNA-seq Matteo Pellegrini (UCLA) In collaboration with Sabeeha Merchant (UCLA) inuscu1-35bp 5 _ 0 _ 5 _ What is Annotation inuscu2-75bp luscu1-75bp 0 _ 5 _ Reconstruction
Three types of RNA polymerase in eukaryotic nuclei
 Three types of RNA polymerase in eukaryotic nuclei Type Location RNA synthesized Effect of α-amanitin I Nucleolus Pre-rRNA for 18,.8 and 8S rrnas Insensitive II Nucleoplasm Pre-mRNA, some snrnas Sensitive
Molecular Biology of the Cell
 Alberts Johnson Lewis Raff Roberts Walter Molecular Biology of the Cell Fifth Edition Chapter 7 Control of Gene Expression Copyright Garland Science 2008 A neuron and a lymphocyte share the same genome
The Research Plan. Functional Genomics Research Stream. Transcription Factors. Tuning In Is A Good Idea
 Functional Genomics Research Stream The Research Plan Tuning In Is A Good Idea Research Meeting: March 23, 2010 The Road to Publication Transcription Factors Protein that binds specific DNA sequences controlling
Ion Torrent. The chip is the machine
 Ion Torrent Introduction The Ion Personal Genome Machine [PGM] is simple, more costeffective, and more scalable than any other sequencing technology. Founded in 2007 by Jonathan Rothberg. Part of Life
Chapter 7: Regulatory Networks
 Chapter 7: Regulatory Networks 7.2 Analyzing Regulation Prof. Yechiam Yemini (YY) Computer Science Department Columbia University The Challenge How do we discover regulatory mechanisms? Complexity: hundreds
Consider fitting a model using ordinary least squares (OLS) regression:
 regression:") Example 1: Mating Success of African Elephants In this study, 41 male African elephants were followed over a period of 8 years. The age of the elephant at the beginning of the study and the number of successful
Example 1: Mating Success of African Elephants In this study, 41 male African elephants were followed over a period of 8 years. The age of the elephant at the beginning of the study and the number of successful
Matrix-based pattern discovery algorithms
 Regulatory Sequence Analysis Matrix-based pattern discovery algorithms Jacques.van.Helden@ulb.ac.be Université Libre de Bruxelles, Belgique Laboratoire de Bioinformatique des Génomes et des Réseaux (BiGRe)
GCD3033:Cell Biology. Transcription
 Transcription Transcription: DNA to RNA A) production of complementary strand of DNA B) RNA types C) transcription start/stop signals D) Initiation of eukaryotic gene expression E) transcription factors
Inferring Protein-Signaling Networks
 Inferring Protein-Signaling Networks Lectures 14 Nov 14, 2011 CSE 527 Computational Biology, Fall 2011 Instructor: Su-In Lee TA: Christopher Miles Monday & Wednesday 12:00-1:20 Johnson Hall (JHN) 022 1
Bi 1x Spring 2014: LacI Titration
 Bi 1x Spring 2014: LacI Titration 1 Overview In this experiment, you will measure the effect of various mutated LacI repressor ribosome binding sites in an E. coli cell by measuring the expression of a
Appendix S1. Alternative derivations of Weibull PDF and. and data testing
 Appendix S1. Alternative derivations of Weibull PDF and CDF for energies E and data testing General assumptions A methylation change at a genomic region has an associated amount of information I processed
Is inversion symmetry of chromosomes a law of nature?
 Is inversion symmetry of chromosomes a law of nature? David Horn TAU Safra bioinformatics retreat, 28/6/2018 Lecture based on Inversion symmetry of DNA k-mer counts: validity and deviations. Shporer S,