Mapping Interdisciplinary Research Domains
|
|
|
- Nelson Barker
- 5 years ago
- Views:
Transcription


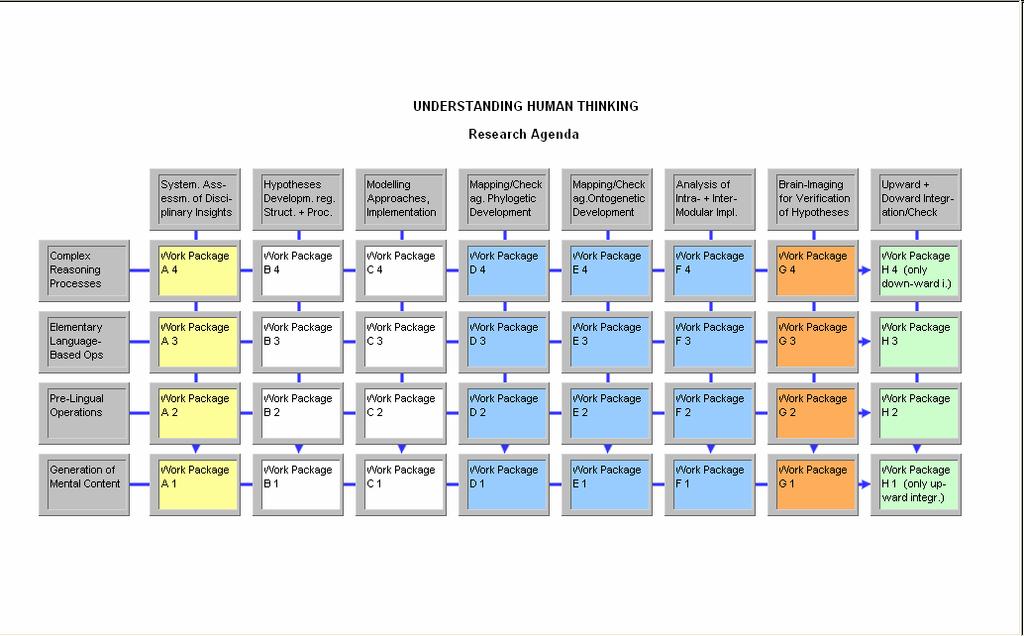
1 Mapping Interdisciplinary Research Domains Katy Börner School of Library and Information Science Presentation at the Parmenides Center for the Study of Thinking, Island of Elba, Italy June 26 th, 2004 Overview Mapping Scientific Domains Why? Maps of Scientific Domains Samples Mapping Scientific Domains How? Related Research Projects Infrastructure 1
2 Mapping Scientific Domains Why? To answer questions such as: What are the major research areas, experts, institutions, regions, nations, grants, publications, journals in xx research? Which areas are most insular? What are the main connections for each area? What is the relative speed of areas? Which areas are the most dynamic/static? What new research areas are evolving? Impact of xx research on other fields? How does funding influence the number and quality of publications? Answers are needed by funding agencies, companies, and researchers. Maps of Scientific Domains 2

 Direct")


3 Historiograph of DNA Development (Garfield, Sher, & Torpie, 1964) Direct or strongly implied citation Indirect citation Visualizing Science by Citation Mapping (Small, 1999) 3

 4")
4 Co-author Networks (Newman, 2001) 4
5 Mapping Scientific Domains Why Visuals? Information Visualization is a process of transforming data and information that are not inherently spatial, into a visual form allowing the user to observe and understand the information. (Source: Gershon and Eick, First Symposium on Information Visualization) Rooted in geography, scientific visualization. Not even 15 years old. Growing fast. in a minute (Ware, 2000). Far reaching (IR, WWW, DL, HCI). Tremendous potential. Humans can detect a single dark pixel in a 500 x 500 array of white pixels in less than a second. This screen can be replaced every second by another, enabling a search of 15 million pixels Also, people have a truly remarkable ability to recall pictorial images. In one study, Standing, Conezio, & Haber (1970) showed S's 2560 pictures, each for 10 seconds over 7 hours, in a 4-day period. Afterwards, S's were asked to classify pictures presented at a rate of 16 pictures/second and they achieved better than 90% accuracy. Mapping Scientific Domains How? Börner, Katy, Chen, Chaomei, and Boyack, Kevin. (2003) Visualizing Knowledge Domains. In Blaise Cronin (Ed.), Annual Review of Information Science & Technology, Volume 37, Medford, NJ: Information Today, Inc./American Society for Information Science and Technology, chapter 5, pp
6 Review Paper: Visualizing Knowledge Domains Review Paper: Visualizing Knowledge Domains 6
7 SEARCH TERM USED Number of Topic Citation Analysis: matching articles citation analysis 596 cocitation OR co-citation 177 co-occurrence AND (term OR word) 77 co-term OR co-word 52 science map[ping] OR mapping science OR map[ping] of science 32 Topic Semantics: semantic analysis OR semantic index OR semantic map 331 Topic Bibliometrics: bibliometric 818 scientometric 327 Topic Visualization: data visualization OR visualization of data 275 information visualization OR visualization of information 113 scientific visualization 268 ARIST Data Set Retrieved from Science Citation Index (SCI) and Social Science Citation Index (SSCI). The 2764 unique articles match citation analysis, semantics, bibliometrics, visualization related terms in titles, abstracts, and terms for the years 1977-July 27, Numbers of articles in the ARIST data set by year with terms (ISI keywords) or abstracts. 7
8 Number of articles by journal in the ARIST set (10 or more articles per journal) Citation counts dropped throughout the 90s. Most recent articles are cited infrequently due to their young age. Figure shows dramatic increase in publishing in citation analysis and bibliometrics starting in the late 80s Katy and Börner: the Mapping birth Interdisciplinary of IV around Research the Domains. same Parmenides time. Center for the Study of Thinking, Island of Elba, Italy, June 16th,
9 The Importance of Good Data It is extremely important to choose an appropriate data source for retrieval, one whose data are likely to provide answers to the questions one wishes to answer using domain visualization. Limitations of the ARIST Data Set No abstracts or terms prior to Terms are available for only 71%. Abstracts are available for 81% of the articles published since Limited book, journal, conference coverage. No patents, policy changes, media coverage, Nobel prices, quality of graduate programs, Three different kinds of visualizations: 1. GSA/StarWalker use Principal Component Analysis to break down domain into components. 2. ET-Maps and Cartographic Self Organizing Maps display overall domain structure as adjacent regions. 3. VxInsight uses a modified Force Directed Placement algorithm named VxOrd to display a data landscape. The different visualizations provide different views of the domain and enable a comparison of algorithms. 9
 Visualize and display citation impact factor atop the intellectual groupings.")
10 (1) GSA/StarWalker Author co-citation analysis Document co-citation analysis Procedure: Select a set of highly cited authors/documents (at least 10 citations). Compute co-citation frequencies. Apply Pathfinder Network Scaling to determine interconnectivity structure. Apply factor analysis to define intellectual groupings (e.g. mapping science, social studies of science, bibliometrics) Visualize and display citation impact factor atop the intellectual groupings. The Author Co-citation Map ( ) consists of 380 authors. The map is dominated by the largest specialty of citation indexing. No strong concentration of other specialties are found, which implies the diversity of the domain. Color code: red - mapping science green social studies of science Blue bibliometrics The three factors cummulatively explain 63% of the variance 10


11 Landscape View of Author Co-citation Map The height of a citation bar indicates the number of citations for the correspondent author. The spectrum of colors on each citation shows the time when citations were made. Authors with more than 50 citations are displayed with semi-transparent labels. The Document Co-citation Analysis Map The height of a bar represents the number of citations to a publication. Labels indicate articles in clusters, for example, Small73 for an article of Small in Multiple publications within the same year are not distinguished at this level. For example, Small73 includes all Small s publications in
 ET Map of ARIST Data Set by Bin Zhu and Hsinchun Chen Trained 10x 10 nodes using ID/keyword data of the ARIST")
12 The Document Co-citation Analysis Map Top-down view. Hand labeling of major clusters. Color code: red - mapping science green social studies of science Blue bibliometrics (2a) ET Map of ARIST Data Set by Bin Zhu and Hsinchun Chen Trained 10x 10 nodes using ID/keyword data of the ARIST data set. After training, each node is associated with a list of documents that are semantically similar to each other. Each document list is labeled by the most frequently occurring keyword Spatial proximity on the map indicates semantic proximity. 12


13 The size of the subject area is not necessarily related to the number of documents in an ET-map, but rather denotes the amount of space between areas based on the number of nodes used to generate the map. 13

14 (2b) SOM Map of ARIST Data by Andre Skupin SOM are used to generate domain visualizations in cartographic fashion. 40 x 55 node SOM was trained based on ID/keyword list of ARIST data set. ArcGIS is used to generate the visualization. Dominance of clusters corresponds to number of articles it contains. Higher elevation i.e., percentage indicates a very organized, focused, and coherent portion of the information space. Labels are automatically assigned based on highly frequent keywords and are drawn within ArcGIS. SOM Map of ARIST Data by Andre Skupin 14

15 (3) VxInsight, Sandia National Labs Next slides show: VxInsight citation maps of ARIST data for four different time segments. VxInsight co-term and LSA maps of ARIST data. VxInsight co-classification map of ARIST data. Comparison of maps. Dot color legend WHITE: citation analysis, GREEN: bibliometrics, BLUE: semantics, MAGENTA: visualization. VxInsight Interface 15
16 1. VxInsight citation maps of ARIST data for four different time segments. A citation-based map using direct and co-citation linkages after the combined linkage method of Small (1997) using a direct:cocitation weighting factor of 20:1. Shows growth of different areas Dot color legend WHITE: citation analysis, GREEN: bibliometrics, BLUE: semantics, MAGENTA: visualization. A: bibliometrics B: visualization C: semantic analysis D: citation analysis, bibliometrics, visualization are mixed 16

17 2. VxInsight co-term and LSA maps of ARIST data Co-term map is based on a cosine similarity using ISI keywords. LSA was applied over title words to generate a document-by-document similarity matrix. Only similarity values > 0.9 were used in VxOrd FDP to generate the map. Dot color legend WHITE: citation analysis, GREEN: bibliometrics, BLUE: semantics, MAGENTA: visualization. 3. VxInsight co-classification map of ARIST data based a cosine similarity from the ISI journal classifications for each article. Dot color legend WHITE: citation analysis, GREEN: bibliometrics, BLUE: semantics, MAGENTA: visualization. 17
18 A - dominated by information science & library science B - planning and development journals C - general medicine D - neuroscience-related journals 4. VxInsight: Comparison of Maps A: Cartographic-SOM B: ET-Map C: Co-term D: LSA Dot color legend WHITE: citation analysis GREEN: bibliometrics, BLUE: semantics MAGENTA: visualization. 18


19 Obvious visual differences between layouts. SOMs tend to fill space more uniformly. Citation analysis (yellow) and bibliometrics (green) are always found together. Visualization (magenta) and semantics (blue) are mostly by themselves. Strong co-term linkages based on cosine similarity for the three term-based document maps. 19
20 Maps show How research on Visualizing Knowledge Domains grows out of semantic analysis/indexing/mapping, citation analysis, bibliometrics, and visualization. That there is interaction between the groups of researchers and their literature in citation analysis and bibliometrics while visualization and semantics are mostly by themselves. Summary Analysis and layout comparisons do not show that any one type of similarity method and layout are better than others for producing domain visualizations. Trade-offs are involved and researcher should use the combination of similarity and layout techniques that are likely to aid in answering the questions at hand. We encourage researchers and practitioners to broaden their horizons and expand the suite of methods that they use, to the benefit of all who read and rely upon their work. Research Projects 20


21 Indicator-Assisted Evaluation and Funding of Research Visualizing the influence of grants on the number and citation counts of research papers (Boyack & Börner, 2003) Mapping Medline Papers, Genes, and Proteins Related to Melanoma Research (Boyack, Mane & Börner, 2004) 21

 Top 500 most highly")

22 Mapping Topic Bursts (Mane & Börner, 2004) Co-word space of the top 50 highly frequent and bursty words used in the top 10% most highly cited PNAS publications in Information Diffusion Patterns (Börner & Penumarthy, 2004) Top 500 most highly cited U.S. institutions. Each institution is assumed to produce and consume information. Does Internet lead to more global citation patterns, i.e., more citation links between papers produced at geographically distant research instructions? 22
 VLearn 3D Vis (Börner,")


23 Visualizing Social Diffusion Patterns in 3D (Virtual Worlds) (Börner & Penumarthy, 2003 & 2004) VLearn 3D Vis (Börner, Hazlewod, Jones, Lee & Penumarthy, 2003) Temporal-spatial distribution of Conference attendees Conference worlds are represented by square, perspective maps, each labeled by its name. Worlds accessed at the beginning of the conference are placed at the bottom, worlds accessed later toward the top. Next to each world is a circular snapshot of the virtual venue. Short descriptions of the main sessions are added as text. Major jumps between worlds are visualized by transparent lines. The thickness of each line corresponds to the number of traveling users. Color coding was used to denote the chronological paths of the conference sessions. 23
24 Infrastructure 24
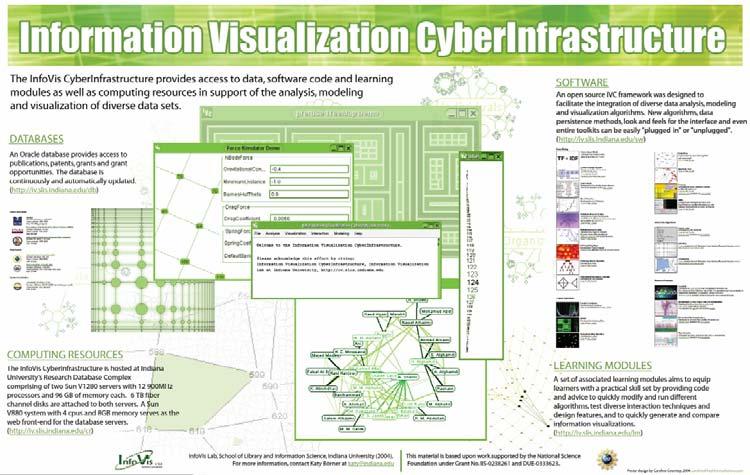
25 InfoVis CyberInfrastructure InfoVis Learning Modules 25


26 InfoVis Learning Modules: Design Visualizing Tree Data ana.edu/lm/lmtrees.html 26


27 Student s Project Results User & Task Analysis for Visualizing Tree Data Visualizing the structure of IU s Decision Support System Visualizing the co-occurences of keywords in DLib Magazine articles. Visualization of the Java API Visualizing the the Library of Congress Classification System to retrieve legal materials in a library. See Handin pages at Image by Peter Hook and Rongke Gao Time Series Analysis & Visualization 27


28 Student s Project Results Time Series Analysis & Visualization Using Timesearcher and the Burst Detection Algorithm to Analyze the Stock Market from 1925 to 1945 Applying Burst and TimeSearcher to Chat Data Lab Access Trends Quest Atlantis Chat Log Data See Handin pages at Visualizing the Work of the United States Supreme Court Based on Time Data and Top Level West Topics by Peter A. Hook & Rongke Gao Top fifteen most occurring topics from 1944 to 2004 in Timesearcher All topics grouped by West Category and Sub-Category grouped over the entire lengths of All topics by West Category and Sub-Category grouped the data set corresponding to the five chief justices 28


29 Visualizing Niches of the Blog Universe BY Mike Tyworth and Elijah Wright Visualizing niches of the blog universe. 29
Understanding (Big) Data by Using Macroscopes
 Data by Using Macroscopes") Understanding (Big) Data by Using Macroscopes Katy Börner Cyberinfrastructure for Network Science Center, Director Information Visualization Laboratory, Director Department of Information and Library Science
Understanding (Big) Data by Using Macroscopes Katy Börner Cyberinfrastructure for Network Science Center, Director Information Visualization Laboratory, Director Department of Information and Library Science
Types and Levels of Team (Network) Analysis
 Analysis") Types and Levels of Team (Network) Analysis Dr. Katy Börner Cyberinfrastructure for Network Science Center, Director Information Visualization Laboratory, Director School of Library and Information Science
Types and Levels of Team (Network) Analysis Dr. Katy Börner Cyberinfrastructure for Network Science Center, Director Information Visualization Laboratory, Director School of Library and Information Science
Bridging the Practices of Two Communities
 Educational Knowledge Domain Visualizations: Tools to Navigate, Understand, and Internalize the Structure of Scholarly Knowledge and Expertise Peter A. Hook http://ella.slis.indiana.edu/~pahook Mapping
Towards Effective KM Tools
 Towards Effective KM Tools Dr. Katy Börner Cyberinfrastructure for Network Science Center, Director Information Visualization Laboratory, Director School of Library and Information Science Indiana University,
How do we analyze and visualize science?
 Analysis and Visualization of Science Angela Zoss, M.S. Research Assistant, Cyberinfrastructurefor Network Science Center Doctoral Student, School of Library and Information Science Indiana University,
Studying the emergent 'Global Brain' in large-scale co-author networks and mapping the 'Backbone of Science'
 Studying the emergent 'Global Brain' in large-scale co-author networks and mapping the 'Backbone of Science' Katy Börner & the InfoVis Lab School of Library and Information Science katy@indiana.edu Networks
The Accuracy of Network Visualizations. Kevin W. Boyack SciTech Strategies, Inc.
 The Accuracy of Network Visualizations Kevin W. Boyack SciTech Strategies, Inc. kboyack@mapofscience.com Overview Science mapping history Conceptual Mapping Early Bibliometric Maps Recent Bibliometric
Science of Science Research and Tools Tutorial #05 of 12
 Science of Science Research and Tools Tutorial #05 of 12 Dr. Katy Börner Cyberinfrastructure for Network Science Center, Director Information Visualization Laboratory, Director School of Library and Information
Design and Update of a Classification System: The UCSD Map of Science
 Design and Update of a Classification System: The UCSD Map of Science Networks and Complex Systems Talk Series Indiana University, Bloomington, IN Sept 10,2012 Overview Motivation Design Validation Application
Interactive Maps of S&T
 Interactive Maps of S&T Katy Börner Cyberinfrastructure for Network Science Center, Director Information Visualization Laboratory, Director School of Library and Information Science Indiana University,
Cartographies of Science
 Cartographies of Science Katy Börner Visiting Scientist in Dirk Helbing s Group, SOMS, ETHZ Cyberinfrastructure for Network Science Center, Director Information Visualization Laboratory, Director School
Visualizing the Evolution of a Subject Domain: A Case Study
 Visualizing the Evolution of a Subject Domain: A Case Study Chaomei Chen Brunel University Leslie Carr Southampton University Abstract We explore the potential of information visualization techniques in
Mapping of Science. Bart Thijs ECOOM, K.U.Leuven, Belgium
 Mapping of Science Bart Thijs ECOOM, K.U.Leuven, Belgium Introduction Definition: Mapping of Science is the application of powerful statistical tools and analytical techniques to uncover the structure
Plug and Play Macroscopes: Empowering Anyone To Convert Data Into Insights
 Plug and Play Macroscopes: Empowering Anyone To Convert Data Into Insights Katy Börner Victor H. Yngve Distinguished Professor of Information Science Director, Cyberinfrastructure for Network Science Center
Mapping the Structure and Evolution of Chemistry Research
 Mapping the Structure and Evolution of Chemistry Research Kevin W. Boyack *, Katy Börner ** and Richard Klavans *** * kboyack@mapofscience.com * Sandia National Laboratories, P.O. Box 5800, MS-1316, Albuquerque,
Locating an Astronomy and Astrophysics Publication Set in a Map of the Full Scopus Database
 Locating an Astronomy and Astrophysics Publication Set in a Map of the Full Scopus Database Kevin W. Boyack 1 1 kboyack@mapofscience.com SciTech Strategies, Inc., 8421 Manuel Cia Pl NE, Albuquerque, NM
Human BioMolecular Atlas: Maps and Macroscopes
 Human BioMolecular Atlas: Maps and Macroscopes Katy Börner Victor H. Yngve Distinguished Professor of Information Science Director, Cyberinfrastructure for Network Science Center School of Informatics
NR402 GIS Applications in Natural Resources
 NR402 GIS Applications in Natural Resources Lesson 1 Introduction to GIS Eva Strand, University of Idaho Map of the Pacific Northwest from http://www.or.blm.gov/gis/ Welcome to NR402 GIS Applications in
Map image from the Atlas of Oregon (2nd. Ed.), Copyright 2001 University of Oregon Press
, Copyright 2001 University of Oregon Press") Map Layout and Cartographic Design with ArcGIS Desktop Matthew Baker ESRI Educational Services Redlands, CA Education UC 2008 1 Seminar overview General map design principles Working with map elements
Map Layout and Cartographic Design with ArcGIS Desktop Matthew Baker ESRI Educational Services Redlands, CA Education UC 2008 1 Seminar overview General map design principles Working with map elements
CHAPTER 9 DATA DISPLAY AND CARTOGRAPHY
 CHAPTER 9 DATA DISPLAY AND CARTOGRAPHY 9.1 Cartographic Representation 9.1.1 Spatial Features and Map Symbols 9.1.2 Use of Color 9.1.3 Data Classification 9.1.4 Generalization Box 9.1 Representations 9.2
Mapping the Structure and Diffusion of Scholarly Knowledge
 Mapping the Structure and Diffusion of Scholarly Knowledge Dr. Katy Börner Cyberinfrastructure for Network Science Center, Director Information Visualization Laboratory, Director School of Library and
Scientometrics as network science The hidden face of a misperceived research field. Sándor Soós, PhD
 Scientometrics as network science The hidden face of a misperceived research field Sándor Soós, PhD soossand@konyvtar.mta.hu Public understanding of scientometrics Three common misperceptions: Scientometrics
Lecture 5. Symbolization and Classification MAP DESIGN: PART I. A picture is worth a thousand words
 Lecture 5 MAP DESIGN: PART I Symbolization and Classification A picture is worth a thousand words Outline Symbolization Types of Maps Classifying Features Visualization Considerations Symbolization Symbolization
Different Displays of Thematic Maps:
 Different Displays of Thematic Maps: There are a number of different ways to display or classify thematic maps, including: Natural Breaks Equal Interval Quantile Standard Deviation What s important to
Geographical knowledge and understanding scope and sequence: Foundation to Year 10
 Geographical knowledge and understanding scope and sequence: Foundation to Year 10 Foundation Year 1 Year 2 Year 3 Year 4 Year 5 Year 6 Year level focus People live in places Places have distinctive features
Data Visualization Literacy
 Data Visualization Literacy Katy Börner @katycns Victor H. Yngve Distinguished Professor of Engineering and Information Science Director, Cyberinfrastructure for Network Science Center Indiana University
The Scope and Growth of Spatial Analysis in the Social Sciences
 context. 2 We applied these search terms to six online bibliographic indexes of social science Completed as part of the CSISS literature search initiative on November 18, 2003 The Scope and Growth of Spatial
²Austrian Center of Competence for Tribology, AC2T research GmbH, Viktor-Kaplan-Straße 2-C, A Wiener Neustadt, Austria
 Bibliometric field delineation with heat maps of bibliographically coupled publications using core documents and a cluster approach - the case of multiscale simulation and modelling (research in progress)
A Journey Back in Time
 A Trip Through Geologic Time TEACHER NOTES Lab zonetm A Journey Back in Time The following steps will walk you through the. Use the hints and detailed directions as you guide your students through planning,
Module 2, Investigation 1: Briefing Where do we choose to live and why?
 Module 2, Investigation 1: Briefing Background Why do you live where you live? Where do people choose to live? Why do they choose those places? People have lived on Earth for thousands of years. Throughout
Science Maps. Different Datasets Different Analyses and Visualizations Different User Groups
 Identifying Overlap, Gaps and Emerging Research Areas Using Multi-Level Science Maps Katy Börner Cyberinfrastructure for Network Science Center, Director Information Visualization Laboratory, Director
Sample assessment task. Task details. Content description. Year level 7
 Sample assessment task Year level 7 Learning area Subject Title of task Task details Description of task Type of assessment Purpose of assessment Assessment strategy Evidence to be collected Suggested
Human Population Dynamics CAPT Embedded Task
 Name Per. Assigned Due Human Population Dynamics CAPT Embedded Task Essential Question: What factors influence population growth? The human population has existed for a little more than 500,000 years.
LEHMAN COLLEGE OF THE CITY UNIVERSITY OF NEW YORK. 1. Type of Change: Change in Degree Requirements
 Alpha Number: Hegis Code 1214 Program Code: 30600 1. Type of Change: Change in Degree Requirements 2. From: [The curriculum consists of 45 graduate credits and includes core courses, an area of specialization,
Mapping research topics using word-reference co-occurrences: A method and an exploratory case study
 Jointly published by Akadémiai Kiadó, Budapest Scientometrics, Vol. 68, No. 3 (2006) 377 393 and Springer, Dordrecht Mapping research topics using word-reference co-occurrences: A method and an exploratory
113 Years of Physical Review: Using Flow Maps to Show Temporal and Topical Citation Patterns
 113 Years of Physical Review: Using Flow Maps to Show Temporal and Topical Citation Patterns Bruce W. Herr II, Russell J. Duhon, Katy Börner, Elisha F. Hardy, Shashikant Penumarthy Cyberinfrastructure
Fundamentals of ArcGIS Desktop Pathway
 Fundamentals of ArcGIS Desktop Pathway Table of Contents ArcGIS Desktop I: Getting Started with GIS 3 ArcGIS Desktop II: Tools and Functionality 5 Understanding Geographic Data 8 Understanding Map Projections
Physical Geography Lab Activity #15
 Physical Geography Lab Activity #15 Due date Name Choropleth Maps COR Objective 1 & 7, SLOs 1 & 3 15.1. Introduction Up until this point we have used maps to find locations on the Earth. While they are
BASIC TECHNOLOGY Pre K starts and shuts down computer, monitor, and printer E E D D P P P P P P P P P P
 BASIC TECHNOLOGY Pre K 1 2 3 4 5 6 7 8 9 10 11 12 starts and shuts down computer, monitor, and printer P P P P P P practices responsible use and care of technology devices P P P P P P opens and quits an
Prediction of Citations for Academic Papers
 000 001 002 003 004 005 006 007 008 009 010 011 012 013 014 015 016 017 018 019 020 021 022 023 024 025 026 027 028 029 030 031 032 033 034 035 036 037 038 039 040 041 042 043 044 045 046 047 048 049 050
Geography. Programme of study for key stage 3 and attainment target (This is an extract from The National Curriculum 2007)
") Geography Programme of study for key stage 3 and attainment target (This is an extract from The National Curriculum 2007) Crown copyright 2007 Qualifications and Curriculum Authority 2007 Curriculum aims
Geography Programme of study for key stage 3 and attainment target (This is an extract from The National Curriculum 2007) Crown copyright 2007 Qualifications and Curriculum Authority 2007 Curriculum aims
Expanding Canada s Rail Network to Meet the Challenges of the Future
 Expanding Canada s Rail Network to Meet the Challenges of the Future Lesson Overview Rail may become a more popular mode of transportation in the future due to increased population, higher energy costs,
Mining Newsgroups Using Networks Arising From Social Behavior by Rakesh Agrawal et al. Presented by Will Lee
 Mining Newsgroups Using Networks Arising From Social Behavior by Rakesh Agrawal et al. Presented by Will Lee wwlee1@uiuc.edu September 28, 2004 Motivation IR on newsgroups is challenging due to lack of
Year 9 plan Victorian Curriculum: Humanities Semester Two (Geography/Economics and Business)
") Year 9 plan Victorian Curriculum: Humanities Semester Two (Geography/Economics and Business) Implementation year: School name: Kyabram P-12 College Prepared By: Rowena Morris Identify Curriculum Curriculum
Year 9 plan Victorian Curriculum: Humanities Semester Two (Geography/Economics and Business) Implementation year: School name: Kyabram P-12 College Prepared By: Rowena Morris Identify Curriculum Curriculum
Version 1.1 GIS Syllabus
 GEOGRAPHIC INFORMATION SYSTEMS CERTIFICATION Version 1.1 GIS Syllabus Endorsed 1 Version 1 January 2007 GIS Certification Programme 1. Target The GIS certification is aimed at: Those who wish to demonstrate
Mapping the Structure
 Mapping the Structure and Dynamics of Science Dr. Katy Börner Cyberinfrastructure for Network Science Center, Director Information Visualization Laboratory, Director School of Library and Information Science
Your web browser (Safari 7) is out of date. For more security, comfort and. the best experience on this site: Update your browser Ignore
 is out of date. For more security, comfort and. the best experience on this site: Update your browser Ignore") Your web browser (Safari 7) is out of date. For more security, comfort and Activityengage the best experience on this site: Update your browser Ignore Comparing Historical Maps How can historical maps
Your web browser (Safari 7) is out of date. For more security, comfort and Activityengage the best experience on this site: Update your browser Ignore Comparing Historical Maps How can historical maps
A Correlation of. Eastern Hemisphere. Ohio s Learning Standards Social Studies: K-12 Grade 6
 A Correlation of Eastern Hemisphere To Grade 6 to,, Grade 6 Introduction This document demonstrates how, Eastern Hemisphere, Ohio Edition, meets : K-12 Social Studies for Grade 6. Correlation page references
Massachusetts Institute of Technology Department of Urban Studies and Planning
 Massachusetts Institute of Technology Department of Urban Studies and Planning 11.520: A Workshop on Geographic Information Systems 11.188: Urban Planning and Social Science Laboratory GIS Principles &
Your web browser (Safari 7) is out of date. For more security, comfort and. the best experience on this site: Update your browser Ignore
 is out of date. For more security, comfort and. the best experience on this site: Update your browser Ignore") Your web browser (Safari 7) is out of date. For more security, comfort and Activityengage the best experience on this site: Update your browser Ignore Introduction to GIS What is a geographic information
Your web browser (Safari 7) is out of date. For more security, comfort and Activityengage the best experience on this site: Update your browser Ignore Introduction to GIS What is a geographic information
GIS for the Beginner on a Budget
 GIS for the Beginner on a Budget Andre C. Bally, RLA, GIS Coordinator, Harris County Public Infrastructure Department Engineering Division This presentation, GIS for Beginners on a Budget. will briefly
Effective Use of Geographic Maps
 Effective Use of Geographic Maps Purpose This tool provides guidelines and tips on how to effectively use geographic maps to communicate research findings. Format This tool provides guidance on geographic
LOUISIANA STUDENT STANDARDS FOR SOCIAL STUDIES THAT CORRELATE WITH A FIELD TRIP TO DESTREHAN PLANTATION KINDERGARTEN
 LOUISIANA STUDENT STANDARDS FOR SOCIAL STUDIES THAT CORRELATE WITH A FIELD TRIP TO DESTREHAN PLANTATION KINDERGARTEN Standard 2 Historical Thinking Skills Students distinguish between events, people, and
How Irrigation Affected the Geography of Northeast Oregon
 Delia Wallis How Irrigation Affected the Geography of Northeast Oregon Grade Levels: 4 (with ability to move up or down) Time: two x 45-minute sessions Overview: Students are going to study topographical
SocViz: Visualization of Facebook Data
 SocViz: Visualization of Facebook Data Abhinav S Bhatele Department of Computer Science University of Illinois at Urbana Champaign Urbana, IL 61801 USA bhatele2@uiuc.edu Kyratso Karahalios Department of
Exhibit Explanation. Places & Spaces: Mapping Science On Display at the Monroe County Public Library May 1 May 30, General Introduction
 Places & Spaces: Mapping Science On Display at the Monroe County Public Library May 1 May 30, 2007 Exhibit Explanation General Introduction Cartographic maps of physical places have guided mankind s explorations
RESEARCH AREAS IN THE ERC RESEARCH
 Parker / SPL / Agentur Focus ERACEP: IDENTIFYING EMERGING RESEARCH AREAS IN THE ERC RESEARCH PROPOSALS F i n a l W o r k s h o p D B F & E R A C E P C S A s 2 0 / 2 1 F e b r u a r y 2 0 1 3, B r u s s
GIS Visualization: A Library s Pursuit Towards Creative and Innovative Research
 GIS Visualization: A Library s Pursuit Towards Creative and Innovative Research Justin B. Sorensen J. Willard Marriott Library University of Utah justin.sorensen@utah.edu Abstract As emerging technologies
CountrySTAT REGIONAL BASIC ADMINISTRATOR TRAINING for GCC MEMBER STATES. CountrySTAT STATISTICS COMPONENT
 CountrySTAT REGIONAL BASIC ADMINISTRATOR TRAINING for GCC MEMBER STATES Abu Dhabi, United Arab Emirates (UAE), 26 30 January 2014 CountrySTAT STATISTICS COMPONENT (Concepts, Definitions, Classification,
Collaborative topic models: motivations cont
 Collaborative topic models: motivations cont Two topics: machine learning social network analysis Two people: " boy Two articles: article A! girl article B Preferences: The boy likes A and B --- no problem.
Geo-identification and pedestrian navigation with geo-mobile applications: how do users proceed?
 TU Vienna presentation 17 th July 2008 Geo-identification and pedestrian navigation with geo-mobile applications: how do users proceed? Ioannis Delikostidis Corné van Elzakker INTERNATIONAL INSTITUTE FOR
VIRTUAL LIBRARY. EXPLORE like never before
 VIRTUAL LIBRARY EXPLORE like never before National Geographic Magazine Archive 1888-1994 National Geographic magazine is the official journal of the National Geographic Society. Recognised for some of
SciFinder Scholar Guide to Getting Started
 SciFinder Scholar Guide to Getting Started What is SciFinder Scholar? SciFinder Scholar is the online version of Chemical Abstracts, covering chemistry publications worldwide from 1907 to the present.
Chapter 7: Making Maps with GIS. 7.1 The Parts of a Map 7.2 Choosing a Map Type 7.3 Designing the Map
 Chapter 7: Making Maps with GIS 7.1 The Parts of a Map 7.2 Choosing a Map Type 7.3 Designing the Map What is a map? A graphic depiction of all or part of a geographic realm in which the real-world features
Photosynthesis: Limiting Factors
 Name: Date: Period: Photosynthesis: Limiting Factors Purpose: 1. To determine the effect of temperature, light intensity, and light color on the rate of photosynthesis. 2. To calculate the rate of photosynthesis
Lesson 6: Accuracy Assessment
 This work by the National Information Security and Geospatial Technologies Consortium (NISGTC), and except where otherwise Development was funded by the Department of Labor (DOL) Trade Adjustment Assistance
Nature s Art Village
 Nature s Art Village Educational Field Trip Programs Guide To: College, Career & Civic Life C3 Framework For Social Studies State Standards Grades 3 through 5 All That Glitters Children journey back in
GTECH 380/722 Analytical and Computer Cartography Hunter College, CUNY Department of Geography
 GTECH 380/722 Analytical and Computer Cartography Hunter College, CUNY Department of Geography Fall 2014 Mondays 5:35PM to 9:15PM Instructor: Doug Williamson, PhD Email: Douglas.Williamson@hunter.cuny.edu
a system for input, storage, manipulation, and output of geographic information. GIS combines software with hardware,
 Introduction to GIS Dr. Pranjit Kr. Sarma Assistant Professor Department of Geography Mangaldi College Mobile: +91 94357 04398 What is a GIS a system for input, storage, manipulation, and output of geographic
Mapping Data 1: Constructing a Choropleth Map
 Mapping Data 1: Constructing a Choropleth Map OVERVIEW & OBJECTIVES Students will become acquainted with mapping data and understanding the importance of recognizing patterns by constructing a choropleth
Curriculum Vita. Timothy J. Niblett
 Curriculum Vita Timothy J. Niblett CONTACT DETAILS 3416 Bellevue Drive Modesto, CA 95350 tniblett@ucsb.edu (209) 480-0467 EDUCATION Ph.D M.A. M.A. B.A. 2016, University of California at Santa Barbara (Geography)
State and National Standard Correlations NGS, NCGIA, ESRI, MCHE
 GEOGRAPHIC INFORMATION SYSTEMS (GIS) COURSE DESCRIPTION SS000044 (1 st or 2 nd Sem.) GEOGRAPHIC INFORMATION SYSTEMS (11, 12) ½ Unit Prerequisite: None This course is an introduction to Geographic Information
MAPPING THE SURFACE OF MARS
 MAPPING THE SURFACE OF MARS What will you learn in this lab? How can we determine the geologic history of a planet or satellite without travelling to the planetary body? In this lab you will create a simple
Your web browser (Safari 7) is out of date. For more security, comfort and. the best experience on this site: Update your browser Ignore
 is out of date. For more security, comfort and. the best experience on this site: Update your browser Ignore") Your web browser (Safari 7) is out of date. For more security, comfort and Activitydevelop the best experience on this site: Update your browser Ignore Places in the Park Why do we use symbols? Overview
Your web browser (Safari 7) is out of date. For more security, comfort and Activitydevelop the best experience on this site: Update your browser Ignore Places in the Park Why do we use symbols? Overview
658 C.-P. Hu et al. Highlycited Indicators published by Chinese Scientific and Technical Information Institute and Wanfang Data Co., Ltd. demonstrates
 658 C.-P. Hu et al. Highlycited Indicators published by Chinese Scientific and Technical Information Institute and Wanfang Data Co., Ltd. demonstrates the basic status of LIS journals in China through
GEOG 508 GEOGRAPHIC INFORMATION SYSTEMS I KANSAS STATE UNIVERSITY DEPARTMENT OF GEOGRAPHY FALL SEMESTER, 2002
 GEOG 508 GEOGRAPHIC INFORMATION SYSTEMS I KANSAS STATE UNIVERSITY DEPARTMENT OF GEOGRAPHY FALL SEMESTER, 2002 Course Reference #: 13210 Meeting Time: TU 2:05pm - 3:20 pm Meeting Place: Ackert 221 Remote
SOCIAL STUDIES GRADE 6. I Can Checklist REGIONS AND PEOPLE OF THE EASTERN HEMISPHERE. Office of Teaching and Learning Curriculum Division
 SOCIAL STUDIES REGIONS AND PEOPLE OF THE EASTERN HEMISPHERE GRADE 6 I Can Checklist 2018-2019 Aligned with Ohio s Learning Standards for Social Studies Office of Teaching and Learning Curriculum Division
Lecture 5: Web Searching using the SVD
 Lecture 5: Web Searching using the SVD Information Retrieval Over the last 2 years the number of internet users has grown exponentially with time; see Figure. Trying to extract information from this exponentially
Course Outline. School Name: Keewaytinook Internet High School. Department Name: Canadian and World Studies. Ministry of Education Course Title:
 School Name: Keewaytinook Internet High School Department Name: Canadian and World Studies Course Outline Ministry of Education Course Title: Travel and Tourism: A Geographic Perspective Grade Level: 11
Visualisation of knowledge domains in interdisciplinary research organizations
 Neversdorf, September 2010 Visualisation of knowledge domains in interdisciplinary research organizations Ismael Rafols 1,2 1 SPRU -- Science and Technology Policy Research University of Sussex, Brighton,
An Introduction to Scientific Research Methods in Geography Chapter 3 Data Collection in Geography
 An Introduction to Scientific Research Methods in Geography Chapter 3 Data Collection in Geography Learning Objectives What is the distinction between primary and secondary data sources? What are the five
1. Origins of Geography
 II. ORIGINS AND BRANCHES OF GEOGRAPHY My Notes A. Origins of Geography Unit One 6 Before carefully examining the tools of the geographer, it would be useful to examine the origins and roots of this ancient
Crossing the Atlantic: Then and Now
 Your web browser (Safari 7) is out of date. For more security, comfort and Activitydevelop the best experience on this site: Update your browser Ignore Crossing the Atlantic: Then and Now How has the amount
Indirect Measurement Technique: Using Trigonometric Ratios Grade Nine
 Ohio Standards Connections Measurement Benchmark D Use proportional reasoning and apply indirect measurement techniques, including right triangle trigonometry and properties of similar triangles, to solve
Canadian Board of Examiners for Professional Surveyors Core Syllabus Item C 5: GEOSPATIAL INFORMATION SYSTEMS
 Study Guide: Canadian Board of Examiners for Professional Surveyors Core Syllabus Item C 5: GEOSPATIAL INFORMATION SYSTEMS This guide presents some study questions with specific referral to the essential
Earth s Plates, Part 1: What Are They, Where Are They and What Do They Do?
 Earth s Plates, Part 1: What Are They, Where Are They and What Do They Do? A scientist named Alfred Wegener believed that, at one time, all of the continents were one landmass. Although he had no real
13 Searching the Web with the SVD
 13 Searching the Web with the SVD 13.1 Information retrieval Over the last 20 years the number of internet users has grown exponentially with time; see Figure 1. Trying to extract information from this
9 Searching the Internet with the SVD
 9 Searching the Internet with the SVD 9.1 Information retrieval Over the last 20 years the number of internet users has grown exponentially with time; see Figure 1. Trying to extract information from this
Module 2 Educator s Guide Investigation 2
 Module 2 Educator s Guide Investigation 2 How does remote sensing help us to observe human activities on Earth? Investigation Overview Landscapes that are influenced by human activities are found nearly
Students will read supported and shared informational materials, including social
 Grade Band: Middle School Unit 18 Unit Target: Earth and Space Science Unit Topic: This Is the Solar System Lesson 9 Instructional Targets Reading Standards for Informational Text Range and Level of Text
Basics of GIS. by Basudeb Bhatta. Computer Aided Design Centre Department of Computer Science and Engineering Jadavpur University
 Basics of GIS by Basudeb Bhatta Computer Aided Design Centre Department of Computer Science and Engineering Jadavpur University e-governance Training Programme Conducted by National Institute of Electronics
Tuesday 6:30 9:30 (First/Last classes) Home Phone: SYLLABUS. I. Focus of Course
 Home Phone: SYLLABUS. I. Focus of Course") PSC 560-G Stephen Sherman GIS in Public Administration Political Science Dept. Summer, First Session, 2014 Work Phone: 373-4503 (Tue & Thur) Tuesday 6:30 9:30 (First/Last classes) Home Phone: 375-5328
PSC 560-G Stephen Sherman GIS in Public Administration Political Science Dept. Summer, First Session, 2014 Work Phone: 373-4503 (Tue & Thur) Tuesday 6:30 9:30 (First/Last classes) Home Phone: 375-5328
Understanding China Census Data with GIS By Shuming Bao and Susan Haynie China Data Center, University of Michigan
 Understanding China Census Data with GIS By Shuming Bao and Susan Haynie China Data Center, University of Michigan The Census data for China provides comprehensive demographic and business information
Lab 7: Cell, Neighborhood, and Zonal Statistics
 Lab 7: Cell, Neighborhood, and Zonal Statistics Exercise 1: Use the Cell Statistics function to detect change In this exercise, you will use the Spatial Analyst Cell Statistics function to compare the
The Application of 3D Web GIS In Land Administration - 3D Building Model System
 The Application of 3D Web GIS In Land Administration - 3D Building Model System Hui-Wen Chen *, Wen-Yuan Ku *, Lan-Kun Chung *, Tien-Yin Chou *, Li-Min Yi2 ** * Feng Chia University, Taiwan, ** Land Department
Middle School. Teacher s Guide MICROPLANTS MAJOR SPONSOR:
 Middle School Teacher s Guide MICROPLANTS MAJOR SPONSOR: Introduction As technology continues to rapidly evolve, scientists are able to collect and store more data. Some scientists find themselves with
Course Introduction III
 GEOG 47 Cultural Geography Course Introduction III Prof. Anthony Grande Hunter College-CUNY Underlining Themes of Cultural Geography Every chapter and topic covered will make reference to one or more of
Spatializing time in a history text corpus
 Zurich Open Repository and Archive University of Zurich Main Library Strickhofstrasse 39 CH-8057 Zurich www.zora.uzh.ch Year: 2014 Spatializing time in a history text corpus Bruggmann, André; Fabrikant,
Syllabus: UHH ASTR 450 (F18): Astronomical Instrumentation
: Astronomical Instrumentation") Syllabus: UHH ASTR 450 (F18): Astronomical Instrumentation Prof. Klaus W. Hodapp This course is the final course in the 3-course series on optics and astronomical instrumentation offered at UHH. We will
Syllabus: UHH ASTR 450 (F18): Astronomical Instrumentation Prof. Klaus W. Hodapp This course is the final course in the 3-course series on optics and astronomical instrumentation offered at UHH. We will
Representation of Geographic Data
 GIS 5210 Week 2 The Nature of Spatial Variation Three principles of the nature of spatial variation: proximity effects are key to understanding spatial variation issues of geographic scale and level of