Understanding (Big) Data by Using Macroscopes
|
|
|
- Stephany Elliott
- 5 years ago
- Views:
Transcription


1 Understanding (Big) Data by Using Macroscopes Katy Börner Cyberinfrastructure for Network Science Center, Director Information Visualization Laboratory, Director Department of Information and Library Science School of Informatics and Computing Indiana University, Bloomington, IN With special thanks to the members at the Cyberinfrastructure for Network Science Center; the Sci2, NWB teams, and the IVMOOC students Digital HPS Meeting, Bloomington, IN September 7, 2013 Descriptive & Predictive Models Find your way Terra bytes of data Find collaborators, friends Identify trends 14
2 Type of Analysis vs. Level of Analysis Micro/Individual (1-100 records) Meso/Local (101 10,000 records) Macro/Global (10,000 < records) Statistical Analysis/Profiling Individual person and their expertise profiles Larger labs, centers, universities, research domains, or states All of NSF, all of USA, all of science. Temporal Analysis (When) Funding portfolio of one individual Mapping topic bursts in 20-years of PNAS 113 Years of Physics Research Geospatial Analysis (Where) Career trajectory of one individual Mapping a states intellectual landscape PNAS publications Topical Analysis (What) Base knowledge from which one grant draws. Knowledge flows in Chemistry research VxOrd/Topic maps of NIH funding Network Analysis (With Whom?) NSF Co-PI network of one individual Co-author network NIH s core competency 15 Type of Analysis vs. Level of Analysis Micro/Individual (1-100 records) Meso/Local (101 10,000 records) Macro/Global (10,000 < records) Statistical Analysis/Profiling Individual person and their expertise profiles Larger labs, centers, universities, research domains, or states All of NSF, all of USA, all of science. Temporal Analysis (When) Funding portfolio of one individual Mapping topic bursts in 20-years of PNAS 113 Years of Physics Research Geospatial Analysis (Where) Career trajectory of one individual Mapping a states intellectual landscape PNAS publciations Topical Analysis (What) Base knowledge from which one grant draws. Knowledge flows in Chemistry research VxOrd/Topic maps of NIH funding Network Analysis (With Whom?) NSF Co-PI network of one individual Co-author network NIH s core competency 16


")

.")
3 Mapping Indiana s Intellectual Space Identify Pockets of innovation Pathways from ideas to products Interplay of industry and academia 17 Mapping the Intersection of Science & Philosophy Murdock, Jaimie, Robert Light, Colin Allen, and Katy Börner. Joint Conference on Digital Libraries (2013) Philosophical content on the UCSD Map of Science. The size of each circle corresponds to the number of SEP editorial areas citing material from the UCSD Map of Science subdiscipline (minimum: 0, maximum: 43). Circle color denotes 13 major disciplines of science. 18


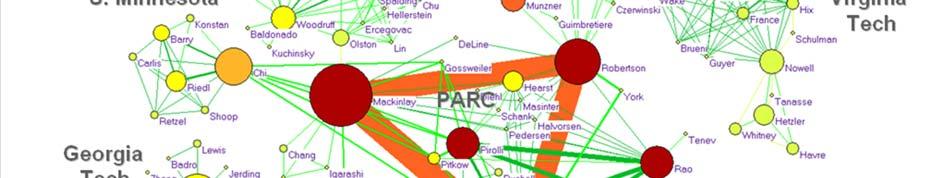

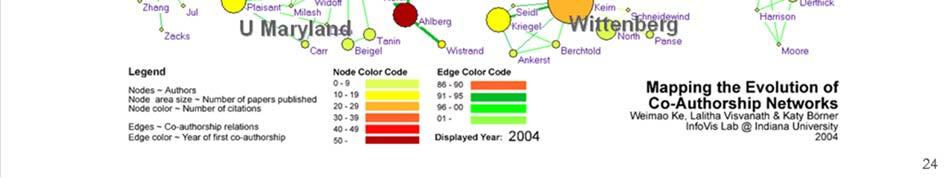
4 Mapping the Evolution of Co-Authorship Networks Ke, Visvanath & Börner, (2004) Won 1st price at the IEEE InfoVis Contest


5 Mapping Transdisciplinary Tobacco Use Research Centers Publications Compare R01 investigator based funding with TTURC Center awards in terms of number of publications and evolving co-author networks. Zoss & Börner, forthcoming. Supported by NIH/NCI Contract HHSN Mapping Topic Bursts Co-word space of the top 50 highly frequent and bursty words used in the top 10% most highly cited PNAS publications in Mane & Börner. (2004) PNAS, 101(Suppl. 1):
 Meso/Local (101 10,000 records) Macro/Global")

 Career trajectory of one individual Mapping")

6 Type of Analysis vs. Level of Analysis Micro/Individual (1-100 records) Meso/Local (101 10,000 records) Macro/Global (10,000 < records) Statistical Analysis/Profiling Individual person and their expertise profiles Larger labs, centers, universities, research domains, or states All of NSF, all of USA, all of science. Temporal Analysis (When) Funding portfolio of one individual Mapping topic bursts in 20-years of PNAS 113 Years of Physics Research Geospatial Analysis (Where) Career trajectory of one individual Mapping a states intellectual landscape PNAS publciations Topical Analysis (What) Base knowledge from which one grant draws. Knowledge flows in Chemistry research VxOrd/Topic maps of NIH funding Network Analysis (With Whom?) NSF Co-PI network of one individual Co-author network NIH s core competency 24
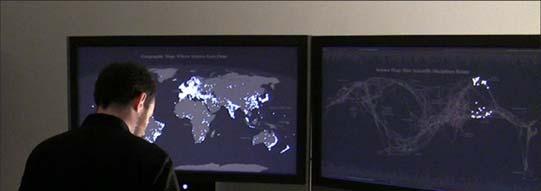
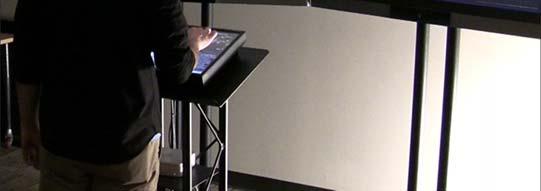
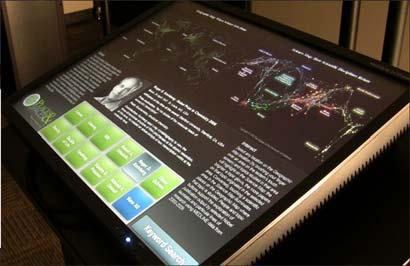
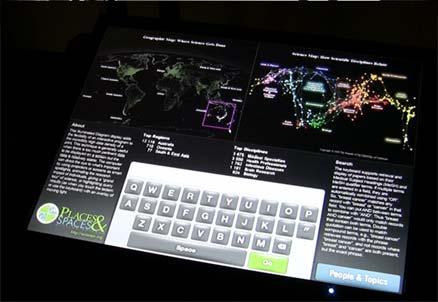
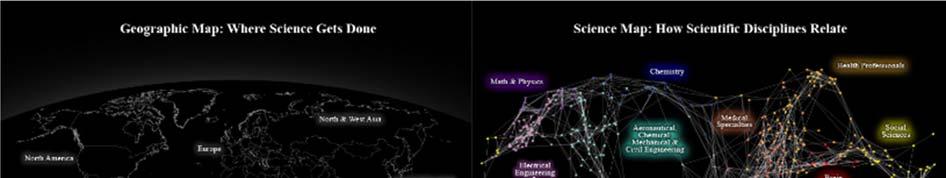
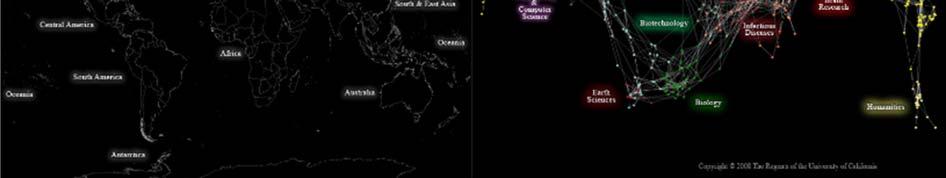
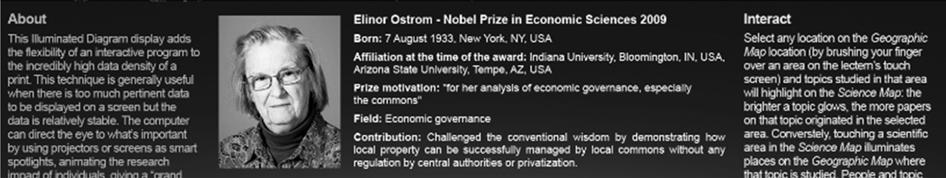
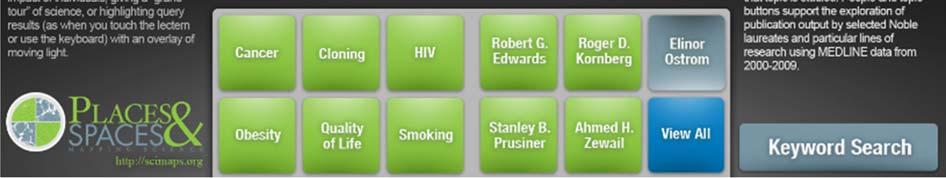
7 Illuminated Diagram Display soon on display at the Smithsonian in DC


8 27 Learning how to use Macroscope tools by taking the Information Visualization MOOC


.")


9 The Information Visualization MOOC ivmooc.cns.iu.edu Students come from 93 countries 300+ faculty members #ivmooc 29 Börner, Katy. (2011). Plug-and-Play Macroscopes. Communications of the ACM, 54(3), Video and paper are at Forthcoming Book: The Historian's Macroscope by Shawn Graham, Ian Milligan, & Scott Weingart, Imperial College Press, London, 2014/


,")


10 Sci 2 Tool answers When, Where, What, and With Whom questions Using temporal, geospatial, topical, and network analysis and visualizations plugins. Sci Maps GUESS Network Vis Horizontal Time Graphs Börner, Katy, Huang, Weixia (Bonnie), Linnemeier, Micah, Duhon, Russell Jackson, Phillips, Patrick, Ma, Nianli, Zoss, Angela, Guo, Hanning & Price, Mark. (2009). Rete-Netzwerk-Red: Analyzing and Visualizing Scholarly Networks Using the Scholarly Database and the Network Workbench Tool. Proceedings of ISSI 2009: 12th International Conference on Scientometrics and Informetrics, Rio de Janeiro, Brazil, July Vol. 2, pp Sci 2 Tool Vis cont. Geo Maps Circular Hierarchy


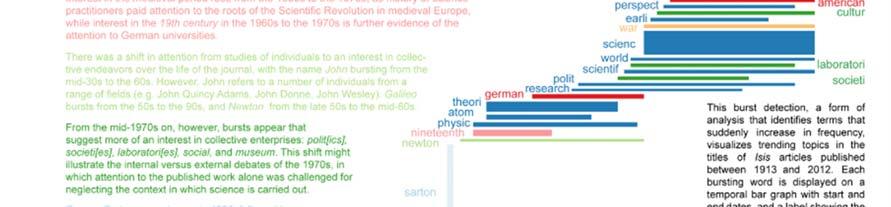
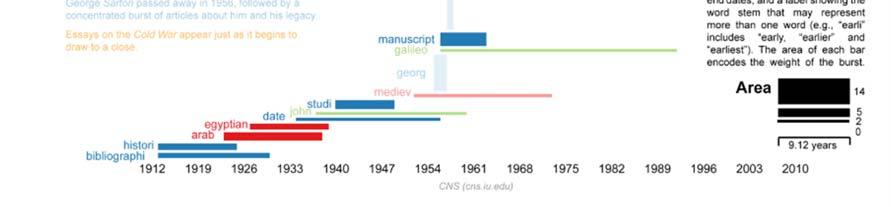
11 Visualizing Isis: A Geospatial and Topical Analysis of the History of Science 33 Visualizing Isis: A Geospatial and Topical Analysis of the History of Science 34


12 Mapping NEH awards and MEDLINE publications, NEH Grants: 41,258 grants of 47,197 started between 1980 and 2009, encompassing 3.21 billion of the 3.77 billion dollars awarded. Geo-coding by zipcode: 36,512 of 41,258 grants encompassing 3.13 billion of a potential 3.21 billion were geocoded to 3,510 distinct locations. Science-coding by topic: 37,132 of 41,258 grants encompassing 2.09 billion of a potential 3.21 billion were mapped to 42 distinct subdisciplines. MEDLINE publications: million papers were published between 1980 and Geo-coding: Not possible with the data we have. Science-coding by journal: million of million papers were science located (89.7%). Science located 5,941 out of 14,561 journals (40.8%) to 415 distinct subdisciplines.


13 Topical Visualization: UCSD Map of Science NEH grants, mapped based on categories Dollars Awarded Topical Visualization: UCSD Map of Science Medline papers, mapped based on journal names


. http://www.pnas.")
. Network Science.")

 Atlas of Science. MIT Press. http://scimaps.")
 Models of Science Dynamics. Springer Verlag.")
14 References Börner, Katy, Chen, Chaomei, and Boyack, Kevin. (2003). Visualizing Knowledge Domains. In Blaise Cronin (Ed.), ARIST, Medford, NJ: Information Today, Volume 37, Chapter 5, pp Shiffrin, Richard M. and Börner, Katy (Eds.) (2004). Mapping Knowledge Domains. Proceedings of the National Academy of Sciences of the United States of America, 101(Suppl_1). Börner, Katy, Sanyal, Soma and Vespignani, Alessandro (2007). Network Science. In Blaise Cronin (Ed.), ARIST, Information Today, Inc., Volume 41, Chapter 12, pp Börner, Katy (2010) Atlas of Science. MIT Press. Scharnhorst, Andrea, Börner, Katy, van den Besselaar, Peter (2012) Models of Science Dynamics. Springer Verlag. 39 All papers, maps, tools, talks, press are linked from CNS Facebook: Mapping Science Exhibit Facebook: 40
Interactive Maps of S&T
 Interactive Maps of S&T Katy Börner Cyberinfrastructure for Network Science Center, Director Information Visualization Laboratory, Director School of Library and Information Science Indiana University,
Cartographies of Science
 Cartographies of Science Katy Börner Visiting Scientist in Dirk Helbing s Group, SOMS, ETHZ Cyberinfrastructure for Network Science Center, Director Information Visualization Laboratory, Director School
Types and Levels of Team (Network) Analysis
 Analysis") Types and Levels of Team (Network) Analysis Dr. Katy Börner Cyberinfrastructure for Network Science Center, Director Information Visualization Laboratory, Director School of Library and Information Science
Types and Levels of Team (Network) Analysis Dr. Katy Börner Cyberinfrastructure for Network Science Center, Director Information Visualization Laboratory, Director School of Library and Information Science
Plug and Play Macroscopes: Empowering Anyone To Convert Data Into Insights
 Plug and Play Macroscopes: Empowering Anyone To Convert Data Into Insights Katy Börner Victor H. Yngve Distinguished Professor of Information Science Director, Cyberinfrastructure for Network Science Center
How do we analyze and visualize science?
 Analysis and Visualization of Science Angela Zoss, M.S. Research Assistant, Cyberinfrastructurefor Network Science Center Doctoral Student, School of Library and Information Science Indiana University,
Science Maps. Different Datasets Different Analyses and Visualizations Different User Groups
 Identifying Overlap, Gaps and Emerging Research Areas Using Multi-Level Science Maps Katy Börner Cyberinfrastructure for Network Science Center, Director Information Visualization Laboratory, Director
Analyzing and Visualizing Science
 Analyzing and Visualizing Science Katy Börner Royal Netherlands Academy of Arts and Sciences (KNAW), The Netherlands and Cyberinfrastructure for Network Science Center, Director Information Visualization
S701 Guest ectur Lecture Dr. Katy Börner Three Readings
 S701 Guest Lecture Dr. Katy Börner Cyberinfrastructure for Network Science Center, Director Information Visualization Laboratory, Director School of Library and Information Science Indiana University,
Human BioMolecular Atlas: Maps and Macroscopes
 Human BioMolecular Atlas: Maps and Macroscopes Katy Börner Victor H. Yngve Distinguished Professor of Information Science Director, Cyberinfrastructure for Network Science Center School of Informatics
Science of Science Research and Tools Tutorial #05 of 12
 Science of Science Research and Tools Tutorial #05 of 12 Dr. Katy Börner Cyberinfrastructure for Network Science Center, Director Information Visualization Laboratory, Director School of Library and Information
Design and Update of a Classification System: The UCSD Map of Science
 Design and Update of a Classification System: The UCSD Map of Science Networks and Complex Systems Talk Series Indiana University, Bloomington, IN Sept 10,2012 Overview Motivation Design Validation Application
1. Science/Economy/STEM is Global and needs to be understood globally (but optimized locally).
.") STEM: Individual, Local, and Global Flows and Activity Patterns Dr. Katy Börner Cyberinfrastructure for Network Science Center, Director Information Visualization Laboratory, Director School of Library
STEM: Individual, Local, and Global Flows and Activity Patterns Dr. Katy Börner Cyberinfrastructure for Network Science Center, Director Information Visualization Laboratory, Director School of Library
Mapping the Structure
 Mapping the Structure and Dynamics of Science Dr. Katy Börner Cyberinfrastructure for Network Science Center, Director Information Visualization Laboratory, Director School of Library and Information Science
Science of Science Research and Tools
 Science of Science Research and Tools Katy Börner Visiting Scientist in Dirk Helbing s Group, SOMS, ETHZ Cyberinfrastructure for Network Science Center, Director Information Visualization Laboratory, Director
Towards Effective KM Tools
 Towards Effective KM Tools Dr. Katy Börner Cyberinfrastructure for Network Science Center, Director Information Visualization Laboratory, Director School of Library and Information Science Indiana University,
Envisioning Biomedical Science. Biomedical Science from Above.
 Envisioning Biomedical Science Dr. Katy Börner Cyberinfrastructure for Network Science Center, Director Information Visualization Laboratory, Director School of Library and Information Science Indiana
Studying the emergent 'Global Brain' in large-scale co-author networks and mapping the 'Backbone of Science'
 Studying the emergent 'Global Brain' in large-scale co-author networks and mapping the 'Backbone of Science' Katy Börner & the InfoVis Lab School of Library and Information Science katy@indiana.edu Networks
Science of Science Maps, Tools, and Research
 Science of Science Maps, Tools, and Research Katy Börner Cyberinfrastructure for Network Science Center, Director Information Visualization Laboratory, Director School of Library and Information Science
Mapping Interdisciplinary Research Domains
 Mapping Interdisciplinary Research Domains Katy Börner School of Library and Information Science katy@indiana.edu Presentation at the Parmenides Center for the Study of Thinking, Island of Elba, Italy
Science Maps in Support of Scholarly Communication
 Science Maps in Support of Scholarly Communication Dr. Katy Börner Cyberinfrastructure for Network Science Center, Director Information Visualization Laboratory, Director School of Library and Information
Data Visualization Literacy
 Data Visualization Literacy Katy Börner @katycns Victor H. Yngve Distinguished Professor of Engineering and Information Science Director, Cyberinfrastructure for Network Science Center Indiana University
Plug-and-Play Macroscopes: Custom Tools for
 Plug-and-Play Macroscopes: Custom Tools for Data Analysis, Modeling, and Visualization Dr. Katy Börner Cyberinfrastructure for Network Science Center, Director Information Visualization Laboratory, Director
Tutorial: Open Source Tools for Data Analysis and Visualiza9on
 Tutorial: Open Source Tools for Data Analysis and Visualiza9on Katy Börner Victor H. Yngve Professor of Informa5on Science Director, Cyberinfrastructure for Network Science Center School of Informa5cs
040. Network Science: Theory, Tools, and Practice
 Börner, Katy. In Press. Network Science: Theory, Tools, and Practice. In William Sims Bainbridge, Ed. Leadership in Science and Technology: A Reference Handbook. Thousand Oaks, CA: Sage Publications 040.
Sci2 Tool: A Tool for Science of Science Research and Practice" Tutorial
 Sci2 Tool: A Tool for Science of Science Research and Practice" Tutorial Dr. Katy Börner CNS & IVL, SLIS, Indiana University, Bloomington, Indiana, USA Royal Netherlands Academy of Arts and Sciences (KNAW),
Mapping the Structure and Diffusion of Scholarly Knowledge
 Mapping the Structure and Diffusion of Scholarly Knowledge Dr. Katy Börner Cyberinfrastructure for Network Science Center, Director Information Visualization Laboratory, Director School of Library and
Early Maps of the World VERSUS Early Maps of Science
 2 3 Early Maps of the World VERSUS Early Maps of Science 3D n-d Physically-based Abstract space Accuracy is measurable Accuracy is difficult Trade-offs have more to do with granularity Trade-offs indirectly
Before starting. David Joseph Please try opening PostScript test - chessboard.ps
 Before starting A copy of these slides and all other materials you will need during this tutorial can be obtained from any of the DVDs or USB memory sticks being passed around right now Please register,
Sci2: A Tool of Science of Science Research and Practice
 Sci2: A Tool of Science of Science Research and Practice Dr. Katy Börner Cyberinfrastructure for Network Science Center Information Visualization Laboratory School of Library and Information Science Indiana
NETWORK AND TOPICAL ANALYSIS FOR THE HUMANITIES USING NWB AND SCI2
 NETWORK AND TOPICAL ANALYSIS FOR THE HUMANITIES USING NWB AND SCI2 Scott Weingart Cyberinfrastructure for Network Science Center Information Visualization Laboratory Indiana Philosophy Ontology Project
The Accuracy of Network Visualizations. Kevin W. Boyack SciTech Strategies, Inc.
 The Accuracy of Network Visualizations Kevin W. Boyack SciTech Strategies, Inc. kboyack@mapofscience.com Overview Science mapping history Conceptual Mapping Early Bibliometric Maps Recent Bibliometric
Bridging the Practices of Two Communities
 Educational Knowledge Domain Visualizations: Tools to Navigate, Understand, and Internalize the Structure of Scholarly Knowledge and Expertise Peter A. Hook http://ella.slis.indiana.edu/~pahook Mapping
Please (1) get a name tag, (2) download the Sci2 Tool from and (3) complete the Pre-Tutorial Questionnaire
 get a name tag, (2) download the Sci2 Tool from and (3) complete the Pre-Tutorial Questionnaire") Sci2: A Tool of Science of Science Research and Practice Tutorial Dr. Katy Börner & Joseph Biberstine Cyberinfrastructure for Network Science Center Information Visualization Laboratory School of Library
Sci2: A Tool of Science of Science Research and Practice Tutorial Dr. Katy Börner & Joseph Biberstine Cyberinfrastructure for Network Science Center Information Visualization Laboratory School of Library
Locating an Astronomy and Astrophysics Publication Set in a Map of the Full Scopus Database
 Locating an Astronomy and Astrophysics Publication Set in a Map of the Full Scopus Database Kevin W. Boyack 1 1 kboyack@mapofscience.com SciTech Strategies, Inc., 8421 Manuel Cia Pl NE, Albuquerque, NM
Europe Raw Cotton Imports in 1858, 1864 and Charles Joseph Minard
 1 Europe Raw Cotton Imports in 1858, 1864 and 1865 - Charles Joseph Minard - 1866 Language Communities of Twitter - Eric Fischer - 2012 2 Stream of Scientific Collaborations between World Cities - Olivier
Open Source Software Education in Texas
 Open Source Software Education in Texas PHILLIP DAVIS / RICHARD SMITH GEOACADEMY The Challenge for Open Source Adoption OPEN SOURCE Less the 5% of US colleges and universities offer training in Free and
Mapping the Structure and Evolution of Chemistry Research
 Mapping the Structure and Evolution of Chemistry Research Kevin W. Boyack *, Katy Börner ** and Richard Klavans *** * kboyack@mapofscience.com * Sandia National Laboratories, P.O. Box 5800, MS-1316, Albuquerque,
113 Years of Physical Review: Using Flow Maps to Show Temporal and Topical Citation Patterns
 113 Years of Physical Review: Using Flow Maps to Show Temporal and Topical Citation Patterns Bruce W. Herr II, Russell J. Duhon, Katy Börner, Elisha F. Hardy, Shashikant Penumarthy Cyberinfrastructure
Design and Update of a Classification System: The UCSD Map of Science
 Design and Update of a Classification System: The UCSD Map of Science Katy Börner 1,2 *, Richard Klavans 3, Michael Patek 3, Angela M. Zoss 1, Joseph R. Biberstine 1, Robert P. Light 1, Vincent Larivière
GIS Visualization: A Library s Pursuit Towards Creative and Innovative Research
 GIS Visualization: A Library s Pursuit Towards Creative and Innovative Research Justin B. Sorensen J. Willard Marriott Library University of Utah justin.sorensen@utah.edu Abstract As emerging technologies
New Directions in Computer Science
 New Directions in Computer Science John Hopcroft Cornell University Time of change The information age is a revolution that is changing all aspects of our lives. Those individuals, institutions, and nations
Joanne N. Halls, PhD Dept. of Geography & Geology David Kirk Information Technology Services
 Joanne N. Halls, PhD Dept. of Geography & Geology David Kirk Information Technology Services Geographic Information Systems manage and analyze data to solve spatial problems. Real World Abstraction Analysis
Mapping research topics using word-reference co-occurrences: A method and an exploratory case study
 Jointly published by Akadémiai Kiadó, Budapest Scientometrics, Vol. 68, No. 3 (2006) 377 393 and Springer, Dordrecht Mapping research topics using word-reference co-occurrences: A method and an exploratory
Telescopes and Observatories. Parent Guide, page 1 of 2. OurStory: Exploring the Sky. Read the Directions sheets for step-by-step instructions.
 Parent Guide, page 1 of 2 Read the Directions sheets for step-by-step instructions. SUMMARY In this activity, children and adults will watch and discuss a short video about how people use telescopes. WHY
WHAT YOU WILL LEARN TODAY
 WHAT YOU WILL LEARN TODAY Overview of the new QGIS Academy Curriculum Background on curriculum development Curriculum alignment with national standards Description of the five GIS courses Details of the
WHAT YOU WILL LEARN TODAY
 WHAT YOU WILL LEARN TODAY Overview of the new GeoAcademy Curriculum Background on curriculum development Curriculum alignment with national standards Description of the five GIS courses Details of the
Programme Specification MSc in Cancer Chemistry
 Programme Specification MSc in Cancer Chemistry 1. COURSE AIMS AND STRUCTURE Background The MSc in Cancer Chemistry is based in the Department of Chemistry, University of Leicester. The MSc builds on the
Archaeology & Digital Humanities
 WAYNE STATE UNIVERSITY Archaeology & Digital Humanities The D.I.R.T. on Big Data STRENGTHENING THE BIG DATA & ANALYTICS ECOSYSTEM WAYNE STATE UNIVERSITY Krysta Ryzewski Associate Professor of Anthropology
DEKDIV: A Linked-Data-Driven Web Portal for Learning Analytics Data Enrichment, Interactive Visualization, and Knowledge Discovery
 DEKDIV: A Linked-Data-Driven Web Portal for Learning Analytics Data Enrichment, Interactive Visualization, and Knowledge Discovery Yingjie Hu, Grant McKenzie, Jiue-An Yang, Song Gao, Amin Abdalla, and
Applicability of Lotka s Law in Astronomy & Astrophysics Research of India
 University of Nebraska - Lincoln DigitalCommons@University of Nebraska - Lincoln Library Philosophy and Practice (e-journal) Libraries at University of Nebraska-Lincoln January 2019 Applicability of Lotka
o f f i c e o f f r resear 2 o research l t a r 0c u 09 n po n e a r
 u n i v er s i t y o f office f l o r i d a of report a n n ua l 2009 research o f f i c e o f r e s e a r c h The 2008-09 fiscal year was a testament to the commitment and creativity of University of
Surveying, Mapping and Remote Sensing (LIESMARS), Wuhan University, China
, Wuhan University, China") Name: Peng Yue Title: Professor and Director, Institute of Geospatial Information and Location Based Services (IGILBS) Associate Chair, Department of Geographic Information Engineering School of Remote
Name: Peng Yue Title: Professor and Director, Institute of Geospatial Information and Location Based Services (IGILBS) Associate Chair, Department of Geographic Information Engineering School of Remote
CURRICULUM VITAE Roman V. Krems
 CURRICULUM VITAE Roman V. Krems POSTAL ADDRESS: Department of Chemistry, University of British Columbia 2036 Main Mall, Vancouver, B.C. Canada V6T 1Z1 Telephone: +1 (604) 827 3151 Telefax: +1 (604) 822
Student Handout. Write the map s title in the northwest corner of the map. How many picnic areas does the park have? Write the answer near the legend.
 Student Handout 1F Cards Write the map s title in the northwest corner of the map. How many picnic areas does the park have? Write the answer near the legend. 1 2 Draw a compass rose near the west edge
Multidisciplinary/Interdisciplinary Research and Education
 Multidisciplinary/Interdisciplinary Research and Education Sushil Prasad Program Director Learning and Workforce Development Activities Sushil K Prasad, Office of Advanced Cyberinfrastructure sprasad@nsf.gov
Long-Distance Interdisciplinarity Leads to Higher Scientific Impact
 RESEARCH ARTICLE Long-Distance Interdisciplinarity Leads to Higher Scientific Impact Vincent Larivière 1,2 *, Stefanie Haustein 1, Katy Börner 3 1 École de bibliothéconomie et des sciences de l information,
GST Geosciences in Space and Time
 A TEAM COLLABORATION TOOL AND PLATFORM TO SHARE 3D GEOMODELS GST Geosciences in Space and Time Paul Gabriel 1,2, Jan Gietzel 1,2, Helmut Schaeben 2 1 GiGa infosystems, Freiberg, Germany 2 Geophysics and
²Austrian Center of Competence for Tribology, AC2T research GmbH, Viktor-Kaplan-Straße 2-C, A Wiener Neustadt, Austria
 Bibliometric field delineation with heat maps of bibliographically coupled publications using core documents and a cluster approach - the case of multiscale simulation and modelling (research in progress)
Conference panel Session 98, Defining Data Professionals A Geospatial Industry Perspective on Becoming a Data Professional
 Conference panel Session 98, Defining Data Professionals A Geospatial Industry Perspective on Becoming a Data Professional Dawn J. Wright, Environmental Systems Research Institute (aka Esri), Redlands,
Swiss SKA Day May 18, Welcome to Ecole Polytechnique Fédérale de Lausanne EPFL. Karl Aberer, Vice-president for Information Systems
 Swiss SKA Day May 18, 2016 Welcome to Ecole Polytechnique Fédérale de Lausanne EPFL Karl Aberer, Vice-president for Information Systems EPFL EPFL Presentation 03.2015 05.2016 1 EPFL History 1968 Act on
Quadratic Application Problems
 Name Quadratic Application Problems 1. A roof shingle is dropped from a rooftop that is 100 feet above the ground. The height y (in feet) of the dropped roof shingle is given by the function y = -16t 2
Background. A Transformation from Traditional College Algebra to Freudenthal College Algebra. Background. Traditional
 A Transformation from Traditional College Algebra to Freudenthal College Algebra Monica Geist, Ph.D. Front Range Community College monica.geist@frontrange.edu Background Started teaching College Algebra
CONTENT. 2 Subject Aims 2. 6 Assessment Strategies 5. 7 Maintaining Standards 5. 9 Annexes 8
 CONTENT Page No Foreword III 1 Introduction 1 1.1 Subject Benchmark statement 1 1.2 Nature and Extent of the Subject 2 2 Subject Aims 2 3 Subject Knowledge and Understanding 3 4 Skills and Attitudes 4
Geospatial Science and Technology Model Courses and Certificate:
 Geospatial Science and Technology Model Courses and Certificate: Guidelines and Tools to Align Curriculum to Workforce Needs Ann Johnson Associate Director gisajohnson@delmar.edu Funded by National Science
RESEARCH PRODUCTIVITY OF PHYSICAL SCIENCE DISCIPLINES IN SAMBALPUR UNIVERSITY (ORISSA): A SCIENTOMETRIC STUDY
: A SCIENTOMETRIC STUDY") RESEARCH PRODUCTIVITY OF PHYSICAL SCIENCE DISCIPLINES IN SAMBALPUR UNIVERSITY (ORISSA): A SCIENTOMETRIC STUDY Sabitri Majhi, Lecturer, P.G. Department of Library and Information Science, Sambalpur University,
RESEARCH PRODUCTIVITY OF PHYSICAL SCIENCE DISCIPLINES IN SAMBALPUR UNIVERSITY (ORISSA): A SCIENTOMETRIC STUDY Sabitri Majhi, Lecturer, P.G. Department of Library and Information Science, Sambalpur University,
Phase 1 Cards. Phase 1. Phase 1. How many picnic areas does the park have? Write the answer near the legend.
 S T U D E N T H A N D O U T F Cards Write the map s title in the northwest corner above the map. How many picnic areas does the park have? Write the answer near the legend. 1 2 Draw a compass rose near
Mapping of Science. Bart Thijs ECOOM, K.U.Leuven, Belgium
 Mapping of Science Bart Thijs ECOOM, K.U.Leuven, Belgium Introduction Definition: Mapping of Science is the application of powerful statistical tools and analytical techniques to uncover the structure
NATIONAL GEOGRAPHIC VISUAL ATLAS OF THE WORLD PDF
 NATIONAL GEOGRAPHIC VISUAL ATLAS OF THE WORLD PDF ==> Download: NATIONAL GEOGRAPHIC VISUAL ATLAS OF THE WORLD PDF NATIONAL GEOGRAPHIC VISUAL ATLAS OF THE WORLD PDF - Are you searching for National Geographic
Your web browser (Safari 7) is out of date. For more security, comfort and. the best experience on this site: Update your browser Ignore
 is out of date. For more security, comfort and. the best experience on this site: Update your browser Ignore") Your web browser (Safari 7) is out of date. For more security, comfort and Activitydevelop the best experience on this site: Update your browser Ignore Places in the Park Why do we use symbols? Overview
Your web browser (Safari 7) is out of date. For more security, comfort and Activitydevelop the best experience on this site: Update your browser Ignore Places in the Park Why do we use symbols? Overview
WELCOME TO GCSE GEOGRAPHY WHERE WILL IT TAKE US TODAY?
 WELCOME TO GCSE GEOGRAPHY WHERE WILL IT TAKE US TODAY? What is our challenge? X WHAT IS THE GLOBAL PATTERN OF URBAN GROWTH? TOPIC 5: URBAN FUTURES 5.1: WHY DO MORE THAN HALF OF THE WORLD S POPULATION
1 What s Way Out There? The Hubble Ultra Deep Field
 ENGAGING IN ASTRONOMICAL INQUIRY 5 1 What s Way Out There? The Hubble Ultra Deep Field Big Idea: The Hubble Space Telescope image Hubble Ultra Deep Field reveals a variety of previously unknown objects
BIG IDEAS. Area of Learning: SCIENCE Physics Grade 11. Learning Standards. Curricular Competencies
 Area of Learning: SCIENCE Physics Grade 11 BIG IDEAS An object s motion can be predicted, analyzed, and described. Forces influence the motion of an object. Energy is found in different forms, is conserved,
Visualizing the Evolution of a Subject Domain: A Case Study
 Visualizing the Evolution of a Subject Domain: A Case Study Chaomei Chen Brunel University Leslie Carr Southampton University Abstract We explore the potential of information visualization techniques in
Outline of mathematics From Wikipedia, the free encyclopedia
 Page 1 of 8 Outline of mathematics From Wikipedia, the free encyclopedia The following outline is provided as an overview of and topical guide to mathematics: Mathematics is a field of study that investigates
ENGINEERING CHEMISTRY 1 BY SS DARA
 page 1 / 5 page 2 / 5 engineering chemistry 1 by pdf View the most recent ACS Editors' Choice articles from Industrial & Engineering Chemistry Research.. See all Industrial & Engineering Chemistry Research
Hayward, P. (2007). Mexican-American assimilation in U.S. metropolitan areas. The Pennsylvania Geographer, 45(1), 3-15.
. Mexican-American assimilation in U.S. metropolitan areas. The Pennsylvania Geographer, 45(1), 3-15.") PETER HAYWARD Assistant Professor of Geography and GIS Faculty Fellow SUNY College at Oneonta 323 Milne Library Oneonta, NY 13820 Phone: 607-436-3398 Email: haywarpm@oneonta.edu Web: http://employees.oneonta.edu/haywarpm
PETER HAYWARD Assistant Professor of Geography and GIS Faculty Fellow SUNY College at Oneonta 323 Milne Library Oneonta, NY 13820 Phone: 607-436-3398 Email: haywarpm@oneonta.edu Web: http://employees.oneonta.edu/haywarpm
Many Ways to Name a Place
 Your web browser (Safari 7) is out of date. For more security, comfort and Activityapply the best experience on this site: Update your browser Ignore Many Ways to Name a Place What are the names for the
Exhibit Explanation. Places & Spaces: Mapping Science On Display at the Monroe County Public Library May 1 May 30, General Introduction
 Places & Spaces: Mapping Science On Display at the Monroe County Public Library May 1 May 30, 2007 Exhibit Explanation General Introduction Cartographic maps of physical places have guided mankind s explorations
In the spring of 2016, the American Philosophical Society s
 Introduction to the Symposium on Observed Climate Change 1 WARREN M. WASHINGTON Senior Scientist, Climate Change Research Section National Center for Atmospheric Research In the spring of 2016, the American
RSC Analytical Division Strategy
 RSC Analytical Division Strategy 2013-2017 The Analytical Division aims to promote and support analytical chemistry at all levels from public outreach and school education to the most innovative and cutting
1-6 Enrichment Absolute Value Equations And
 1-6 Enrichment Absolute Value Equations And Inequalities Answers Amsco's Tests, Enrichment Activities, SAT Prep Worksheets and NYS Curriculum Correlations tied to the 1-4, Solving Absolute Value Equations
Computational Biology, University of Maryland, College Park, MD, USA
 1 Data Sharing in Ecology and Evolution: Why Not? Cynthia S. Parr 1 and Michael P. Cummings 2 1 Institute for Advanced Computer Studies, 2 Center for Bioinformatics and Computational Biology, University
Integrated CME Project Mathematics I-III 2013
 A Correlation of -III To the North Carolina High School Mathematics Math I A Correlation of, -III, Introduction This document demonstrates how, -III meets the standards of the Math I. Correlation references
The Neutron Scattering Society of America
 The Neutron Scattering Society of America www.neutronscattering.org Press Release, February 4, 2008 The Neutron Scattering Society of America is pleased to announce the 2008 recipients of its 3 major prizes.
o f f i c e o f r e s e a r c h
 o f f i c e o f r e s e a r c h Despite concern about the state of the world economy, the continued success of science to produce new ideas and new solutions gives us reason for optimism. The U.S. research
A Basic Guide to NMR. James N. Shoolery. DOI: /sl2nmr08.012
 A Basic Guide to NMR by James N. Shoolery DOI: 10.3247/sl2nmr08.012 Title: Author: A Basic Guide to NMR James N. Shoolery Publishers: First Edition: Varian Associates, Palo Alto, CA, USA, 1972. Second
XXIII CONGRESS OF ISPRS RESOLUTIONS
 XXIII CONGRESS OF ISPRS RESOLUTIONS General Resolutions Resolution 0: Thanks to the Czech Society commends: To congratulate The Czech Society, its president and the Congress Director Lena Halounová, the
Contents. To the Teacher... v
 Katherine & Scott Robillard Contents To the Teacher........................................... v Linear Equations................................................ 1 Linear Inequalities..............................................
The GapVis project and automated textual geoparsing
 The GapVis project and automated textual geoparsing Google Ancient Places team, Edinburgh Language Technology Group GeoBib Conference, Giessen, 4th-5th May 2015 1 1 Google Ancient Places and GapVis The
Visualisation of knowledge domains in interdisciplinary research organizations
 Neversdorf, September 2010 Visualisation of knowledge domains in interdisciplinary research organizations Ismael Rafols 1,2 1 SPRU -- Science and Technology Policy Research University of Sussex, Brighton,
Harvard Center for Geographic Analysis Geospatial on the MOC
 2017 Massachusetts Open Cloud Workshop Boston University Harvard Center for Geographic Analysis Geospatial on the MOC Ben Lewis Harvard Center for Geographic Analysis Aaron Williams MapD Small Team Supporting
1. Omit Human and Physical Geography electives (6 credits) 2. Add GEOG 677:Internet GIS (3 credits) 3. Add 3 credits to GEOG 797: Final Project
 2. Add GEOG 677:Internet GIS (3 credits) 3. Add 3 credits to GEOG 797: Final Project") The Department of Geography and the Office of Professional Studies propose to modify the Master of Professional Studies in Geospatial Information Sciences (GIS) as follows: 1. Omit Human and Physical Geography
The Department of Geography and the Office of Professional Studies propose to modify the Master of Professional Studies in Geospatial Information Sciences (GIS) as follows: 1. Omit Human and Physical Geography
ACS Green Chemistry Institute. ACS Green Chemistry Institute
 American Chemical Society Advancing Green Chemistry Innovation in the Pharmaceutical Industry: The ACS GCI Pharmaceutical Roundtable s Research Grant Program Julie B. Manley Guiding Green LLC Contracted
Geospatial Services in Special Libraries: A Needs Assessment Perspective
 Purdue University Purdue e-pubs Libraries Faculty and Staff Scholarship and Research Purdue Libraries 5-17-2013 Geospatial Services in Special Libraries: A Needs Assessment Perspective Ilana R. Barnes
Educating Future Scientists in Green Chemistry/Sustainability: Preparing the Workforce
 Educating Future Scientists in Green Chemistry/Sustainability: Preparing the Workforce Jane E. Wissinger Department of Chemistry University of Minnesota The Midwest Bioeconomy and Safer Products Summit:
Professional Development Grant Final Report. Attend and Present at the Annual Meeting of the Geological Society of America
 Professional Development Grant Final Report Attend and Present at the Annual Meeting of the Geological Society of America Michael G. Davis, Ph.D. Department of Physical Sciences College of Natural and
ACS PUBLICATIONS. Over a Century of Essential Chemistry on Your Desktop
 ACS PUBLICATIONS Over a Century of Essential Chemistry on Your Desktop Special Libraries Association Chemistry Division Vendor Roundtable Monday, June 10, 2002 Los Angeles Convention Center, Room 408 B
A Correlation of. Student Activity Book. to the Common Core State Standards for Mathematics. Grade 2
 A Correlation of Student Activity Book to the Common Core State Standards for Mathematics Grade 2 Copyright 2016 Pearson Education, Inc. or its affiliate(s). All rights reserved Grade 2 Units Unit 1 -
The College Mathematics Journal, Vol. 24, No. 4. (Sep., 1993), pp
, pp") Taylor Polynomial Approximations in Polar Coordinates Sheldon P. Gordon The College Mathematics Journal, Vol. 24, No. 4. (Sep., 1993), pp. 325-330. Stable URL: http://links.jstor.org/sici?sici=0746-8342%28199309%2924%3a4%3c325%3atpaipc%3e2.0.co%3b2-m
Taylor Polynomial Approximations in Polar Coordinates Sheldon P. Gordon The College Mathematics Journal, Vol. 24, No. 4. (Sep., 1993), pp. 325-330. Stable URL: http://links.jstor.org/sici?sici=0746-8342%28199309%2924%3a4%3c325%3atpaipc%3e2.0.co%3b2-m
Earth. Planets. Climate. Life.
 Earth. Planets. Climate. Life. THE DEPARTMENT OF EARTH, ATMOSPHERIC AND PLANETARY SCIENCES Massachusetts Institute of Technology From our earliest history, humans have marveled at the planet we call home,