Interactive Maps of S&T
|
|
|
- Posy Osborne
- 6 years ago
- Views:
Transcription


1 Interactive Maps of S&T Katy Börner Cyberinfrastructure for Network Science Center, Director Information Visualization Laboratory, Director School of Library and Information Science Indiana University, Bloomington, IN With special thanks to the members at the Cyberinfrastructure for Network Science Center and the Mapping Science exhibit advisory board. International Symposium on Science of Science and Innovation Policy Toward Synergetic Collaborations and Realization of Innovation The University of Tokyo, Tokyo, Japan December 13, 2012 Find your way Black Box Take terra bytes of data Find collaborators, friends Identify trends 2


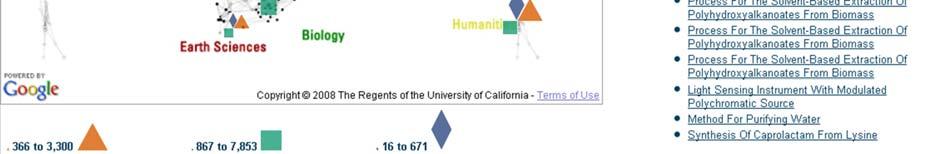
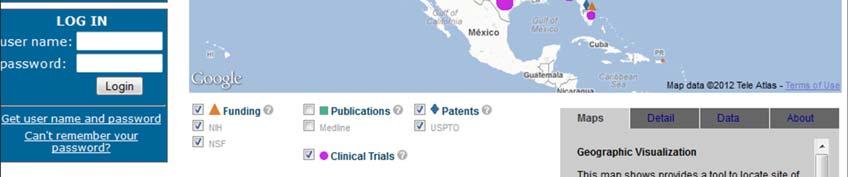
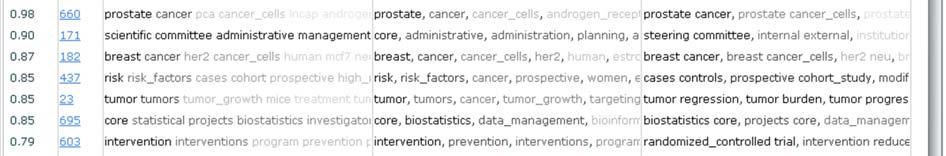
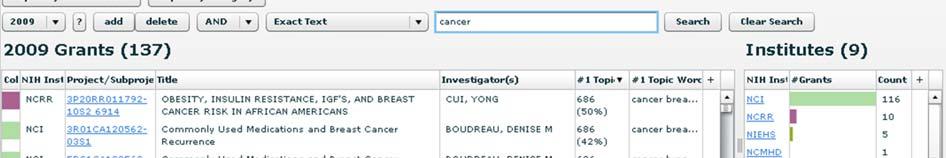
2 3 Google Map JavaScript API was used to implement both maps with two aggregation layers for each. The geographic map aggregates to the state level and the city level. The science map has a high level of aggregation of 13 top-level scientific disciplines and a low level of 554 sub-disciplines. 4

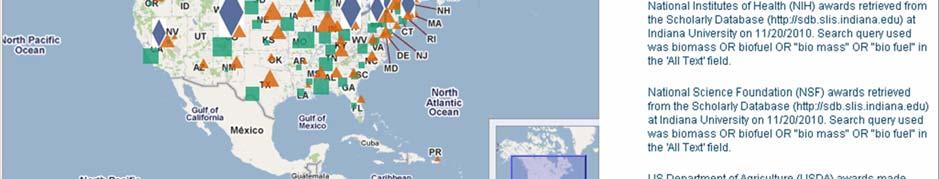


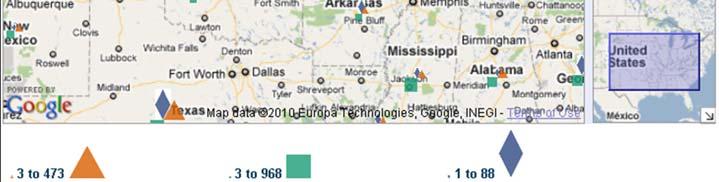
3 The geographic map at state level. 5 The geographic map at city level. 6


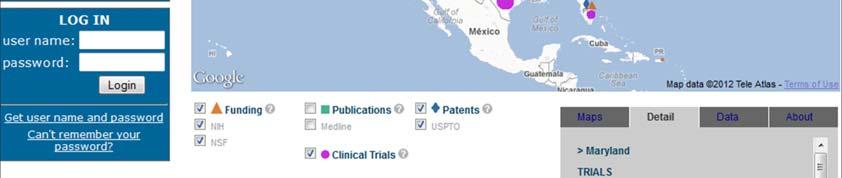
4 Search result for corn Icons have same size but represent different #records 7 Click on one icon to display all records of one type. Here publications in the state of Florida. 8


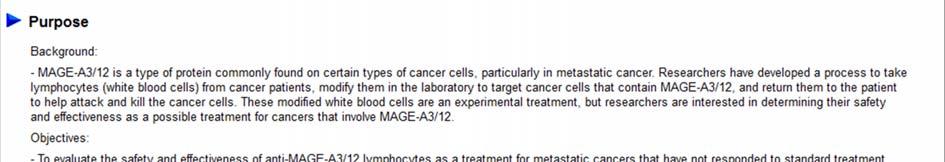
5 Detailed information on demand via original source site for exploration and study. 9 Search result for Miscanthus, a special energy biomass crops for second generation biofuel. 10


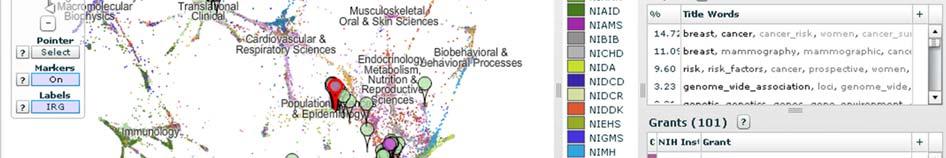
6 The science map at 13 top-level scientific disciplines level. 11 The science map at 554 sub-disciplines level. 12


7 13 14


8


9


10 20


11


 A")


12 Geospatial Analysis (Where) A geospatial map of the US is used to show where what science is performed by whom. 23 Topical Analysis (What) Science map overlays show where a person, department, or university publishes most in the world of science. 24
, 60-69.")


13 Börner, Katy. (March 2011). Plug-and-Play Macroscopes. Communications of the ACM, 54(3), Video and paper are at 25 Sci 2 Tool Open Code for S&T Assessment OSGi/CIShell powered tool with NWB plugins and many new scientometrics and visualizations plugins. Sci Maps GUESS Network Vis Horizontal Time Graphs Börner, Katy, Huang, Weixia (Bonnie), Linnemeier, Micah, Duhon, Russell Jackson, Phillips, Patrick, Ma, Nianli, Zoss, Angela, Guo, Hanning & Price, Mark. (2009). Rete-Netzwerk-Red: Analyzing and Visualizing Scholarly Networks Using the Scholarly Database and the Network Workbench Tool. Proceedings of ISSI 2009: 12th International Conference on Scientometrics and Informetrics, Rio de Janeiro, Brazil, July Vol. 2, pp


/ ER")
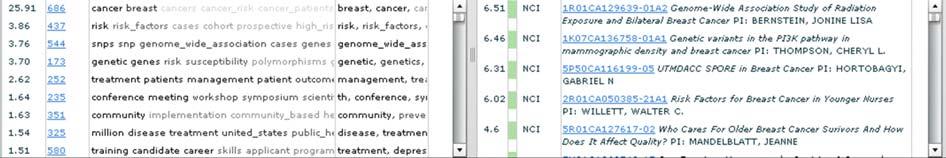
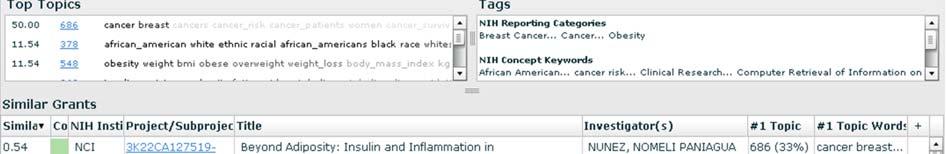
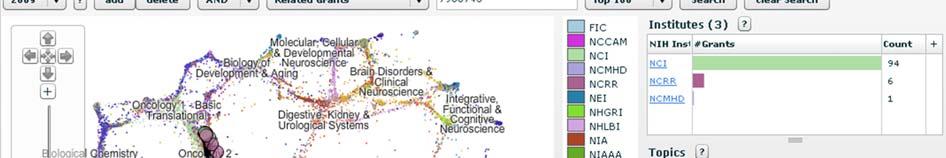
14 Sci 2 Tool Geo Maps Circular Hierarchy Sci 2 Tool Usage at National Institutes of Health Sci2 Tool now supports Web services and serves as a visual interface to publically available NIH RePORT Expenditure and Results RePORTER)/ RePORTER data provided by NIH. 28


15 Sci 2 Tool Usage at National Institutes of Health NETE A V Temporal Analysis Find and select one or multiple PIs 29 Sci 2 Tool Usage at National Institutes of Health Visualize portfolio of projects on the timescale o Projects with award amounts o Projects by IC funding o Projects by PIs NETE A V Temporal Analysis 30


16 Sci 2 Tool Usage at National Institutes of Health NETE A V Temporal Analysis Projects with Award Amounts Four variable visualizations, e.g. time, amounts, PIs and projects 31 Sci 2 Tool Usage at National Institutes of Health NETE A V Geospatial Analysis Projects by External Organization 32


17 Sci 2 Tool Usage at National Institutes of Health NETE A V Topical Analysis Publications in a Project Portfolio 33 Sci 2 Tool Usage at National Institutes of Health NETE A V Network Analysis (Co ) PIs to Projects 34


.")
18 Science of Science Research and Practice" Tutorial Time/Date: 9:00am-12:30pm on December 14, 2012 Place: Building #73 on map, Room 213, Eng Bldg #2, Hongo Campus, Univ of Tokyo Instructor: Dr. Katy Börner, SLIS, Indiana University Format: Lecture and hands-on training. Please bring your laptop and pre-install the tool (free download at Links: Reference: Börner, Katy. (2010). Atlas of Science: Visualizing What We Know. The MIT Press. ( 35 Interested to Learn More? Take the IVMOOC 36
, ARIST, Medford, NJ: Information Today, Volume 37, Chapter 5, pp. 179-255.")
 (2004). Mapping Knowledge Domains.")

, ARIST, Information Today, Inc.")
 Atlas of Science. MIT Press. http://scimaps.")
.")
19 References Börner, Katy, Chen, Chaomei, and Boyack, Kevin. (2003). Visualizing Knowledge Domains. In Blaise Cronin (Ed.), ARIST, Medford, NJ: Information Today, Volume 37, Chapter 5, pp borner-arist.pdf Shiffrin, Richard M. and Börner, Katy (Eds.) (2004). Mapping Knowledge Domains. Proceedings of the National Academy of Sciences of the United States of America, 101(Suppl_1). Börner, Katy, Sanyal, Soma and Vespignani, Alessandro (2007). Network Science. In Blaise Cronin (Ed.), ARIST, Information Today, Inc., Volume 41, Chapter 12, pp Börner, Katy (2010) Atlas of Science. MIT Press. Scharnhorst, Andrea, Börner, Katy, van den Besselaar, Peter (2012) Models of Science Dynamics. Springer Verlag. Börner, K.; Ding, Y.; Conlon, M.; Corson-Rikert, J. (2012). VIVO: A Semantic Approach to Scholarly Networking and Discovery. Morgan & Claypool Publishers. 37 Places & Spaces: Mapping Science Exhibit ( ) After eight years, there now exist 80 out of 100 maps.


20 Debut of 5 th Iteration of Mapping Science Exhibit at MEDIA X was on May 18, 2009 at Wallenberg Hall, Stanford University,


21 Science Maps in Expedition Zukunft science train visiting 62 cities in 7 months 12 coaches, 300 m long Opening was on April 23 rd, 2009 by German Chancellor Merkel zukunft.de 41 42


22 43 Ingo Gunther's Worldprocessor globe design on display at the Giant Geo Cosmos OLED Display at the Museum of Emerging Science and Innovation in Tokyo, Japan 44


23 All papers, maps, tools, talks, press are linked from CNS Facebook: Mapping Science Exhibit Facebook:
Understanding (Big) Data by Using Macroscopes
 Data by Using Macroscopes") Understanding (Big) Data by Using Macroscopes Katy Börner Cyberinfrastructure for Network Science Center, Director Information Visualization Laboratory, Director Department of Information and Library Science
Understanding (Big) Data by Using Macroscopes Katy Börner Cyberinfrastructure for Network Science Center, Director Information Visualization Laboratory, Director Department of Information and Library Science
Cartographies of Science
 Cartographies of Science Katy Börner Visiting Scientist in Dirk Helbing s Group, SOMS, ETHZ Cyberinfrastructure for Network Science Center, Director Information Visualization Laboratory, Director School
Types and Levels of Team (Network) Analysis
 Analysis") Types and Levels of Team (Network) Analysis Dr. Katy Börner Cyberinfrastructure for Network Science Center, Director Information Visualization Laboratory, Director School of Library and Information Science
Types and Levels of Team (Network) Analysis Dr. Katy Börner Cyberinfrastructure for Network Science Center, Director Information Visualization Laboratory, Director School of Library and Information Science
Human BioMolecular Atlas: Maps and Macroscopes
 Human BioMolecular Atlas: Maps and Macroscopes Katy Börner Victor H. Yngve Distinguished Professor of Information Science Director, Cyberinfrastructure for Network Science Center School of Informatics
Plug and Play Macroscopes: Empowering Anyone To Convert Data Into Insights
 Plug and Play Macroscopes: Empowering Anyone To Convert Data Into Insights Katy Börner Victor H. Yngve Distinguished Professor of Information Science Director, Cyberinfrastructure for Network Science Center
Science Maps. Different Datasets Different Analyses and Visualizations Different User Groups
 Identifying Overlap, Gaps and Emerging Research Areas Using Multi-Level Science Maps Katy Börner Cyberinfrastructure for Network Science Center, Director Information Visualization Laboratory, Director
How do we analyze and visualize science?
 Analysis and Visualization of Science Angela Zoss, M.S. Research Assistant, Cyberinfrastructurefor Network Science Center Doctoral Student, School of Library and Information Science Indiana University,
Science of Science Research and Tools Tutorial #05 of 12
 Science of Science Research and Tools Tutorial #05 of 12 Dr. Katy Börner Cyberinfrastructure for Network Science Center, Director Information Visualization Laboratory, Director School of Library and Information
Analyzing and Visualizing Science
 Analyzing and Visualizing Science Katy Börner Royal Netherlands Academy of Arts and Sciences (KNAW), The Netherlands and Cyberinfrastructure for Network Science Center, Director Information Visualization
S701 Guest ectur Lecture Dr. Katy Börner Three Readings
 S701 Guest Lecture Dr. Katy Börner Cyberinfrastructure for Network Science Center, Director Information Visualization Laboratory, Director School of Library and Information Science Indiana University,
Design and Update of a Classification System: The UCSD Map of Science
 Design and Update of a Classification System: The UCSD Map of Science Networks and Complex Systems Talk Series Indiana University, Bloomington, IN Sept 10,2012 Overview Motivation Design Validation Application
Early Maps of the World VERSUS Early Maps of Science
 2 3 Early Maps of the World VERSUS Early Maps of Science 3D n-d Physically-based Abstract space Accuracy is measurable Accuracy is difficult Trade-offs have more to do with granularity Trade-offs indirectly
Towards Effective KM Tools
 Towards Effective KM Tools Dr. Katy Börner Cyberinfrastructure for Network Science Center, Director Information Visualization Laboratory, Director School of Library and Information Science Indiana University,
Data Visualization Literacy
 Data Visualization Literacy Katy Börner @katycns Victor H. Yngve Distinguished Professor of Engineering and Information Science Director, Cyberinfrastructure for Network Science Center Indiana University
1. Science/Economy/STEM is Global and needs to be understood globally (but optimized locally).
.") STEM: Individual, Local, and Global Flows and Activity Patterns Dr. Katy Börner Cyberinfrastructure for Network Science Center, Director Information Visualization Laboratory, Director School of Library
STEM: Individual, Local, and Global Flows and Activity Patterns Dr. Katy Börner Cyberinfrastructure for Network Science Center, Director Information Visualization Laboratory, Director School of Library
Science of Science Research and Tools
 Science of Science Research and Tools Katy Börner Visiting Scientist in Dirk Helbing s Group, SOMS, ETHZ Cyberinfrastructure for Network Science Center, Director Information Visualization Laboratory, Director
Mapping the Structure
 Mapping the Structure and Dynamics of Science Dr. Katy Börner Cyberinfrastructure for Network Science Center, Director Information Visualization Laboratory, Director School of Library and Information Science
Europe Raw Cotton Imports in 1858, 1864 and Charles Joseph Minard
 1 Europe Raw Cotton Imports in 1858, 1864 and 1865 - Charles Joseph Minard - 1866 Language Communities of Twitter - Eric Fischer - 2012 2 Stream of Scientific Collaborations between World Cities - Olivier
Science of Science Maps, Tools, and Research
 Science of Science Maps, Tools, and Research Katy Börner Cyberinfrastructure for Network Science Center, Director Information Visualization Laboratory, Director School of Library and Information Science
Studying the emergent 'Global Brain' in large-scale co-author networks and mapping the 'Backbone of Science'
 Studying the emergent 'Global Brain' in large-scale co-author networks and mapping the 'Backbone of Science' Katy Börner & the InfoVis Lab School of Library and Information Science katy@indiana.edu Networks
Envisioning Biomedical Science. Biomedical Science from Above.
 Envisioning Biomedical Science Dr. Katy Börner Cyberinfrastructure for Network Science Center, Director Information Visualization Laboratory, Director School of Library and Information Science Indiana
Science Maps in Support of Scholarly Communication
 Science Maps in Support of Scholarly Communication Dr. Katy Börner Cyberinfrastructure for Network Science Center, Director Information Visualization Laboratory, Director School of Library and Information
Tutorial: Open Source Tools for Data Analysis and Visualiza9on
 Tutorial: Open Source Tools for Data Analysis and Visualiza9on Katy Börner Victor H. Yngve Professor of Informa5on Science Director, Cyberinfrastructure for Network Science Center School of Informa5cs
Plug-and-Play Macroscopes: Custom Tools for
 Plug-and-Play Macroscopes: Custom Tools for Data Analysis, Modeling, and Visualization Dr. Katy Börner Cyberinfrastructure for Network Science Center, Director Information Visualization Laboratory, Director
Mapping Interdisciplinary Research Domains
 Mapping Interdisciplinary Research Domains Katy Börner School of Library and Information Science katy@indiana.edu Presentation at the Parmenides Center for the Study of Thinking, Island of Elba, Italy
NETWORK AND TOPICAL ANALYSIS FOR THE HUMANITIES USING NWB AND SCI2
 NETWORK AND TOPICAL ANALYSIS FOR THE HUMANITIES USING NWB AND SCI2 Scott Weingart Cyberinfrastructure for Network Science Center Information Visualization Laboratory Indiana Philosophy Ontology Project
Sci2: A Tool of Science of Science Research and Practice
 Sci2: A Tool of Science of Science Research and Practice Dr. Katy Börner Cyberinfrastructure for Network Science Center Information Visualization Laboratory School of Library and Information Science Indiana
Sci2 Tool: A Tool for Science of Science Research and Practice" Tutorial
 Sci2 Tool: A Tool for Science of Science Research and Practice" Tutorial Dr. Katy Börner CNS & IVL, SLIS, Indiana University, Bloomington, Indiana, USA Royal Netherlands Academy of Arts and Sciences (KNAW),
Surveying, Mapping and Remote Sensing (LIESMARS), Wuhan University, China
, Wuhan University, China") Name: Peng Yue Title: Professor and Director, Institute of Geospatial Information and Location Based Services (IGILBS) Associate Chair, Department of Geographic Information Engineering School of Remote
Name: Peng Yue Title: Professor and Director, Institute of Geospatial Information and Location Based Services (IGILBS) Associate Chair, Department of Geographic Information Engineering School of Remote
040. Network Science: Theory, Tools, and Practice
 Börner, Katy. In Press. Network Science: Theory, Tools, and Practice. In William Sims Bainbridge, Ed. Leadership in Science and Technology: A Reference Handbook. Thousand Oaks, CA: Sage Publications 040.
Mapping the Structure and Diffusion of Scholarly Knowledge
 Mapping the Structure and Diffusion of Scholarly Knowledge Dr. Katy Börner Cyberinfrastructure for Network Science Center, Director Information Visualization Laboratory, Director School of Library and
A Map Through Time Virtual Historic Cities
 A Map Through Time Virtual Historic Cities NEW WAYS OF EXPLORING DIGITAL COLLECTIONS FLORIDA INTERNATIONAL UNIVERSITY JAMIE ROGERS Coral Gables Virtual Historic City & Unearthing St. Augustine s Colonial
Exhibit Explanation. Places & Spaces: Mapping Science On Display at the Monroe County Public Library May 1 May 30, General Introduction
 Places & Spaces: Mapping Science On Display at the Monroe County Public Library May 1 May 30, 2007 Exhibit Explanation General Introduction Cartographic maps of physical places have guided mankind s explorations
Bridging the Practices of Two Communities
 Educational Knowledge Domain Visualizations: Tools to Navigate, Understand, and Internalize the Structure of Scholarly Knowledge and Expertise Peter A. Hook http://ella.slis.indiana.edu/~pahook Mapping
Introduction to Google Mapping Tools
 Introduction to Google Mapping Tools Google s Mapping Tools Explore geographic data. Organize your own geographic data. Visualize complex data. Share your data with the world. Tell your story and educate
Esri and GIS Education
 Esri and GIS Education Organizations Esri Users 1,200 National Government Agencies 11,500 States & Regional Agencies 30,800 Cities & Local Governments 32,000 Businesses 8,500 Utilities 12,600 NGOs 11,000
Locating an Astronomy and Astrophysics Publication Set in a Map of the Full Scopus Database
 Locating an Astronomy and Astrophysics Publication Set in a Map of the Full Scopus Database Kevin W. Boyack 1 1 kboyack@mapofscience.com SciTech Strategies, Inc., 8421 Manuel Cia Pl NE, Albuquerque, NM
Design and Update of a Classification System: The UCSD Map of Science
 Design and Update of a Classification System: The UCSD Map of Science Katy Börner 1,2 *, Richard Klavans 3, Michael Patek 3, Angela M. Zoss 1, Joseph R. Biberstine 1, Robert P. Light 1, Vincent Larivière
113 Years of Physical Review: Using Flow Maps to Show Temporal and Topical Citation Patterns
 113 Years of Physical Review: Using Flow Maps to Show Temporal and Topical Citation Patterns Bruce W. Herr II, Russell J. Duhon, Katy Börner, Elisha F. Hardy, Shashikant Penumarthy Cyberinfrastructure
Introducing the WISERD Geoportal. WISERD DATA TEAM Dr Robert Berry & Dr Richard Fry, University of Glamorgan Dr Scott Orford, Cardiff University
 Introducing the WISERD Geoportal WISERD DATA TEAM Dr Robert Berry & Dr Richard Fry, University of Glamorgan Dr Scott Orford, Cardiff University WISERD What is WISERD? Wales Institute of Social and Economic
DEKDIV: A Linked-Data-Driven Web Portal for Learning Analytics Data Enrichment, Interactive Visualization, and Knowledge Discovery
 DEKDIV: A Linked-Data-Driven Web Portal for Learning Analytics Data Enrichment, Interactive Visualization, and Knowledge Discovery Yingjie Hu, Grant McKenzie, Jiue-An Yang, Song Gao, Amin Abdalla, and
Data Aggregation with InfraWorks and ArcGIS for Visualization, Analysis, and Planning
 Data Aggregation with InfraWorks and ArcGIS for Visualization, Analysis, and Planning Stephen Brockwell President, Brockwell IT Consulting, Inc. Join the conversation #AU2017 KEYWORD Class Summary Silos
No. of Days. ArcGIS 3: Performing Analysis ,431. Building 3D cities Using Esri City Engine ,859
 What s New? Creating Story Maps with ArcGIS Field Data Collection and Management Using ArcGIS Get Started with Insights for ArcGIS Introduction to GIS Using ArcGIS & ArcGIS Pro: Essential Workflow Migrating
No. of Days. ArcGIS Pro for GIS Professionals ,431. Building 3D cities Using Esri City Engine ,859
 What s New? Creating Story Maps with ArcGIS Field Data Collection and Management Using ArcGIS Get Started with Insights for ArcGIS Introduction to GIS Using ArcGIS & ArcGIS Pro: Essential Workflow Migrating
https://u.osu.edu/miller.81/ Texts 1. Required Worboys, M. and Duckham, M. (2004) GIS: A Computing Perspective. Other readings see course schedule.
 GIS: A Computing Perspective. Other readings see course schedule.") GEOGR 5212 Geospatial Databases for GIS - Spring Instructor Harvey J. Miller Lecture/lab meeting time Tuesdays 3:55PM - 5:15PM, Denney Hall 238 and location (classroom) Thursdays 3:55PM - 5:15PM Derby
GEOGR 5212 Geospatial Databases for GIS - Spring Instructor Harvey J. Miller Lecture/lab meeting time Tuesdays 3:55PM - 5:15PM, Denney Hall 238 and location (classroom) Thursdays 3:55PM - 5:15PM Derby
GED 554 IT & GIS INTRODUCTION TO THE COURSE CHAPTER 1
 GED 554 IT & GIS INTRODUCTION TO THE COURSE CHAPTER 1 March 1, 2013 Lines before starting class 1. Initial Introductions 2. Usage of the building 3. Assistance 4. Timetable 5. Curriculum 6. Introduction
Global Geospatial Information Management Country Report Finland. Submitted by Director General Jarmo Ratia, National Land Survey
 Global Geospatial Information Management Country Report Finland Submitted by Director General Jarmo Ratia, National Land Survey Global Geospatial Information Management Country Report Finland Background
PROFITstar eseries Training
 PROFITstar eseries Training Inexpensive, Quality Education, FAST! Enjoy innovative learning opportunities and quality training without leaving the convenience of your local office. eseries training from
Geographic Data Science - Lecture II
 Geographic Data Science - Lecture II (New) Spatial Data Dani Arribas-Bel "Yesterday" Introduced the (geo-)data revolution What is it? Why now? The need of (geo-)data science to make sense of it all Today
GIS Visualization: A Library s Pursuit Towards Creative and Innovative Research
 GIS Visualization: A Library s Pursuit Towards Creative and Innovative Research Justin B. Sorensen J. Willard Marriott Library University of Utah justin.sorensen@utah.edu Abstract As emerging technologies
Cartographic and Geospatial Futures
 Cartographic and Geospatial Futures 1. Web Cartography, WebGIS, & Virtual Globes--New Roles for Maps, GIS, and GIS professionals 2. Map Mashups, the Neo Neo-geography Movement, & Crowd-sourcing Geospatial
SCAUG Community Maps Building a Living Atlas of the World
 SCAUG Community Maps Building a Living Atlas of the World Mark Stewart Topics: SCAUG ArcGIS Online Overview Community Maps Overview Community Maps Workflow Update Process Utilizing Your Contribution Community
USDA CropScape Data Resources
 USDA CropScape Data Resources Zhengwei Yang, Claire Boryan, Rick Mueller USDA National Agricultural Statistics Service, Washington, DC 20250, USA Collaborators: Liping Di, Weiguo Han Center for Spatial
Chapter 10: The Future of GIS Why Speculate? 10.2 Future Data 10.3 Future Hardware 10.4 Future Software 10.5 Some Future Issues and Problems
 Chapter 10: The Future of GIS 10.1 Why Speculate? 10.2 Future Data 10.3 Future Hardware 10.4 Future Software 10.5 Some Future Issues and Problems Theme of the Course GIS's place in understanding geographic
FAO GAEZ Data Portal
 FAO GAEZ Data Portal www.fao.org/nr/gaez Renato Cumani Environment Officer Land and Water Division Natural Resources Management and Environment Department Food and Agriculture Organization of the UN October
geographic patterns and processes are captured and represented using computer technologies
 Proposed Certificate in Geographic Information Science Department of Geographical and Sustainability Sciences Submitted: November 9, 2016 Geographic information systems (GIS) capture the complex spatial
No. of Days. Building 3D cities Using Esri City Engine ,859. Creating & Analyzing Surfaces Using ArcGIS Spatial Analyst 1 7 3,139
 Q3 What s New? Creating and Editing Data with ArcGIS Pro Editing and Maintaining Parcels Using ArcGIS Spatial Analysis Using ArcGIS Pro User Workflows for ArcGIS Online Organizations Q3-2018 ArcGIS Desktop
Department Of Geography. MSc Applied GIS.
 Department Of Geography. MSc Applied GIS. This is a really exciting time to be in GIS, with new tools and new software allowing the application of GIS techniques to an ever-increasing range of fields.
Enhanced Mapping. RP Data Professional. What you will learn in this guide. CoreLogic RP Data Professional Getting Started Guide Series
 RP Data Professional Enhanced Mapping What you will learn in this guide This guide will show you how to use RP Data Professional enhanced mapping capabilities to research and present details about a target
Your web browser (Safari 7) is out of date. For more security, comfort and. the best experience on this site: Update your browser Ignore
 is out of date. For more security, comfort and. the best experience on this site: Update your browser Ignore") Your web browser (Safari 7) is out of date. For more security, comfort and Activityengage the best experience on this site: Update your browser Ignore Introduction to GIS What is a geographic information
Your web browser (Safari 7) is out of date. For more security, comfort and Activityengage the best experience on this site: Update your browser Ignore Introduction to GIS What is a geographic information
Big Data and Geospatial Cyberinfrastructure for Advancing Applications
 Big Data and Geospatial Cyberinfrastructure for Advancing Applications Presented at GIScience 2012 Big Data and CyberGIS Panel Budhendra Bhaduri September 20, 2012 Columbus, OH Geospatial Cyberinfrastructure
COURSE INTRODUCTION & COURSE OVERVIEW
 week 1 COURSE INTRODUCTION & COURSE OVERVIEW topics of the week Instructor introduction Students introductions Course logistics Course objectives Definition of GIS The story of GIS introductions Who am
Geospatial Analysis in Cultural Anthropology
 Eduardo Brondizio (ebrondiz@ufl.edu) Tracy Van Holt (tvanholt@ufl.edu) Geospatial Analysis in Cultural Anthropology Description and Objectives: This intensive course introduces different components of
JOB DESCRIPTION. Research Associate - Urban Economy and Employment
 JOB DESCRIPTION Research Associate - Urban Economy and Employment 2 Research Associate Urban Economy and Employment About Us The Indian Institute for Human Settlements (IIHS) is a national education institution
Before starting. David Joseph Please try opening PostScript test - chessboard.ps
 Before starting A copy of these slides and all other materials you will need during this tutorial can be obtained from any of the DVDs or USB memory sticks being passed around right now Please register,
Perseverance. Experimentation. Knowledge.
 2410 Intuition. Perseverance. Experimentation. Knowledge. All are critical elements of the formula leading to breakthroughs in chemical development. Today s process chemists face increasing pressure to
Mapping the Structure and Evolution of Chemistry Research
 Mapping the Structure and Evolution of Chemistry Research Kevin W. Boyack *, Katy Börner ** and Richard Klavans *** * kboyack@mapofscience.com * Sandia National Laboratories, P.O. Box 5800, MS-1316, Albuquerque,
Data Aggregation with InfraWorks and ArcGIS for Visualization, Analysis, and Planning
 CI125230 Data Aggregation with InfraWorks and ArcGIS for Visualization, Analysis, and Planning Stephen Brockwell Brockwell IT Consulting Inc. Sean Kinahan Brockwell IT Consulting Inc. Learning Objectives
Open Source Software Education in Texas
 Open Source Software Education in Texas PHILLIP DAVIS / RICHARD SMITH GEOACADEMY The Challenge for Open Source Adoption OPEN SOURCE Less the 5% of US colleges and universities offer training in Free and
INTEGRATING GEOSPATIAL PERSPECTIVES IN THE ANTHROPOLOGY CURRICULUM AT THE UNIVERSITY OF NEW MEXICO (UNM)
") INTEGRATING GEOSPATIAL PERSPECTIVES IN THE ANTHROPOLOGY CURRICULUM AT THE UNIVERSITY OF NEW MEXICO (UNM) VERONICA ARIAS HEATHER RICHARDS JUDITH VAN DER ELST DEPARTMENT OF ANTHROPOLOGY MARCH 2005 INTEGRATING
INTEGRATING GEOSPATIAL PERSPECTIVES IN THE ANTHROPOLOGY CURRICULUM AT THE UNIVERSITY OF NEW MEXICO (UNM) VERONICA ARIAS HEATHER RICHARDS JUDITH VAN DER ELST DEPARTMENT OF ANTHROPOLOGY MARCH 2005 INTEGRATING
FOSS4G 2010 presented by OSGeo Proposal
 FOSS4G 2010 presented by OSGeo Proposal About OSGeo China The China Chapter of OSGeo is formed by Chinese Active Users of Open Source Geospatial Software, hosted by National Remote Sensing Center of China
Data Sonification for Users with Visual Impairment: A Case Study with Geo-referenced Data. Haixia Zhao, Catherine Plaisant, Ben Shneiderman
 Data Sonification for Users with Visual Impairment: A Case Study with Geo-referenced Data Haixia Zhao, Catherine Plaisant, Ben Shneiderman University of Maryland Jonathan Lazar Towson University Data Sonification
POLIMI Progress Report
 Project Meeting, 18 July 2018, Turin POLIMI Progress Report Maria Antonia Brovelli, Candan Eylül Kilsedar, Monia Elisa Molinari, Daniele Oxoli PRIN PROJECT: URBAN GEOmatics for Bulk Information Generation,
Minnesota K-12 Academic Standards in Social Studies. Grade 4: Geography of North America
 Minnesota K-12 Academic s in Social Studies Grade 4: Geography of North America 4 Describe how people take 1. Democratic government action to influence a depends on informed and decision on a specific
Introduction to GIS (GEOG 401) Spring 2014, 3 credit hours
 Spring 2014, 3 credit hours") Introduction to GIS (GEOG 401) Spring 2014, 3 credit hours Instructors: Guangxing Wang, Ph.D. Email: gxwang@siu.edu Phone: (618) 453-6017 Office: 4442 Faner Hall Office hours: M& W&F 9:00am-11:00am or
Introduction to GIS (GEOG 401) Spring 2014, 3 credit hours Instructors: Guangxing Wang, Ph.D. Email: gxwang@siu.edu Phone: (618) 453-6017 Office: 4442 Faner Hall Office hours: M& W&F 9:00am-11:00am or
Purpose Study conducted to determine the needs of the health care workforce related to GIS use, incorporation and training.
 GIS and Health Care: Educational Needs Assessment Cindy Gotz, MPH, CHES Janice Frates, Ph.D. Suzanne Wechsler, Ph.D. Departments of Health Care Administration & Geography California State University Long
Crossing the Atlantic: Then and Now
 Your web browser (Safari 7) is out of date. For more security, comfort and Activitydevelop the best experience on this site: Update your browser Ignore Crossing the Atlantic: Then and Now How has the amount
CSISS Resources for Research and Teaching
 CSISS Resources for Research and Teaching Donald G. Janelle Center for Spatially Integrated Social Science University of California, Santa Barbara Montreal 26 July 2003 Workshop on Spatial Analysis for
VIRTUAL LIBRARY. EXPLORE like never before
 VIRTUAL LIBRARY EXPLORE like never before National Geographic Magazine Archive 1888-1994 National Geographic magazine is the official journal of the National Geographic Society. Recognised for some of
Tools to Assess Local Health Needs. Richard Leadbeater, Esri NACo 2011 Healthy Counties Forum December 1, 2011
 Tools to Assess Local Health Needs Richard Leadbeater, Esri NACo 2011 Healthy Counties Forum December 1, 2011 Richard Leadbeater currently holds the position of Industry Solutions Manager with Esri. He
OCEANOGRAPHIC DATA MANAGEMENT
 OCEANOGRAPHIC DATA MANAGEMENT Presented to: Environmental Disaster Data Management Meeting Russ Beard Director, National Coastal Data Development Center Interim Science Coordinator, Gulf Restoration Council
Please (1) get a name tag, (2) download the Sci2 Tool from and (3) complete the Pre-Tutorial Questionnaire
 get a name tag, (2) download the Sci2 Tool from and (3) complete the Pre-Tutorial Questionnaire") Sci2: A Tool of Science of Science Research and Practice Tutorial Dr. Katy Börner & Joseph Biberstine Cyberinfrastructure for Network Science Center Information Visualization Laboratory School of Library
Sci2: A Tool of Science of Science Research and Practice Tutorial Dr. Katy Börner & Joseph Biberstine Cyberinfrastructure for Network Science Center Information Visualization Laboratory School of Library
The Development of Historical Data Visualization a spatiotemporal web application supporting teaching and learning at the Harvard Business School
 The Development of Historical Data Visualization a spatiotemporal web application supporting teaching and learning at the Harvard Business School Giovanni Zambotti Benjamin Lewis Weihe Wendy Guan* Center
SOCIAL MEDIA IN THE COMMUNICATIONS CENTRE
 SOCIAL MEDIA IN THE COMMUNICATIONS CENTRE Karen Gordon Gordon Strategy www.gordonstrategy.ca v 1 WHAT WE ARE GOING TO TALK ABOUT TODAY T h e s o c i a l m e d i a i n c i d e n t W h a t c a n h a p p
From Research Objects to Research Networks: Combining Spatial and Semantic Search
 From Research Objects to Research Networks: Combining Spatial and Semantic Search Sara Lafia 1 and Lisa Staehli 2 1 Department of Geography, UCSB, Santa Barbara, CA, USA 2 Institute of Cartography and
Course Syllabus. Geospatial Data & Spatial Digital Technologies: Assessing Land Use/Land Cover Change in the Ecuadorian Amazon.
 Course Syllabus Geospatial Data & Spatial Digital Technologies: Assessing Land Use/Land Cover Change in the Ecuadorian Amazon Co- Instructors Dr. Carlos F. Mena, Universidad San Francisco de Quito, Ecuador
4 Limit and Continuity of Functions
 Module 2 : Limits and Continuity of Functions Lecture 4 : Limit at a point Objectives In this section you will learn the following The sequential concept of limit of a function The definition of the limit
The Case for Space in the Social Sciences
 The Case for Space in the Social Sciences Don Janelle Center for Spatially Integrated Social Science University of California, Santa Barbara Roundtable on Geographical Voices and Geographical Analysis
BASIC TECHNOLOGY Pre K starts and shuts down computer, monitor, and printer E E D D P P P P P P P P P P
 BASIC TECHNOLOGY Pre K 1 2 3 4 5 6 7 8 9 10 11 12 starts and shuts down computer, monitor, and printer P P P P P P practices responsible use and care of technology devices P P P P P P opens and quits an
an accessible interface to marine environmental data Russell Moffitt
 an accessible interface to marine environmental data Russell Moffitt The Atlas Project GOAL: To provide a single point of access to oceanographic and environmental data for use by marine resource researchers,
Mapping of Science. Bart Thijs ECOOM, K.U.Leuven, Belgium
 Mapping of Science Bart Thijs ECOOM, K.U.Leuven, Belgium Introduction Definition: Mapping of Science is the application of powerful statistical tools and analytical techniques to uncover the structure
GIS Capability Maturity Assessment: How is Your Organization Doing?
 GIS Capability Maturity Assessment: How is Your Organization Doing? Presented by: Bill Johnstone Principal Consultant Spatial Vision Group November 8, 2018 1. Motivation for Capability Maturity Models
2013 AND 2025 THE FUTURE OF GIS
 THE FUTURE OF GIS 2013 AND 2025 What is the state of geospatial computing today? What are the issues today? Unresolved problems What will geospatial computing be like in 2025? What issues will be of concern
Joanne N. Halls, PhD Dept. of Geography & Geology David Kirk Information Technology Services
 Joanne N. Halls, PhD Dept. of Geography & Geology David Kirk Information Technology Services Geographic Information Systems manage and analyze data to solve spatial problems. Real World Abstraction Analysis
GEOG 100E Introduction to Geography (5 credits)
") Bellevue College GEOG 100E Introduction to Geography (5 credits) Fall, 2010 5:30 7:40 pm T, Th Room D273 Instructor: Charles Chip Dodd Phone: 425 564-2499 E-mail: cdodd@shoreline.edu Office Hours: 4:30
Bellevue College GEOG 100E Introduction to Geography (5 credits) Fall, 2010 5:30 7:40 pm T, Th Room D273 Instructor: Charles Chip Dodd Phone: 425 564-2499 E-mail: cdodd@shoreline.edu Office Hours: 4:30
Methodological issues in the development of accessibility measures to services: challenges and possible solutions in the Canadian context
 Methodological issues in the development of accessibility measures to services: challenges and possible solutions in the Canadian context Alessandro Alasia 1, Frédéric Bédard 2, and Julie Bélanger 1 (1)
SANTA CLARA COUNTY THEMATIC ATLAS
 1 SANTA CLARA COUNTY THEMATIC ATLAS Project Overview Douglas Schenk, GIS Analyst Sampa Patra, GIS Analyst Making the Thematic Atlas 2 Brought to you by the County of Santa Clara Public Health Department,
Web 3D Service & CityGML Update
 Technische Universität Berlin Web 3D Service & CityGML Update Thomas H. Kolbe Institute for Geodesy and Geoinformation Science Berlin University of Technology kolbe@igg.tu-berlin.de 2nd of November, 2007
Harmonizing spatial databases and services at local and regional level
 Harmonizing spatial databases and services at local and regional level A. Ionita 1, M. Caian 2, V. Vassilev 3, V. Craciunescu 2, I. Nedelcu 4 1 Research Institute for Artificial Intelligence, Bucuresti,
Harvard Center for Geographic Analysis Geospatial on the MOC
 2017 Massachusetts Open Cloud Workshop Boston University Harvard Center for Geographic Analysis Geospatial on the MOC Ben Lewis Harvard Center for Geographic Analysis Aaron Williams MapD Small Team Supporting