Objectives-Based Vegetation Management
|
|
|
- Roger Parker
- 5 years ago
- Views:
Transcription


1 Objectives-Based Vegetation Management The Florida Fish and Wildlife Conservation Commission s Adaptive Management Program GEORGE OTTO, QUANTITATIVE ECOLOGIST george.otto@myfwc.com

2 OBVM has made substantial gains improving the FWCs data driven decision making capacity FWC s Protected Area System 1.5 million acres 50 different areas >60 people 2
3 Objectives-Based Vegetation Management (OBVM) OBVM is an inventory & monitoring program that collects, stores, interprets, and disseminates quantitative information about vegetation structure to decision makers. OBVM aims to answer the question: Are land management actions producing plant communities of desired quality? 3

4 Florida s Plant Communities fire maintained, three tiered vegetation structure 4


5 Historic Longleaf Pine Community 5


6 Gopher Tortoise 6
7 OBVM Program Goal *****Increase data driven decision making***** Establish long term queryable GIS database (LMIS) Provide status & trend analysis on progress towards meeting management objectives (JMP) Learn from the outcomes of previous management actions and implement knowledge as feedback to guide future efforts (adaptive management)
8 SUNLIGHT MANAGEMENT ACTIONS Px fire, logging, mechanical $ Over-story Vegetation MANAGEMENT DECISIONS Mid-story Vegetation VEGETATION QUALITY Groundcover Vegetation OBJECTIVES BASED VEGETATION MANAGEMENT Conceptual Ecological Model 8

9 Prescribed Fire before, after, +30days 9

10 Physical / Mechanical 10


11 Timber Harvest 11

 Sampling occurs every five years to test a hypothesis which")
12 Survey Design Create statewide vegetation community GIS polygon basemap; for locating population sampling stations & to pair management actions to a permanent footprint. (LMIS) Sampling occurs every five years to test a hypothesis which determines if the difference in attributes observed is significant. 12

13 Sample Point Generation 13
14 OBVM Vegetation Attributes LAYER ATTRIBUTE ALIAS UNITS Over-story Basal Area of Pine BP ft 2 /acre Over-story Mid-story Non-Pine Stem Density > 4in DBH Subcanopy Stem Density 2-4in DBH NPD SUBCAN Mid-story Shrub Stem Density > 1m STEMS Mid-story Mid-story Maximum Shrub Stem DBH Average Maximum Shrub Height DBH SHBHT Mid-story Shrub Cover < 1m SHBCOV Mid-story Mid-story Serenoa Petiole Density > 1m Average Maximum Serenoa Height SERPET SERHT Mid-story Serenoa Cover < 1m SERCOV Groundcover Herbaceous Cover HERBCOV count/7m radius average count/4m 2 quadrat average count/4m 2 quadrat average maximum DBH in inch/4m 2 quadrat average maximum height in ft/4m 2 quadrat average % cover/4m 2 quadrat average count/4m 2 quadrat average maximum height in ft/4m 2 quadrat average % cover/4m 2 quadrat average % cover/1m 2 quadrat 14
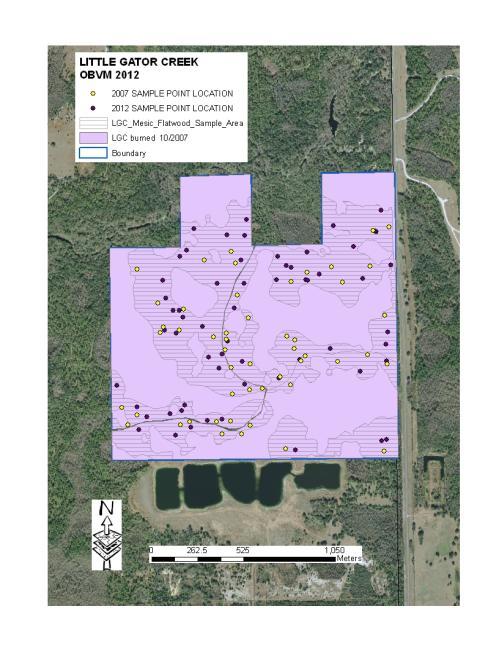
15 2 m 7 m Sample Station 5 m Design

16 OBVM quadrat sampling 16

17 OBVM quadrat sampling 17
18 Statistics hypothesis test model: Likelihood Ratio Chi-square Test for Two Proportions a sample size of 60 is selected to have 90% power to detect 14% comparisons, alpha = 0.20 (2005 UnifyPow) Raw data is transformed into a twooutcome form by comparison to the attributes desired condition as determined by a reference site project. 18
19 Attribute Desired Condition LAYER ATTRIBUTE SANDHILL FLATWOODS Over-story Basal Area of Pine Over-story Mid-story Non-Pine Stem Density > 4in DBH <3 0 Subcanopy Stem Density 2-4in DBH <1 <1 Mid-story Shrub Stem Density > 1m 0 <1 Mid-story Mid-story Maximum Shrub Stem DBH <1 <0.5 Average Maximum Shrub Height <3 <2 Mid-story Shrub Cover < 1m <25 Mid-story Mid-story Serenoa Petiole Density > 1m 0 0 Average Maximum Serenoa Height <3 <3 Mid-story Serenoa Cover < 1m < Groundcover Herbaceous Cover >25 >25 19
20 Statistical Considerations Simple random sampling, independent Two-tailed hypothesis test H O : P 1 = P 2 NULL HYPOTHESIS H A : P 1 P 2 ALTERNATIVE HYPOTHESIS Balance the risk of Type I and Type II errors cost of actions not needed (false+) VS failure to detect resource damage (false -) A higher risk of Type I error is accepted to increase the power of the test - correct rejection of null hypothesis when null hypothesis is false - significant results indicate evidence of management effect - non-significant results indicate little evidence of management effect 20
21 Although comparing two independent proportions seems like a simple problem, gifted statisticians have been debating the fine points for years and now almost 25 different methods have been suggested just to get good p values. Obtaining power probabilities for these tests is an even tougher research problem. A Tour of UnifyPow: A SAS Module/Macro for Sample-Size Analysis Ralph G. O Brien, Cleveland Clinic Foundation 21

22 22
23 OBVM Sample data Data from: Fort White Wildlife and Environmental Area Little Gator Creek Wildlife Management Area Go to excel 23
24 JMP analysis Go to JMP reports data visualization & significance test keystrokes: Analyze->Consumer Research->Categorical->Related->Aligned Responses 24

25 Management Activities Database 25
26 Immediate What is Next? Sample size analysis for oversampling and better implementation at regional scale Leaf Area Index Adaptive statistics Future Violin/Bean Plots (data visualization, jmp?) Bootstrap, Generalized linear model Land Acquisition Ranking, Payment for Ecosystem Services, Climate Change 26
27 Conservation Monitoring Program Development Recommendations Clearly state the purpose of monitoring Determine if monitoring is status seeking or trend seeking Secure funding and institutional support at all levels Develop a systems model that: clearly describes the way the system is structured and functions prioritizes and selects components of the system to be monitored communicates system function to all participants links causes of change (management action/inaction) to outcomes Create legacy program document Ensure adequate training, information management, and QA/QC. Obtain peer review of protocols and statistics Determine hypothesis, statistical power required, minimum detection effect Identify a panel of experts to evaluate data and develop conclusions that: modify future policy/management actions or validate status quo suggest improvements to future monitoring efforts develop an outreach program to disseminate results Ensure future management or monitoring implement knowledge from results 27


28 OBVM makes the FWC one of the few public agencies in the nation able to constantly fine-tune its land management actions based on data 28
A Regional Database Tracking Fire Footprint Each Year within the South Atlantic Region: Current Database Description and Future Directions
 A Regional Database Tracking Fire Footprint Each Year within the South Atlantic Region: Current Database Description and Future Directions Last Updated on September 30, 2018 Contributors: NatureServe,
Hypothesis Tests and Estimation for Population Variances. Copyright 2014 Pearson Education, Inc.
 Hypothesis Tests and Estimation for Population Variances 11-1 Learning Outcomes Outcome 1. Formulate and carry out hypothesis tests for a single population variance. Outcome 2. Develop and interpret confidence
Project Leader: Project Partners:
 UTILIZING LIDAR TO MAP HIGH PRIORITY WOODLAND HABITAT IN ARKANSAS DEVELOPING METHODOLOGY AND CONDUCTING A PILOT PROJECT IN THE OZARK HIGHLANDS TO MAP CURRENT EXTENT, SIZE AND CONDITION Project Summary
An Introduction to Day Two. Linking Conservation and Transportation Planning Lakewood, Colorado August 15-16, 16, 2006
 An Introduction to Day Two Linking Conservation and Transportation Planning Lakewood, Colorado August 15-16, 16, 2006 1 Agenda Day One Transportation Planning Heritage Program State Wildlife Action Plan
An Introduction to NatureServe Linking Conservation and Transportation Planning Phoenix, Arizona November 8 & 9, 2006
 An Introduction to NatureServe Linking Conservation and Transportation Planning Phoenix, Arizona November 8 & 9, 2006 1 NatureServe in Brief An independent, non-profit conservation organization Provides
Birch Creek Geomorphic Assessment and Action Plan
 Birch Creek Geomorphic Assessment and Action Plan Jim Webster Tim Hanrahan, PhD, CFM Jesse Schwartz, PhD Zach Hill January 22, 2015 White Eagle Grange This Project is a First Step in Strategy Planning
GIS-Based Sediment Quality Database for the St. Louis River Area of Concern (AOC): Overview Presentations and Demonstration
: Overview Presentations and Demonstration") GIS-Based Sediment Quality Database for the St. Louis River Area of Concern (AOC): Overview Presentations and Demonstration Judy L. Crane 1 and Dawn E. Smorong 2 1 Minnesota Pollution Control Agency, St.
GIS-Based Sediment Quality Database for the St. Louis River Area of Concern (AOC): Overview Presentations and Demonstration Judy L. Crane 1 and Dawn E. Smorong 2 1 Minnesota Pollution Control Agency, St.
Assessing Michigan s Biological diversity. Michigan Natural Features Inventory MSU Extension
 Assessing Michigan s Biological diversity John Paskus,, Amy Derosier,, Edward Schools, and Helen Enander Michigan Natural Features Inventory MSU Extension Goal Provide scientifically based information
The Road to Data in Baltimore
 Creating a parcel level database from high resolution imagery By Austin Troy and Weiqi Zhou University of Vermont, Rubenstein School of Natural Resources State and local planning agencies are increasingly
Ecological Response Units Ecosystem Mapping System for the Southwest US
 Ecological Response Units Ecosystem Mapping System for the Southwest US J. C. Moreland, W. A. Robbie, F. J. Triepke, E. H. Muldavin, and J. R. Malusa Objectives What are Ecological Response Units? What
HABITAT SUITABILITY MODELS: RESEARCH AND MANAGEMENT
 HABITAT SUITABILITY MODELS: RESEARCH AND MANAGEMENT Mark Barrett, Ph.D. Florida Fish and Wildlife Conservation Commission Fish and Wildlife Research Institute Center for Spatial Analysis George Box (1976)
The FNAI Invasive Plants Program
 The FNAI Invasive Plants Program What we do and how we can help the Northwest FL CISMA Frank Price Invasive Plants Program Manager Staff of 32 Part of FUS and the NatureServe network 100% contract funded
Logistic Regression for Distribution Modeling
 Logistic Regression for Distribution Modeling GIS5306 GIS Applications in Environmental Systems Presented by: Andrea Palmiotto John Perry Theory Familiar Territory Linear Regression Relevant Assumptions
Land Use Methods & Metrics Development Outcome
 Quarterly Progress Meeting November 15, 2018 Land Use Methods & Metrics Development Outcome Peter Claggett, USGS LUWG Coordinator Through the Chesapeake Bay Watershed Agreement, the Chesapeake Bay Program
Native species (Forbes and Graminoids) Less than 5% woody plant species. Inclusions of vernal pools. High plant diversity
 Less than 5% woody plant species. Inclusions of vernal pools. High plant diversity") WILLAMETTE VALLEY WET-PRAIRIE RESTORATION MODEL WHAT IS A WILLAMETTE VALLEY WET-PRAIRIE Hot Spot s Native species (Forbes and Graminoids) Rare plant species Less than 5% woody plant species Often dominated
WILLAMETTE VALLEY WET-PRAIRIE RESTORATION MODEL WHAT IS A WILLAMETTE VALLEY WET-PRAIRIE Hot Spot s Native species (Forbes and Graminoids) Rare plant species Less than 5% woody plant species Often dominated
Section on Survey Research Methods JSM 2010 STATISTICAL GRAPHICS OF PEARSON RESIDUALS IN SURVEY LOGISTIC REGRESSION DIAGNOSIS
 STATISTICAL GRAPHICS OF PEARSON RESIDUALS IN SURVEY LOGISTIC REGRESSION DIAGNOSIS Stanley Weng, National Agricultural Statistics Service, U.S. Department of Agriculture 3251 Old Lee Hwy, Fairfax, VA 22030,
Introduction: discussion of classification, seral assignment and monitoring. Instructions: plot setup and data collection using the Excel spreadsheet.
 Boxelder Page 1. Page 2. Page 3. Page 4. Introduction: discussion of classification, seral assignment and monitoring. Graph. Instructions: plot setup and data collection using the Excel spreadsheet. References.
Implementation Status & Results Indonesia Improving Governance for Sustainable Indigenous Community Livelihoods in Forested Areas (P130632)
") Public Disclosure Authorized Public Disclosure Authorized The World Bank Implementation Status & Results Indonesia Improving Governance for Sustainable Indigenous Community Livelihoods in Forested Areas
Public Disclosure Authorized Public Disclosure Authorized The World Bank Implementation Status & Results Indonesia Improving Governance for Sustainable Indigenous Community Livelihoods in Forested Areas
1:30 2:00 Tangible Examples of NVC Uses from Monitoring, Mapping, and Habitat Modeling. (Todd Keeler- Wolf, ESA Panel)
") 1:30 2:00 Tangible Examples of NVC Uses from Monitoring, Mapping, and Habitat Modeling. (Todd Keeler- Wolf, ESA Panel) Habitat Modeling for Mojave Ground Squirrel: a rare species of the Western Mojave
1:30 2:00 Tangible Examples of NVC Uses from Monitoring, Mapping, and Habitat Modeling. (Todd Keeler- Wolf, ESA Panel) Habitat Modeling for Mojave Ground Squirrel: a rare species of the Western Mojave
STM Development: A Systematic Approach Focused on Quality Control
 STM Development: A Systematic Approach Focused on Quality Control A Lofty Aspiration Tamzen K. Stringham University of Nevada, Reno Multiple Approaches Dig lots of holes - I will figure this out! Hang
What is a Hypothesis?
 What is a Hypothesis? A hypothesis is a claim (assumption) about a population parameter: population mean Example: The mean monthly cell phone bill in this city is μ = $42 population proportion Example:
EuroGEOSS Protected Areas Pilot
 EuroGEOSS Protected Areas Pilot Max Craglia European Commission Joint Research Centre Part 1: the present MyNatura2000 Mobile app. Awareness raising & volunteered data collection. Natura2000 covers 18%
Creating a Staff Development Plan with Esri
 Creating a Staff Development Plan with Esri Michael Green David Schneider Guest Presenter: Shane Feirer, University of California Esri UC 2014 Technical Workshop Agenda What is a Staff Development Plan?
Project Primary Contact: Gregg Servheen, Idaho Department of Fish and Game, PO Box 25 Boise, ID ,
 Project Title: Idaho Montana Divide Project Objective: Pilot the conceptualization and coordination of a transboundary Decision Support System(DSS) for fish, wildlife, and habitats along the Idaho Montana
THE NEW DNR LANDSLIDE HAZARDS PROGRAM
 THE NEW DNR LANDSLIDE HAZARDS PROGRAM Kara Jacobacci, G.I.T. Landslide Hazards Program Washington Geological Survey Washington Department of Natural Resources LEGISLATIVE FUNDING 2015 session DNR requested
Heather Schlosser Army Corps of Engineers Coastal Studies Group August 28, 2008
 Got sand? Regional Sediment Management in Orange County Heather Schlosser Army Corps of Engineers Coastal Studies Group August 28, 2008 Regional Sediment Management Regional sediment management recognizes
3/29/11. Why bother with tools? Incorporating Decision Support Tools into Climate Adaptation Planning. A Simplified Planning Process
 Incorporating Decision Support Tools into Climate Adaptation Planning Why bother with tools? Tools don t eliminate complexity but they can help deal with it" Tools can:"! Help incorporate science into
Scientific research and tools to support management and protection of water supplies from the effects of wildfires
 Scientific research and tools to support management and protection of water supplies from the effects of wildfires Deborah A., Martin, U.S. Geological Survey Managing for Uncertainty and Climatic Variability:
Bivariate Relationships Between Variables
 Bivariate Relationships Between Variables BUS 735: Business Decision Making and Research 1 Goals Specific goals: Detect relationships between variables. Be able to prescribe appropriate statistical methods
DWH Restoration Funding at a Glance
 NCER 2018 DWH Restoration Funding at a Glance Natural Resource Damage Assessment: $8.1 Billion RESTORE Act: $5.3 Billion National Fish and Wildlife Foundation GEBF: $2.5 Billion National Academy of Sciences:
Summary Description Municipality of Anchorage. Anchorage Coastal Resource Atlas Project
 Summary Description Municipality of Anchorage Anchorage Coastal Resource Atlas Project By: Thede Tobish, MOA Planner; and Charlie Barnwell, MOA GIS Manager Introduction Local governments often struggle
Landscape Planning and Habitat Metrics
 Landscape Planning and Habitat Metrics Frank W. Davis National Center for Ecological Analysis and Synthesis UC Santa Barbara (Tools for Landscape Biodiversity Planning) Jimmy Kagan Institute for Natural
GREEN GROWTH TOOLBOX. Nature-Friendly Planning. Jeff Marcus North Carolina Wildlife Resources Commission
 GREEN GROWTH TOOLBOX Nature-Friendly Planning Jeff Marcus North Carolina Wildlife Resources Commission Growth in North Carolina NC is the 5 th fastest growing state 3 million people will move to NC over
How to deal with non-linear count data? Macro-invertebrates in wetlands
 How to deal with non-linear count data? Macro-invertebrates in wetlands In this session we l recognize the advantages of making an effort to better identify the proper error distribution of data and choose
Restoring Rivers in Cumbria Online Story Map of a case study on the River Lyvennet
 Restoring Rivers in Cumbria Online Story Map of a case study on the River Lyvennet Summary This Story Map presents a river restoration case study for the River Eden Catchment, Cumbria. Students can learn
GENERAL RECOMMENDATIONS. Session 7. Breakout discussion. discuss on regional and interregional. proposals 1. COLLABORATION BETWEEN PROGRAMMES
 Session 7 24 July 2016, 9.00-11.00 Breakout discussion on regional and interregional joint project proposals Mr Shahbaz Khan summarized the two days of presentations and exchanges and requested the participants
Nebraska Conservation and Environmental Review Tool (CERT): Terminology used in the Tables of the CERT Report
: Terminology used in the Tables of the CERT Report") Nebraska Conservation and Environmental Review Tool (CERT): Terminology used in the Tables of the CERT Report Nebraska Natural Heritage Program Nebraska Game and Parks Commission February 8, 2018 Contents
Nebraska Conservation and Environmental Review Tool (CERT): Terminology used in the Tables of the CERT Report Nebraska Natural Heritage Program Nebraska Game and Parks Commission February 8, 2018 Contents
Why Sample Vegetation? Vegetation Sampling. Vegetation Sampling Metrics. Enumeration and Density
 Vegetation Sampling Key concepts Types of vegetation sampling Methods of vegetation sampling Definitions Density Cover Growth Vigor Utilization Transect Macroplot Quadrat Physiological status Why Sample
Canada s Experience with Chemicals Assessment and Management and its Application to Nanomaterials
 Canada s Experience with Chemicals Assessment and Management and its Application to Nanomaterials European Chemicals Agency (ECHA) Topical Scientific Workshop: Regulatory Challenges in Risk Assessment
State GIS Officer/GIS Data
 State GIS Officer/GIS Data This Act creates the position of state Geographic Information Systems (GIS) officer. The Act: requires the state GIS officer to adopt or veto the GIS data standards and a statewide
The Atlas Aspect of the Atlas of Living Australia
 The Atlas Aspect of the Atlas of Living Australia Lee Belbin lee@blatantfabrications.com Melbourne Museum, July 28, 2010 The Atlas is funded by the Australian Government under the National Collaborative
MeteoGroup RoadMaster. The world s leading winter road weather solution
 MeteoGroup RoadMaster The world s leading winter road weather solution Discover why RoadMaster is the world s leading winter road weather solution. Managing winter road maintenance means that you carry
9-7: THE POWER OF A TEST
 CD9-1 9-7: THE POWER OF A TEST In the initial discussion of statistical hypothesis testing the two types of risks that are taken when decisions are made about population parameters based only on sample
Econ 325: Introduction to Empirical Economics
 Econ 325: Introduction to Empirical Economics Chapter 9 Hypothesis Testing: Single Population Ch. 9-1 9.1 What is a Hypothesis? A hypothesis is a claim (assumption) about a population parameter: population
Background. North Cascades Ecosystem Grizzly Bear Restoration Plan/ Environmental Impact Statement. Steve Rochetta
 Grizzly Bear Restoration Plan/ Environmental Impact Statement Steve Rochetta Background Situated in the core of the North Cascades ecosystem (NCE), the North Cascades National Park Complex is surrounded
The Road to Improving your GIS Data. An ebook by Geo-Comm, Inc.
 The Road to Improving your GIS Data An ebook by Geo-Comm, Inc. An individual observes another person that appears to be in need of emergency assistance and makes the decision to place a call to 9-1-1.
Lecture 25. Ingo Ruczinski. November 24, Department of Biostatistics Johns Hopkins Bloomberg School of Public Health Johns Hopkins University
 Lecture 25 Department of Biostatistics Johns Hopkins Bloomberg School of Public Health Johns Hopkins University November 24, 2015 1 2 3 4 5 6 7 8 9 10 11 1 Hypothesis s of homgeneity 2 Estimating risk
The Emerging Role of Enterprise GIS in State Forest Agencies
 The Emerging Role of Enterprise GIS in State Forest Agencies Geographic Information System (GIS) A geographic information system (GIS) is a computer software system designed to capture, store, manipulate,
Natural Resource Management. Northern Tasmania. Strategy. Appendix 2
 Natural Resource Management Strategy Northern Tasmania 2015 2020 Appendix 2 Appendix 2 Appendix 2. Carbon Planting Spatial Prioritisation In support of this Strategy s development and implementation, work
UPDATING THE MINNESOTA NATIONAL WETLAND INVENTORY
 UPDATING THE MINNESOTA NATIONAL WETLAND INVENTORY An Integrated Approach Using Object-Oriented Image Analysis, Human Air-Photo Interpretation and Machine Learning AARON SMITH EQUINOX ANALYTICS INC. FUNDING
The ENSEMBLES Project
 The ENSEMBLES Project Providing ensemble-based predictions of climate changes and their impacts by Dr. Chris Hewitt Abstract The main objective of the ENSEMBLES project is to provide probabilistic estimates
Risk Analysis for Assessment of Vegetation Impact on Outages in Electric Power Systems. T. DOKIC, P.-C. CHEN, M. KEZUNOVIC Texas A&M University USA
 21, rue d Artois, F-75008 PARIS CIGRE US National Committee http : //www.cigre.org 2016 Grid of the Future Symposium Risk Analysis for Assessment of Vegetation Impact on Outages in Electric Power Systems
DEPARTMENT OF GEOLOGY AND MINERAL INDUSTRIES WAYS & MEANS SUBCOMMITTEE ON NATURAL RESOURCES MARCH 2, 2017
 DEPARTMENT OF GEOLOGY AND MINERAL INDUSTRIES WAYS & MEANS SUBCOMMITTEE ON NATURAL RESOURCES MARCH 2, 2017 1 ABOUT DOGAMI AGENCY MISSION, VISION & GOALS 2 Lidar image of a stream network along the Umpqua
CSO Climate Data Rescue Project Formal Statistics Liaison Group June 12th, 2018
 CSO Climate Data Rescue Project Formal Statistics Liaison Group June 12th, 2018 Dimitri Cernize and Paul McElvaney Environment Statistics and Accounts Presentation Structure Background to Data Rescue Project
Integrating Conservation and Transportation Planning Through Decision Support Software Or The Missing Link Between Geodatabase & STEP UP?
 Integrating Conservation and Transportation Planning Through Decision Support Software Or The Missing Link Between Geodatabase & STEP UP? What is a Decision Support System? Helps you do specific activities
ENV208/ENV508 Applied GIS. Week 1: What is GIS?
 ENV208/ENV508 Applied GIS Week 1: What is GIS? 1 WHAT IS GIS? A GIS integrates hardware, software, and data for capturing, managing, analyzing, and displaying all forms of geographically referenced information.
Creating A-16 Compliant National Data Theme for Cultural Resources
 Creating A-16 Compliant National Data Theme for Cultural Resources Cultural Resource GIS Facility National Park Service John J. Knoerl Deidre McCarthy Paper 169 Abstract OMB Circular A-16 defines a set
Looking at the big picture to plan land treatments
 Looking at the big picture to plan land treatments Eva Strand Department of Rangeland Ecology and Management University of Idaho evas@uidaho.edu, http://www.cnr.uidaho.edu/range Why land treatment planning?
Florida Friendly Landscapes?
 Florida Friendly Landscapes? Backyards as Habitats Ecology Concepts Ecosystem interacting network of living and non-living components Community association of different species living and interacting in
Case Study: Ecological Integrity of Grasslands in the Apache Highlands Ecoregion
 Standard 9: Screen all target/biodiversity element occurrences for viability or ecological integrity. Case Study: Ecological Integrity of Grasslands in the Apache Highlands Ecoregion Summarized from: Marshall,
Factors that Shape Places Stage 3 Geography
 Factors that Shape Places Stage 3 Geography Summary This unit is written for Stage 3 "Factors that shape places". It is a Geographical Inquiry, enabling students to work through the 3 stages of inquiry;
Biodiversity Blueprint Overview
 Biodiversity Blueprint Overview Climate Variability Climate projections for the Glenelg Hopkins Regions suggest that the weather will be hotter and drier in the coming years which will impact on land use,
Geography for the 2020 Round of Census
 Boundaries Key Census Data EA Id Population Male Female EA Id Area EA Id Num HH Avg HH size Geography for the 2020 Round of Census Linda Peters, Esri lpeters@esri.com Integration of Statistical and Geospatial
IAEG SDGs WG GI, , Mexico City
 IAEG SDGs WG GI, 12-14.12.2016, Mexico City UN-GGIM:Europe s perspective and activities to support better integration of geospatial information and statistics and the UN SDG monitoring Pier-Giorgio Zaccheddu,
Aboriginal communities strengthen governance with location-based tools in the 21st century
 Aboriginal communities strengthen governance with location-based tools in the 21st century Today, Aboriginal communities are taking advantage of the geomatics technologies that underpin popular online
Realizing benefits of Spatial Data Infrastructure A user s perspective from Environment Agency - Abu Dhabi
 Realizing benefits of Spatial Data Infrastructure A user s perspective from Environment Agency - Abu Dhabi Anil Kumar Director, Environment Information Management 26 April 2012 Geospatial World Forum,
Invasive Plant Inventory & Survey Methods Web Seminar Series
 Invasive Plant Inventory & Survey Methods Web Seminar Series TODAY S PRESENTATION Landscape-Scale Wildland Inventories/Surveys: Utah State University Methods Kimberly Edvarchuk Utah State University Landscape-Scale
CLICK HERE TO KNOW MORE
 CLICK HERE TO KNOW MORE Geoinformatics Applications in Land Resources Management G.P. Obi Reddy National Bureau of Soil Survey & Land Use Planning Indian Council of Agricultural Research Amravati Road,
LAND COVER CATEGORY DEFINITION BY IMAGE INVARIANTS FOR AUTOMATED CLASSIFICATION
 LAND COVER CATEGORY DEFINITION BY IMAGE INVARIANTS FOR AUTOMATED CLASSIFICATION Nguyen Dinh Duong Environmental Remote Sensing Laboratory Institute of Geography Hoang Quoc Viet Rd., Cau Giay, Hanoi, Vietnam
Partnering with LANDFIRE, NatureServe, and Heritage Programs. Utilizing Legacy Data for Ecological Site Concept Development and Descriptions
 Partnering with LANDFIRE, NatureServe, and Heritage Programs Utilizing Legacy Data for Ecological Site Concept Development and Descriptions Content LANDFIRE: BpS vs. EVT LANDFIRE: Disturbance Models NatureServe:
Ecological Site Description Overview
 Ecological Site Description Overview 2018 Coastal Zone Soil Survey (CZSS) Work Planning Conference Savannah, GA January 9th, 2018 Greg Taylor Senior Regional Soil Scientist USDA-NRCS Raleigh, NC j.greg.taylor@nc.usda.gov
Predicting wildfire ignitions, escapes, and large fire activity using Predictive Service s 7-Day Fire Potential Outlook in the western USA
 http://dx.doi.org/10.14195/978-989-26-0884-6_135 Chapter 4 - Fire Risk Assessment and Climate Change Predicting wildfire ignitions, escapes, and large fire activity using Predictive Service s 7-Day Fire
Urban Climate Resilience
 Urban Climate Resilience in Southeast Asia Partnership Project Introduction Planning for climate change is a daunting challenge for governments in the Mekong Region. Limited capacity at the municipal level,
Advanced network for the distribution of endangered species
 Advanced network for the distribution of endangered species Cristián Bonacic & Andrea Vásquez PONTIFICIA UNIVERSIDAD CATOLICA DE CHILE Sao Paulo May 2013 The problem: Wildlife Data Challenges in Latin
Antarctic Tourism What Next? Key Issues to Address with Binding Rules
 Agenda Item: CEP 6b, ATCM 10 Presented by: Original: ASOC English Antarctic Tourism What Next? Key Issues to Address with Binding Rules 1 Summary This paper addresses three issues we have identified as
DETAILED CONTENTS PART I INTRODUCTION AND DESCRIPTIVE STATISTICS. 1. Introduction to Statistics
 DETAILED CONTENTS About the Author Preface to the Instructor To the Student How to Use SPSS With This Book PART I INTRODUCTION AND DESCRIPTIVE STATISTICS 1. Introduction to Statistics 1.1 Descriptive and
Southwest LRT Habitat Analysis. May 2016 Southwest LRT Project Technical Report
 Southwest LRT Habitat Analysis Southwest LRT Project Technical Report This page intentionally blank. Executive Summary This technical report describes the habitat analysis that was performed to support
The Arctic Landscape Conservation Cooperative Conservation Goals
 The Arctic Landscape Conservation Cooperative Conservation Goals Adopted by the Arctic LCC Steering Committee, 24 August 2010 Background : Landscape Conservation Cooperatives and Climate Science Centers
April 9, Phosphate Mining and Reclamation Overview
 April 9, 2012 Phosphate Mining and Reclamation Overview Business & Mission Mosaic produces the majority of the phosphate used by American farmers Employs approximately 7,000 people worldwide, 3,000 in
Virginia Shoreline Mapping Tools
 Virginia Shoreline Mapping Tools December 15, 2017 Karen Duhring Center for Coastal Resources Management Virginia Institute of Marine Science College of William & Mary Virginia Shoreline Mapping Tools
Core Courses for Students Who Enrolled Prior to Fall 2018
 Biostatistics and Applied Data Analysis Students must take one of the following two sequences: Sequence 1 Biostatistics and Data Analysis I (PHP 2507) This course, the first in a year long, two-course
Framework for the Basin-Wide Socio-Economic Analysis of Four Proposed Sediment Diversions. August 4, 2015
 Framework for the Basin-Wide Socio-Economic Analysis of Four Proposed Sediment Diversions August 4, 2015 Proposed Sediment Diversions Mid-Breton Mid-Barataria Lower Barataria Lower Breton Overview of Presentation
This case study also provides recommendations for future lightning protection design for existing (brownfield) substation.
 substation.") A Case Study for Substation Lightning Strike Risk Evaluation Stephen Chuang 111 Dunsmuir Street #400, Vancouver, BC V6B 5W3 604-6644123 Stephen.chuang@amecfw.com Abstract Shielding of substations from
A Case Study for Substation Lightning Strike Risk Evaluation Stephen Chuang 111 Dunsmuir Street #400, Vancouver, BC V6B 5W3 604-6644123 Stephen.chuang@amecfw.com Abstract Shielding of substations from
Estimation of a Plant Density Exercise 4
 Estimation of a Plant Density Exercise 4 2011-2014 Johnson, Larson, Louhaichi, & Woerz Density from Quadrats or Plots When monitoring for ecosystem change, especially for change in rare or endangered plant
Enabling Success in Enterprise Asset Management: Case Study for Developing and Integrating GIS with CMMS for a Large WWTP
 Enabling Success in Enterprise Asset Management: Case Study for Developing and Integrating GIS with CMMS for a Large WWTP Allison Blake, P.E. 1*, Matthew Jalbert, P.E. 2, Julia J. Hunt, P.E. 2, Mazen Kawasmi,
Figure 2.5 Flood Risk At Crossing
 6th MER 7 6 5 4 3 2 1 0 9 8 7 6th MER Figure 2.4 7 6 5 4 3 2 1 0 9 8 7 7 2001 ALBERTA NEWSPRINT COMPANY All rights reserved. 7 6 Figure 2.5 Risk At Crossing 6th MER 6th MER 6 5 5 4 4 3 3 2 2 1 1 0 0 9
THEME 1: Expression of needs and Data Infrastructures Informative references for Ecological Network Marche
 THEME 1: Expression of needs and Data Infrastructures Informative references for Ecological Network Marche Claudio Zabaglia Regione Marche - Project manager Head of Biodiversity, ecological network and
NEPAL: FCPF READINESS GRANT FCPFR - FOREST CARBON PARTNERSHIP FACILITY
 Assignment: TF094724 NEPAL: FCPF READINESS GRANT FCPFR - FOREST CARBON PARTNERSHIP FACILITY Task Team Leader: 00000240969 Approving Manager: 00000082671 - Abdelaziz Lagnaoui - Kseniya Lvovsky Summary Information
Digital Wetlands. Bringing the Field into the Office Through GIS
 Digital Wetlands Bringing the Field into the Office Through GIS Maryland Department of the Environment Wetlands and Waterways Program MDE's Wetlands and Waterways Program seeks to conserve valuable aquatic
VCS MODULE VMD0018 METHODS TO DETERMINE STRATIFICATION
 VMD0018: Version 1.0 VCS MODULE VMD0018 METHODS TO DETERMINE STRATIFICATION Version 1.0 16 November 2012 Document Prepared by: The Earth Partners LLC. Table of Contents 1 SOURCES... 2 2 SUMMARY DESCRIPTION
GIS Data, Technology, and Models. to Integrate Information and Improve Transportation Decision-Making. within the Eco-Logical* Framework for Oregon
 GIS Data, Technology, and Models to Integrate Information and Improve Transportation Decision-Making within the Eco-Logical* Framework for Oregon GIS-T 2009, Oklahoma City, OK April 8, 2009, Session 5..2.2
Spatial Variation in Local Road Pedestrian and Bicycle Crashes
 2015 Esri International User Conference July 20 24, 2015 San Diego, California Spatial Variation in Local Road Pedestrian and Bicycle Crashes Musinguzi, Abram, Graduate Research Assistant Chimba,Deo, PhD.,
Puakea, Hawaiÿi. Puakea, Hawaiÿi WATERSHED FEATURES
 Puakea, Hawaiÿi DAR Watershed Code: 85046 Puakea, Hawaiÿi WATERSHED FEATURES Puakea watershed occurs on the island of Hawaiÿi. The Hawaiian meaning of the name is white blossom. The area of the watershed
Statistics for Managers Using Microsoft Excel/SPSS Chapter 8 Fundamentals of Hypothesis Testing: One-Sample Tests
 Statistics for Managers Using Microsoft Excel/SPSS Chapter 8 Fundamentals of Hypothesis Testing: One-Sample Tests 1999 Prentice-Hall, Inc. Chap. 8-1 Chapter Topics Hypothesis Testing Methodology Z Test
Ecological Land Cover Classification For a Natural Resources Inventory in the Kansas City Region, USA
 Ecological Land Cover Classification For a Natural Resources Inventory in the Kansas City Region, USA by Applied Ecological Services, Inc. In cooperation with the Mid-America Regional Council 600 Broadway,
1) NetMap Overview. 2) Habitat modeling HIP & Beyond. 3) What do you do with habitat models? 4) NetMap a platform for regional analysis & interactions
 NetMap Overview. 2) Habitat modeling HIP & Beyond. 3) What do you do with habitat models? 4) NetMap a platform for regional analysis & interactions") 1) NetMap Overview 2) Habitat modeling HIP & Beyond 3) What do you do with habitat models? 4) NetMap a platform for regional analysis & interactions Overview Multiple analysis tools Creates universal stream/hillslope
1) NetMap Overview 2) Habitat modeling HIP & Beyond 3) What do you do with habitat models? 4) NetMap a platform for regional analysis & interactions Overview Multiple analysis tools Creates universal stream/hillslope
15 March 2010 Re: Draft Native Vegetation of the Sydney Metropolitan Catchment Management Authority Area GIS layers and explanatory reports
 SYDNEY COASTAL COUNCILS GROUP Inc. C/- City of Sydney Council Level 14, 456 Kent Street GPO Box 1591, SYDNEY NSW 2001 Phone: (02) 9246 7791 Facsimile: (02) 9265 9660 Email: info@sydneycoastalcouncils.com.au
Applying Health Outcome Data to Improve Health Equity
 Applying Health Outcome Data to Improve Health Equity Devon Williford, MPH, Health GIS Specialist Lorraine Dixon-Jones, Policy Analyst CDPHE Health Equity and Environmental Justice Collaborative Mile High
Focal Resource: BIGHORN SHEEP
 Focal Resource: BIGHORN SHEEP Taxonomy and Related Information: Bighorn sheep (Ovis canadensis); south Sierra, White and Inyo Mountains, perhaps more on east side. SENSITIVITY RESULTS.7 ADAPTIVE CAPACITY