GeoInformatics of Hotspot Detection and Prioritization for Emerging Infectious Disease Research, Surveillance, and Early Warning
|
|
|
- Morgan Cunningham
- 6 years ago
- Views:
Transcription


1 GeoInformatics of Hotspot Detection and Prioritization for Emerging Infectious Disease Research, Surveillance, and Early Warning G. P. Patil of Hawaii, March
2 Infectious Diseases Use of remote sensing data and other available geospatial data on a continental scale to help evaluate landscape characteristics that may be precursors for vector-borne diseases leading to early warning systems involving landscape health, ecosystem health, and human health Water-Borne Diseases Air-Borne Diseases Emerging Infectious Diseases 2

3 3
4 Dead Bird Clusters as an Early Warning System for West Nile Virus Activity Mostashari, Kulldorff,, Hartman, Miller, Kulasekara,, Emerging Infectious Diseases 9, Prospective geographic cluster analysis of dead bird reports may provide early warning of increasing viral activity in birds and mosquitoes, allowing jurisdictions to triage limited mosquito-collection and laboratory resources and more effectively prevent human disease caused by the virus We adapted the spatial scan statistic for prospective detection of infectious disease outbreaks in New York City This adaptation of the spatial scan statistic could also be useful in other infectious disease surveillance systems, including those for bioterrorism. 4
5 Geographic Prediction of Human Onset of West Nile Virus Using Dead Crow Clusters: A Quantitative Assessment of Year 2002 Data in New York State Johnson, Eidson, Schmit,, Ellis, Kulldorff (2005) The risk of becoming a West Nile Virus (WNV) case in New York State, excluding New York City, was evaluated for individuals whose town of residence was proximal to spatial clusters of dead American crows (Corvus brachyrhynchos). Weekly clusters were delineated for June-October 2002 by the binomial spatial scan statistic and by kernel density smoothing. Relative risk of a human case was estimated for different spatial-temporal exposure definitions after adjusting for population density and age distribution using Poisson regression, adjusting for week and geographic region, and Cox proportional hazards modeling, where the week of a human case was treated as the failure time and baseline hazard was stratified by region. 5
6 The risk of becoming a WNV case was positively associated with living in towns that are proximal to dead crow clusters. The highest risk was consistently for towns associated with a cluster in the current or prior 1-2 weeks Weaker, but positive, associations were found for towns associated with a cluster in just the 1-2 prior weeks, indicating an ability to predict onset in a timely fashion. These results are relevant to spatial-temporal surveillance for zoonotic diseases in general, including those of bioterrorism concern. 6
7 Multiscale Advanced Raster Map Analysis Geospatial Patterns and Pattern Metrics Landscape patterns, disease patterns, mortality patterns Surface Topology and Spatial Structure Hotspots, outbreaks, critical areas Intrinsic hierarchical decomposition, study areas, reference areas Change detection, change analysis, spatial structure of change 7
8 A 21st Century Scenario What message does a remote sensing- derived land cover land use map have about the large landscape it represents? And at what scale and at what level of detail? Does the spatial pattern of the map reveal any societal, ecological, environmental condition of the landscape? And therefore can it be an indicator of change? 8
9 A 21st Century Scenario How do you automate the assessment of the spatial structure and behavior of change to discover critical areas, hot spots, and their corridors? Is the map accurate? How accurate is it? How do you assess the accuracy of the map? Of the change map over time for change detection? 9
10 A 21st Century Scenario What are the implications of the kind and amount of change and accuracy on what matters, whether climate change, carbon emission, water resources, urban sprawl, biodiversity, indicator species, or early warning, or others. And with what confidence, even with a single map/change- map? 10
11 The needed partnership research is expected to find answers to these questions and a few more that involve multicategorial raster maps based on remote sensing and other geospatial data. It is also expected to design a prototype and user-friendly advanced raster map analysis system for digital governance. 11
12 MARMAP SYSTEM Partnership Research and Outreach Prospectus: spectus8-00.pdf Our web page for raster map analysis: htm Our web page for raster map monographs: Our web page for UNEP HEI 12
13 Geoinformatic Surveillance System Geoinformatic spatio-temporal data from a variety of data products and data sources with agencies, academia, and industry Spatially distributed response variables Hotspot analysis Prioritization Decision support systems Masks, filters Masks, filters Indicators, weights 13
14 Homeland Security Disaster Management Public Health Ecosystem Health Other Case Studies Statistical Processing: Hotspot Detection, Prioritization, etc. Arbitrary Data Model, Data Format, Data Access Application Specific De Facto Data/Information Standard Standard or De Facto Data Model, Data Format, Data Access Data Sharing, Interoperable Middleware Agency Databases Thematic Databases Other Databases National Applications Biosurveillance Carbon Management Coastal Management Community Infrastructure Crop Surveillance Disaster Management Disease Surveillance Ecosystem Health Environmental Justice Environmental Management Environmental Policy Homeland Security Invasive Species Poverty Policy Public Health Public Health and Environment Robotic Networks Sensor Networks Social Networks Syndromic Surveillance Tsunami Inundation Urban Crime Water Management 14
15 Examples of Hotspot Analysis Spatial Disease surveillance Biodiversity: species-rich and species-poor areas Geographical poverty analysis Network Water resource impairment at watershed scales Water distribution systems, subway systems, and road transport systems Social Networks/Terror Networks 15
16 Issues in Hotspot Analysis Estimation: Identification of areas having unusually high (or low) response Testing: Can the elevated response be attributed to chance variation (false positive) or is it statistically significant? Explanation: Assess explanatory factors that may account for the elevated response 16
17 The Spatial Scan Statistic Move a circular window across the map. Use a variable circle radius, from zero up to a maximum where 50 percent of the population is included. 17
18 A small sample of the circles used 18
19 Detecting Emerging Clusters Instead of a circular window in two dimensions, we use a cylindrical window in three dimensions. The base of the cylinder represents space, while the height represents time. The cylinder is flexible in its circular base and starting date, but we only consider those cylinders that reach all the way to the end of the study period. Hence, we are only considering alive clusters. 19
20 West Nile Virus Surveillance in New York City 2000 Data: Simulation/Testing of Prospective Surveillance System 2001 Data: Real Time Implementation of Daily Prospective Surveillance 20
21 West Nile Virus Surveillance in New York City Major epicenter on Staten Island Dead bird surveillance system: June 14 Positive bird report: July 16 (coll. July 5) Positive mosquito trap: July 24 (coll. July 7) Human case report: July 28 (onset July 20) 21
22 22
23 Hospital Emergency Admissions in New York City Hospital emergency admissions data from a majority of New York City hospitals. At midnight, hospitals report last 24 hour of data to New York City Department of Health A spatial scan statistic analysis is performed every morning If an alarm, a local investigation is conducted 23

24 Issues 24


25 Geospatial Surveillance 25


26 Spatial Temporal Surveillance 26
27 Syndromic Surveillance Symptoms of disease such as diarrhea, respiratory problems, headache, etc Earlier reporting than diagnosed disease Less specific, more noise 27


28 Syndromic Crisis-Index Surveillance 28


29 Hotspot Prioritization 29


30 30

31 You Are Invited NSF DGP PROJECT Geoinformatic Surveillance: Hotspot Detection and Prioritization Across Geographic Regions and Networks for Digital Government in the 21st Century Geoinformatic surveillance for spatial and temporal hotspot detection and prioritization is a critical need for the 21st century Digital Government. A hotspot can mean an unusual phenomenon, anomaly, aberration, outbreak, elevated cluster, or critical area. The declared need may be for monitoring, etiology, management, or early warning. The responsible factors may be natural, accidental or intentional, with relevance to both infrastructure and homeland security. This project describes a multi-disciplinary research program based on novel methods and tools for hotspot detection and prioritization, driven by a wide variety of case studies of direct interest to several government agencies. These case studies deal with critical societal issues, such as carbon budgets, water resources, ecosystem health, public health, drinking water distribution system, persistent poverty, environmental justice, crop pathogens, invasive species, biosecurity, biosurveillance, remote sensor networks, early warning and homeland security. The geosurveillance provides an excellent opportunity, challenge, and vehicle for synergistic collaboration of computational, technical, and social scientists. Our methodology involves an innovation of the popular circle-based spatial scan statistic methodology. In particular, it employs the notion of an upper level set and is accordingly called the upper level set scan statistic, pointing to the next generation of a sophisticated analytical and computational system, effective for the detection of arbitrarily shaped hotspots along spatio-temporal dimensions. We also propose a novel prioritization scheme based on multiple indicator and stakeholder criteria without having to integrate indicators into an index, using revealing Hasse diagrams and partially ordered sets. Responding to the Government s role and need, we propose a cross-disciplinary collaboration among federal agencies and academic researchers to design and build the prototype system for surveillance infrastructure of hotspot detection and prioritization. The methodological toolbox and the software toolkit developed will support and leverage core missions of federal agencies as well as their interactive counterparts in the society. The research advances in the allied sciences and technologies necessary to make such a system work are the thrust of this five year project. The project will have a dual disciplinary and cross-disciplinary thrust. Dialogues and discussions will be particularly welcome, leading potentially to well considered synergistic case studies. The collaborative case studies are expected to be conceptual, structural, methodological, computational, applicational, developmental, refinemental, validational, and/or visualizational in their individual thrust. For additional information, see the webpages: (1) (4) http: // (2) (5) (3) (6) Project address: Penn State Center for Statistical Ecology and Environmental Statistics 421 Thomas Building, Penn State University, University Park, PA Telephone: (814) ; gpp@stat.psu.edu 31
32 Geographical Disease Surveillance Discrete response Hotspot detection and upper level set scan Hotspot delineation and hot-spot rating Multiple hotspot detection and delineation Hotspot prioritization and poset ranking Space-time detection and early warning Continuous response User friendly software and downloadable website 32
33 Hotspot Detection Innovation Upper Level Set Scan Statistic Attractive Features Identifies arbitrarily shaped clusters Data-adaptive adaptive zonation of candidate hotspots Applicable to data on a network Provides both a point estimate as well as a confidence set for the t hotspot Uses hotspot-membership rating to map hotspot boundary uncertainty Computationally efficient Applicable to both discrete and continuous syndromic responses Identifies arbitrarily shaped clusters in the spatial-temporal temporal domain Provides a typology of space-time hotspots with discriminatory surveillance potential 33
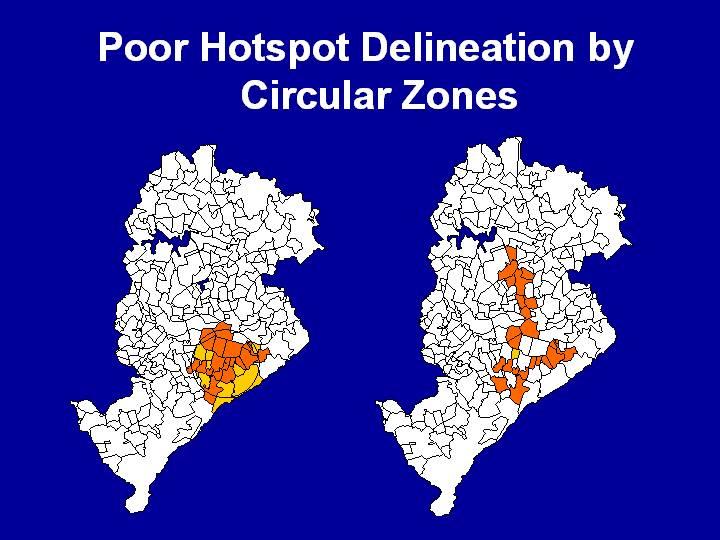
34 Poor Hotspot Delineation by Circular Zones Hotspot Circular zone approximations Circular zones may represent single hotspot as multiple hotspots 34
35 Scan Statistic Zonation for Circles and Space-Time Cylinders Time Cholera outbreak along a river flood-plain Small circles miss much of the outbreak Large circles include many unwanted cells Space Outbreak expanding in time Small cylinders miss much of the outbreak Large cylinders include many unwanted cells 35
36 Candidate Zones Z Tessellated study area Want zones to be connected Allowable zone Ω= collection of all (allowable) zones Not a zone = collection of all connected unions of cells Maximize L(Z) for Z in Ω 36
37 ULS Scan Statistic -- 1 Tessellation of a geographic region c k j a b e h f i d g a, b, c, are cell labels Region R, Tessellation T = {a} of R Cell a, Response Y a, Cell Size A a Two distributional settings: Y a is Binomial ( N a, p a ), A a = N a, p a = cell rate/intensity Y a is Poisson ( λ a A a ), λ a = cell rate/intensity Cell sizes A a are known and fixed Cell responses Y a, a A, are independent 37
38 ULS Scan Statistic -- 2 G a = Y a / A a empirical cell intensity determines a cellular (piece-wise constant) surface defined over the tessellated region Zones Z are connected unions of cells from tessellation Ω = collection of all possible zones SatScan hotspot model: Zone Z such that p a = p 1 for all a Z p a = p 0 for all a R - Z p 1 > p 0 38
39 ULS Scan Statistic 3 Hotspot Detection Hypothesis testing approach: H 0 : There is no hotspot; p a constant for all cells a H 1 : There is a hotspot Z Ω; Z unknown Parameter space for full model: { (Z, p 1, p 0 ) : Z Ω, 0 < p 0 p 1 < 1 } For fixed Z, expression for likelihood and MLE for p 1, p 0 are straightforward Profile likelihood for Z : L(Z) = Max {L (Z, p 1, p 0 ) : 0 < p 0 p 1 < 1 }, Z Ω 39
40 Ω is finite but large Maximizing L(Z), Z Ω, by exhaustive search impractical Possible optimization methods: ULS Scan Statistic 4 Hotspot Estimation Stochastic optimization (annealing, GA, etc. ) Reduction of Ω to Ω 0 with Ω 0 Ω and Ω 0 small enough for exhaustive search Possible reductions of Ω to Ω 0 : Expanding circles An a priori reduction which depends only on the tessellation and not on the data Upper level sets of empirical intensity surface (Tree-Structured SATScan) An adaptive, data-dependent, reduction allowing flexible shapes for zones in Ω 0. Data dependence must be incorporated into simulations. 40
41 ULS Scan Statistic 5 Hotspot Testing Test H 0 versus H 1 for significance of hotspot Use reduced parameter space Ω 0 Zˆ = hotspot MLE, maximizes L( Z), Z Ω Likelihood ratio test Test statistic: LR = L(H ˆ 0) / L( Z) Reject H when LR is small 0 Nonstandard likelihood situation ( Ω 0 is finite discrete; parameter Z is non-identifiable under H 0 ) Asymptotic chi-squared not applicable Null distribution of LR to be determined by simulation Eliminate nuisance parameters p 1, p 0 under H 0 by conditioning on the total response a Y a 0 41
42 ULS Scan Statistic 6 Goal: Identify geographic zone(s) in which a response is significantly elevated relative to the rest of a region A list of candidate zones Z is specified a priori. This list becomes part of the parameter space and the zone must be estimated from within this list. Each candidate zone should generally be spatially connected, e.g., a union of contiguous spatial units or cells. Longer lists of candidate zones are usually preferable Expanding circles or ellipses about specified centers are a common method of generating the list 42
43 ULS Scan Statistic 7 Question: Are there data-driven (rather than a priori) ways of selecting the list of candidate zones? Motivation for the question: A human being can look at a map and quickly determine a reasonable set of candidate zones and eliminate many other zones as obviously uninteresting. Can the computer do the same thing? A data-driven proposal: Candidate zones are the connected components of the upper level sets of the response surface. The candidate zones have a tree structure, which may assist in automated detection of multiple, but geographically separate, elevated zones. Null distribution: If the list is data-driven (i.e., random), its variability must be accounted for in the null distribution. A new list must be developed for each simulated data set. 43
44 Upper Level Set (ULS) of Intensity Surface Intensity G g Z1 Z Z 2 3 Region R Hotspot zones at level g (Connected Components of upper level set) 44
45 Changing Connectivity of ULS as Level Drops Intensity G g g Z1 Z2 Z3 Z Z Z Region R 45
46 ULS Connectivity Tree -- 1 Ingredients: Tessellation of a geographic region: c k j a b e Intensity value G on each cell. Determines a cellular (piece-wise constant) surface with G as elevation. Imagine surface initially inundated with water Water evaporates gradually exposing the surface which appears as islands in the sea How does connectivity (number of connected components) of the exposed surface change with h f i d g a, b, c, are cell labels 46
47 ULS Connectivity Tree -- 2 Think of the tessellated surface as a landform Initially the entire surface is under water As the water level recedes, more and more of the landform is exposed At each water level, cells are colored as follows: Green for previously exposed cells (green = vegetated) Yellow for newly exposed cells (yellow = sandy beach) Blue for unexposed cells (blue = under water) For each newly exposed cell, one of three things happens: New island emerges. Cell is a local maximum. Morse index=2. Connectivity increases. Existing island increases in size. Cell is not a critical point. Connectivity unchanged. Two (or more) islands are joined. Cell is a saddle point Morse index=1. Connectivity decreases. 47
48 ULS Connectivity Tree -- 3 Newly exposed island c k j a b e h f i d g ULS Tree a Island grows j c a b e k h f i d g a b,c 48
49 ULS Connectivity Tree -- 4 Second island appears c k j a b e h f i d g a b,c ULS Tree d New leaf node (local maximum) Both islands grow j h c a b e k f i d g a b,c e d f,g 49
50 ULS Connectivity Tree -- 5 Islands join saddle point j h f d c a b e i k a g b,c ULS Tree e h d f,g Junction node Exposed land grows j h c a b e k f i d g a b,c e d f,g h i,j,k Root node 50
51 Comparison of Tree-Structured and Circle-Based SATScan Agreement/Disagreement regarding hotspot locus Pr[ Zˆ I Zˆ ] ULS circles Comparative plausibility and accuracy of hotspot delineation Pr[ LZ ( ˆ ) LZ ( ˆ ) ] ULS circles Execution time and computer efficiency 51
52 ULS Connectivity Tree Intensity G g Z Z Z g A Z4 Z5 Z6 Schematic intensity surface B C N.B. Intensity surface is cellular (piece-wise constant), with only finitely many levels A, B, C are junction nodes where multiple zones coalesce into a single zone 52
53 A confidence set of hotspots on the ULS tree. The different connected components correspond to different hotspot loci while the nodes within a connected component correspond to different delineations of that hotspot Tessellated Region R MLE Junction Node Alternative Hotspot Delineation Alternative Hotspot Locus 53
54 Hotspot Delineation and Hotspot Rating Determine a confidence set for the hotspot Each member of the confidence set is a zone which is a statistically plausible delineation of the hotspot at specified confidence Confidence set lets us rate individual cells a for hotspot membership Rating for cell a is percentage of zones in confidence set that contain a. (More generally, use weighted proportion.) Map of cell ratings: Inner envelope = cells with 100% rating Outer envelope = cells with positive rating 54
55 Estimation Uncertainty in Hotspot Delineation MLE Outer envelope Inner envelope 55
56 Space-Time Detection and Early Warning ULS Scan Statistic The traditional space-time scan statistic employs cylinders as the candidate zones in the reduced parameter space. In many instances, the cylindrical shape may be a poor approximation to actual space-time hotspots, whereas the ULS approach is able to adapt its shape to the actual hotspot. Since the ULS tree is derived from the adjacency matrix, the same software will work once the notion of adjacency has been specified for spacetime cells. 56
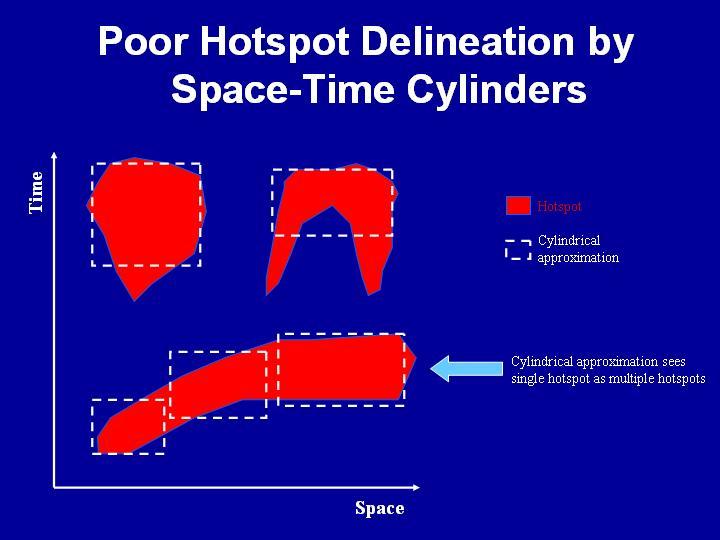
57 Some Space-Time Hotspots and Their Cylindrical Approximations Time Hotspot Cylindrical approximation Cylindrical approximation sees single hotspot as multiple hotspots Space 57
58 Hotspot Detection for Continuous Responses Human Health Context: Blood pressure levels for spatial variation in hypertension Cancer survival (censoring issues) Environmental Context: Landscape metrics such as forest cover, fragmentation, etc. Pollutant loadings Animal abundance 58
59 Hotspot Model for Continuous Responses Simplest distributional model: Y a ~ Gamma( k, β ) Additivity with respect to the index parameter k suggests that we model k as proportional to size: k a = / c. Scale parameter β takes one value inside Z and another outside Z Other distribution models (e.g., lognormal) are possible but are computationally more complex and applicable to only a single spatial scale A a 59
60 Circles vs ULS Circles capture only compactly shaped clusters Want to identify clusters of arbitrary shape Circles provide point estimate of hotspot Want to assess estimation uncertainty (hotspot confidence set) Circles handle only synoptic (tessellated) data Want to also handle data on a network 60
61 Multiple Criteria Analysis Multiple Indicators and Choices Health Statistics Disease Etiology, Health Policy, Resource Allocation First stage screening Significant clusters by SaTScan and/or upper level sets Second stage screening Multicriteria noteworthy clusters by partially ordered sets and Hass diagrams Final stage screening Follow up clusters for etiology, intervention based on multiple criteria using Hass diagrams 61
62 Network Analysis of Biological Integrity in Freshwater Streams 62
63 Network-Based Surveillance Subway system surveillance Drinking water distribution system surveillance Stream and river system surveillance Postal System Surveillance Road transport surveillance Syndromic Surveillance 63
64 Syndromic Surveillance Admissions Records Method of ε-machines a 1 a 2 a 3 a 4 M.δαηηλψ. Symbol Stream High dimensional vector LSA v 1 v 2 M Reduced dimensional vector 1. Language Sample 2. Tree of all substrings of length l with transition probabilities abaaabaaababababaaabab. 3. PFSA 0 b, p(b 0) a 2 1 a p(a 1), b p(b 1) 0 b, P(b 0) a, P(a 0) 1 2 a b, P(b 2) a, P(a 2) a, p(a 0) b, P(b 3) a, P(a 3) a a Hospital Behavior Model Formal Language Measure Crisis Behavior Model Crisis Index (left) The overall procedure, leading from admissions records to the crisis index for a hospital. The hotspot detection algorithm is then applied to the crisis index values defined over the hospital network. (right) The -machine procedure for converting an event stream into a parse tree and finally into a probabilistic finite state automaton (PFSA). 64
65 Symbolization: Network Sensor Readings to Symbolic Dynamics Phase-Space Trajectory String of Symbols Sensor Sensor 2 0 α ε β δ φ η χ 0 φ χ γ η δ α δ χ γ Sensor
66 Experimental Validation Pressure sensitive floor Formal Language Events: a green to red or red to green b green to tan or tan to green c green to blue or blue to green d red to tan or tan to red e blue to red or red to blue f blue to tan or tan to blue a Wall following a 8 5 c d 7 6 f d f 12 c 9 f 0 a 10 d 11 c f a 1 2 c d 4 3 f 0 a, b, c, d, e, f Random walk Counter-Clockwise c d a Clockwise Target Behavior Analyze String Rejections 66
67 Emergent Surveillance Plexus (ESP) Surveillance Sensor Network Testbed Autonomous Ocean Sampling Network Types of Hotspots Hotspots due to multiple, localized, stationary sources Hotspots corresponding to areas of interest in a stationary mapped field Time-dependent, localized hotspots Hotspots due to moving point sources 67

68 Ocean SAmpling MObile Network OSAMON 68
69 Ocean SAmpling MObile Network OSAMON Feedback Loop Network sensors gather preliminary data ULS scan statistic uses available data to estimate hotspot Network controller directs sensor vehicles to new locations Updated data is fed into ULS scan statistic system 69
70 SAmpling MObile Networks (SAMON) Additional Application Contexts Hotspots for radioactivity and chemical or biological agents to prevent or mitigate the effects of terrorist attacks or to detect nuclear testing Mapping elevation, wind, bathymetry, or ocean currents to better understand and protect the environment Detecting emerging failures in a complex networked system like the electric grid, internet, cell phone systems Mapping the gravitational field to find underground chambers or tunnels for rescue or combat missions 70

71 Scalable Wireless Geo-Telemetry with Miniature Smart Sensors Geo-telemetry enabled sensor nodes deployed by a UAV into a wireless ad hoc mesh network: Transmitting data and coordinates to TASS and GIS support systems 71

72 Architectural Block Diagram of Geo-Telemetry Enabled Sensor Node with Mesh Network Capability 72

73 Data Fusion Hierarchy for Smart Sensor Network with Scalable Wireless Geo-Telemetry Capability 73


74 Wireless Sensor Networks for Habitat Monitoring 74

75 Video Surveillance and Data Streams 75

76 Crop Attack Decision Support System Site Identification Module Crops Key Crop Areas NOAA Weather Threat Locations Hyperspectral Imagery Signature Development Module Plants Infected Non-infected Sentinel Ground Cameras Air/Space Platforms Data Processing Signature Library Anomaly Report Ground Truthing 76

77 Crop Biosurveillance/Biosecurity 77
78 Crop Biosurveillance/Biosecurity Data Processing Module Hyperspectral Imagery Image Segmentation (hyperclustering) Tessellation (segmentation) of raster grid Proxy Signal (per segment) Signature Similarity Map Signature Library Disease Signature Similarity Index (per segment) Hotspot/ Anomaly Detection 78
79 Prioritization Innovation Partial Order Set Ranking We also present a prioritization innovation. It lies in the ability for prioritization and ranking of hotspots based on multiple indicator and stakeholder criteria without having to integrate indicators into an index, using Hasse diagrams and partial order sets. This leads us to early warning systems, and also to the selection of investigational areas. 79
80 HUMAN ENVIRONMENT INTERFACE LAND, AIR, WATER INDICATORS for land - % of undomesticated land, i.e., total land area-domesticated (permanent crops and pastures, built up areas, roads, etc.) for air - % of renewable energy resources, i.e., hydro, solar, wind, geothermal for water - % of population with access to safe drinking water RANK COUNTRY 1 Sweden 2 Finland 3 Norway 5 Iceland 13 Austria 22 Switzerland 39 Spain 45 France 47 Germany 51 Portugal 52 Italy 59 Greece 61 Belgium 64 Netherlands 77 Denmark 78 United Kingdom 81 Ireland LAND AIR WATER
81 Hasse Diagram (all countries)
82 Hasse Diagram (Western Europe) Norway Sweden Finland Austria Switz. Ireland Italy Portugal Greece Spain Den. France UK Germany Belgium Neth. 82
83 83 83 Ranking Partially Ordered Sets Ranking Partially Ordered Sets 5 Linear extension decision tree a b d c e f a c e b b d f f d e d f e e f c f d e d f e e f d f e e f c f e e f c c f d e d f e e f d f e e f c b a b a d Jump Size: Poset (Hasse Diagram)
84 Cumulative Rank Frequency Operator 5 An Example of the Procedure In the example from the preceding slide, there are a total of 16 linear extensions, giving the following cumulative frequency table. Rank Element a b c d e f Each entry gives the number of linear extensions in which the element (row 84 label) receives a rank equal to or better that the column heading
85 Cumulative Rank Frequency Operator 6 An Example of the Procedure Cumulative Frequency Rank The curves are stacked one above the other and the result is a 85 linear ordering of the elements: a > b > c > d > e > f a b c d e f
86 Cumulative Rank Frequency Operator 7 An example where F must be iterated F F 2 Original Poset (Hasse Diagram) b a f e c g d g a f e b ad a f e b ad h c h g c h 86
87 Incorporating Judgment Poset Cumulative Rank Frequency Approach Certain of the indicators may be deemed more important than the others Such differential importance can be accommodated by the poset cumulative rank frequency approach Instead of the uniform distribution on the set of linear extensions, we may use an appropriately weighted probability distribution π, e.g., π ( 2 ω) = w 0 + w1n 1( ω) + w2n ( ω) + L+ w p np ( ω) 87
88 88
89 Space-Time Poverty Hotspot Typology Federal Anti-Poverty Programs have had little success in eradicating pockets of persistent poverty Can spatial-temporal temporal patterns of poverty hotspots provide clues to the causes of poverty and lead to improved location-specific anti- poverty policy? 89
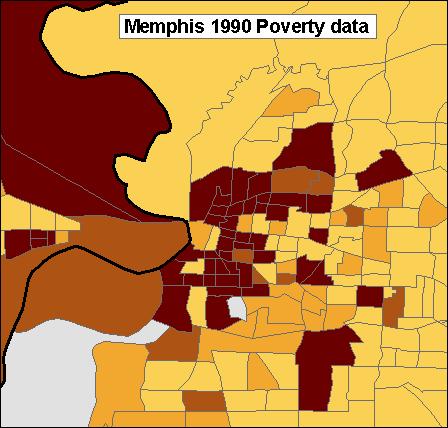
90 Dimensions of Tract Poverty in Four Metropolitan Areas Shifting Growing Persistent Concentrated Oakland, CA Detroit, MI Camden, NJ Memphis, TN 90


91 Growing poverty 91


92 Persistent poverty 92


93 Shifting poverty Oakland 1970 Poverty data Oakland 1980 Poverty data Oakland 1990 Poverty data 93


94 Camden 1970 Poverty data Camden 1980 Poverty data Concentrated poverty Camden 1990 Poverty data 94
95 Hotspot Persistence Persistence is a property of space-time hotspots Persistence can be assessed by the projection of the space-time hotspot onto the time axis Time (census year) Persistent Hotspot Space (census tract) Long Duration Time (census year) One-shot Hotspot Short Duration Space (census tract) 95
96 Typology of Persistent Space-Time Hotspots-1 Time (census year) Stationary Hotspot Time (census year) Expanding Hotspot Space (census tract) Space (census tract) Time (census year) Shifting Hotspot Time (census year) Contracting Hotspot Space (census tract) Space (census tract) 96
97 Typology of Persistent Space-Time Hotspots-2 These hotspots are connected in space-time However, certain time slices of the hotspot are disconnected in space Spatially disconnected time slice Time (census year) Time (census year) Bifurcating Hotspot Space (census tract) Merging Hotspot Space (census tract) 97
98 Trajectory of a Persistent Space-Time Hotspot A space-time hotspot is a three-dimensional object Visualization can be done by displaying the sequence of time slices---called the trajectory of the hotspot Time slices of space-time hotspot Time (census year) Merging Hotspot Space (census tract) 98
99 Trajectory of a Merging Hotspot
100 Trajectory of a Shifting Hotspot
101 Covariate Adjustment Known Covariate Effects (age, population size, etc.) Y a = count in cell a Y Poisson( λ A ) where λ = unknown relative risk for cell a a a a a A a = known numerical covariate adjustment Hotspot Hypothesis Testing Model H H 0 1 : λ are equal for all cells a (constant relative risk) a : λ take two distinct values, an elevated value in an unknown zone a and a smaller value outside Z Z List of candidate zones Z (ULS approach) All connected components of upper level sets of the adjuste cellular surface Y / A d a a 101
102 Covariate Adjustment Given Covariates, Unknown Effects Y Poisson( λ A ) where λ = unknown relative risk for cell a a a a a 0 A a = unknown covariate adjustment GLM Model Xa = vector of known covariate values for cell a β = vector of unknown covariate effects T T Model: log( A ) = X β or log( λ A ) η = log( λ ) + X β a a a a a a a Hotspot Hypothesis Testing Model H H 1 : λ are equal for all cells a (constant relative a rs i k) : λ take two distinct values, an elevated value in an unknown zone a and a smaller value outside Z List of candidate zones Z (ULS approach) All connected components of upper level sets of the adjusted cellular surface Y / A Here the model must be fitted under the null hypothesis before determining the adjustments a a A and the candidate zones Z a Z 102
103 Incorporating Spatial Autocorrelation Ignoring autocorrelation typically results in: under-assessment of variability over-assessment of significance (H 0 rejected too frequently) How can we account for possible autocorrelation? GLMM (SAR) Model Y a = count in cell a Y a distributed as Poisson η a = log(e[y a ]) The Y a are conditionally independent given the η a The η a are jointly Gaussian with a Simultaneous AutoRegressive (SAR) specification Here, µ = E[ η ] a a 2 a are iid N(0, σ ) η µ = ρ W ( η µ ) + ε a a ab a a a b ε Wab is a spatial weight expressing the "degree of association" between cells a and b (Take Waa = 0 and Wa = 1) Thus, the residual ηa µ a for cell a is a deflated (by ρ) weighted average of the residuals for neighboring cells plus a disturbance term ε a 103
104 Incorporating Spatial Autocorrelation SAR Model: Matrix Form: η µ = ρ W ( η µ ) + ε a a ab a a a b η µ = ρw( η µ ) + ε = ( ρ ) 1 η µ I W ε ( 1 ) 2 T σ ( ρ ) ( ρ ) η MVN µ, I W I W 2 Unknown Parameters: µ, ρ, σ a 2 Special Cases: σ = 0 classical (iid) spatial scan ( ρ is not identifiable here) ρ = σ 2 0, 0 overdispersed classical scan 104
105 Incorporating Spatial Autocorrelation GLMM (SAR) Model Y Poisson(exp( η )) = Poisson(exp( µ )exp( η µ )) = Poisson( λ A ) a a a a a a a ( 1 ) 2 T σ ρ ) ( ρ ) where η MVN µ, ( I W I W Hotspot Hypothesis Testing Model H0 : µ a are equal (to µ ) for all cells a (constant relative risk) H1 : µ a take two distinct values, an elevated value in an unknown zone Z and a smaller value outside Z List of candidate zones Z (ULS approach) All connected components of upper level sets of the adjusted cellular surface Ya / Aa where Aa = exp( η a µ ) Here the model must be fitted under the null hypothesis ( µ = µ ) before determining the adjustments Aa and the candidate zones a Z 105
106 Spatial Autocorrelation Plus Covariates In the SAR model, Y Poisson(exp( η )) a ( 1 ) 2 T E σ ρ ρ where η MVN [ η], ( I W) ( I W), express the mean of η as E[ η ] = µ + Xβ and formulate the Hotspot Hypothesis Testing Model in terms of the constant term µ in this expression. a 106
107 CAR Model The entire formulation is similar for Conditional AutoRegressive (CAR) specs except that the form of the variance-covariance matrix of η is changes. In the CAR model, Poisson(exp( η )) where η Y a a ( * E η σ ( I ρw ) 1 A ) 2 * * MVN [ ], and is diagonal However, parameters in CAR and SAR have very different interpretations. In CAR, the conditional variances are 2 * Var( ηa ηb, b a) = σ Aaa which (strangely) do not depend on the autocorrelation parameter ρ. In SAR, the conditional variances are Var( ηa ηb, b a) = σ ( 1+ ρ W b ba) This expression is intuitively appealing since the conditional variances 2 are decreasing functions of and are smallest for cells with many ρ 2 strongly associated neighbors (relatively large W for many b). ba A a. 107

108 Application of the Scan Statistic to Wetland and Stream Monitoring: Testing the Method in the Upper Juniata Watershed, Pennsylvania, USA Denice Heller Wardrop, Charles Taillie, Kristen Hychka,, G.P. Patil, and Wayne Myers Penn State University, University Park, PA Penn State Cooperative Wetlands Center 108
109 This presentation will.. Provide background on the resource to be monitored (wetland condition and restoration) Provide a description of the data set (the Upper Juniata watershed) Illustrate how the scan statistic was applied Recommend future enhancements of the scan statistic for environmental problem solving (surveillance and early warning) Penn State Cooperative Wetlands Center 109
110 Necessary Context Wetlands are a valuable ecological resource We are interested in their condition One way in which we assess condition is by the plant community We seek to relate land cover characteristics to wetland condition (e.g., plant community) Since we cannot identify hotspots of condition, can we identify hotspots of stress? Penn State Cooperative Wetlands Center 110
111 Why use the Scan Statistic? Identify critical areas of stress as an indicator of wetlands in potentially poor condition (condition assessment) Target restoration areas (restoration) Narrow down an overwhelming management problem (1300 square miles) into a manageable one Penn State Cooperative Wetlands Center 111
112 Which factors are good predictors of condition? Exhaustive assessment of landscape factors shows that agricultural activity on steep slopes (>8%) is an important factor in determining physical and biological condition Management of practices on steep agricultural lands is feasible, and current restoration programs have targeted these areas (USDA) Penn State Cooperative Wetlands Center 112

113 Penn State Cooperative Wetlands Center 113
114 Necessary Elements of the Scan Statistic Observed rate versus expected rate Contiguous coverage of elements Spatial independence Constraint on maximum hotspot size Penn State Cooperative Wetlands Center 114
115 Factors to consider when using SatScan for ecological data Size constraint placed on critical areas must be adjusted to the landscape of concern Circular shape of critical areas may not agree with ecological knowledge Penn State Cooperative Wetlands Center 115

116 Potential advantages of critical areas as Delineation of contributing areas is labor intensive Can critical areas give us a first cut as to wetlands in poor condition? Can they serve as an early warning? an indicator of stress Penn State Cooperative Wetlands Center 116


117 Penn State Cooperative Wetlands Center 117


118 Penn State Cooperative Wetlands Center 118
119 Restoration Targeting with SaTScan Can effectively target areas for restoration activities or best management practices Can be scaled so that critical area matches management area Penn State Cooperative Wetlands Center 119
120 Agricultural Use Sedimentation Plant Community Turbidity Amphibian Comm. Urbanization Bird Community Eutrophication Are there warnings? Macroinvertebrates Pollutant Trans. Hydroperiod Mining Hydrologic Modif. Fragmentation Organic Matter Soil Acidification Microtopography Penn State Cooperative Wetlands Center 120
121 Conclusions When using SaTScan,, assess appropriateness of circular critical areas and size constraints Can be used for condition assessment Highly useful for restoration targeting Use of scan statistic methods in an ecological context raises three future needs: Non-circular critical areas Ability to include spatial dependency (e.g., critical areas of condition, infectious disease) Continuous response variable (e.g., fertilizer loadings, livestock density) Penn State Cooperative Wetlands Center 121
122 Spatial-Temporal Surveillance for Infectious Disease: Where are we and where can we go? Glen D. Johnson, PhD,MS, MA Zoonoses Program Bureau of Communicable Disease Control New York State Department of Health and The State University of New York University at Albany School of Public Health Department of Environmental Health and Toxicology 122
123 Public Health Professionals Analysts & Researchers & Policy Makers Intended Users Law Enforcement & National Security Agencies Canadian & Mexican Public Health Partners General Public & Other Users Web-based Access User Interface Layer Data Management and Business Logic Layer Data Source Layer The WNV-BOT Portal Bi-directional Information Exchange NYSDOH WNV human cases Dead bird surveillance data Reports on mammals Mosquito surveillance data Vector control data CADHS Detailed WNV/BOT human cases Dead bird surveillance data Mosquito surveillance data Chicken sera data Information Sources Other Sources USGS/NWHC/NBII Epizoo data Canadian & Mexican public health data CDC WNV/BOT data NOAA and NASA data US Census Bureau NY GIS clearing house 123
124 West Nile Virus Surveillance through the HIN Written summary report of lab results ed internally within NYSDOH daily Public website map and summary report of lab results updated daily during WNV season Map of dead crow density by county posted to public website weekly Maps of prediction analysis results (SaTScan, kernel density estimation) posted to Secure Discussion Forum (requires HIN access) weekly 124
125 Ability of Dead Crow Clusters to Predict Human WNV 2002 data in NYS, excluding NYC exposed if town of residence within one mile of spatial cluster of crows within previous two weeks Estimate risk of exposed vs. unexposed by - Poisson regression, using cases within town/week units as response and adjusting for region, week, town population density, density squared and proportion of town > 50 years old - Proportional Hazards modelling, using week until onset as the response, stratifying by region and adjusting for town population density, density squared and proportion of town > 50 years old 125
126 So, What Next? Much data not currently being exploited - geo-spatial and spatial-temporal - much is free and readily available - some that may require development How use such data? -via GIS, compile with respect to geographic units of concern, such as townships -via Generalized Linear Mixed Models (GLMM), model outcome (i.e. # dead crows or human cases) as a function of predictors obtained across multiple spatial-temporal scales 126
127 Data Current: Monitor outcome variable only, such as - dead crows, positive mosquitoes, human cases for WNV - ER visits, pharmaceutical sales, syndromes, etc. proposed for BT-motivated surveillance Proposed: Incorporate predictive covariate data, such as - human population characteristics - climatic variables - season/day identifiers and for vectored diseases: - elevation / topography - wetland proximity - ecoregions - land cover / vegetation characteristics 127

128 128
129 How to combine all these data for purposes of surveillance? If risk is desired at, say, the town/township level, then modelling may be applied using towns as observational units. So for i = 1,, n towns, each town is represented by the outcome and covariates (as discussed). Models may then be used to predict risk, which may serve different purposes: - providing a basis for comparison of future observations - use risk predictions themselves to identify hot spots 129
130 Predicting WNV activity through adjusted dead crow counts Currently, dead crow counts provide weekly indication of WNV activity prior to obtaining lab results. Subject to extreme observation bias, as counts are directly proportional to human population density. 130
131 2002 dead crow locations 131
132 Breeding Bird Atlas indicates more uniform distribution 132

133 133
134 Although the risk of at least one person getting infected is also proportional to population density, the risk of any one individual in a rural area may be no less than an individual in a more populated area but dead crow clusters alone may not indicate this. So, how do we go beyond just identifying dead crows clusters in order to predict risk within small geographic areas (i.e. towns) in a way that adjusts for other variables related to crow and mosquito habitat? 134
135 Once the baseline dataset is established, from associating each area (say, town) with fundamental geo-spatial data, then a WNV risk map may be updated weekly by running the model for current week s crow counts and other covariates that change weekly, like rainfall. 135

136 Atlantic Slope Consortium Watershed Classification Modeling ecological condition in upstream watersheds and downstream estuaries in the Atlantic Slope Region D.H. Wardrop,, R.P. Brooks, G.P. Patil, W. Myers, M.M. Easterling,, and C. Taille

137 Penn State University Smithsonian Environmental Research Center Virginia Institute of Marine Science East Carolina University Environmental Law Institute FTN Associates Atlantic Slope Project 137
138 What s s the question? How do we develop a useful, relevant, and defensible set of indicators for the Atlantic Slope? We know how to do defensible This story is all about combining defensible ecology with relevant and useful in the Atlantic Slope Tools: watershed and estuarine segment classification for experimental design and identification of critical areas 138
139 Ecosystem State Ecosystem State Stress Stress Ecosystem State F 1 F 2 Ecosystem State F 2 Stress Stress Schematic representation of four possible responses of ecosystems to stress. Reproduced from Panarchy, 2002, Island Press. 139
140 Vision Statement Using a universe of watersheds and estuarine segments, covering a range of social choices, we ask two questions: How good can the environment be, given those social choices? What is the intellectual model of condition within those choices, i.e., what are the causes of condition and what are the steps for improvement? 140

141 Indicator Taxonomy Social Choices Assess condition Diagnose condition Measure management performance Communicate condition to the public and stakeholders Using a universe of watersheds, covering a range of social choices, we ask two questions: How good can the environment be, given those social choices? What is the intellectual model of condition within those choices, i.e., what are the causes of condition and what are the steps for improvement? 141
142 Resulting Process Define Watershed Types Compile Frequency Distributions Designate Sampling Design Distribute Candidate Watersheds 142
143 Ternary Plot Description Require a fuller pct_urban description of departure.2 from reference than.8 disturbed.4.6 Describes land use via the three main land.6.4 cover types.2 Can be used at any spatial extent (as can land cover %) pct_forest.8 pct_ag 143
144 Allegheny Plateau pct_urban pct_ag pct_forest
145 Ridge and Valley Watersheds pct_urban pc t_ag pc t_forest
146 Piedmont Watersheds pct_urban pct_ag pct_forest
147 Coastal Plain Watersheds pct_urban pct_ag pct_forest
148 Clustering Analysis should follow vision statement Clustered first on land uses (social choices) and slope (susceptibility of resource to land use) Binned on research question (many ways to be a mixed watershed) Other binning possible 148
149 High Slope High Forest Low Slope Low Forest, High Ag Low Slope High Urban Low Slope Moderate Forest Moderate Ag Moderate Slope High Nodal Var Low Nodal Var 149
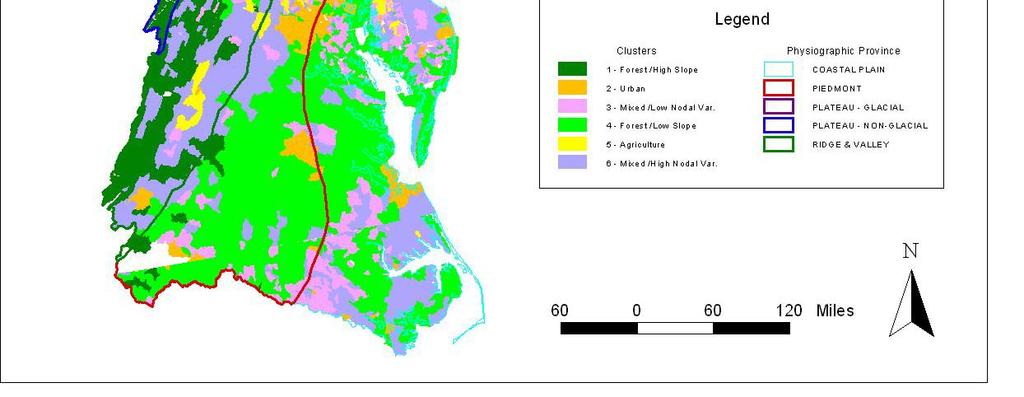
150 Results Six watershed classes identified: 1. Forested, high slope 2. Forested, low slope 3. Agricultural 4. Urban 5. Mixed, low nodal variance 6. Mixed, high nodal variance 150

151 151

152 152
153 153
154 154
155 155

156 Logo for Statistics, Ecology, Environment, and Society 156
An Introduction to SaTScan
 An Introduction to SaTScan Software to measure spatial, temporal or space-time clusters using a spatial scan approach Marilyn O Hara University of Illinois moruiz@illinois.edu Lecture for the Pre-conference
Applying Health Outcome Data to Improve Health Equity
 Applying Health Outcome Data to Improve Health Equity Devon Williford, MPH, Health GIS Specialist Lorraine Dixon-Jones, Policy Analyst CDPHE Health Equity and Environmental Justice Collaborative Mile High
Hotspot Geoinformatics Software for Detection and Prioritization. JalaSRI
 Hotspot Geoinformatics Software for Detection and Prioritization Est. 15 th Aug 2006 JalaSRI Watershed Surveillance and Research Institute Sponsored by K.C.E. Society's Moolji Jaitha College, Jalgaon 1
Summary Description Municipality of Anchorage. Anchorage Coastal Resource Atlas Project
 Summary Description Municipality of Anchorage Anchorage Coastal Resource Atlas Project By: Thede Tobish, MOA Planner; and Charlie Barnwell, MOA GIS Manager Introduction Local governments often struggle
Long Island Breast Cancer Study and the GIS-H (Health)
") Long Island Breast Cancer Study and the GIS-H (Health) Edward J. Trapido, Sc.D. Associate Director Epidemiology and Genetics Research Program, DCCPS/NCI COMPREHENSIVE APPROACHES TO CANCER CONTROL September,
Long Island Breast Cancer Study and the GIS-H (Health) Edward J. Trapido, Sc.D. Associate Director Epidemiology and Genetics Research Program, DCCPS/NCI COMPREHENSIVE APPROACHES TO CANCER CONTROL September,
Cluster Analysis using SaTScan. Patrick DeLuca, M.A. APHEO 2007 Conference, Ottawa October 16 th, 2007
 Cluster Analysis using SaTScan Patrick DeLuca, M.A. APHEO 2007 Conference, Ottawa October 16 th, 2007 Outline Clusters & Cluster Detection Spatial Scan Statistic Case Study 28 September 2007 APHEO Conference
Chapter 6. Fundamentals of GIS-Based Data Analysis for Decision Support. Table 6.1. Spatial Data Transformations by Geospatial Data Types
 Chapter 6 Fundamentals of GIS-Based Data Analysis for Decision Support FROM: Points Lines Polygons Fields Table 6.1. Spatial Data Transformations by Geospatial Data Types TO: Points Lines Polygons Fields
Summary of Available Datasets that are Relevant to Flood Risk Characterization
 Inter-Agency Characterization Workshop February 25-27, 2014 USACE Institute for Water Resources, Alexandria, VA, IWR Classroom Summary of Available Datasets that are Relevant to Characterization National
Application of GIS Technology in Watershed-based Management and Decision Making
 Application of GIS Technology in Watershed-based Management and Decision Making U. Sunday Tim Iowa State University Department of Agricultural and Biosystems Engineering 100 Davidson Hall Email:
EnviroAtlas: An Atlas about Ecosystems and their Connection with People
 EnviroAtlas: An Atlas about Ecosystems and their Connection with People Annie Neale, Megan Mehaffey & Atlas Team ASWM Webinar October, 17 th, 2012 What is it? The Atlas is an online decision support tool
A Help Guide for Using gssurgo to Find Potential Wetland Soil Landscapes
 A Help Guide for Using gssurgo to Find Potential Wetland Soil Landscapes Wetland Mapping Consortium Webinar September 17, 2014 Dr. John M. Galbraith Crop & Soil Environmental Sciences Virginia Tech Wetland
Role of GIS in Tracking and Controlling Spread of Disease
 Role of GIS in Tracking and Controlling Spread of Disease For Dr. Baqer Al-Ramadan By Syed Imran Quadri CRP 514: Introduction to GIS Introduction Problem Statement Objectives Methodology of Study Literature
What is GIS? Introduction to data. Introduction to data modeling
 What is GIS? Introduction to data Introduction to data modeling 2 A GIS is similar, layering mapped information in a computer to help us view our world as a system A Geographic Information System is a
Interactive GIS in Veterinary Epidemiology Technology & Application in a Veterinary Diagnostic Lab
 Interactive GIS in Veterinary Epidemiology Technology & Application in a Veterinary Diagnostic Lab Basics GIS = Geographic Information System A GIS integrates hardware, software and data for capturing,
THE USE OF GEOSPATIAL DATA TO SUPPORT VULNERABILITY MAPPING OF THE OREGON COAST. Kelvin Raiford MS Candidate Geography Department of Geosciences
 THE USE OF GEOSPATIAL DATA TO SUPPORT VULNERABILITY MAPPING OF THE OREGON COAST Kelvin Raiford MS Candidate Geography Department of Geosciences INTRODUCTION This study is an outcome of the project Geospatial
Creation of an Internet Based Indiana Water Quality Atlas (IWQA)
") Department of Environmental Management Creation of an Internet Based Water Quality Atlas (IWQA) May 4, 2005 IUPUI 1200 Waterway Blvd., Suite 100 polis, 46202-5140 Water Quality Atlas John Buechler, Neil
Department of Environmental Management Creation of an Internet Based Water Quality Atlas (IWQA) May 4, 2005 IUPUI 1200 Waterway Blvd., Suite 100 polis, 46202-5140 Water Quality Atlas John Buechler, Neil
Ellen L. Mecray NOAA Regional Climate Services Director, Eastern Region Taunton, MA
 Ellen L. Mecray NOAA Regional Climate Services Director, Eastern Region Taunton, MA Regions of the US National Climate Assessment What we Observe: Climate changes and impacts Extreme precipitation and
A Comprehensive Inventory of the Number of Modified Stream Channels in the State of Minnesota. Data, Information and Knowledge Management.
 A Comprehensive Inventory of the Number of Modified Stream Channels in the State of Minnesota Data, Information and Knowledge Management Glenn Skuta Environmental Analysis and Outcomes Division Minnesota
Louisiana Transportation Engineering Conference. Monday, February 12, 2007
 Louisiana Transportation Engineering Conference Monday, February 12, 2007 Agenda Project Background Goal of EIS Why Use GIS? What is GIS? How used on this Project Other site selection tools I-69 Corridor
UTAH S STATEWIDE GEOGRAPHIC INFORMATION DATABASE
 UTAH S STATEWIDE GEOGRAPHIC INFORMATION DATABASE Data Information and Knowledge Management NASCIO Awards 2009 STATE GEOGRAPHIC INFORMATION DATABASE B. EXECUTIVE SUMMARY Utah has developed one of the most
Spatial units (Levels 0 and 1)
") Spatial units (Levels 0 and 1) Project: Advancing the SEEA Experimental Ecosystem Accounting Overview: Spatial units 1. Learning objectives 2. Level 1: Presentation & group exercise Spatial units (10m
Spatial units (Levels 0 and 1) Project: Advancing the SEEA Experimental Ecosystem Accounting Overview: Spatial units 1. Learning objectives 2. Level 1: Presentation & group exercise Spatial units (10m
06/04/2015. Overview: Spatial units. Advancing the SEEA Experimental Ecosystem Accounting Spatial units (Level 1)
") Advancing the SEEA Experimental Ecosystem Accounting Spatial units (Level 1) Advancing the SEEA-EEA Project Overview: Spatial units 1. Learning objectives 2. Level 1: Presentation & group exercise Spatial
Advancing the SEEA Experimental Ecosystem Accounting Spatial units (Level 1) Advancing the SEEA-EEA Project Overview: Spatial units 1. Learning objectives 2. Level 1: Presentation & group exercise Spatial
Jim Fox. copyright UNC Asheville's NEMAC
 Decisions and System Thinking Jim Fox November, 2012 1 UNC Asheville s s NEMAC National Environmental Modeling and Analysis Center Applied Research and technology development on integration of environmental
What are the five components of a GIS? A typically GIS consists of five elements: - Hardware, Software, Data, People and Procedures (Work Flows)
") LECTURE 1 - INTRODUCTION TO GIS Section I - GIS versus GPS What is a geographic information system (GIS)? GIS can be defined as a computerized application that combines an interactive map with a database
LECTURE 1 - INTRODUCTION TO GIS Section I - GIS versus GPS What is a geographic information system (GIS)? GIS can be defined as a computerized application that combines an interactive map with a database
Earth Science (Tarbuck, et al) 2009 Correlated to: Colorado Academic Standards Science (High School)
 2009 Correlated to: Colorado Academic Standards Science (High School)") Content Area: Science Standard: Earth Systems Science Prepared Graduates: Describe and interpret how Earth's geologic history and place in space are relevant to our understanding of the processes that
Content Area: Science Standard: Earth Systems Science Prepared Graduates: Describe and interpret how Earth's geologic history and place in space are relevant to our understanding of the processes that
Colorado Academic Standards for High School Science Earth Systems Science
 A Correlation of Pearson 12 th Edition 2015 Colorado Academic Standards Introduction This document demonstrates the alignment between, 12 th Edition, 2015, and the, Earth Systems Science. Correlation page
Compact guides GISCO. Geographic information system of the Commission
 Compact guides GISCO Geographic information system of the Commission What is GISCO? GISCO, the Geographic Information System of the COmmission, is a permanent service of Eurostat that fulfils the requirements
Chesapeake Bay Remote Sensing Pilot Executive Briefing
 Chesapeake Bay Remote Sensing Pilot Executive Briefing Introduction In his Executive Order 13506 in May 2009, President Obama stated The Chesapeake Bay is a national treasure constituting the largest estuary
ENV208/ENV508 Applied GIS. Week 1: What is GIS?
 ENV208/ENV508 Applied GIS Week 1: What is GIS? 1 WHAT IS GIS? A GIS integrates hardware, software, and data for capturing, managing, analyzing, and displaying all forms of geographically referenced information.
Map your way to deeper insights
 Map your way to deeper insights Target, forecast and plan by geographic region Highlights Apply your data to pre-installed map templates and customize to meet your needs. Select from included map files
GIS and Coastal Nutrients Luke Cole
 GIS and Coastal Nutrients Luke Cole Human population density has been widely utilized as a valid predictor of terrestrial nitrogen loads into marine systems. As 50% of the world s population lives within
DEPARTMENT OF GEOLOGY AND MINERAL INDUSTRIES WAYS & MEANS SUBCOMMITTEE ON NATURAL RESOURCES MARCH 2, 2017
 DEPARTMENT OF GEOLOGY AND MINERAL INDUSTRIES WAYS & MEANS SUBCOMMITTEE ON NATURAL RESOURCES MARCH 2, 2017 1 ABOUT DOGAMI AGENCY MISSION, VISION & GOALS 2 Lidar image of a stream network along the Umpqua
Spatial Units (Level 1)
") Spatial Units (Level 1) Project: Advancing the SEEA Experimental Ecosystem Accounting Overview: Spatial Units 1. Learning objectives 2. Review of Level 0 (5m) 3. Level 1 (Compilers): Presentation & group
Spatial Units (Level 1) Project: Advancing the SEEA Experimental Ecosystem Accounting Overview: Spatial Units 1. Learning objectives 2. Review of Level 0 (5m) 3. Level 1 (Compilers): Presentation & group
Urbanization, Land Cover, Weather, and Incidence Rates of Neuroinvasive West Nile Virus Infections In Illinois
 Urbanization, Land Cover, Weather, and Incidence Rates of Neuroinvasive West Nile Virus Infections In Illinois JUNE 23, 2016 H ANNAH MATZ KE Background Uganda 1937 United States -1999 New York Quickly
An Internet-Based Integrated Resource Management System (IRMS)
") An Internet-Based Integrated Resource Management System (IRMS) Third Quarter Report, Year II 4/1/2000 6/30/2000 Prepared for Missouri Department of Natural Resources Missouri Department of Conservation
An Internet-Based Integrated Resource Management System (IRMS) Third Quarter Report, Year II 4/1/2000 6/30/2000 Prepared for Missouri Department of Natural Resources Missouri Department of Conservation
NSF Expeditions in Computing. Understanding Climate Change: A Data Driven Approach. Vipin Kumar University of Minnesota
 NSF Expeditions in Computing Understanding Climate Change: A Data Driven Approach Vipin Kumar University of Minnesota kumar@cs.umn.edu www.cs.umn.edu/~kumar Vipin Kumar UCC Aug 15, 2011 Climate Change:
STATE GEOGRAPHIC INFORMATION DATABASE
 STATE GEOGRAPHIC INFORMATION DATABASE Data Information and Knowledge Management STATE GEOGRAPHIC INFORMATION DATABASE EXECUTIVE SUMMARY Utah has developed one of the most comprehensive statewide GIS resources
USGS National Geospatial Program Understanding User Needs. Dick Vraga National Map Liaison for Federal Agencies July 2015
 + USGS National Geospatial Program Understanding User Needs Dick Vraga National Map Liaison for Federal Agencies July 2015 + Topics 2 Background Communities of Use User Surveys National Map Liaisons Partnerships
GIS and Remote Sensing
 Spring School Land use and the vulnerability of socio-ecosystems to climate change: remote sensing and modelling techniques GIS and Remote Sensing Katerina Tzavella Project Researcher PhD candidate Technology
Globally Estimating the Population Characteristics of Small Geographic Areas. Tom Fitzwater
 Globally Estimating the Population Characteristics of Small Geographic Areas Tom Fitzwater U.S. Census Bureau Population Division What we know 2 Where do people live? Difficult to measure and quantify.
MISSOURI LiDAR Stakeholders Meeting
 MISSOURI LiDAR Stakeholders Meeting East-West Gateway June 18, 2010 Tim Haithcoat Missouri GIO Enhanced Elevation Data What s different about it? Business requirements are changing.fast New data collection
Geography General Course Year 12. Selected Unit 3 syllabus content for the. Externally set task 2019
 Geography General Course Year 12 Selected Unit 3 syllabus content for the Externally set task 2019 This document is an extract from the Geography General Course Year 12 syllabus, featuring all of the content
Linking local multimedia models in a spatially-distributed system
 Linking local multimedia models in a spatially-distributed system I. Miller, S. Knopf & R. Kossik The GoldSim Technology Group, USA Abstract The development of spatially-distributed multimedia models has
Cluster Analysis using SaTScan
 Cluster Analysis using SaTScan Summary 1. Statistical methods for spatial epidemiology 2. Cluster Detection What is a cluster? Few issues 3. Spatial and spatio-temporal Scan Statistic Methods Probability
Northrop Grumman Concept Paper
 Northrop Grumman Concept Paper A Comprehensive Geospatial Web-based Solution for NWS Impact-based Decision Support Services Glenn Higgins April 10, 2014 Northrop Grumman Corporation Information Systems
USGS Hydrography Overview. May 9, 2018
 + 1 USGS Hydrography Overview May 9, 2018 + 2 The National Geospatial Program Provides the geospatial baseline of the Nation s topography, natural landscape and built environment through The National Map,
Land Accounts - The Canadian Experience
 Land Accounts - The Canadian Experience Development of a Geospatial database to measure the effect of human activity on the environment Who is doing Land Accounts Statistics Canada (national) Component
The Arctic Landscape Conservation Cooperative Conservation Goals
 The Arctic Landscape Conservation Cooperative Conservation Goals Adopted by the Arctic LCC Steering Committee, 24 August 2010 Background : Landscape Conservation Cooperatives and Climate Science Centers
ACCESSIBILITY TO SERVICES IN REGIONS AND CITIES: MEASURES AND POLICIES NOTE FOR THE WPTI WORKSHOP, 18 JUNE 2013
 ACCESSIBILITY TO SERVICES IN REGIONS AND CITIES: MEASURES AND POLICIES NOTE FOR THE WPTI WORKSHOP, 18 JUNE 2013 1. Significant differences in the access to basic and advanced services, such as transport,
GeoHealth Applications Platform ESRI Health GIS Conference 2013
 GeoHealth Applications Platform ESRI Health GIS Conference 2013 Authors Thomas A. Horan, Ph.D. Professor, CISAT Director April Moreno Health GeoInformatics Ph.D. Student Brian N. Hilton, Ph.D. Clinical
United States Department of the Interior NATIONAL PARK SERVICE Northeast Region
 United States Department of the Interior NATIONAL PARK SERVICE Northeast Region June 17, 2017 REQUEST FOR STATEMENTS OF INTEREST and QUALIFICATIONS Project Title: ASSESSMENT OF NATURAL RESOURCE CONDITION
US National Spatial Data Infrastructure A Spatial Framework for Governance and Policy Development to Enable a Location-Based Digital Ecosystem
 GeoPlatform Workshop 7 Dec 2016, Department of the Interior Washington, D.C. US National Spatial Infrastructure A Spatial Framework for Governance and Policy Development to Enable a Location-Based Digital
AUTOMATED DATA PROCESSING FOR MARITIME AND FLOODS APPLICATIONS
 YOUR HUB FOR GEOSPATIAL APPLICATIONS AUTOMATED DATA PROCESSING FOR MARITIME AND FLOODS APPLICATIONS Angelucci Maria, Daffina Filippo, Grandoni Domenico, Quattrociocchi Dino Automated Data Processing (Smart
Introduction to Spatial Big Data Analytics. Zhe Jiang Office: SEC 3435
 Introduction to Spatial Big Data Analytics Zhe Jiang zjiang@cs.ua.edu Office: SEC 3435 1 What is Big Data? Examples Internet data (images from the web) Earth observation data (nasa.gov) wikimedia.org www.me.mtu.edu
EuroGEOSS Protected Areas Pilot
 EuroGEOSS Protected Areas Pilot Max Craglia European Commission Joint Research Centre Part 1: the present MyNatura2000 Mobile app. Awareness raising & volunteered data collection. Natura2000 covers 18%
KENTUCKY HAZARD MITIGATION PLAN RISK ASSESSMENT
 KENTUCKY HAZARD MITIGATION PLAN RISK ASSESSMENT Presentation Outline Development of the 2013 State Hazard Mitigation Plan Risk Assessment Determining risk assessment scale Census Data Aggregation Levels
SEASONAL CLIMATE OUTLOOK VALID FOR JULY-AUGUST- SEPTEMBER 2013 IN WEST AFRICA, CHAD AND CAMEROON
 SEASONAL CLIMATE OUTLOOK VALID FOR JULY-AUGUST- SEPTEMBER 2013 IN WEST AFRICA, CHAD AND CAMEROON May 29, 2013 ABUJA-Federal Republic of Nigeria 1 EXECUTIVE SUMMARY Given the current Sea Surface and sub-surface
Graduate Courses Meteorology / Atmospheric Science UNC Charlotte
 Graduate Courses Meteorology / Atmospheric Science UNC Charlotte In order to inform prospective M.S. Earth Science students as to what graduate-level courses are offered across the broad disciplines of
A Spatial Multiple Discrete-Continuous Model
 A Spatial Multiple Discrete-Continuous Model Chandra R. Bhat 1,2 and Sebastian Astroza 1,3 1: The University of Texas at Austin 2: The Hong Kong Polytechnic University 3: Universidad de Concepción Outline
Geography (GEOG) Introduction to Geography Global Change and Natural Disasters and Environmental Change
 Introduction to Geography Global Change and Natural Disasters and Environmental Change") Geography (GEOG) Head of Department: Professor Jeffrey P. Osleeb Department Office: Room 422, Philip E. Austin Building For major requirements, see the College of Liberal Arts and Sciences section of this
Geography (GEOG) Head of Department: Professor Jeffrey P. Osleeb Department Office: Room 422, Philip E. Austin Building For major requirements, see the College of Liberal Arts and Sciences section of this
State of Israel Ministry of Housing and Construction Survey of Israel. The Hydrological project case
 State of Israel Ministry of Housing and Construction Survey of Israel The Hydrological project case Survey of Israel Content Introduction To the Survey of Israel The operation assumptions The main responsibilities
Welcome to NetMap Portal Tutorial
 Welcome to NetMap Portal Tutorial Potential Applications What Can you do with the Portal? At least 25 things! 1) Locate the best potential fish habitats. 2) Identify biological hotspots. 3) Map floodplain
Opportunities to Improve Ecological Functions of Floodplains and Reduce Flood Risk along Major Rivers in the Puget Sound Basin
 Opportunities to Improve Ecological Functions of Floodplains and Reduce Flood Risk along Major Rivers in the Puget Sound Basin Christopher Konrad, US Geological Survey Tim Beechie, NOAA Fisheries Managing
NREL, Intro to GIS for Wind Energy Siting for IGERT Wind NSF
 NREL, 2010 Intro to GIS for Wind Energy Siting for IGERT Wind NSF Challenge: How to encourage offshore wind in the US while managing ecological responsibility and ocean use conflicts? Introduction NREL,
USING CLUSTERING SOFTWARE FOR EXPLORING SPATIAL AND TEMPORAL PATTERNS IN NON-COMMUNICABLE DISEASES
 USING CLUSTERING SOFTWARE FOR EXPLORING SPATIAL AND TEMPORAL PATTERNS IN NON-COMMUNICABLE DISEASES Mariana Nagy "Aurel Vlaicu" University of Arad Romania Department of Mathematics and Computer Science
1.1 What is Site Fingerprinting?
 Site Fingerprinting Utilizing GIS/GPS Technology 1.1 What is Site Fingerprinting? Site fingerprinting is a planning tool used to design communities where protection of natural resources is the primary
4. GIS Implementation of the TxDOT Hydrology Extensions
 4. GIS Implementation of the TxDOT Hydrology Extensions A Geographic Information System (GIS) is a computer-assisted system for the capture, storage, retrieval, analysis and display of spatial data. It
Background. Points of Discussion. Hydrographic Models
 Airborne Laser Remote Sensing Technology: Providing Essential Hydrologic Information in the 21 st Century Warwick Hadley, Optech Incorporated Presented by: Warwick Hadley Sales Manager, Middle East and
Rural Pennsylvania: Where Is It Anyway? A Compendium of the Definitions of Rural and Rationale for Their Use
 Rural Pennsylvania: Where Is It Anyway? A Compendium of the Definitions of Rural and Rationale for Their Use Pennsylvania Office of Rural Health 310 Nursing Sciences Building University Park, PA 16802
GOVERNMENT MAPPING WORKSHOP RECOVER Edmonton s Urban Wellness Plan Mapping Workshop December 4, 2017
 GOVERNMENT MAPPING WORKSHOP 12.4.17 RECOVER Edmonton s Urban Wellness Plan Mapping Workshop December 4, 2017 In July of 2017, City Council directed administration to develop RECOVER, Edmonton s Urban Wellness
Developing Spatial Awareness :-
 Developing Spatial Awareness :- We begin to exercise our geographic skill by examining he types of objects and features we encounter. Four different spatial objects in the real world: Point, Line, Areas
International Conference Analysis and Management of Changing Risks for Natural Hazards November 2014 l Padua, Italy
 Abstract Code: B01 Assets mapping products in support of preparedness and prevention measures (examples from Germany, Italy and France) Marc Mueller, Thierry Fourty, Mehdi Lefeuvre Airbus Defence and Space,
GEOMATICS. Shaping our world. A company of
 GEOMATICS Shaping our world A company of OUR EXPERTISE Geomatics Geomatics plays a mayor role in hydropower, land and water resources, urban development, transport & mobility, renewable energy, and infrastructure
New Land Cover & Land Use Data for the Chesapeake Bay Watershed
 New Land Cover & Land Use Data for the Chesapeake Bay Watershed Why? The Chesapeake Bay Program (CBP) partnership is in the process of improving and refining the Phase 6 suite of models used to inform
Your web browser (Safari 7) is out of date. For more security, comfort and. the best experience on this site: Update your browser Ignore
 is out of date. For more security, comfort and. the best experience on this site: Update your browser Ignore") Your web browser (Safari 7) is out of date. For more security, comfort and Activityengage the best experience on this site: Update your browser Ignore Introduction to GIS What is a geographic information
Your web browser (Safari 7) is out of date. For more security, comfort and Activityengage the best experience on this site: Update your browser Ignore Introduction to GIS What is a geographic information
The Road to Data in Baltimore
 Creating a parcel level database from high resolution imagery By Austin Troy and Weiqi Zhou University of Vermont, Rubenstein School of Natural Resources State and local planning agencies are increasingly
MODELLING AND UNDERSTANDING MULTI-TEMPORAL LAND USE CHANGES
 MODELLING AND UNDERSTANDING MULTI-TEMPORAL LAND USE CHANGES Jianquan Cheng Department of Environmental & Geographical Sciences, Manchester Metropolitan University, John Dalton Building, Chester Street,
AN INTERNATIONAL SOLAR IRRADIANCE DATA INGEST SYSTEM FOR FORECASTING SOLAR POWER AND AGRICULTURAL CROP YIELDS
 AN INTERNATIONAL SOLAR IRRADIANCE DATA INGEST SYSTEM FOR FORECASTING SOLAR POWER AND AGRICULTURAL CROP YIELDS James Hall JHTech PO Box 877 Divide, CO 80814 Email: jameshall@jhtech.com Jeffrey Hall JHTech
Refinement of the OECD regional typology: Economic Performance of Remote Rural Regions
 [Preliminary draft April 2010] Refinement of the OECD regional typology: Economic Performance of Remote Rural Regions by Lewis Dijkstra* and Vicente Ruiz** Abstract To account for differences among rural
Spatial Analysis I. Spatial data analysis Spatial analysis and inference
 Spatial Analysis I Spatial data analysis Spatial analysis and inference Roadmap Outline: What is spatial analysis? Spatial Joins Step 1: Analysis of attributes Step 2: Preparing for analyses: working with
Pierce Cedar Creek Institute GIS Development Final Report. Grand Valley State University
 Pierce Cedar Creek Institute GIS Development Final Report Grand Valley State University Major Goals of Project The two primary goals of the project were to provide Matt VanPortfliet, GVSU student, the
ESPON evidence on European cities and metropolitan areas
 BEST METROPOLISES Final Conference 18 April 2013, Warsaw ESPON evidence on European cities and metropolitan areas Michaela Gensheimer Structure of Intervention Content Part I: What is the ESPON 2013 Programme?
DROUGHT ASSESSMENT USING SATELLITE DERIVED METEOROLOGICAL PARAMETERS AND NDVI IN POTOHAR REGION
 DROUGHT ASSESSMENT USING SATELLITE DERIVED METEOROLOGICAL PARAMETERS AND NDVI IN POTOHAR REGION Researcher: Saad-ul-Haque Supervisor: Dr. Badar Ghauri Department of RS & GISc Institute of Space Technology
Historical background
 Space Technology for Disaster Management in Sri Lanka: Country profile, national perspectives & vision. Professor Ranjith Premalal De Silva Vice Chancellor Uva Wellassa University of Sri Lanka October
A case study for self-organized criticality and complexity in forest landscape ecology
 Chapter 1 A case study for self-organized criticality and complexity in forest landscape ecology Janine Bolliger Swiss Federal Research Institute (WSL) Zürcherstrasse 111; CH-8903 Birmendsdorf, Switzerland
DEPARTMENT OF GEOGRAPHY B.A. PROGRAMME COURSE DESCRIPTION
 DEPARTMENT OF GEOGRAPHY B.A. PROGRAMME COURSE DESCRIPTION (3 Cr. Hrs) (2340100) Geography of Jordan (University Requirement) This Course pursues the following objectives: - The study the physical geographical
Remote Sensing Techniques for Renewable Energy Projects. Dr Stuart Clough APEM Ltd
 Remote Sensing Techniques for Renewable Energy Projects Dr Stuart Clough APEM Ltd What is Remote Sensing? The use of aerial sensors to detect and classify objects on Earth Remote sensing for ecological
3/29/11. Why bother with tools? Incorporating Decision Support Tools into Climate Adaptation Planning. A Simplified Planning Process
 Incorporating Decision Support Tools into Climate Adaptation Planning Why bother with tools? Tools don t eliminate complexity but they can help deal with it" Tools can:"! Help incorporate science into
EBA Engineering Consultants Ltd. Creating and Delivering Better Solutions
 EBA Engineering Consultants Ltd. Creating and Delivering Better Solutions ENHANCING THE CAPABILITY OF ECOSYSTEM MAPPING TO SUPPORT ADAPTIVE FOREST MANAGEMENT Prepared by: EBA ENGINEERING CONSULTANTS LTD.
Disaster Management & Recovery Framework: The Surveyors Response
 Disaster Management & Recovery Framework: The Surveyors Response Greg Scott Inter-Regional Advisor Global Geospatial Information Management United Nations Statistics Division Department of Economic and
Land Cover Classification Mapping & its uses for Planning
 Land Cover Classification Mapping & its uses for Planning What is Land Cover Classification Mapping? Examples of an actual product Why use Land Cover Classification Mapping for planning? Possible uses
Flood Hazard Zone Modeling for Regulation Development
 Flood Hazard Zone Modeling for Regulation Development By Greg Lang and Jared Erickson Pierce County GIS June 2003 Abstract The desire to blend current digital information with government permitting procedures,
THE 3D SIMULATION INFORMATION SYSTEM FOR ASSESSING THE FLOODING LOST IN KEELUNG RIVER BASIN
 THE 3D SIMULATION INFORMATION SYSTEM FOR ASSESSING THE FLOODING LOST IN KEELUNG RIVER BASIN Kuo-Chung Wen *, Tsung-Hsing Huang ** * Associate Professor, Chinese Culture University, Taipei **Master, Chinese
Your web browser (Safari 7) is out of date. For more security, comfort and the best experience on this site: Update your browser Ignore
 is out of date. For more security, comfort and the best experience on this site: Update your browser Ignore") Your web browser (Safari 7) is out of date. For more security, comfort and the best experience on this site: Update your browser Ignore GIS ( GEO GRAPHIC INFO RMATIO N SYSTEM) geospatial information system
Your web browser (Safari 7) is out of date. For more security, comfort and the best experience on this site: Update your browser Ignore GIS ( GEO GRAPHIC INFO RMATIO N SYSTEM) geospatial information system
Green Space Services for Local Monitoring
 Green Space Services for Local Monitoring Aratos Group V3.0 2016/08 Value added services for the society using space and satellite technologies Aratos Group 2 One of the first European downstream value
SUPPORTS SUSTAINABLE GROWTH
 DDSS BBUUN NDDLLEE G E O S P AT I A L G O V E R N A N C E P A C K A G E SUPPORTS SUSTAINABLE GROWTH www.digitalglobe.com BRISBANE, AUSTRALIA WORLDVIEW-3 30 CM International Civil Government Programs US
Coastal Response Research Center. Nancy Kinner University of New Hampshire (UNH) Michele Jacobi NOAA ORR. September 27, 2007
 Michele Jacobi NOAA ORR. September 27, 2007") Coastal Response Research Center Nancy Kinner University of New Hampshire (UNH) Michele Jacobi NOAA ORR September 27, 2007 1 Coastal Response Research Center (CRRC) CRRC is partnership between NOAA s Office
Coastal Response Research Center Nancy Kinner University of New Hampshire (UNH) Michele Jacobi NOAA ORR September 27, 2007 1 Coastal Response Research Center (CRRC) CRRC is partnership between NOAA s Office
Land Use in the context of sustainable, smart and inclusive growth
 Land Use in the context of sustainable, smart and inclusive growth François Salgé Ministry of sustainable development France facilitator EUROGI vice president AFIGéO board member 1 Introduction e-content+
Summary Visualizations for Coastal Spatial Temporal Dynamics
 Summary Visualizations for Coastal Spatial Temporal Dynamics October 24 2011 Providence, RI Sidharth Thakur 1, Laura Tateosian 2, Helena Mitasova, Eric Hardin, and Margery Overton 1. sthakur@renci.org,
Earth Systems Curriculum
 Earth Systems Curriculum Course Description This course provides the opportunity to develop knowledge and understanding about the relationships between the structure, processes, and resources on Earth