Department of Civil Engineering, SRM University, Kattankulathur, Chennai, India
|
|
|
- Charleen Fletcher
- 6 years ago
- Views:
Transcription
1 APPLICATION OF THE REMOTE SENSING AND GEO-SPATIAL TECHNOLOGY IN TERRAIN ANALYSIS AND TERRAIN CLASSIFICATION IN CONTEXT OF CREATION OF SDI FOR MARINE & COASTAL REGIONS Sarbani Saha 1, Pravin D. Kunte 2 *, Mahender Kotha 3 1 Department of Civil Engineering, SRM University, Kattankulathur, Chennai, India 2 CSIR-National Institute of Oceanography, Dona Paula, Goa , India 3 Department of Earth Science, Goa University, Goa, India *Corresponding author: kunte@nio.org Abstract The ever-increasing urbanization along the coasts resulting destructive pressures on the Marine and coastal regions. Developing area/region specific SDI s, using developments in remote sensing and geospatial technologies, will surely add strength to the National and Global SDIs. The main aim of this study to understand the topographic features which is the most important part of terrain analysis and for that develop the application of the available Geospatial Tools for the creation of datasets, which are building blocks of any SDI. The surface analysis of South Western part of India and Benthic Terrain Analysis of Eastern Arabian Sea is carried out using the NASA Shuttle Radar Topographic Mission (SRTM) data and Geospatial tools to understand the terrain characteristics. The terrain analysis of southern Maharashtra and Goa region is validated using ASTER 3D remote sensing data. The geospatial study is carried out to generate base-level information for terrain analysis and classification. Using improved e-topo2 bathymetry data and Benthic Terrain Modeller (BTM) extension of Arc GIS version 10.2, bathymetry position Index (BPI) at different resolution/scale (broad, fine and standard scale) is achieved for preparing slope, depth, and rugosity maps. Based on bathymetry derivative maps, benthic terrain map of the Eastern Arabian Sea are generated and are used to classify benthic environment of the Ocean. The study demonstrates that Geospatial technique as most efficient, cost-effective and easiest tools for surface/benthic terrain analysis and mapping provides most of the data for the development of SDIs for Coastal and marine regions. Keywords. Benthic terrain modeller; Eastern Arabian Sea; Remote sensing; GIS; Terrain analysis.
2 1. INTRODUCTION Spatial Data Infrastructure (SDI) are used to summarize activities, relationships, processes, and physical entities that provide integrated management of spatial data, information, and services and Promotes geospatial data sharing and facilitates data use. Although, there have been several definitions of Spatial Data Infrastructure (SDI) in literature (Wright, 2009), in general the SDI is defined as the relevant base collection of SDI offers improved access to data, reduced duplication of effort in data collection and maintenance, enables interoperability between dataset, modernization of administration, risk management, and spatially enabled governance (Gourmelon et al., 2012; Strain et al., 2004). Topography refers to the surface characteristics i.e. the relief of an area. The topography of land surface is represented by digital elevation dataset in GIS which consists of elevation of a large number of sample points distributed throughout the area being represented. These sample points are commonly organized as grid points, essentially as a raster form of organization. An alternative form of representation is the Triangulated Irregular Network or TIN used in vector based system. Surface analysis is one of the important components to understanding the geomorphological characteristics. Surfaces represent phenomena that have values at every point across their extent. The values of the innumerable number of points of the surface are derived from a limited set of sample values. These may be based on direct measurements, such as height values for an elevation surface, or temperature values for a temperature surface; between the measured locations. Surfaces can also be mathematically derived from other data, such as slope and aspect surfaces are derived from the elevation surface, a surface of distance from bus stops in a city, or surfaces showing the concentration of criminal activity or probability of lightning strikes etc. (Surface creation and analysis - creation_and_analysis.htm). The benthic zone is the ecological region at the lowest level of a body of water such as an ocean or a lake, including the sediment surface and some sub-surface layers. The extent of the benthic region of the ocean covers from the shoreline (intertidal or EU littoral zone) and extends downward along the surface of the continental shelf towards the sea. The continental shelf is a gently sloping benthic region that extends away from the land mass. At the continental shelf edge, usually about 200 m. deep, the gradient increases greatly and is known as the continental slope. The continental slope drops down to the deep sea floor. The deep-sea floor is called the abyssal plain and is usually about 4,000 meters deep. The ocean floor is not all flat but has submarine ridges and deep ocean trenches known as the hadal zone ( GIS-based terrain analysis techniques are well established as a potential approach to marine geomorphological mapping in deep water (Wilson et al 2007). Multibeam bathymetric data can be used to generate derived quantitative variables describing the seafloor terrain. Dorschel et al (2010) detected canyons in the Irish offshore by their increased slope inclination of canyon walls (steeper than 5 ) compared to the surrounding seabed (rarely steeper than 2 ). Micallef et al (2012) outline a method (semi-automated) to map shallow coastal water habitats based on the highresolution multi-beam bathymetry and backscatter data. Textural and morphometric analyses are combined in this method to map and plot the distribution of the predominant habitats offshore NE Malta. The ground-truthing with ROV and dive observations are used to confirm the validity of their approach. Several studies for the development of Coastal and Marine SDIs (Gourmelon et al., 2012, Strain, 2006) were attempted by different countries, which led to several SDI initiatives at different levels: local, regional, national, international and global levels (Cömert et al., 2008; Idrees et al., 2015) with varying development and progress. India with its vast coastline and the population that lives along the coast needs an immediate initiative for the development of SDIs for coastal and marine
3 regions that facilitates the better management of these areas for promoting tourism, better facilities for fisheries, and preventing the loss due to natural hazards. Due to limited access to the scattered available comprehensive information about marine and coastal areas, the present study showcases a simple and easy way to develop small databases using the satellite data with the functions with the help of software available in public and as well as commercial domains. Therefore, the main objective of the present study is to demonstrate work as an initiative towards the creation of the database as part of developing region specific SDI with the application of Terrain Analyses of the topographic and benthic surface using the geospatial tools applied on the SRTM & ASTER datasets. For the present study, the Land and Ocean interface area enclosed within 60 o E to 78 o E longitudes and 7 o N to 21 o N and latitudes is chosen for deriving the terrain characteristics expressed in terms of several variables that help in understanding the morphology of the study area. The main purpose of benthic terrain mapping is to classify the benthic terrain and to identify the seafloor geomorphological features. The classification is used for the benthic habitat mapping and predictive mapping for the benthic environment in the studied region. 2. AREA OF STUDY The study area extends from 60 o E to 78 o E longitude and 7 o N to 21 o N latitudes and covers Eastern Arabian Sea, Sourashtra, Gujarat, western Maharashtra, Goa, Karnataka and Kerala states of India (Figure 1). Benthic terrain analysis and topographic terrain analysis is carried out only in the Eastern Arabian Sea and South-western part of India respectively. The Western Ghats, a mountain range of about 1600 km, that runs almost parallel to the western coast of the Indian peninsula, is an important feature that forms the catchment area for complex riverine drainage systems that drain almost 40% of India. Except a small part of the area around Mumbai, and along the eastern limits, the State of Maharashtra presents a monotonously uniform, flat-topped skyline. The Eastern part of Arabian Sea extends from the lower part of Gujarat to southern part of India and consists of Arabian Basin, some part of the Chagos- Laccadive Islands and ridges, Laccadive Plateau. In the South-Western part of the Arabian Sea, some part of the Carlsberg Ridges are covered in the present study area.

4 Figure 1 A) India map showing study area. B) Structural and topographic map of South India. C) Map showing sea bottom topography of Eastern Arabian Sea. 3. MATERIALS AND METHODOLOGY 3.1 Data The materials used in the present study is essentially the satellite-derived elevation data available free from various sources and the GIS software tools. The NASA Shuttle Radar Topographic Mission (SRTM) data available at website with a resolution of 90m (mosaicked 5 0 x 5 0 tiles) is used to carry out the topographic analysis of the western India to derive the terrain variables slope; terrain variability (rugosity) and relative position (Benthic Position Index (BPI)) from the bathymetric data. The ASTER 3D remote sensing data also with 90 m resolution is been taken from site is used to validate terrain analysis of southern Maharashtra and Goa region. The Bathymetry data (ETOPO) was downloaded from the Intranet web-site ( of CSIR-National Institute of Oceanography, India. The ETOPO bathymetry data set is based on satellite altimetry digitization of depth contours greater than 200 m. Hence, data is not useful for shallow water regions. An improved shelf bathymetry for the Indian Ocean region (20 E to 112 E and 38 S to 32 N) is derived by digitizing the depth contours and sounding depths less than 200 m from the hydrographic charts published by the National Hydrographic Office, India. The digitized
5 data are then gridded and used to modify the existing ETOPO5 and ETOPO2 data sets for depths less than 200 m (Sindhu et al 2007). The study makes use of the spatial analyst tools in Arc GIS 10.2 software and the Benthic Terrain Modeller extension of Arc GIS 10.2 version is used to obtain slope, depth, and rugosity maps using broad scale BPI, fine scale BPI, standardized BPI S to the classification of benthic terrain using the above-mentioned derivatives. Slope calculations provided information on the characteristics of the seafloor and indicate regions of the flat and undulating seabed and helped in identifying 51 areas of rock outcrop and seafloor structures such as sandbanks and other bedforms. The rugosity analysis helped to identify areas with potentially high biodiversity by describing a topographic roughness with a surface area to planar area ratio. 3.2 Methodology The general workflow of on the methodology adopted in the present study is given in Figure 2. The following paragraph discusses the steps involved in surface analyses for generating a surface model of the study area. Figure 2. Methodology flow chart Surface Analysis The surface analysis involves several kinds of processing, including extracting new surfaces from existing surfaces, reclassifying surfaces, and combining surfaces. For this analysis, we have used spatial analyst Extension and 3D analyst extension of Arc GIS This methodology is described in the steps to create a surface model with Triangulated Irregular Network (TIN) command in ARC/INFO toolbox. The model will focus on steps to calculate the independent variables of topography i.e. Slope, Aspect, and Elevation. Surface analyses using the mosaicked tiles of SRTM data and ASTER data were carried out to generate the surface. Since, Slope and Aspect play a vital and role in terrain analysis, hill shading and 3D view, the Topographical functions were run to derive the two important terrain parameters, i.e. slope and aspect. The Slope tool calculates the maximum rate of change from a cell to its neighbours, which is typically used to indicate the steepness of the terrain. The ASPECT tool calculates the direction in which the plane fitted to the slope faces for each cell. The aspect of a surface typically affects the amount of sunlight it receives (as does the slope); in northern latitudes, places with a southerly aspect tend to be warmer and drier than places that have a northerly aspect. Hill shade shows the intensity of lighting on a surface
6 is given a light source at a particular location; it can model which parts of a surface would be shadowed by other parts. After calculating slope, aspect, and elevation, it is necessary to convert the DEM type data into the functional TIN format. TIN store slope and aspect information as attributes of the TIN facets. Rather than deriving slope and aspect for TIN surfaces (as one does with raster terrain models, which only store the elevation values), one simply needs to extract that information from the facets to a set of polygons (Figure 3). Figure 3 Flow chart depicting classification of Benthic Terrain model Benthic Terrain Classification and Mapping of Eastern Arabian Sea The Benthic Terrain Modeler (BTM) algorithm originally developed by Lundblad et al. (2006) which available as an ArcGIS Tool was adopted in the present study for the classification of benthic features. The tool was developed in 2005 to facilitate the mapping and characterization of benthic morphological features that are sometimes associated with some kinds of marine species. Rockfish, for example, is commonly found on or near hard complex structures, sand eel is normally associated with sand banks. Following Sidhu et al., 2007 the ETOPO2 data set has been used in the Benthic Terrain Modeller for ArcGIS functions to calculate the following parameters from the Bathymetry Data that are shown in Figure 3. Bathymetric Position Index (BPI) Grids: Terrain analysis applications used for mainly to understand the topographical features and to find out its suitability for habitat mapping. To understand the topographical features in marine environment it s important to generate the Bathymetric position index. So that it can be further used for habitat mapping. Without identifying the topographical features its nearly impossible to map the marine habitats. Creation of Bathymetric Position Index (BPI) data sets at two different scales is central to the methods behind the benthic terrain classification process. BPI is a derivative of the input bathymetric data set and is used to define the location of specific features and regions relative to other features and regions within the same data set. Bathymetric position index is normally determined at three scales: Broad-Scale BPI (broad-scale BPI data set is created that allows identification of the larger regions within the benthic landscape);
7 Fine-Scale BPI (a fine-scale BPI data set to identify smaller features within the benthic landscape) and the Standardized BPI (a standardized BPI data sets that actually is used to classify/ identify various benthic zones and structures. The derived benthic parameters for mapping the study area include the Aspect and Slope (the raster maps to be used for classification tools), slope and aspect has been calculated to understand the topography of the ocean floor and it will help us in habitat mapping. Due to slope habitats of certain species has been changed. The Curvature (surface of slope of slope raster, that can be used optionally to calculate plan and profile curvature), Depth Statistics (mean, variance and standard deviation, over a set neighbourhood size which are useful predictors in understanding the benthic zones in analyses tasks like habitat classification). Depth statistics are very useful parameter to understand the depth variation which occurred due to the variance in topographic features. The marine habitats are mostly dependent on depth variance. Species variation in ocean mostly occurred by the changes in the depth. The Classify function of Benthic Terrain Modeller creates a user-defined structures layer based on BPI s, slope, standard deviation breaks, and depth. The benthic zones in the output layer include various features (crests, depressions, flats, and slopes) of geomorphologic interest. The identified benthic structures in the output layer include narrow depression, local depression on flat, lateral mid-slope depression, depression on crest, broad depression, broad flat, shelf, open slopes, local crest in depression, local crest on flat, lateral mid-slope crest, narrow crest, and steep slope (Figure 3). Terrain Ruggedness (VRM) function measures terrain ruggedness, or rugosity, as the variation in the three-dimensional orientation of grid cells within a neighbourhood. Terrain ruggedness is an important parameter for analysing the terrain classes because due to the rugosity the depth varies and which influence the marine habitats. Vector analysis is used to calculate the dispersion of vectors normal (orthogonal) to grid cells within the specified neighbourhood. This method effectively captures the variability in slope and aspect into a single measure. Ruggedness values in the output raster can range from 0 (no terrain variation) to 1 (complete terrain variation). Typical values for natural terrains range between 0 and about RESULT AND DISCUSSION The results obtained from the Terrain analysis using the SRTM, ASTER and ETOPO data for identification of the various Geomorphologic features have been summarized in the following paragraphs 4.1 Results from SRTM and ASTER datasets Surface characteristics derived from the SRTM data have been interpreted to understand the Geomorphology of a part of Gujarat, Maharashtra, Goa, and Karnataka. The higher/steep slopes (higher values shown in yellow, Figure 4) have been observed that correspond to the Western Ghats region, along the Tapi rift the slope. Some part of the Karnataka Plateau also is showing high values in slope. Hillshade maps are interpreted to understand the intensity of lighting on a surface, given a light source at a particular location that can model which parts of a surface would be shadowed by other parts. Hillshade map of the Western Ghats region, Tapi rift the Hillshade value is low, showing the shadows of the hill due to the high range of the slope. The aspect of a surface typically affects the amount of sunlight it receives (as does the slope). Along the Western Ghats, Tapi rift the slope direction varies from southeast to North West (Figure 4). The aspect values depend on upon the slope of that area. A clear demarcation of the geomorphological setting is observed from the TIN surfaces wherein the regions of the Western Ghats, Deccan trap and the


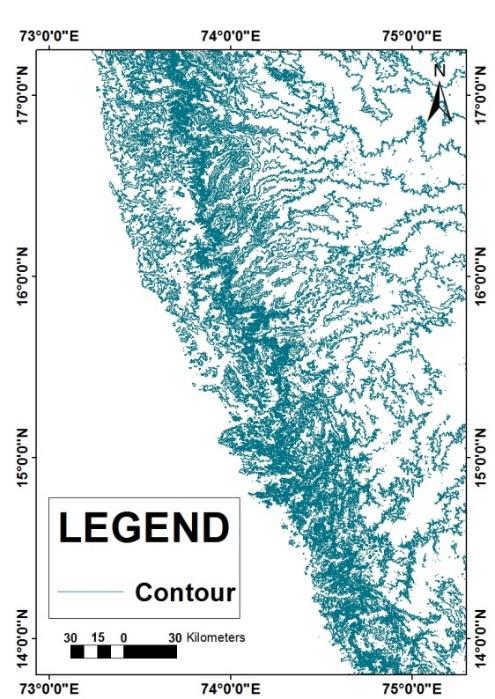
8 Tapi Rift showing higher values and the west coast with lower slopes showing the very low TIN values. The prepared contour map based on the SRTM data at 100 meters interval is quite sufficient enough to differentiate the mountainous regions from that low-lying coastal areas for the study area. Comparable results have been obtained from the slope, aspect and Hill shade surface derived from ASTER data. (Figure 5). The entire Goa region shows relatively low values in contours (Figure 6). Figure 4. Maps like slope, aspect, counter and Hill shade deduced from Digital Terrain model using SRTM dataset.


9 Figure 5. Slope and Hill-shade maps of south-west India derived using ASTER data. SLOPE HILLSHADE 4.2 Bathymetry and Topography Data For the Classification of Benthic Structures of the study area, the digitized ETOPO2 dataset is used to identify and understand the various terrain features present. The study area has been classified into following 7 different structures (1. Broad flat terrain, 2. Depression, 3. Mid-slope Ridges, 4. Open slopes, 5. Upper slope ridges, 6. Mid-slope depressions and 7. Lower bank shelf) based on the general classification scheme of benthic terrain (Figure 7)
10 The land portion of the study area depicted as a broad flat terrain. The Arabian Basin area classified as the depression because of the low slope value. Along the west coast, the continental slope area classified as the lower bank shelf area. Chagos-Laccadive ridges and some part of the Carlsberg ridge and minor ridge such as Laxmi ridge classified as upper slope ridges. Indus cone area classified as mid-slope areas with ridges and depressions Bathymetric Position Index The creation of Bathymetric Position Index (BPI) data sets at two different scales is central to the methods behind the benthic terrain classification process (Figure 8). BPI is a derivative of the input bathymetric data set and is used to define the location of specific features and regions relative to other features and regions within the same data set. The results of BPI are scale dependent, different scales identify fine or broad benthic features. To achieve the best BPI zone and structure classifications grids were created for study site. The broad scale grid created with a scale factor of 250 is used to identify the broad-scale features of the Eastern part of the Arabian sea extension of the area is E to E and 0 0 0N to N, and also the broad-scale features of the entire study area. The broad scale BPI for the Arabian basin area is shown in purple colour. The BPI value ranges between 4080 to Depressions and depth areas are showing the lower values. Ridges and broad flat terrain areas are showing higher values. The Fine-scale BPI grid was created with a scale factor of 20. The main features identified from the fine scale BPI is the continental slope area along the west coast shown in brown colour (Figure 8) wherein values range between 2661 to With the major feature like continental slope, mid-slope, and upper slope ridges, Abyssal plain area can also be identified. High values indicated steeper slope areas and lower values indicated the depression and flat areas. For the present study, the Standardized BPI dataset is used to identify various benthic zones and structures. Figure 6. Contour, Aspect and Tin maps of south-west India derived using ASTER data.


11 TIN CONTOUR ASPECT

12 Figure 7. Benthic terrain classification map of Eastern Arabian Sea Slope: The Slope, representing a terrain s angle of inclination in relation to a flat surface at sea level, expressed in degrees is the measure of the steepness of first-order derivative, which has been derived using the ArcGIS BTM spatial analyst extension, was used for the classification benthic structures. The Arabian basin area is clearly identifiable with its lower values suggesting a relatively lower/gentler slope (Figure 9) Curvature: Curvature is used to determine the slope of the particular slope. It can be different types profile curvature or plan curvature. For this study, we prepare curvature map which was used in the classification scheme of benthic terrain (Figure 9) Aspect: Aspect was used to describe the direction of slope of the study area. Aspect raster had been used for the classification of benthic structures (Figure 10).

13 . Figure 8. Maps showing the benthic terrain classification using Bathymetric Position Index (BPI) data sets at fine, broad and standardized scale

14 4.4 Statistical Aspect Sin (Aspect) raster It is the sine function of input surface aspect. In this output surface aspect values range between - 1 and 1. The Arabian basin area is showing higher values whereas the ridges and continental slope areas are showing in lower values and relatively darker in colour than the Basin area or flat areas (Figure 11). Figure 9. Slope and curvature of slope maps of Eastern Arabian Sea.


15 Figure 10 Aspect map of Eastern Arabian Sea Cos (Aspect) raster It is the Cosine function of the input surface aspect. In this output surface aspect values varies from -1 to 1. In this statistical aspect calculation, it is showing the opposite to the sine function. The flat areas and depressions are showing low values and relatively darker than Ridges and slope areas. Chagos-Laccadive ridges, Carlsberg ridges, and slopes are showing higher values and lighter in tone than the depressions and Basin areas Depth Statistics Depth statistics, such as mean, variance, and standard deviation, over a set neighbourhood size, has been calculated for the study area. These statistics used as predictors in understanding the benthic zones in analyses tasks in benthic structures classification.

16 Figure 11. Statistical (Sin & Cos) Aspect map of Eastern Arabian Sea Mean Depth: Mean of depth has been calculated on the average over the neighbourhood, ranges between to The Arabian basin area is showing negative values and in a darker tone. The flat terrain and Chagos-Laccadive and some part of Carlsberg ridges areas are displaying positive values and relatively lighter in tone than compared to Basin areas. Standard Deviation and Variance of Depth: Standard deviation and Variance are two forms of the same statistical measure. It is used to identify the differences/variation within the data. The value of standard deviation of the depth of that area varies from 0 to The Basin area is showing lower values and the continental slope areas and Chagos-Laccadive ridges and other ridges are showing higher values relatively darker tone. The Basin area is showing lower values and the continental slope areas and Chagos-Laccadive ridges and a part of Carlsberg ridge are showing higher values (Figure 12). Carlsberg ridge is showing higher values and relatively darker tone.

 to 1 (complete terrain variation).")

17 Figure 12. Standard deviation and Variance depth maps of Eastern Arabian Sea Terrain Ruggedness measures rugosity, as the variation in the three-dimensional orientation of grid cells within a neighbourhood. Ruggedness values in the output raster can range from 0 (no terrain variation) to 1 (complete terrain variation). Rugosity values near one indicate flat, smooth locations; higher values indicate areas of high-relief. Rugosity calculated using this technique is highly correlated with the slope. The highest rugosity values show a relationship with the high slope and lower rugosity with a low slope. In the Arabian basin area, rugosity is low because it related with the low slope. But along the oceanic ridges of Chagos-Laccadive and Carlsberg and minor ridge along the northern part of Arabian Sea Laxmi ridge the rugosity value is high and it is related.
18 5. CONCLUSIONS The classification scheme developed introducing the concepts of BPI zones at a broad resolution (depressions, slopes, flats) and structures (finer features within zones) around the study site provides an important dataset for understanding the Geomorphology of the benthic terrain. The terrain was classified by measuring rugosity, slope, depth at a broad scale, small scale, and standardized BPI S. Benthic Terrain analysis of deep-water bathymetry is complicated by the fact that on the continental slope we obtain data at different resolutions. We have shown that a variety of methods exist for terrain analysis on these data and these have been successfully applied to the generation of a suite of quantitative descriptor variables of relevance to benthic terrain classification. Using the Benthic Terrain Model in Arc GIS 10.2 version the methodology adopted in this work can be easily transported to the study of other areas and other types of terrain classification. It constitutes an interesting alternative for the good exploration of pre-existent data which could be re-analyzed seeking regional scale habitat prediction. Increased awareness and availability of multi-scale and Multibeam Hydrosweep echosounder data methods should help promote their use in terrain analysis using bathymetric data for terrain classification mapping and related work. This benthic terrain modelling can be used for identification of marine resources and habitats. It can be useful for identifying different ecosystems in the marine environment. Benthic terrain mapping can be useful for the spatial planning of marine and coastal areas. It can be done at regional and national level planning for management purposes. For better management purpose it can be correlated with sediment data, geology data, distribution of different marine species and fisheries data. This will help to improve the socio-economic level of the coastal and marine areas. Terrain analysis is a key element in 3D Visualization, Flight Simulation, Project Cost Estimation, Cut and Fill Calculations, Route Feasibility, Environment and Risk Assessments, Line of Sight Analysis, Surface Analysis, Watershed Analysis etc. At present, it seems GIS-based methods are the most readily available to the scientific community. However, further development of wavelet methods may yield more efficient and flexible computation in the future. The study demonstrates that Geospatial technique as most efficient, cost-effective and easiest tools for surface/benthic terrain analysis and mapping provides most of the data for the development of SDIs for Coastal and marine regions. 5.1 Suggested Work plan for Developing Coastal and Marine Spatial Data Infrastructure (CMSDI) Identify data holder s/service providers, conduct training/awareness programs, determine user requirements (formats for distribution, metadata required, data needs, areas for focus), Develop roadmap for SDI implementation, Developing, and implementation and finally to Establish support and engagement. 6. ACKNOWLEDGMENTS We express our gratitude to the Director of the National Institute of Oceanography, Goa and Vicechancellor, Goa University for encouragement and necessary facilities. The author 1 would like to thank Dr. R Annadurai, SRM University for facilitating internship at NIO. This is the contribution
19 number of National Institute of Oceanography, Council of Scientific and Industrial Research (CSIR), Goa, India. 7. REFERENCES Amanda W J Demopoulos, Craig R Smith, and Paul A, Tyler (2003). The deep Indian Ocean floor, Ecosystems of the world Cömert, Ç, Akıncı, H., Şahin, N., & Bahar, Ö. (2008). The value of marine Spatial Data Infrastructure. Fresenius Environmental Bulletin, 17(12): Dorschel, B, Wheeler, A. J, Monteys, X and Verbruggen K, (2010). Atlas of the Deep-Water Seabed: Ireland. Springer Science and Business Media B.V. Springer, New York, 164 pp. Gourmelon, F., Georis-creuseveau, J., & Tixerant, M. Le. (2012). Towards a Coastal Spatial Data Infrastructure (CSDI) responsive to the needs of integrated coastal zone management: The GeoBretagne Experience (France). In Global Geospatial Conference: Spatially Enabling Government, Industry and Citizen (pp. 1 16). Quebec, Canada, 1-6 June, 2012 Idrees, M. O., Saeidi, V., & Shariff, A. R. M. (2015). Factors explaining differences in NSDI development status between the developed and developing world. Global Journal of Engineering Science and Research Management, 2(6): Lundblad E, Wright, D J, Miller J, Larkin E M, Rinehart R, Battista T, Anderson S M, Naar D F, and Donahue B T (2006). A benthic terrain classification scheme for American Samoa, Marine Geodesy, 29(2): Micallef A, Le Bas, Timothy P, Huvenne Veerle A I, Blondel P, Hühnerbach, V, Deidun A (2012). A multi-method approach for benthic habitat mapping of shallow coastal areas with highresolution multibeam data, Continental Shelf Research, 39-40: Sindhu B, I Suresh, A S Unnikrishnan, N V Bhaktar, S.Neetu and G S Michael 2007 Improved bathymetrics datasets for the shallow water regions in the Indian ocean. Earth systeem Science, 116(3): Strain, L., Rajabifard, A., & Williamson, I. (2004). Spatial Data Infrastructure to facilitate coastal zone management. In Coastal Zone Asia Pacific Conference (pp. 1 6). Brisbane, Australia, 5-9 September, Williamson, I. (2004). Issues in developing marine SDI. In PCGIAP Joint Workshop of WG1 and WG2 (pp. 1 12). Chengdu, China, 7-8 September Wilson M.F.J., O Connell B, Brown, C, Guinan, J.C. and Grehan A J (2007). Multiscale Terrain Analysis of Multibeam Bathymetry Data for Habitat Mapping on the Continental Slope, Marine Geodesy, 30: Wright, D.J. (2009). Remote Sensing and geospatial technologies for coastal ecosystem assessment and management. In X. Yang (Ed.), (pp ). Berlin, Heidelberg: Springer Berlin Heidelberg. doi: /
Chapter Overview. Bathymetry. Measuring Bathymetry. Measuring Bathymetry
 CHAPTER 3 Marine Provinces Chapter Overview The study of bathymetry determines ocean depths and ocean floor topography. Echo sounding and satellites are efficient bathymetric tools. Most ocean floor features
Bathymetry Measures the vertical distance from the ocean surface to mountains, valleys, plains, and other sea floor features
 1 2 3 4 5 6 7 8 9 10 11 CHAPTER 3 Marine Provinces Chapter Overview The study of bathymetry determines ocean depths and ocean floor topography. Echo sounding and satellites are efficient bathymetric tools.
Map shows 3 main features of ocean floor
 Map shows 3 main features of ocean floor 2017 Pearson Education, Inc. Chapter 3 Marine Provinces 2017 Pearson Education, Inc. 1 Chapter 3 Overview The study of bathymetry determines ocean depths and ocean
INTERNATIONAL JOURNAL OF GEOMATICS AND GEOSCIENCES Volume 1, No 4, 2011
 Detection of seafloor channels using Bathymetry data in Geographical Information Systems Kundu.S.N, Pattnaik.D.S Department of Geology, Utkal University, Vanivihar, Bhubaneswar. Orissa. snkundu@gmail.com
Oceanography, An Invitation to Marine Science 9e Tom Garrison. Ocean Basins Cengage Learning. All Rights Reserved.
 Oceanography, An Invitation to Marine Science 9e Tom Garrison 4 Ocean Basins Key Concepts Tectonic forces shape the seabed The ocean floor is divided into continental margins and deep ocean basins The
Earth / Environmental Science. Ch. 14 THE OCEAN FLOOR
 Earth / Environmental Science Ch. 14 THE OCEAN FLOOR The Blue Planet Nearly 70% of the Earth s surface is covered by the global ocean It was not until the 1800s that the ocean became an important focus
Lecture Marine Provinces
 Lecture Marine Provinces Measuring bathymetry Ocean depths and topography of ocean floor Sounding Rope/wire with heavy weight Known as lead lining Echo sounding Reflection of sound signals 1925 German
MARINE GEOLOGY & GEOGRAPHY
 MARINE GEOLOGY & GEOGRAPHY Bathymetry BATHYMETRY BATHYMETRY THE UNDERWATER EQUIVALENT TO TOPOGRAPHY THE STUDY OF WATER DEPTH A BATHYMETRIC MAP SHOWS FLOOR RELIEF OR TERRAIN AS CONTOUR LINES Bathymetry
ENGRG Introduction to GIS
 ENGRG 59910 Introduction to GIS Michael Piasecki March 17, 2014 Lecture 08: Terrain Analysis Outline: Terrain Analysis Earth Surface Representation Contour TIN Mass Points Digital Elevation Models Slope
Benthic Terrain Modeler
 Benthic Terrain Modeler - Introduction Introduction to Benthic Terrain Modeling Exercise A Setting up your workspace: Installing the BTM and activating the Spatial Analyst Extension Exercise B Calculating
EMERGENCY PLANNING IN NORTHERN ALGERIA BASED ON REMOTE SENSING DATA IN RESPECT TO TSUNAMI HAZARD PREPAREDNESS
 EMERGENCY PLANNING IN NORTHERN ALGERIA BASED ON REMOTE SENSING DATA IN RESPECT TO TSUNAMI HAZARD PREPAREDNESS Barbara Theilen-Willige Technical University of Berlin, Institute of Applied Geosciences Department
Earth s Continents and Seafloors. GEOL100 Physical Geology Ray Rector - Instructor
 Earth s Continents and Seafloors GEOL100 Physical Geology Ray Rector - Instructor OCEAN BASINS and CONTINENTAL PLATFORMS Key Concepts I. Earth s rocky surface covered by of two types of crust Dense, thin,
ENGRG Introduction to GIS
 ENGRG 59910 Introduction to GIS Michael Piasecki November 17, 2017 Lecture 11: Terrain Analysis Outline: Terrain Analysis Earth Surface Representation Contour TIN Mass Points Digital Elevation Models Slope
The Ocean Floor Earth Science, 13e Chapter 13
 The Ocean Floor Earth Science, 13e Chapter 13 Stanley C. Hatfield Southwestern Illinois College The vast world ocean Earth is often referred to as the blue planet Seventy-one percent of Earth s surface
Mapping Undersea Feature Names in S-100. UFNPT at SCUFN 31 Wellington, New Zealand October, 2018
 Mapping Undersea Feature Names in S-100 UFNPT at SCUFN 31 Wellington, New Zealand October, 2018 Content - Update about UFNPT - Discovery of Undersea Features - excercise Work Plan of the UFNPT November
PROANA A USEFUL SOFTWARE FOR TERRAIN ANALYSIS AND GEOENVIRONMENTAL APPLICATIONS STUDY CASE ON THE GEODYNAMIC EVOLUTION OF ARGOLIS PENINSULA, GREECE.
 PROANA A USEFUL SOFTWARE FOR TERRAIN ANALYSIS AND GEOENVIRONMENTAL APPLICATIONS STUDY CASE ON THE GEODYNAMIC EVOLUTION OF ARGOLIS PENINSULA, GREECE. Spyridoula Vassilopoulou * Institute of Cartography
International Journal of Advance Engineering and Research Development
 Scientific Journal of Impact Factor (SJIF): 4.72 International Journal of Advance Engineering and Research Development Volume 4, Issue 5, May -2017 Watershed Delineation of Purna River using Geographical
Introduction After reviewing the classification of continental margins (not plate margins) in your textbook, answer the following questions:
 in your textbook, answer the following questions:") Investigating the continental margins of North America using GeoMapApp. This exercise is designed to familiarize you with the features of continental margins. Through the analysis of color-coded bathymetric
Investigating the continental margins of North America using GeoMapApp. This exercise is designed to familiarize you with the features of continental margins. Through the analysis of color-coded bathymetric
General Overview and Facts about the Irobland
 Using Geoinformation Science to Reveal the Impact of the Eritrea-Ethiopia Boundary Commission s Decision on Irobland and People By Alema Tesfaye, Washington DC, USA Part I General Overview and Facts about
Integration Activities in Indonesia: The Integration of Land and Marine Spatial Data Sets as Part of Indonesian SDI Development
 Integration Activities in Indonesia: The Integration of Land and Marine Spatial Data Sets as Part of Indonesian SDI Development M. Arief Syafi i National Coordination Agency for Surveys and Mapping (B
GeoSUR SRTM 30-m / TPS
 GeoSUR SRTM 30-m / TPS Wm Matthew Cushing (USGS) 16 May 2013 U.S. Department of the Interior U.S. Geological Survey SRTM Mission Shuttle Radar Topography Mission (SRTM) Space Shuttle Endeavour during the
Supplement of Scenario-based numerical modelling and the palaeo-historic record of tsunamis in Wallis and Futuna, Southwest Pacific
 Supplement of Nat. Hazards Earth Syst. Sci., 15, 1763 1784, 2015 http://www.nat-hazards-earth-syst-sci.net/15/1763/2015/ doi:10.5194/nhess-15-1763-2015-supplement Author(s) 2015. CC Attribution 3.0 License.
Morphometric Analysis of Chamundi Hills, Mysuru, India Using Geographical Information System
 Volume-7, Issue-1, January-February 2017 International Journal of Engineering and Management Research Page Number: 279-283 Morphometric Analysis of s, Mysuru, India Using Geographical Information System
Fatmagül Batuk, Ozan Emem Department of Geodesy and Photogrammetry Engineering Tolga Görüm, Erkan Gökaan Natural Sciences Research Center
 Fatmagül Batuk, Ozan Emem Department of Geodesy and Photogrammetry Engineering Tolga Görüm, Erkan Gökaan Natural Sciences Research Center Landforms Landform term as used to denote a portion of the earth
Marine Science and Oceanography
 Marine Science and Oceanography Marine geology- study of the ocean floor Physical oceanography- study of waves, currents, and tides Marine biology study of nature and distribution of marine organisms Chemical
Notes and Summary pages:
 Topographic Mapping 8.9C Interpret topographical maps and satellite views to identify land and erosional features and predict how these shapes may be reshaped by weathering ATL Skills: Communication taking
Foundations of Earth Science, 6e Lutgens, Tarbuck, & Tasa
 Foundations of Earth Science, 6e Lutgens, Tarbuck, & Tasa Oceans: The Last Frontier Foundations, 6e - Chapter 9 Stan Hatfield Southwestern Illinois College The vast world ocean Earth is often referred
Lecture Outlines PowerPoint. Chapter 13 Earth Science 11e Tarbuck/Lutgens
 Lecture Outlines PowerPoint Chapter 13 Earth Science 11e Tarbuck/Lutgens 2006 Pearson Prentice Hall This work is protected by United States copyright laws and is provided solely for the use of instructors
1. Name at least one place that the mid-atlantic Ridge is exposed above sea level.
 Interpreting Tectonic and Bathymetric Maps. The purpose of this lab is to provide experience interpreting the bathymetry of the seafloor in terms of tectonic and geologic settings and processes. Use the
Reprint of article that appeared in Hydro INTERNATIONAL November 2006 Volume 10 Issue 9
 Reprint of article that appeared in Hydro INTERNATIONAL November 2006 Volume 10 Issue 9 While Google Earth is the best known 3D web-mapping viewer currently in the public domain, there are alternative
River Inundation and Hazard Mapping a Case Study of North Zone Surat City
 River Inundation and Hazard Mapping a Case Study of North Zone Surat City Patel Chandresh G, Assistant Professor, Ganpat University, Kherva Dr.P.J. Gundaliya, Associate Professor, LDCE, Ahmedabad Abstract:
Bathymetry Data and Models: Best Practices
 Bathymetry Data and Models: Best Practices Barry Eakins & Lisa Taylor The NOAA National Geophysical Data Center Over 600 data types - from the core of the Earth to the surface of the Sun NGDC Bathymetry
Marine ecosystem mapping at the Prince Edward Islands
 Marine ecosystem mapping at the Prince Edward Islands Biodiversity Planning Forum NBA special session June 2018 R Adams, C von der Meden, A Dayaram, K Sink, A Lombard, A Bosman, M Dopolo, F Fourie, L Harris,
MARINE GEOLOGY & GEOGRAPHY
 MARINE GEOLOGY MARINE GEOLOGY & GEOGRAPHY Marine Geology 4 LAYERS OF THE EARTH CRUST THICKNESS: VARIES BETWEEN OCEAN & CONTINENTS 5-40 KM STATE: SOLID ELEMENTS: SILICON, ALUMINUM, CALCIUM, SODIUM, POTASSIUM
Work Package 5: Signal Processing and Seafloor Classification
 Work Package 5: Signal Processing and Seafloor Classification Jarosław Tęgowski and Karolina Trzcińska Marine Geophysics Lab. Institute of Oceanography University of Gdańsk, Poland Kick-Off Meeting, Kiel,
Ocean Basins, Bathymetry and Sea Levels
 Ocean Basins, Bathymetry and Sea Levels Chapter 4 Please read chapter 5: sediments for next class and start chapter 6 on seawater for Thursday Basic concepts in Chapter 4 Bathymetry the measurement of
Chapter 9 Lecture Outline. Oceans: The Last Frontier
 Chapter 9 Lecture Outline Oceans: The Last Frontier The Vast World Ocean Earth is referred to as the blue planet 71% of Earth s surface is oceans and marginal seas Continents and islands comprise the remaining
The Ocean Floor Chapter 14. Essentials of Geology, 8e. Stan Hatfield and Ken Pinzke Southwestern Illinois College
 The Ocean Floor Chapter 14 Essentials of Geology, 8e Stan Hatfield and Ken Pinzke Southwestern Illinois College The vast world ocean Earth is often referred to as the water planet 71% of Earth s surface
Lecture 05: Ocean Basins. Hypsometric Curve. Consider Ocean Basins: What is the elevation of Chambana?
 Lecture 05: Ocean Basins 1 Hypsometric Curve What is the elevation of Chambana? Shows distribution of surface relative to sea level ~67% below sea level Mean ocean depth ~ -3.7 km (well below sea level)
Seafloor Morphology. Techniques of Investigation. Bathymetry and Sediment Studies
 Seafloor Morphology I f we select a grid for the surface of the earth (i.e. 5 km 2 ) and assign it an average elevation in relation to sea level, we can construct a graph of elevation versus area of the
- West Africa. Abuja, Nigeria May Fredericton Canada Heeswijk The Netherlands Washington DC United States Adelaide Australia
 A Case Study in Land and Sea Data Interoperability Patricia GASPAR(Netherlands), Andrew HOGGARTH(Canade), Gordon JOHNSTON(UK), Charles de JONG(Netherlands) - West Africa Abuja, Nigeria - 6-10 May 2013
Fig Available seismic reflection, refraction, and magnetic profiles from 107 the Offshore Indus Basin close to the representative profile GCDH,
 List of Figures Page No. Fig. 1.1 Generalized physiography of the Indian Ocean along with 2 selected (200 m, 1000 m, 2000 m, and 3000 m) bathymetric contours. Fig. 1.2 Lithospheric plates in the Indian
Geography of the world s oceans and major current systems. Lecture 2
 Geography of the world s oceans and major current systems Lecture 2 WHY is the GEOMORPHOLOGY OF THE OCEAN FLOOR important? (in the context of Oceanography) WHY is the GEOMORPHOLOGY OF THE OCEAN FLOOR important?
Geo-spatial Analysis for Prediction of River Floods
 Geo-spatial Analysis for Prediction of River Floods Abstract. Due to the serious climate change, severe weather conditions constantly change the environment s phenomena. Floods turned out to be one of
ACCURACY ASSESSMENT OF ASTER GLOBAL DEM OVER TURKEY
 ACCURACY ASSESSMENT OF ASTER GLOBAL DEM OVER TURKEY E. Sertel a a ITU, Civil Engineering Faculty, Geomatic Engineering Department, 34469 Maslak Istanbul, Turkey sertele@itu.edu.tr Commission IV, WG IV/6
Oceanography. Oceanography is the study of the deep sea and shallow coastal oceans.
 Oceanography Oceanography is the study of the deep sea and shallow coastal oceans. Studying the Ocean Floor To determine the shape and composition of the ocean floor, scientists use techniques such as
OCEANOGRAPHY MEASURING THE DEPTHS OF THE OCEANS
 Water 2 page 1 OCEANOGRAPHY Name If all the water was drained from the ocean basins, what kind of surface would be revealed? It would not be the quiet, subdued topography as was once thought, but a surface
GIS and Remote Sensing
 Spring School Land use and the vulnerability of socio-ecosystems to climate change: remote sensing and modelling techniques GIS and Remote Sensing Katerina Tzavella Project Researcher PhD candidate Technology
Seas. A sea is a part of an ocean that is nearly surrounded by water. The Mediterranean, Arctic and Black Sea are really part of the Atlantic Ocean.
 Exploring the Ocean Since ancient times people have studied the ocean such as waters and ocean floor It provides food and services, and serves as a route for trade and travel The World s Oceans 71% of
24. Ocean Basins p
 24. Ocean Basins p. 350-372 Background The majority of the planet is covered by ocean- about %. So the majority of the Earth s crust is. This crust is hidden from view beneath the water so it is not as
2) re-positioning of the SSS data, 3) individuation of geomorphological features and morphometrical parameters correlated to instability phenomena.
 re-positioning of the SSS data, 3) individuation of geomorphological features and morphometrical parameters correlated to instability phenomena.") HIGH-RESOLUTION SIDE SCAN SONAR AND MULTIBEAM DATA PROCESSING AND MERGING TO STUDY SUBMARINE INSTABILITY PHENOMENA ON VOLCANIC ISLANDS (PONTINE, CAMPANIAN AND AEOLIAN ARCHIPELAGOS) A. BOSMAN Extended abstract:
HIGH-RESOLUTION SIDE SCAN SONAR AND MULTIBEAM DATA PROCESSING AND MERGING TO STUDY SUBMARINE INSTABILITY PHENOMENA ON VOLCANIC ISLANDS (PONTINE, CAMPANIAN AND AEOLIAN ARCHIPELAGOS) A. BOSMAN Extended abstract:
Digital Elevation Models (DEM) / DTM
 / DTM") Digital Elevation Models (DEM) / DTM Uses in remote sensing: queries and analysis, 3D visualisation, layers in classification Fogo Island, Cape Verde Republic ASTER DEM / image Banks Peninsula, Christchurch,
Digital Elevation Models (DEM) / DTM Uses in remote sensing: queries and analysis, 3D visualisation, layers in classification Fogo Island, Cape Verde Republic ASTER DEM / image Banks Peninsula, Christchurch,
Display data in a map-like format so that geographic patterns and interrelationships are visible
 Vilmaliz Rodríguez Guzmán M.S. Student, Department of Geology University of Puerto Rico at Mayagüez Remote Sensing and Geographic Information Systems (GIS) Reference: James B. Campbell. Introduction to
VILLAGE INFORMATION SYSTEM (V.I.S) FOR WATERSHED MANAGEMENT IN THE NORTH AHMADNAGAR DISTRICT, MAHARASHTRA
 FOR WATERSHED MANAGEMENT IN THE NORTH AHMADNAGAR DISTRICT, MAHARASHTRA") VILLAGE INFORMATION SYSTEM (V.I.S) FOR WATERSHED MANAGEMENT IN THE NORTH AHMADNAGAR DISTRICT, MAHARASHTRA Abstract: The drought prone zone in the Western Maharashtra is not in position to achieve the agricultural
VILLAGE INFORMATION SYSTEM (V.I.S) FOR WATERSHED MANAGEMENT IN THE NORTH AHMADNAGAR DISTRICT, MAHARASHTRA Abstract: The drought prone zone in the Western Maharashtra is not in position to achieve the agricultural
e-atlas Metadata Template
 e-atlas Metadata Template The template provided below is a summary of the key information required by the e-atlas inorder for the ISO19115 MCP standard records to be created. To create a new meta-data
The Integration of Land and Marine Spatial Data Set As Part of Indonesian Spatial Data Infrastructure Development
 UNITED NATIONS E/CONF.97/6/IP. 46 ECONOMIC AND SOCIAL COUNCIL Seventeenth United Nations Regional Cartographic Conference for Asia and the Pacific Bangkok, 18-22 September 2006 Item 7 of the provisional
ARE YOU READY TO THINK? Look at the first slide THINK PAIR SHARE!
 ARE YOU READY TO THINK? Look at the first slide THINK PAIR SHARE! WHAT PROMINENT FEATURE CAN YOU IDENTIFY IN THIS PICTURE? What do you think the different colors represent? Who might find such a picture
Floodplain modeling. Ovidius University of Constanta (P4) Romania & Technological Educational Institute of Serres, Greece
 Romania & Technological Educational Institute of Serres, Greece") Floodplain modeling Ovidius University of Constanta (P4) Romania & Technological Educational Institute of Serres, Greece Scientific Staff: Dr Carmen Maftei, Professor, Civil Engineering Dept. Dr Konstantinos
Floodplain modeling Ovidius University of Constanta (P4) Romania & Technological Educational Institute of Serres, Greece Scientific Staff: Dr Carmen Maftei, Professor, Civil Engineering Dept. Dr Konstantinos
Seabed knowledge In support of UN SDGs
 Seabed knowledge In support of UN SDGs Evert Flier Fiskerifaglig forum 2. november 2017 Hydrography & small scale fishing Hydrography in Transition Serving the Maritime Community Hydrography in Transition
EMODnet High Resolution Seabed Mapping - further developing and providing a high resolution digital bathymetry for European seas
 EMODnet High Resolution Seabed Mapping - further developing and providing a high resolution digital bathymetry for European seas EGU Fall 2017 meeting New Orleans USA, December 2017 Schaap Dick MARIS,
Digital Elevation Models (DEM) / DTM
 / DTM") Digital Elevation Models (DEM) / DTM Uses in remote sensing: queries and analysis, 3D visualisation, classification input Fogo Island, Cape Verde Republic ASTER DEM / image Banks Peninsula, Christchurch,
Digital Elevation Models (DEM) / DTM Uses in remote sensing: queries and analysis, 3D visualisation, classification input Fogo Island, Cape Verde Republic ASTER DEM / image Banks Peninsula, Christchurch,
Essential Question: How are the geological features that exist on land similar to the geological features on the ocean floor?
 Essential Question: How are the geological features that exist on land similar to the geological features on the ocean floor? Geography of the Oceans The world ocean can be divided into four main ocean
Small area of the ocean that is partially surrounded by land. The Ocean Basins. Three Major Oceans. Three Major Oceans. What is a SEA?
 The Ocean Basins How Deep is the Ocean? 1 2 Three Major Oceans Three Major Oceans Pacific Atlantic the shallowest ocean (3.3km average depth) Indian second shallowest ocean (3.8km average depth) Pacific
Pan-Arctic Digital Elevation Map (Pan-Arctic DEM)
") Memorandum to CAFF Board 07/28/2017 BACKGROUND: Pan-Arctic Digital Elevation Map (Pan-Arctic DEM) ArcticDEM is a National Geospatial-Intelligence Agency (NGA)-National Science Foundation (NSF) publicprivate
Memorandum to CAFF Board 07/28/2017 BACKGROUND: Pan-Arctic Digital Elevation Map (Pan-Arctic DEM) ArcticDEM is a National Geospatial-Intelligence Agency (NGA)-National Science Foundation (NSF) publicprivate
Updating the GEBCO Grid
 Updating the GEBCO Grid PAULINE WEATHERALL, GEBCO DIGITAL ATLAS MANAGER, BRITISH OCEANOGRAPHIC DATA CENTRE (BODC), NATIONAL OCEANOGRAPHY CENTRE (NOC), LIVERPOOL, UK. GEBCO TSCOM and SCRUM meeting, Kuala
Georeferencing and Satellite Image Support: Lessons learned, Challenges and Opportunities
 Georeferencing and Satellite Image Support: Lessons learned, Challenges and Opportunities Shirish Ravan shirish.ravan@unoosa.org UN-SPIDER United Nations Office for Outer Space Affairs (UNOOSA) UN-SPIDER
Digital Elevation Models (DEM)
") Digital Elevation Models (DEM) Digital representation of the terrain surface enable 2.5 / 3D views Rule #1: they are models, not reality Rule #2: they always include some errors (subject to scale and data
Digital Elevation Models (DEM) Digital representation of the terrain surface enable 2.5 / 3D views Rule #1: they are models, not reality Rule #2: they always include some errors (subject to scale and data
Chapter 02 The Sea Floor
 Chapter 02 The Sea Floor Multiple Choice Questions 1. One of the following is not one of the world's major ocean basins: A. Atlantic Ocean B. Arctic Ocean C. Indian Ocean D. Antarctic Ocean E. Pacific
MAP STUDY: INTERPRETATION OF SURVEY MAPS
 MAP STUDY: INTERPRETATION OF SURVEY MAPS Types and Elements of Maps Maps are drawn to represent the Earth on a piece of paper. Maps are used widely to represent the Earth. Maps use signs and symbols in
Determining the Location of the Simav Fault
 Lindsey German May 3, 2012 Determining the Location of the Simav Fault 1. Introduction and Problem Formulation: The issue I will be focusing on involves interpreting the location of the Simav fault in
Understanding elevation and derivative layers
 Understanding elevation and derivative layers ArcGIS makes it easy to work with elevation data by offering a dynamic world elevation service (TopoBathy) and a specific land elevation (Terrain). These services
Effects of Rising Sea Levels on Coral Reef and Mangrove Distributions along the Great Barrier Reef in Australia
 Effects of Rising Sea Levels on Coral Reef and Mangrove Distributions along the Great Barrier Reef in Australia Sarah Barfield Graduate Student Department of Integrative Biology University of Texas, Austin
Appendix I: Geographic Information System Data Sources
 Appendix I: Geographic Information System Data Sources Draft Environmental Impact Statement/Overseas Environmental Impact Statement Hawaii-Southern California Training and Testing TABLE OF CONTENTS...
Positional accuracy of the drainage networks extracted from ASTER and SRTM for the Gorongosa National Park region - Comparative analysis
 Positional accuracy of the drainage networks extracted from ASTER and SRTM for the Gorongosa National Park region - Comparative analysis Tiago CARMO 1, Cidália C. FONTE 1,2 1 Departamento de Matemática,
3/29/11. Why bother with tools? Incorporating Decision Support Tools into Climate Adaptation Planning. A Simplified Planning Process
 Incorporating Decision Support Tools into Climate Adaptation Planning Why bother with tools? Tools don t eliminate complexity but they can help deal with it" Tools can:"! Help incorporate science into
Application of high-resolution (10 m) DEM on Flood Disaster in 3D-GIS
 DEM on Flood Disaster in 3D-GIS") Risk Analysis V: Simulation and Hazard Mitigation 263 Application of high-resolution (10 m) DEM on Flood Disaster in 3D-GIS M. Mori Department of Information and Computer Science, Kinki University, Japan
Risk Analysis V: Simulation and Hazard Mitigation 263 Application of high-resolution (10 m) DEM on Flood Disaster in 3D-GIS M. Mori Department of Information and Computer Science, Kinki University, Japan
Kyle Griebel NRS 509 Dr. August & Dr. Wang GIS and remote sensing in Seafloor mapping
 GIS and remote sensing in Seafloor mapping Introduction to seafloor mapping Seafloor maps have a wide variety of uses for scientists and coastal planning needs. Some of these uses include biological assessment
INTERNATIONAL JOURNAL OF ENVIRONMENTAL SCIENCES Volume 5, No 1, Copyright by the authors - Licensee IPA- Under Creative Commons license 3.
 INTERNATIONAL JOURNAL OF ENVIRONMENTAL SCIENCES Volume 5, No 1, 2014 Copyright by the authors - Licensee IPA- Under Creative Commons license 3.0 Research article ISSN 0976 4402 Manual and automated delineation
Directed Reading. Section: The Water Planet. surface is called the a. Earth s ocean. b. Pacific Ocean. c. salt-water ocean. d. global ocean.
 Skills Worksheet Directed Reading Section: The Water Planet 1. The body of salt water covering nearly three-quarters of the Earth s surface is called the a. Earth s ocean. b. Pacific Ocean. c. salt-water
NEW TOOLS TO IMPROVE DESKTOP SURVEYS
 NEW TOOLS TO IMPROVE DESKTOP SURVEYS Pablo Vengoechea (Telemediciones S.A.), Jorge O. García (Telemediciones S.A.), Email: Telemediciones S.A. / Cra. 46 94-17 Bogotá D.C.
Extraction of Drainage Pattern from ASTER and SRTM Data for a River Basin using GIS Tools
 2012 International Conference on Environment, Energy and Biotechnology IPCBEE vol.33 (2012) (2012) IACSIT Press, Singapore Extraction of Drainage Pattern from ASTER and SRTM Data for a River Basin using
The Urban Sea and Coastal Zone Management
 The Urban Sea and Coastal Zone Management David NEALE, Trinidad and Tobago Key words: hydrography, Caribbean, coastal zone management, land use. SUMMARY Within the coastal zone of Eastern Caribbean States,
INSPIRE Basics. Vlado Cetl European Commission Joint Research Centre. https://ec.europa.eu/jrc/
 INSPIRE Basics Vlado Cetl European Commission Joint Research Centre https://ec.europa.eu/jrc/ Serving society Stimulating innovation Supporting legislation Outline SDI? Why European SDI? INSPIRE Policy
USING 3D GIS TO ASSESS ENVIRONMENTAL FLOOD HAZARDS IN MINA
 King Fahd University of Petroleum & Minerals College of Environmental Design Geographical Information system USING 3D GIS TO ASSESS ENVIRONMENTAL FLOOD HAZARDS IN MINA Prepared by : Ali AL-Zahrani OUTLINE
1/28/16. EGM101 Skills Toolbox. Map types. Political Physical Topographic Climate Resource Road. Thematic maps (use one of the above as backdrop)
") EGM101 Skills Toolbox Map types Political Physical Topographic Climate Resource Road Thematic maps (use one of the above as backdrop) Map Types Deriving information from maps Hydrographic Geological Soils
EGM101 Skills Toolbox Map types Political Physical Topographic Climate Resource Road Thematic maps (use one of the above as backdrop) Map Types Deriving information from maps Hydrographic Geological Soils
WHAT IS THE EARTH MADE OF? LITHOSPHERE AND HYDROSPHERE
 UNIT 8 WHAT IS THE EARTH MADE OF? LITHOSPHERE AND HYDROSPHERE TABLE OF CONTENTS 1 THE STRUCTURE OF THE EARTH... 2 2 THE FORMATION OF THE RELIEF: INTERNAL AND EXTERNAL FORCES.... 2 2.1 Internal forces:
DEVELOPMENT OF FLOOD HAZARD VULNERABILITY MAP FOR ALAPPUZHA DISTRICT
 DEVELOPMENT OF FLOOD HAZARD VULNERABILITY MAP FOR ALAPPUZHA DISTRICT Ciya Maria Roy 1, Elsa Manoj 2, Harsha Joy 3, Sarin Ravi 4, Abhinanda Roy 5 1,2,3,4 U.G. Student, Department of Civil Engineering, MITS
The surface of the ocean floor is as varied as the land. The five major oceans, from largest to smallest, are
 11.1 Ocean Basins The surface of the ocean floor is as varied as the land. The five major oceans, from largest to smallest, are w the Pacific w the Atlantic w the Indian w the Southern w the Arctic The
Geological features and geophysical signatures of continental margins of India
 Geological features and geophysical signatures of continental margins of India K. S. Krishna National Institute of Oceanography, Dona Paula, Goa-43 4. krishna@nio.org The shape and classification of continental
Regional and Nearshore Bathymetry of American Samoa: Implications for Tsunami Run-Up and Public Awareness
 Regional and Nearshore Bathymetry of American Samoa: Implications for Tsunami Run-Up and Public Awareness Presentation U21D-07 2009 AGU Fall Meeting San Francisco Authors Dawn Wright Dept. of Geosciences,
The Marine Environment
 The Marine Environment SECTION 16.1 Shoreline Features In your textbook, read about erosional landforms, beaches, estuaries, longshore currents, and rip currents. For each statement below, write or. 1.
GLY Coastal Geomorphology Notes
 GLY 4734 - Coastal Geomorphology Notes Dr. Peter N. Adams Spring 2011 2 Coastal Classification In this lecture, we discuss some successful classification schemes of the coastal landscape, and pay particular
STUDY IN SURFACE AND HYDROLOGICAL ANALYSIS FOR THERTHAR LAKE AND SURROUNDING AREAS BY GEOGRAPHIC INFORMATION SYSTEM (GIS)
") I.J.S.N., VOL.9 (1) 2018: 5-10 ISSN 2229 6441 STUDY IN SURFACE AND HYDROLOGICAL ANALYSIS FOR THERTHAR LAKE AND SURROUNDING AREAS BY GEOGRAPHIC INFORMATION SYSTEM (GIS) Shahad Yaseen Hamza & Ban Abd.Al-Razak
I.J.S.N., VOL.9 (1) 2018: 5-10 ISSN 2229 6441 STUDY IN SURFACE AND HYDROLOGICAL ANALYSIS FOR THERTHAR LAKE AND SURROUNDING AREAS BY GEOGRAPHIC INFORMATION SYSTEM (GIS) Shahad Yaseen Hamza & Ban Abd.Al-Razak
Introduction. Elevation Data Strategy. Status and Next Steps
 1 2 Introduction Elevation Data Strategy Status and Next Steps 3 Canada is the 2nd largest country in the world - 9.9 million sq km Surrounded by 3 oceans with 202 000 km of coastline Population over 35
Name Class Date. The ocean floor has varied and distinct surfaces much like those found on land.
 6 Explore the Seafloor BigIdeas The ocean floor has varied and distinct surfaces much like those found on land. Satellites orbiting Earth, as well as sonar technology, are used to map the seafloor. The
Digital Elevation Model (DEM) of Sable Island Bank and adjacent areas
 of Sable Island Bank and adjacent areas") GEOLOGICAL SURVEY OF CANADA OPEN FILE 5348 Digital Elevation Model (DEM) of Sable Island Bank and adjacent areas K.J. Webb and E.L. King 2014 GEOLOGICAL SURVEY OF CANADA OPEN FILE 5348 Digital Elevation
GEOLOGICAL SURVEY OF CANADA OPEN FILE 5348 Digital Elevation Model (DEM) of Sable Island Bank and adjacent areas K.J. Webb and E.L. King 2014 GEOLOGICAL SURVEY OF CANADA OPEN FILE 5348 Digital Elevation
GIS feature extraction tools in diverse landscapes
 CE 394K.3 GIS in Water Resources GIS feature extraction tools in diverse landscapes Final Project Anna G. Kladzyk M.S. Candidate, Expected 2015 Department of Environmental and Water Resources Engineering
Remote Sensing and GIS Applications for Hilly Watersheds SUBASHISA DUTTA DEPARTMENT OF CIVIL ENGINEERING IIT GUWAHATI
 Remote Sensing and GIS Applications for Hilly Watersheds SUBASHISA DUTTA DEPARTMENT OF CIVIL ENGINEERING IIT GUWAHATI Deciding Alternative Land Use Options in a Watershed Using GIS Source: Anita Prakash
Chapter 1 Overview of Maps
 Chapter 1 Overview of Maps In this chapter you will learn about: Key points when working with maps General types of maps Incident specific maps Map legend and symbols Map sources A map is a navigational
Global Survey of Organized Landforms: Recognizing Linear Sand Dunes
 Global Survey of Organized Landforms: Recognizing Linear Sand Dunes P. L. Guth 1 1 Department of Oceanography, US Naval Academy 572C Holloway Rd, Annapolis MD 21402 USA Telephone: 00-1-410-293-6560 Fax: