A large scale and fine resolution SWAT model for an assessment of isolated climate change impact on unaltered flow regimes in Central Eastern Europe
|
|
|
- Peter Taylor
- 6 years ago
- Views:
Transcription

1 A large scale and fine resolution SWAT model for an assessment of isolated climate change impact on unaltered flow regimes in Central Eastern Europe Mikołaj Piniewski 1,2, Mateusz Szcześniak 2, Tomasz Berezowski 2, Ignacy Kardel 2, Tomasz Okruszko 2, Eirik Førland 3, Zbigniew W. Kundzewicz 2,4 1. Warsaw University of Life Sciences 2. Potsdam Institute for Climate Impact Research 3. MET Norway 4. Institute for Agricultural and Forest Environment, Polish Academy of Sciences

, MET")
2 CHASE PL project CHASE PL: Climate change impact assessment for selected sectors in Poland Climate Change thematic area of the Polish Norwegian Research Programme Timeline Partners: Institute for Agricultural and Forest Environment PAS (lead), MET Norway, WULS SGGW
3 Work packages WP1 Change detection in observed climate of Poland, at a range of scales (IAFE) WP2 Projections of climate variability and change for Poland, comparison with control period (MET.no) WP3 Model based assessment of climate change impacts in the Vistula and the Odra basins (WULS) WP4 Index based assessment of climate change impacts on ecosystems and agriculture (WULS) WP5 Uncertainty in observations, understanding and projections system framework (MET.no) WP6 Promotion and dissemination (Integrated Web Mapping System) WP7 Project management (IAFE)
")
4 GCM RCM combinations of scenarios (EUROCORDEX) Bias correction (quantile mapping method) ongoing!
5 WP3 main objective Model based assessment of climate change impacts in the Vistula and the Odra basins Two level approach of impact assessment In large scale focus on: water balance, river flows In meso scale focus additionally on: water quality, crop yields, environmental flows In large scale: broad spatial overview of impacts and identification of hot spots In meso scale : more in depth process oriented analysis + adaptation measures The SWAT model as the main modelling tool

6 Vistula and Odra: 2nd and 5th largest river basins in EU 1


 73 Barycz 5.5 (4.")
7 Study area: Vistula and Odra river basins Catchment Area [10 3 km 2 ] % in Poland Large scale Vistula Odra Total Meso scale Upper Narew 4.3 (2.2% of the VRB) 73 Barycz 5.5 (4.6% of the ORB) 100
8 Overview of data sources for model inputs Type of input Poland Outside Poland DEM Hydrographic network Land cover Soils Climate data 1 Created based on contour lines, scale 1:25,000, 40m res. MPHP (Hydrographic Map of Poland), scale 1:50,000 CLC2006, Imperviousness2012 (EEA), district level crop statistics (GUS) Soil map from IUNG PIB, scale 1:500,000 Observeddata from IMGW PIB SRTM v m res. CCM River and Catchment Database, version 2.1 CLC2006, MODIS Land Cover & Imperviousness2012 (EEA) Harmonized World Soil Database v 1.2 Observed data from DWD, ECAD, NOAA NCDC Climate data 2 WATCH WFD (ERA 40) , WFDEI (ERA Interim) Development of high resolution gridded temperature and precipitation datasets for modelling


9 Input maps DEM Slopes 2633 subbasins Land cover Soils HRUs


10 Land cover refinement: main crops (2000 Census data)
11 Development of gridded temperature and precipitation datasets for modelling overview Item Minimum and maximum temperature Precipitation Domain Poland + Vistula and Odra basins Data sources IMGW PIB Polish stations DWD German and Czech stations ECAD, NOAA NCDC Slovak, Ukrainian and Belarusian stations Preprocessing Quality assessment Quality assessment Richter correction for precipitation undercatch Interpolation method Kriging with elevation as external drift Library R gstat Time frame Resolution 5 km grid in the projected coordinate system PUWG1992 Output format.tiff files (one file per variable per day) Cross validation All stations, for each day. Both temporal and spatial scale SWAT input Aggregation at subbasin level Combination of Universal Kriging and Indicator Kriging (for wet day probability estimation)
12 Temperature and precipitation stations network
13 Number of stations with data: annual variability Precipitation Temperature Range: Range: year baseline with the best coverage:
14 Cross validation of precipitation: standardized RMSE Median range , with more than 85% of RMSE values not exceeding one standard deviation Negative correlation with the numer of available stations Errors depend on the density of the observation network
15 Calibration of large scale models? Single-gauge calibration??? Spatial calibration and validation???????????? calibration gauges validation gauges Unavoidable problem in calibration of large scale models: water management In the context of climate change impact modelling, water management effects may distort pure climate change effects!
16 Large scale model calibration approach The goal: investigate pure climate change effects (i.e. isolated from water management effects that can amplify or damp CC signal) in order to enable fair spatial comparison of CC impacts The approach: to focus model calibration on near natural subcatchments => develop a model simulating natural flows 1. Water management not considered in the model setup 2. Benchmark (gauged) catchments selected for calibration/validation 3. Optimising the multi site calibration effort by a statistical approach involving the Indicators of Hydrologic Alteration, Principal Component Analysis and Cluster Analysis 4. Regionalisation of optimal parameter values in order to simulate natural flows across the whole basin (future step)
17 Selection of benchmark catchments Benchmark = near natural, relatively undisturbed flow regime Initial pool contains 100+ non nested gauged catchments (areas 500 3,000 km 2 ) with available (> 10 years) discharge data Selection of relatively unimpacted catchments using two approaches Potential predictors of flow alterations selected and calculated in GIS, e.g. dam density; reservoir storage index, volume of water withdrawals, volume of point source discharges Hydrograph screening (visual inspection) 80 benchmark catchments selected 17


18 Selection of benchmark catchments


19 Spatial calibration (parametrisation) approaches All the same Regions Clusters Catchments divided into clusters of similar flow regime Assumption: different clusters have the same calibration parameter values Unique
20 An approach for flow regime clustering for optimising calibration process 1. Major components of the flow regime (magnitude, extremes, duration, timing, rate of change) quantified using 67 Indicators of Hydrologic Alteration (IHAs) for 80 benchmark catchments for the period Principal Component Analysis (PCA) applied in order to derive a parsimonious set of non correlated synthetic indices that represent several uncorrelated dimensions of hydrological variability 3. Tree clustering applied to selected PCAs in order to join gauges into groups having similar flow regimes 4. Each cluster randomly divided into calibration and validation subsets 5. SWAT calibration/validation performed using SWAT CUP SUFI2 separately for each cluster


21 Flow regime clusters
22 Monthly flow magnitude: Wel-KUI (Cluster 1) Monthly flow magnitude: Pop-SSA (Cluster 2) Monthly flow magnitude: Net-BNN (Cluster 3) 3.0 Lake 3.0 Mountainous Standardized flow [-] Standardized flow [-] Standardized flow [-] Nov Dec Jan Feb Mar Apr May Jun Jul Aug Sep Oct Month Monthly flow magnitude: Nca-DOE (Cluster 4) Highlands Median 25%-75% Nov Dec Jan Feb Mar Apr May Jun Jul Aug Sep Oct Month Monthly flow magnitude: Osa-LIS (Cluster 5) Median 25%-75% Nov Dec Jan Feb Mar Apr May Jun Jul Aug Sep Oct Month Monthly flow magnitude: Liw-ZAL (Cluster 6) Median 25%-75% Standardized flow [-] Standardized flow [-] Standardized flow [-] Standardized flow [-] Nov Dec Jan Feb Mar Apr May Jun Jul Aug Sep Oct Month Monthly flow magnitude: Jas-JAS (Cluster 7) Mountainous 2 Median 25%-75% Standardized flow [-] Nov Dec Jan Feb Mar Apr May Jun Jul Aug Sep Oct Month Monthly flow magnitude: CzW-JAN (Cluster 8) Median 25%-75% 0.0 Nov Dec Jan Feb Mar Apr May Jun Jul Aug Sep Oct Month Median (+/- IQR) monthly standardized flows One catchment per cluster Median 25%-75% Nov Dec Jan Feb Mar Apr May Jun Jul Aug Sep Oct Month Median 25%-75% 0.0 Nov Dec Jan Feb Mar Apr May Jun Jul Aug Sep Oct Month Median 25%-75%

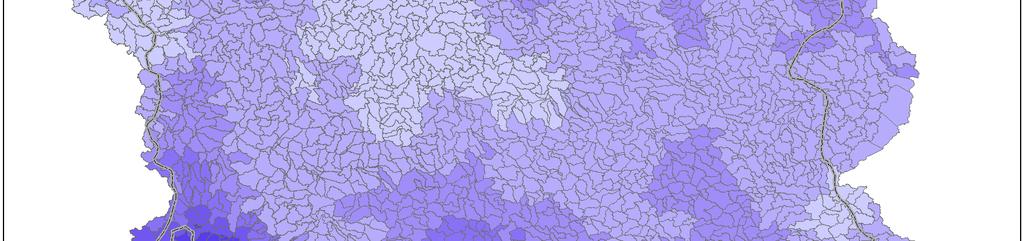
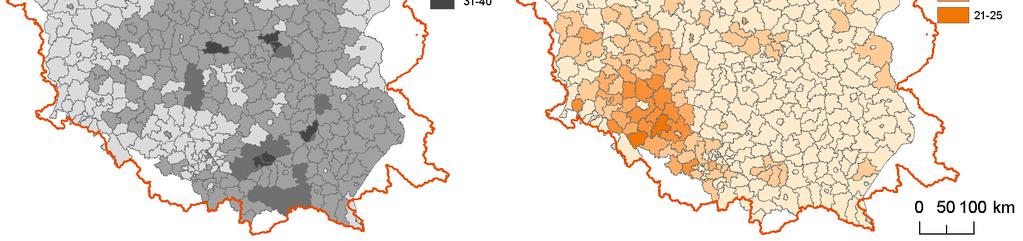
23 Mean annual precipitation at subbasin level


24 Model inputs/outputs before calibration Winter PCP Snow melt Summer PCP PET (Hargreaves)
25 Initial results: single gauge vs multi gauge What is the objective function value at 80 benchmark catchments when the model is calibrated at the watershed outlets? Compare these values with the situation when the model is calibrated independently for every benchmark catchments One SUFI 2 run KGE (Kling Gupta Efficiency) used as an OF

26 Initial results: objective function (clusters) KGE after the first SUFI 2 iteration for 6 out of 8 clusters (mean values across clusters)
27 Initial results: 95PPU uncertainty measures p and r factors after the first SUFI 2 iteration for 6 out of 8 clusters Gauge values Mean cluster values

28 Initial results: calibration plots R. Drawa, cluster 1 (Cal) Plots for the first SUFI-2 iteration 20 p fact 0.89 r fact 2.01 KGE 0.74 PBIAS y p fact 0.83 r fact 2.2 KGE 0.48 PBIAS 16.6 R. Krutynia, cluster 1 (Val) 10y
 Plots for the first SUFI-2")
 10y 20 p fact 0.")
29 Initial results: calibration plots R. Mierzawa, cluster 4 (Cal) Plots for the first SUFI-2 iteration 50 p fact 0.98 r fact 2.32 KGE 0.83 PBIAS 3.4 1y R. Por, cluster 4 (Val) 10y 20 p fact 0.86 r fact 1.94 KGE 0.50 PBIAS 35.1
30 Summary A framework for spatial calibration of large scale SWAT models has been presented. It can be applied elsewhere provided that a sufficient number of gauged benchmark catchments exists Preliminary calibration results are quite promising The SWAT model of the Vistula and Odra basins will deliver natural daily flows simulated for the period Projections simulated using this model will enable disentangling pure climate change effects from other effects not related to climate In the nearby future projections of future streamflow (along with other projections) will be made available through an Interactive Web Mapping System ( under construction)


31 Acknowledgements 31
32 Thank you!
Changing Hydrology under a Changing Climate for a Coastal Plain Watershed
 Changing Hydrology under a Changing Climate for a Coastal Plain Watershed David Bosch USDA-ARS, Tifton, GA Jeff Arnold ARS Temple, TX and Peter Allen Baylor University, TX SEWRU Objectives 1. Project changes
Building a European-wide hydrological model
 Building a European-wide hydrological model 2010 International SWAT Conference, Seoul - South Korea Christine Kuendig Eawag: Swiss Federal Institute of Aquatic Science and Technology Contribution to GENESIS
HYDROLOGICAL MODELING OF HIGHLY GLACIERIZED RIVER BASINS. Nina Omani, Raghavan Srinivasan, Patricia Smith, Raghupathy Karthikeyan, Gerald North
 HYDROLOGICAL MODELING OF HIGHLY GLACIERIZED RIVER BASINS Nina Omani, Raghavan Srinivasan, Patricia Smith, Raghupathy Karthikeyan, Gerald North Problem statement Glaciers help to keep the earth cool High
Climate Change Impact Assessment on Long Term Water Budget for Maitland Catchment in Southern Ontario
 215 SWAT CONFERENCE, PURDUE Climate Change Impact Assessment on Long Term Water Budget for Maitland Catchment in Southern Ontario By Vinod Chilkoti Aakash Bagchi Tirupati Bolisetti Ram Balachandar Contents
GLACIER AND SNOWMELT MODELLING USING SWAT: GANGA BASIN CASE STUDY. INRM Consultants Pvt. Ltd.
 GLACIER AND SNOWMELT MODELLING USING SWAT: GANGA BASIN CASE STUDY INRM Consultants Pvt. Ltd. Introduction Snowmelt Runoff contribution in the Himalayan Rivers Estimation of Average contribution of Snowmelt
PRELIMINARY DRAFT FOR DISCUSSION PURPOSES
 Memorandum To: David Thompson From: John Haapala CC: Dan McDonald Bob Montgomery Date: February 24, 2003 File #: 1003551 Re: Lake Wenatchee Historic Water Levels, Operation Model, and Flood Operation This
Modeling of a River Basin Using SWAT Model and SUFI-2
 Modeling of a River Basin Using SWAT Model and SUFI-2 NINA OMANI MASOUD TAJRISHY AHMAD ABRISHAMCHI Sharif University of Technology, Tehran, Iran Karkheh Dam, Iran 1 Area of Gharasu Sub-basin : 5793 km2
Chiang Rai Province CC Threat overview AAS1109 Mekong ARCC
 Chiang Rai Province CC Threat overview AAS1109 Mekong ARCC This threat overview relies on projections of future climate change in the Mekong Basin for the period 2045-2069 compared to a baseline of 1980-2005.
APPLICATIONS OF DOWNSCALING: HYDROLOGY AND WATER RESOURCES EXAMPLES
 APPLICATIONS OF DOWNSCALING: HYDROLOGY AND WATER RESOURCES EXAMPLES Dennis P. Lettenmaier Department of Civil and Environmental Engineering For presentation at Workshop on Regional Climate Research NCAR
Hydrological modelling of the Lena River using SWIM
 Hydrological modelling of the Lena River using SWIM Michel Wortmann 1 1 Potsdam Institute for Climate Impact Research (PIK), Germany July 8, 214 Contents 1 The Lena catchment and data used 1 1.1 Discharge
COUPLING A DISTRIBUTED HYDROLOGICAL MODEL TO REGIONAL CLIMATE MODEL OUTPUT: AN EVALUATION OF EXPERIMENTS FOR THE RHINE BASIN IN EUROPE
 P.1 COUPLING A DISTRIBUTED HYDROLOGICAL MODEL TO REGIONAL CLIMATE MODEL OUTPUT: AN EVALUATION OF EXPERIMENTS FOR THE RHINE BASIN IN EUROPE Jan Kleinn*, Christoph Frei, Joachim Gurtz, Pier Luigi Vidale,
Liliana Pagliero June, 15 th 2011
 Liliana Pagliero liliana.pagliero@jrc.ec.europa.eu June, 15 th 2011 2/18 SWAT MODELLING AT PAN EUROPEAN SCALE: THE DANUBE BASIN PILOT STUDY Introduction The Danube Model Available databases Model set up
Gridded observation data for Climate Services
 Gridded observation data for Climate Services Ole Einar Tveito, Inger Hanssen Bauer, Eirik J. Førland and Cristian Lussana Norwegian Meteorological Institute Norwegian annual temperatures Norwegian annual
Impacts of climate change on flooding in the river Meuse
 Impacts of climate change on flooding in the river Meuse Martijn Booij University of Twente,, The Netherlands m.j.booij booij@utwente.nlnl 2003 in the Meuse basin Model appropriateness Appropriate model
Analyzing spatial and temporal variation of water balance components in La Vi catchment, Binh Dinh province, Vietnam
 Analyzing spatial and temporal variation of water balance components in La Vi catchment, Binh Dinh province, Vietnam Nguyen Duy Liem, Vo Ngoc Quynh Tram, Nguyen Le Tan Dat, Nguyen Kim Loi Nong Lam University-
Modeling the Effects of Climate and Land Cover Change in the Stoney Brook Subbasin of the St. Louis River Watershed
 Modeling the Effects of Climate and Land Cover Change in the Stoney Brook Subbasin of the St. Louis River Watershed Joe Johnson and Jesse Pruette 214 NASA Research Internship Geospatial Technologies Program
Inter-linkage case study in Pakistan
 7 th GEOSS Asia Pacific Symposium GEOSS AWCI Parallel Session: 26-28 May, 2014, Tokyo, Japan Inter-linkage case study in Pakistan Snow and glaciermelt runoff modeling in Upper Indus Basin of Pakistan Maheswor
Setting up SWAT for the Upper Amazon
 2014 International SWAT Conference Setting up SWAT for the Upper Amazon Michael Strauch, Martin Volk 2014 International SWAT Conference Porto de Galinhas, July 30 August 1, 2014 ISI-MIP2 Inter-Sectoral
3 PERFORMANCE OF WATERGAP AS COMPARED TO MESOSCALE MODELS: A CASE STUDY FOR THE ELBE AND ODER BASINS
 EuroWasser: Performance of WaterGAP as compared to mesoscale models 3-1 3 PERFORMANCE OF WATERGAP AS COMPARED TO MESOSCALE MODELS: A CASE STUDY FOR THE ELBE AND ODER BASINS Bernhard Lehner *, Frank Kaspar
Climate Change Impact Assessment on Indian Water Resources. Ashvin Gosain, Sandhya Rao, Debajit Basu Ray
 Climate Change Impact Assessment on Indian Water Resources Ashvin Gosain, Sandhya Rao, Debajit Basu Ray Objectives of the Study To quantify the impact of the climate change on the water resources of the
HYDROLOGIC AND WATER RESOURCES EVALUATIONS FOR SG. LUI WATERSHED
 HYDROLOGIC AND WATER RESOURCES EVALUATIONS FOR SG. LUI WATERSHED 1.0 Introduction The Sg. Lui watershed is the upper part of Langat River Basin, in the state of Selangor which located approximately 20
Lower Tuolumne River Accretion (La Grange to Modesto) Estimated daily flows ( ) for the Operations Model Don Pedro Project Relicensing
 Estimated daily flows ( ) for the Operations Model Don Pedro Project Relicensing") Lower Tuolumne River Accretion (La Grange to Modesto) Estimated daily flows (1970-2010) for the Operations Model Don Pedro Project Relicensing 1.0 Objective Using available data, develop a daily time series
Lower Tuolumne River Accretion (La Grange to Modesto) Estimated daily flows (1970-2010) for the Operations Model Don Pedro Project Relicensing 1.0 Objective Using available data, develop a daily time series
Setting up SWAT to quantify water-related ecosystem services in a large East African watershed
 Benedikt Notter, University of Bern, Switzerland Setting up SWAT to quantify water-related ecosystem services in a large East African watershed 5th International SWAT Conference August 5 7, Boulder, Colorado
Streamflow, Sediment, and Nutrient Simulation of the Bitterroot Watershed using SWAT
 Streamflow, Sediment, and Nutrient Simulation of the Bitterroot Watershed using SWAT by Dr. Michael Van Liew Montana Department of Environmental Quality Helena, Montana, USA Site Map of SWAT Watersheds
Modelling changes in the runoff regime in Slovakia using high resolution climate scenarios
 Modelling changes in the runoff regime in Slovakia using high resolution climate scenarios K. HLAVČOVÁ, R. VÝLETA, J. SZOLGAY, S. KOHNOVÁ, Z. MACUROVÁ & P. ŠÚREK Department of Land and Water Resources
July, International SWAT Conference & Workshops
 July, 212 212 International SWAT Conference & Workshops Hydrological Modelling of Kosi and Gandak Basins using SWAT Model S. Dutta, Pritam Biswas, Sangita Devi, Suresh A Karth and Bimlesh kumar, Ganga
3.0 TECHNICAL FEASIBILITY
 3.0 TECHNICAL FEASIBILITY 3.1 INTRODUCTION To enable seasonal storage and release of water from Lake Wenatchee, an impoundment structure would need to be constructed on the lake outlet channel. The structure
Hydrologic Response of SWAT to Single Site and Multi- Site Daily Rainfall Generation Models
 Hydrologic Response of SWAT to Single Site and Multi- Site Daily Rainfall Generation Models 1 Watson, B.M., 2 R. Srikanthan, 1 S. Selvalingam, and 1 M. Ghafouri 1 School of Engineering and Technology,
Gökhan Cüceloğlu, İzzet Öztürk. Istanbul Technical University Department of Environmental Engineering Maslak/IstanbulTurkey
 Assessing the Influence of Climate Datasets for Quantification of Water Balance Components in Black Sea Catchment: Case Study for Melen Watershed, Turkey Gökhan Cüceloğlu, İzzet Öztürk Istanbul Technical
GAMINGRE 8/1/ of 7
 FYE 09/30/92 JULY 92 0.00 254,550.00 0.00 0 0 0 0 0 0 0 0 0 254,550.00 0.00 0.00 0.00 0.00 254,550.00 AUG 10,616,710.31 5,299.95 845,656.83 84,565.68 61,084.86 23,480.82 339,734.73 135,893.89 67,946.95
2015 Fall Conditions Report
 2015 Fall Conditions Report Prepared by: Hydrologic Forecast Centre Date: December 21 st, 2015 Table of Contents Table of Figures... ii EXECUTIVE SUMMARY... 1 BACKGROUND... 2 SUMMER AND FALL PRECIPITATION...
Assessing bias in satellite rainfall products and their impact in water balance closure at the Zambezi headwaters
 Assessing bias in satellite rainfall products and their impact in water balance closure at the Zambezi headwaters Omondi C.K. 1 Rientjes T.H.M. 1, Haile T.A. 2, Gumindoga W. 1,3 (1) Faculty ITC, University
Appendix D. Model Setup, Calibration, and Validation
 . Model Setup, Calibration, and Validation Lower Grand River Watershed TMDL January 1 1. Model Selection and Setup The Loading Simulation Program in C++ (LSPC) was selected to address the modeling needs
Regional climate-change downscaling for hydrological applications using a nonhomogeneous hidden Markov model
 Regional climate-change downscaling for hydrological applications using a nonhomogeneous hidden Markov model Water for a Healthy Country Flagship Steve Charles IRI Seminar, September 3, 21 Talk outline
Climate also has a large influence on how local ecosystems have evolved and how we interact with them.
 The Mississippi River in a Changing Climate By Paul Lehman, P.Eng., General Manager Mississippi Valley Conservation (This article originally appeared in the Mississippi Lakes Association s 212 Mississippi
Met Éireann Climatological Note No. 15 Long-term rainfall averages for Ireland,
 Met Éireann Climatological Note No. 15 Long-term rainfall averages for Ireland, 1981-2010 Séamus Walsh Glasnevin Hill, Dublin 9 2016 Disclaimer Although every effort has been made to ensure the accuracy
The Norwegian Centre for Climate Services - NCCS
 The Norwegian Centre for Climate Services - NCCS Extremes Products - Dissemination Eirik J. Førland, Norwegian Meteorological Institute, Oslo, Norway Impact assessment consultation workshop, Budapest,
Impact of different types of meteorological data inputs on predicted hydrological and erosive responses to projected land use change
 Impact of different types of meteorological data inputs on predicted hydrological and erosive responses to projected land use change Suman Bhattacharyya 1 & Joy Sanyal * 1 2 1 Department of Geography,
Characterization of the solar irradiation field for the Trentino region in the Alps
 Characterization of the solar irradiation field for the Trentino region in the Alps L. Laiti*, L. Giovannini and D. Zardi Atmospheric Physics Group University of Trento - Italy outline of the talk Introduction
Modeling of peak inflow dates for a snowmelt dominated basin Evan Heisman. CVEN 6833: Advanced Data Analysis Fall 2012 Prof. Balaji Rajagopalan
 Modeling of peak inflow dates for a snowmelt dominated basin Evan Heisman CVEN 6833: Advanced Data Analysis Fall 2012 Prof. Balaji Rajagopalan The Dworshak reservoir, a project operated by the Army Corps
Integrating Weather Forecasts into Folsom Reservoir Operations
 Integrating Weather Forecasts into Folsom Reservoir Operations California Extreme Precipitation Symposium September 6, 2016 Brad Moore, PE US Army Corps of Engineers Biography Brad Moore is a Lead Civil
Fenhe (Fen He) Map of River. Table of Basic Data. China 10
 Map of River. Table of Basic Data. China 10") Fenhe (Fen He) Map of River Table of Basic Data Name(s): Fenhe (in Huanghe River) Location: Shanxi Province, Northern China Area: 39,471 km 2 Origin: Mt. Guancen (2,147 m) Outlet: Huanghe Serial No. :
Fenhe (Fen He) Map of River Table of Basic Data Name(s): Fenhe (in Huanghe River) Location: Shanxi Province, Northern China Area: 39,471 km 2 Origin: Mt. Guancen (2,147 m) Outlet: Huanghe Serial No. :
Rong Jiang. Map of River. Table of Basic Data. China 14. Serial No. : China-14
 Rong Jiang Map of River Table of Basic Data Name(s): Rong Jiang Location: Guangdong Province, Coastways China Area: 4,408 km 2 Serial No. : China-14 N 23 11' ~ 23 55' E 115 37' ~ 116 38' Length of the
NATIONAL HYDROPOWER ASSOCIATION MEETING. December 3, 2008 Birmingham Alabama. Roger McNeil Service Hydrologist NWS Birmingham Alabama
 NATIONAL HYDROPOWER ASSOCIATION MEETING December 3, 2008 Birmingham Alabama Roger McNeil Service Hydrologist NWS Birmingham Alabama There are three commonly described types of Drought: Meteorological drought
Hydro-meteorological Analysis of Langtang Khola Catchment, Nepal
 Hydro-meteorological Analysis of Langtang Khola Catchment, Nepal Tirtha R. Adhikari 1, Lochan P. Devkota 1, Suresh.C Pradhan 2, Pradeep K. Mool 3 1 Central Department of Hydrology and Meteorology Tribhuvan
Disentangling Impacts of Climate & Land Use Changes on the Quantity & Quality of River Flows in Southern Ontario
 Disentangling Impacts of Climate & Land Use Changes on the Quantity & Quality of River Flows in Southern Ontario by Trevor Dickinson & Ramesh Rudra, Water Resources Engineering University of Guelph Acknowledgements
How to integrate wetland processes in river basin modeling? A West African case study
 How to integrate wetland processes in river basin modeling? A West African case study stefan.liersch@pik-potsdam.de fred.hattermann@pik-potsdam.de June 2011 Outline Why is an inundation module required?
Evapo-transpiration Losses Produced by Irrigation in the Snake River Basin, Idaho
 Nov 7, 2007 DRAFT Evapo-transpiration Losses Produced by Irrigation in the Snake River Basin, Idaho Wendell Tangborn and Birbal Rana HyMet Inc. Vashon Island, WA Abstract An estimated 8 MAF (million acre-feet)
Webinar and Weekly Summary February 15th, 2011
 Webinar and Weekly Summary February 15th, 2011 -Assessment of current water conditions - Precipitation Forecast - Recommendations for Drought Monitor Upper Colorado Normal Precipitation Upper Colorado
Snowcover interaction with climate, topography & vegetation in mountain catchments
 Snowcover interaction with climate, topography & vegetation in mountain catchments DANNY MARKS Northwest Watershed Research Center USDA-Agricultural Agricultural Research Service Boise, Idaho USA RCEW
2003 Water Year Wrap-Up and Look Ahead
 2003 Water Year Wrap-Up and Look Ahead Nolan Doesken Colorado Climate Center Prepared by Odie Bliss http://ccc.atmos.colostate.edu Colorado Average Annual Precipitation Map South Platte Average Precipitation
TRENDS AND CHANGE IN CLIMATE OVER THE VOLTA RIVER BASIN
 TRENDS AND CHANGE IN CLIMATE OVER THE VOLTA RIVER BASIN VOLTRES PROJECT WORK PACKAGE 1a: CLIMATE KEY RESULTS E. Obuobie, H.E. Andersen, C. Asante-Sasu, M. Osei-owusu 11/9/217 OBJECTIVES Analyse long term
A Post Processing Tool to Assess Sediment and Nutrient Source Allocations from SWAT Simulations
 A Post Processing Tool to Assess Sediment and Nutrient Source Allocations from SWAT Simulations Michael Van Liew William Puknat Montana Department of Environmental Quality Helena, Montana, USA PROBLEM:
The Climate of Oregon Climate Zone 4 Northern Cascades
 /05 E55 Unbound issue No. 9/ is Does not circulate Special Report 916 May 1993 The Climate of Oregon Climate Zone 4 Property of OREGON STATE UNIVERSITY Library Serials Corvallis, OR 97331-4503 Agricultural
SIS Meeting Oct AgriCLASS Agriculture CLimate Advisory ServiceS. Phil Beavis - Telespazio VEGA UK Indicators, Models and System Design
 1 SIS Meeting 17-19 Oct 2016 AgriCLASS Agriculture CLimate Advisory ServiceS Phil Beavis - Telespazio VEGA UK Indicators, Models and System Design Michael Sanderson - UK Met Office Climate Data and Weather
Illinois State Water Survey Division
 Illinois State Water Survey Division SURFACE WATER SECTION SWS Miscellaneous Publication 108 SEDIMENT YIELD AND ACCUMULATION IN THE LOWER CACHE RIVER by Misganaw Demissie Champaign, Illinois June 1989
2003 Moisture Outlook
 2003 Moisture Outlook Nolan Doesken and Roger Pielke, Sr. Colorado Climate Center Prepared by Tara Green and Odie Bliss http://climate.atmos.colostate.edu Through 1999 Through 1999 Fort Collins Total Water
Overview on the modelling setup Seven new features in the modelling framework First results for the Alpine Rhine and Engadin Conclusions and Outlook
 SUB PROJECT: Natural water balance of Switzerland and its most important large river basins Overview on the modelling setup Seven new features in the modelling framework First results for the Alpine Rhine
A Report on a Statistical Model to Forecast Seasonal Inflows to Cowichan Lake
 A Report on a Statistical Model to Forecast Seasonal Inflows to Cowichan Lake Prepared by: Allan Chapman, MSc, PGeo Hydrologist, Chapman Geoscience Ltd., and Former Head, BC River Forecast Centre Victoria
Gridded monthly temperature fields for Croatia for the period
 Gridded monthly temperature fields for Croatia for the 1981 2010 period comparison with the similar global and European products Melita Perčec Tadid melita.percec.tadic@cirus.dhz.hr Meteorological and
Understanding Karnali River Basin. Kabi Raj Khatiwada
 Understanding Karnali River Basin Kabi Raj Khatiwada http://treasuresfromtheroad.com/karnali-river-too-slow-boat/ The asymmetric, single-tower, cable-stayed bridge is the longest of its type in the world
Regional Drought and Crop Yield Information System to enhance drought monitoring and forecasting in Lower Mekong region
 Regional Drought and Crop Yield Information System to enhance drought monitoring and forecasting in Lower Mekong region Asian Disaster Preparedness Center/SERVIR-Mekong 2 Anticipated Results Improved capacity
Flood Inundation Mapping under different climate change scenarios in the upper Indus River Basin, Pakistan
 Flood Inundation Mapping under different climate change scenarios in the upper Indus River Basin, Pakistan Sohaib Baig (doctoral student) 16 November 2017 Disaster Prevention Research Institute 1 Kyoto
Uncertainty in the SWAT Model Simulations due to Different Spatial Resolution of Gridded Precipitation Data
 Uncertainty in the SWAT Model Simulations due to Different Spatial Resolution of Gridded Precipitation Data Vamsi Krishna Vema 1, Jobin Thomas 2, Jayaprathiga Mahalingam 1, P. Athira 4, Cicily Kurian 1,
Water Supply Conditions and Outlook June 4, 2018
 Water Supply Conditions and Outlook June 4, 2018 Flow Forecasting & Operations Planning Water Security Agency Overview Water supply conditions across Saskatchewan are generally good with most reservoir
Climatography of the United States No
 Climate Division: AK 5 NWS Call Sign: ANC Month (1) Min (2) Month(1) Extremes Lowest (2) Temperature ( F) Lowest Month(1) Degree s (1) Base Temp 65 Heating Cooling 90 Number of s (3) Jan 22.2 9.3 15.8
4. THE HBV MODEL APPLICATION TO THE KASARI CATCHMENT
 Application of HBV model to the Kasari River, 1994 Page 1 of 6 Application of the HBV model to the Kasari river for flow modulation of catchments characterised by specific underlying features by R. Vedom,
Water Management for Environmental Restoration Flows In the Big Bend reach, Rio Grande Rio Bravo
 University of California, Davis Department of Land, Air and Water Resources Water Management for Environmental Restoration Flows In the Big Bend reach, Rio Grande Rio Bravo 46 th Annual Meeting 8 9 March,
Colorado s 2003 Moisture Outlook
 Colorado s 2003 Moisture Outlook Nolan Doesken and Roger Pielke, Sr. Colorado Climate Center Prepared by Tara Green and Odie Bliss http://climate.atmos.colostate.edu How we got into this drought! Fort
The Colorado Drought of 2002 in Perspective
 The Colorado Drought of 2002 in Perspective Colorado Climate Center Nolan Doesken and Roger Pielke, Sr. Prepared by Tara Green and Odie Bliss http://climate.atmos.colostate.edu Known Characteristics of
Faisal S. Syed, Shahbaz M.,Nadia R.,Siraj I. K., M. Adnan Abid, M. Ashfaq, F. Giorgi, J. Pal, X. Bi
 ICTP NCP International Conference on Global Change 15-19 November, 2006, Islamabad Climate Change Studies over South Asia Region Using Regional Climate Model RegCM3 (Preliminary Results) Faisal S. Syed,
Prairie Climate Centre Prairie Climate Atlas. Visualizing Climate Change Projections for the Canadian Prairie Provinces
 Prairie Climate Centre Prairie Climate Atlas Visualizing Climate Change Projections for the Canadian Prairie Provinces Acknowledgements About Us Dr. Danny Blair Dr. Ian Mauro Ryan Smith, MSc Dr. Hank Venema
FORECAST-BASED OPERATIONS AT FOLSOM DAM AND LAKE
 FORECAST-BASED OPERATIONS AT FOLSOM DAM AND LAKE 255 237 237 237 217 217 217 200 200 200 0 163 131 Bridging the Gap163Conference 255 0 132 255 0 163 122 The Dana on Mission Bay San Diego, CA January 28,
Using MODIS imagery to validate the spatial representation of snow cover extent obtained from SWAT in a data-scarce Chilean Andean watershed
 Using MODIS imagery to validate the spatial representation of snow cover extent obtained from SWAT in a data-scarce Chilean Andean watershed Alejandra Stehr 1, Oscar Link 2, Mauricio Aguayo 1 1 Centro
The Climate of Oregon Climate Zone 5 High Plateau
 105 E55 Unbound issue i". 9 13oes not circulate CZe Special Report 917 May 1993 The Climate of Oregon Climate Zone 5 Property of OREGON STATE UNIVERSITY Library Serials Corvallis, OR 97331-4503 Agricultural
Spatiotemporal variations of alpine climate, snow cover and phenology
 Spatiotemporal variations of alpine climate, snow cover and phenology S. Asam, M. Callegari, M. Matiu, G. Fiore, L. De Gregorio, A. Jacob, A. Menzel, C. Notarnicola, M. Zebisch Asam et al., Spatiotemporal
Recovery Analysis Methods and Data Requirements Study
 Elevation Recovery Analysis Methods and Data Requirements Study Update to NTB Phase II Local Technical Peer Review Group December 3, 2003 Time 1 Schedule for Pumpage Reductions 180 160 140 120 158 121
The 2 nd Annual Gobeshona Conference Future Changes of Flash Flood in the North East Region of Bangladesh using HEC-HMS Modeling
 The 2 nd Annual Gobeshona Conference 2016 Future Changes of Flash Flood in the North East Region of Bangladesh using HEC-HMS ing By- Shammi Haque 1*, Mutasim Billah 1, Afiya Narzis 2, A.K.M. Saiful Islam
Current and Future Plans. R. Srinivasan
 Current and Future Plans R. Srinivasan Contents 1 The ArcSWAT Interface 2 VizSWAT: Output Visualization 3 User online support 4 MapWindows SWAT interface 5 ArcGIS SWAT/APEX interfaces 6 Radar Rainfall
MODULE 8 LECTURE NOTES 2 REMOTE SENSING APPLICATIONS IN RAINFALL-RUNOFF MODELLING
 MODULE 8 LECTURE NOTES 2 REMOTE SENSING APPLICATIONS IN RAINFALL-RUNOFF MODELLING 1. Introduction The most common application of the remote sensing techniques in the rainfall-runoff studies is the estimation
Simulation of sedimentation rates using the SWAT model A case study of the Tarbela Dam, Upper Indus Basin
 Simulation of sedimentation rates using the SWAT model A case study of the Tarbela Dam, Upper Indus Basin Ahammad, H. I 1., Crosato A 2,3., Maskey, S 2., Masih, I 2,*, McClain, M 2. 1 Punjab Irrigation
NRC Workshop Probabilistic Flood Hazard Assessment (PFHA) Jan 29-31, Mel Schaefer Ph.D. P.E. MGS Engineering Consultants, Inc.
 Jan 29-31, Mel Schaefer Ph.D. P.E. MGS Engineering Consultants, Inc.") Stochastic Event Flood Model (SEFM) Stochastic Modeling of Extreme Floods A Hydrological Tool for Analysis of Extreme Floods Mel Schaefer Ph.D. P.E. MGS Engineering Consultants, Inc. Olympia, WA NRC Workshop
Stochastic Event Flood Model (SEFM) Stochastic Modeling of Extreme Floods A Hydrological Tool for Analysis of Extreme Floods Mel Schaefer Ph.D. P.E. MGS Engineering Consultants, Inc. Olympia, WA NRC Workshop
Raktim Haldar Research Scholar Department of Civil Engineering Indian Institute of Technology, Delhi
 Raktim Haldar Research Scholar Department of Civil Engineering Indian Institute of Technology, Delhi Issues to be addressed Introduction to the Vembanad Lake and surrounding scenario of development Anthropogenic
MARMOT CREEK BASIN: MANAGING FORESTS FOR WATER
 MARMOT CREEK BASIN: MANAGING FORESTS FOR WATER CABIN AND TWIN CREEK EXPERIMENTS 1962-1987 MARMOT CREEK SUBBASINS Subbasin Drainage Treatment Area (ha) (completion date) Cabin Creek 212 (50%)* Commercial
 Characteristics of multi-annual variation of precipitation in areas particularly exposed to extreme phenomena. Part 2. The upper and middle Oder river basin Bernard Twaróg 1,* 1 Faculty of Environmental
A Review of the 2007 Water Year in Colorado
 A Review of the 2007 Water Year in Colorado Nolan Doesken Colorado Climate Center, CSU Mike Gillespie Snow Survey Division, USDA, NRCS Presented at the 28 th Annual AGU Hydrology Days, March 26, 2008,
Hydrological change in the. regions of Central Asia
 Hydrological change in the mountainous and downstream regions of Central Asia Alexander I. Shiklomanov Water Systems Analysis Group University of New Hampshire International Workshop on the Northern Eurasia
Soil Erosion Calculation using Remote Sensing and GIS in Río Grande de Arecibo Watershed, Puerto Rico
 Soil Erosion Calculation using Remote Sensing and GIS in Río Grande de Arecibo Watershed, Puerto Rico Alejandra M. Rojas González Department of Civil Engineering University of Puerto Rico at Mayaguez.
CFCAS project: Assessment of Water Resources Risk and Vulnerability to Changing Climatic Conditions. Project Report II.
 CFCAS project: Assessment of Water Resources Risk and Vulnerability to Changing Climatic Conditions Project Report II. January 2004 Prepared by and CFCAS Project Team: University of Western Ontario Slobodan
PRELIMINARY ASSESSMENT OF SURFACE WATER RESOURCES - A STUDY FROM DEDURU OYA BASIN OF SRI LANKA
 PRELIMINARY ASSESSMENT OF SURFACE WATER RESOURCES - A STUDY FROM DEDURU OYA BASIN OF SRI LANKA THUSHARA NAVODANI WICKRAMAARACHCHI Hydrologist, Water Resources Secretariat of Sri Lanka, Room 2-125, BMICH,
Technical Note: Hydrology of the Lake Chilwa wetland, Malawi
 Technical Note: Hydrology of the Lake Chilwa wetland, Malawi Matthew McCartney June 27 Description Lake Chilwa is located in the Southern region of Malawi on the country s eastern boarder with Mozambique
AN OVERVIEW OF ENSEMBLE STREAMFLOW PREDICTION STUDIES IN KOREA
 AN OVERVIEW OF ENSEMBLE STREAMFLOW PREDICTION STUDIES IN KOREA DAE-IL JEONG, YOUNG-OH KIM School of Civil, Urban & Geosystems Engineering, Seoul National University, San 56-1, Sillim-dong, Gwanak-gu, Seoul,
9. PROBABLE MAXIMUM PRECIPITATION AND PROBABLE MAXIMUM FLOOD
 9. PROBABLE MAXIMUM PRECIPITATION AND PROBABLE MAXIMUM FLOOD 9.1. Introduction Due to the size of Watana Dam and the economic importance of the Project to the Railbelt, the Probable Maximum Flood (PMF)
Appendix A Calibration Memos
 Appendix A Calibration Memos University of Washington Department of Civil and Environmental Engineering TO: Joe Dvorak FROM: Margaret Hahn and Richard Palmer RE: DVSVM Calibration DATE: June 28, 21 This
Appendix E Plots from the Evaluation of the CNRFC Operational Hydrologic Model
 Appendix E Plots from the Evaluation of the CNRFC Operational Hydrologic Model APE-1 2 Trinity Lake Inflow 2 1 Simulated 1 1 1 2 2 Observed Figure APE-1. Simulated daily flow versus observed (FNF) flow
WIND EFFECTS ON CHEMICAL SPILL IN ST ANDREW BAY SYSTEM
 WIND EFFECTS ON CHEMICAL SPILL IN ST ANDREW BAY SYSTEM PETER C. CHU, PATRICE PAULY Naval Postgraduate School, Monterey, CA93943 STEVEN D. HAEGER Naval Oceanographic Office, Stennis Space Center MATHEW
Science Standard 1: Students analyze monthly precipitation and temperature records, displayed in bar charts, collected in metric units (mm).
.") Title: Precipitation Patterns across the Globe NSF GK-12 Fellow: Terry Legg Type of Lesson: STEM Grade Level(s): 4 th - 7 th grade This activity can be tailored to older, more advanced students by having
Title: Precipitation Patterns across the Globe NSF GK-12 Fellow: Terry Legg Type of Lesson: STEM Grade Level(s): 4 th - 7 th grade This activity can be tailored to older, more advanced students by having
Appendix C. AMEC Evaluation of Zuni PPIW. Appendix C. Page C-1 of 34
 AMEC s Independent Estimate of PPIW Crop Water Use Using the ASCE Standardized Reference Evapotranspiration via Gridded Meteorological Data, and Estimation of Crop Coefficients, and Net Annual Diversions
Analysis of Radar-Rainfall Uncertainties and effects on Hydrologic Applications. Emad Habib, Ph.D., P.E. University of Louisiana at Lafayette
 Analysis of Radar-Rainfall Uncertainties and effects on Hydrologic Applications Emad Habib, Ph.D., P.E. University of Louisiana at Lafayette Motivation Rainfall is a process with significant variability
Application of SWAT for the modelling of sediment yield at Pong reservoir, India
 Application of SWAT for the modelling of sediment yield at Pong reservoir, India A. R. Senthil kumar Tanmoyee Bhattacharya Suhas D Khobragade Manohar Arora National Institute of Hydrology Roorkee-247667,