Mapping Invasive Plant Species in the Sacramento- San Joaquin Delta Region Using Hyperspectral Imagery
|
|
|
- Meredith Patterson
- 6 years ago
- Views:
Transcription
 Dr. Emma C. Underwood, Melinda J. Mulitsch, Dr. Jonathan A.")
1 Mapping Invasive Plant Species in the Sacramento- San Joaquin Delta Region Using Hyperspectral Imagery Agreement Number: Marcia Carlock Aquatic Weed Control Department of Boating and Waterways 2000 Evergreen Street, Suite 100 Sacramento, California Submitted by: Dr. Susan L. Ustin (Principal Investigator) Dr. Emma C. Underwood, Melinda J. Mulitsch, Dr. Jonathan A. Greenberg, Shawn C. Kefauver, Dr. Michael L. Whiting, Carlos A. Rueda, Carlos M. Ramirez, George J. Scheer, and Lawrence F. Ross Center for Spatial Technologies and Remote Sensing (CSTARS) California Space Institute Center of Excellence (CalSpace) University of California, Davis
2 INTRODUCTION The spread of invasive plant species poses a significant threat to biological diversity and ecosystem functioning (Mooney and Cleland 2001, Pimm and Gilpin 1989). Considering the threats to biological diversity, invasive plants have longer lasting effects than other anthropogenic activities (Bossard et al. 2000). Even after invasive plants are no longer introduced, the original populations can continue to spread and invade new areas. Compared to terrestrial weeds, invasive aquatic vascular plants are more difficult to control and manage because they grow submerged in water, float on the water surface, or have inundated basal portions with emergent foliage and upper canopy. Of particular concern in the Sacramento-San Joaquin Delta Region are Brazilian waterweed (Egeria densa) and water hyacinth (Eichhornia crassipes), which are well known for their ability to alter physical and biological functions of aquatic systems (Bossard et al. 2000). A fundamental need for invasive aquatic plant management is to develop a cost-effective, large scale monitoring method (Williams and Hunt 2002, Johnson 1999). As a non-intrusive and repeatable mapping method, both aerial and satellite imagery have been applied to mapping invasive vegetation in various aquatic environments (Ackleson and Klemas 1987, Lehmann et al. 1997, Lehmann and Lachavanne 1997, Porter et al. 1997, Williams and Lyon 1997, Zhang 1998, Valta-Hulkkone et al. 2003, Sawaya et al. 2003, Ward et al. 2003). However, these types of data typically provide limited ability to discriminate between aquatic species due to either low spectral resolution, low spatial resolution, or both. In recent years hyperspectral remote sensing has shown promising results for species level mapping which has opened a new avenue for map invasive aquatic plants (Penuelas et al. 1993, Zhang et al. 1997, Spanglet et al. 1998, Silvestri et al. 2002, Schmidt and Skidmore 2003). The use of remotely sensed data to map invasive aquatic and upland weeds in the Sacramento-San Joaquin Delta Region was tested in a pilot project in the summer and fall of 2003 (Mulitsch and Ustin, 2003). This project successfully provided accurate, spatially explicit information about the distribution and infestation levels of invasive weeds within the test area of the Delta Region. The results presented here build upon the methodology developed in the pilot project and extends it to the entire Sacramento-San Joaquin Delta Region, to provide the California Department of Boating and Waterways with a comprehensive baseline for documenting the distribution and extent of invasive species over the entire Sacramento-San Joaquin Delta Region as well as a rapid and valuable technique for making informed decisions relevant to managing the extent and spread of invasive species. The goals of this study were to: 1) acquire and process airborne remotely sensed hyperspectral imagery for the Sacramento-San Joaquin Delta Region; 2) conduct field surveys in support of the overflights; and 3) map the distribution and abundance of selected invasive species within the Sacramento-San Joaquin Delta Region. Description of Target Invasive Species In the Sacramento-San Joaquin Delta Region there are a number of highly invasive plant species which have become particularly problematic in recent years. Two species in particular are of concern to the Department of Boating and Waterways (CDBW) and the California Department of Food and Agriculture (CDFA): Brazilian waterweed and water hyacinth. 1
3 Brazilian waterweed (Egeria densa) Brazilian waterweed forms thick mats of long, intertwining, multi-branched stems below the water surface. It significantly slows water flow in channels, which interferes with irrigation projects, hydroelectric utilities, and urban water supplies. Dense mats of underwater Brazilian waterweed can interfere with recreational and commercial activities within the Delta, such as boating, swimming and fishing (Bossard et al. 2000). Water hyacinth (Eichhornia crassipes) Dense areas of water hyacinth can quickly dominate waterways because of rapid leaf production, fragmentation of daughter plants, and copious seed production and germination (Bossard et al. 2000, Penfound and Earle 1948). Water hyacinth degrades habitat for waterfowl by reducing open water area used for resting. When it decomposes, the water becomes unsuitable for drinking, which further impacts the wildlife in the Delta. As with other invasive species, it quickly displaces the native aquatic plants used for food or shelter by wildlife species. The effects of this species on humans includes the obstruction of navigable waterways, impeding drainage, fouling hydroelectric generators and water pumps, and blocking irrigation channels (Bossard et al. 2000). 2
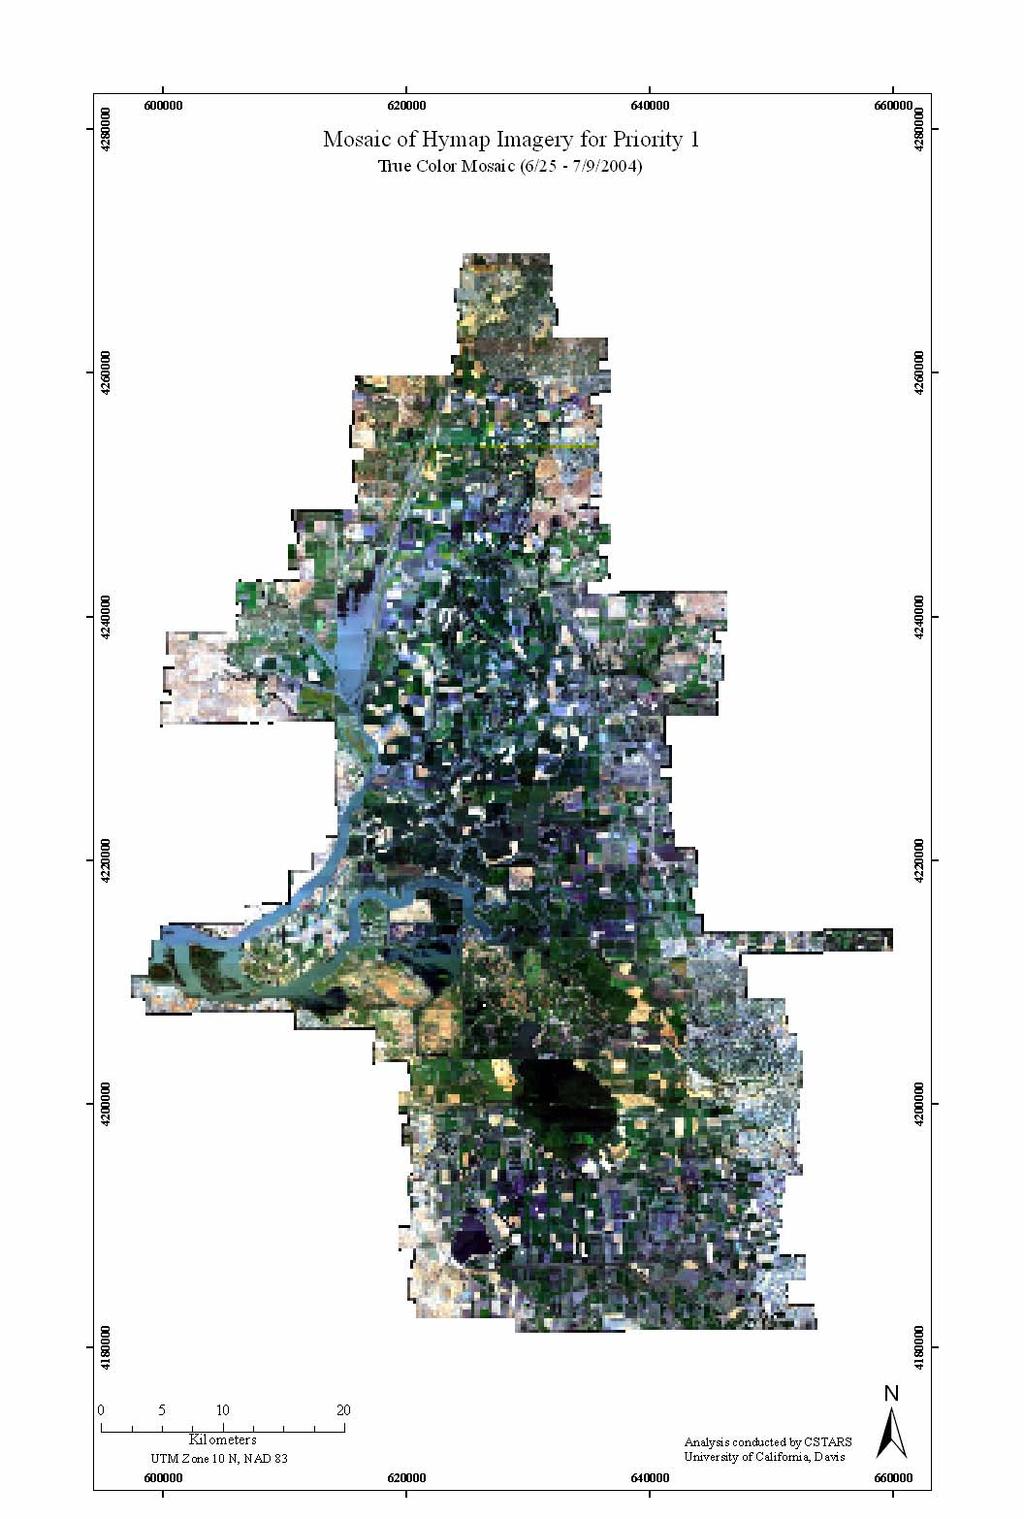
4 METHODS Study Area Description The Sacramento-San Joaquin Delta spans approximately 3400 km 2 (~840,000 acres) from Yolo County to Fresno County in California s Central Valley. Water bodies within the proposed project boundary include the Delta estuary and the Merced, San Joaquin, Sacramento, and Tuolumne Rivers. Because of the Delta s proximity to San Francisco Bay, there is a strong marine influence in the estuary creating a unique and diverse ecosystem. For the purposes of our analyses we divided the study site into two areas consisting of a northern area, referred to as Priority 1 (2,139 km 2, Figure 1), and Priority 2 (1,252 km 2, Figure 2) in the southern section. Through the acquisition of airborne hyperspectral imagery and the collection of field data the objectives of this study were to; (1) map the two target species across the spatial extent of the Delta, (2) within a selected number of priority sites identified by CDBW (Figure 3) map and calculate the area of infestation of the two target species, and (3) investigate the potential for discriminating Brazilian waterweed from other submerged aquatic vegetation (SAV) using hyperspectral image analysis techniques. The following section provides information on the field data collection and on the acquisition of the hyperspectral imagery. We then provide details on a number of the processing steps that are necessary to prepare the imagery before classification, such as improving the spatial accuracy of the images and the creation of masks to limit our extent of analysis within the study site, followed by a description of the techniques used to identify and map the target species. All image processing and mapping work was conducted using ENVI software (version 4, Research Systems Inc., Boulder, Colorado) and ArcMap (version 9, ESRI, Redland, California). The processing and results presented in this report refer to the Priority 1 study area. 3
5 Figure1 4
6 Figure 2 5

7 Figure 3 6
8 Fieldwork Description Researchers from the Center for Spatial Technology and Remote Sensing (CSTARS) and California Space Institute (CalSpace) Center of Excellence, together with boatmen and botanists from CDFA conducted fieldwork between 24 June and 2 July 2004 to coincide with image acquisition. The field crew was divided into three teams that launched at Brannan Island, Paradise Point and Discovery Bay. Each team was composed of two researchers per airboat and motor boat, who collected information on six target species at both the CDBW priority sites and the surrounding river channels (Figure 4). The six primary species were; Brazilian waterweed, water hyacinth, pennywort (Hydrocotyle ranunculoides), water primrose (Ludwigia peploides), tule (Scirpus acutus), and cattail (Typha latifolia). A second tier of species included other submerged aquatic species, riparian species, and invasive levee species such as pepperweed (Lepidium latifolium) and purple loosestrife (Lythrum salicania) where present (Appendix, Table 1). The following information was acquired when patches of the target weeds were encountered: Global Positioning System (GPS) reading of the patch location, the percent cover of the target species, percent cover of co-occuring species, approximate dimensions of the patch, and presence of flowers (for Brazilian waterweed or water hyacinth); Digital photos of the weed patch (vertically down and oblique) linked to the GPS points via the date and time stamp; GPS points taken of uninfested water and a Secchi depth reading; and One plant sample of each of the target species each day to ensure correct identification. The majority of GPS readings were taken from large (> 1 pixel or 3 m x 3 m) homogenous patches (>75% cover) of the target species, with a minimum separation distance of 20 m. In many cases, for example, there were difficulties in getting the motorboat into a patch of weeds, so GPS points were recorded by entering distance and direction information from the actual GPS position recorded on the boat. Image Acquisition Airborne remotely sensed hyperspectral imagery for the Sacramento-San Joaquin Delta Region was acquired using the HyMap airborne sensor (Cocks, 1998) between 25 June and 7 July 2004 (Figure 5). The dates of image acquisition were selected to precede the control efforts by the CDBW and to coincide with peak flowering of Brazilian waterweed. HyMap collects data over 126 spectral bands ranging from 0.45 to 2.5 µm (bandwidth nm). The spectral range is collected using four detectors in the visible (VIS, µm), near-infrared (NIR, µm), shortwave-infrared (SWIR1, µm and SWIR2, µm). Hymap has an instantaneous field-of-view of 2.0 mrad (across track) and 2.5 mrad (along track) and was flown at an altitude of 1,500 m to produce pixels ~3 m on a side. The field-of-view of the sensor is 512 pixels, producing a swath of approximately 1.5 km across track ( In total, 139 images (or flightlines) were collected, 65 in the Priority 1 region (Figure 1) and 7

9 Figure 4 8

10 Figure 5 9
11 74 in the Priority 2 region (Figure 2). The data was distributed in the Geographic Lookup Table file (GLT) compressed format, and the uncompressed flightline images ranged in size from 0.36 GB to 44 GB. The total image dataset as delivered was 530 GB. HyMap images were converted to apparent surface reflectance using HyCorr software. The processing consists of two levels, the simpler level is essentially compatible with ATREM3 (Atmospheric Removal program) processing. This is followed by an addition level of spectral enhancement using an EFFORT polishing pass to remove systematic ATREM3 artifact errors. The derived surface reflectance image was scaled by 10,000. Preliminary geocorrection of the flightlines was performed by HyVista with proprietary software that used sensor position and orientation data collected simultaneously with the image to calculate the position of each pixel in the image. In addition to the hyperspectral imagery, CSTARS received a set of 1-foot color orthophotographs acquired in May 2003 by the Department of Water Resources covering the majority of Priority 1. Improving the Spatial Accuracy of the Imagery Comparing the Hymap imagery to the 1-foot color photographs, the image pixels were found to be 3-10 m from their true spatial location. To improve the spatial accuracy of the flightlines, we collected geographic correction points (GCP s) between the Hymap imagery and the 1-foot orthophotos, and warped each flightline of Priority 1. GCP s were spaced evenly throughout the image to ensure a more accurate geocorrection and registration of the warp image. The accuracy of these tie points was assessed by the Root Mean Square Error (RMSE), which is a statistical assessment of the accuracy of each GCP in relation to all others. Error values less than 1.5 (i.e., within the 1.5 m of the orthophoto positions) were considered acceptable (Appendix, Table 2). Visual assessment of the Hymap images after registration was performed to validate the efficacy of our techniques (Figure 6). Efficient Extraction of Pixel Information from Field Data Given the large volume of data acquired in this study it was necessary for us to develop specific tools for handling and analyzing the imagery in addition to those available in standard image processing software packages. As part of this study we developed a computer algorithm for fast, selective pixel extraction from remotely sensed data called STARSPAN. It works on two basic inputs; 1) raster data one or multiple raster files from which the pixel data will be extracted, and 2) vector data a file defining a set of features to be extracted from the raster data, such as an ArcMap shapefile. Extracted pixel data are stored in CSV files, a common text-based format that can be imported into standard applications for further analysis. Other functionalities of STARSPAN include: the generation of band specific statistics for specified features, the generation of paired pixel band values for subsequent calculation of calibration coefficients, update options, and generation of output data in ENVI formats. For more information, including installation instructions and a user manual, please visit: 10

12 Figure 6 11
13 This tool allowed us to rapidly test a variety of classification techniques without having to process each of the full flightlines. Generating a Water Mask To limit the image analysis and classification to specific areas within the Priority 1, we created a mask, or region to be analyzed, for just the water courses. Masking to include only the lakes, channels, and rivers improves the species determination by limiting the range of spectra analyzed and eliminating similar spectral classes that would falsely identify vegetation outside the waterways. The location and size was used to select the channels and ditches. As a general rule, channels and ditches with widths greater than 30 m (98 feet) were included, however, large water bodies that were not connected to the main channels, such as community lakes, were not included. At the extreme east and west edges of Priority 1, frequently flooded pastures and other wetlands are extensive, but cannot be navigated, even with a canoe, and were therefore, not included. The mask was digitized using the US Bureau of Reclamation GIS layer of waterways Levee_24_CA, which provided a good quality line map containing the levees digitized from 1:24,000 maps. In ArcGIS, the lines were edited over a color infrared composite of the flightline images, since the levee lines fit the water boundary shape, but extended too far from the water s edge. The lines were shifted, dissected, and additional lines digitized to fit the water boundary more tightly. For most of the levee channels, the lines were placed at the color change observed in the imagery, possibly due to the rock rip-rap and soil, slightly away from the water on the levee. In other areas, the distance from the water body was approximated based on tonal changes that expressed moist soil or vigorous vegetation from available open water in summer. After visually inspecting the digitized boundary over all the images, the polygon map was converted to a tiff image to generate the mask used in the image processing software. One additional water mask was created for the Jones Tract area owing to complications in classifying this large expanse of shallow water with detectable vegetation (i.e., fields) below the surface. Classification Methodology for Detecting Target Species Based on the successful performance of a technique called Spectral Mixture Analysis (SMA) in the pilot study (Mulitsch and Ustin, 2003), the current study also utilized this technique. SMA is particularly appropriate for hyperspectral imagery, and has been applied to the decomposition of mixed pixels in remotely sensed data for over 30 years (Hortwitz et al. 1975). SMA assumes that each pixel spectrum is a linear combination of spectrally distinct components, called endmembers. SMA employs least squares fitting to derive estimates of fractional composition, which are generally displayed in images as linear stretch gray levels to estimate abundances of endmembers. Each fractional image provides a subpixel estimate of both the relative endmember abundances as well as the spatial distribution of the endmember (Smith et al. 1990, Adams et al. 1995). The root mean square error (RMSE) is calculated to estimate the goodness of fit of an endmember model for mixed pixels. The portion of RMSE image having high values indicates a need to add one or more endmembers or change endmembers to improve the model. SMA has proven to be a robust technique and used to identify dynamic ecosystem changes (Adams et al. 1993, Roberts et al. 1997, Ustin et al. 1996, 1998), to map the distribution 12
14 of wetland species (Zhang et al. 1997, Sanderson et al. 1998), and for environmental monitoring (Riano et al. 2002, Small 2001, 2002, Elmore et al. 2000). Based on an inspection of the endmembers of the target species from locations identified in fieldwork, we combined pennywort and water primrose, and tule and cattail, owing to the similarity of their spectral reflectances. Ultimately, we used six image endmembers to perform the SMA; Brazilian waterweed, water hyacinth, pennywort/water primrose, tule/cattail, water, and turbid water to achieve an optimal unmixed image (Figure 7). Figure 7. Representative spectra for the identified target species. Classification of Target Species at the Flightline Scale The classification of each flightline was performed using a manual decision tree. A series of thresholds were developed to isolate Brazilian waterweed and water hyacinth pixels. For Brazilian waterweed (Figure 8) the first step applied the water mask and ask whether the pixel was within the river channel, if yes, the second step assessed whether the pixel had a value greater than the identified threshold for Brazilian waterweed in the spectrally unmixed image. These thresholds were determined on a 13
15 Decision Tree Used to Classify Brazilian waterweed (Egeria densa) from Hymap Hyperspectral Imagery N Within river boundaries? Not Brazilian waterweed Y N LSU Brazilian waterweed value > Not Brazilian waterweed Y N IR ( µm) reflectance > 12.5%? Not Brazilian waterweed Y N NDVI < 0.3? Not Brazilian waterweed Y Brazilian waterweed Figure 8 14
16 Decision Tree Used to Classify Water Hyacinth (Eichhornia crassipes) from Hymap Hyperspectral Imagery N Within river boundaries? Not hyacinth Y N IR ( µm) reflectance >= 12.5%? Not hyacinth Y N NDVI >= 0.3? Not hyacinth Y N Hyacinth maximum LSU value Not hyacinth Y Hyacinth Figure 9 15
17 flightline by flightline basis using a combination of visual interpretation and statistical exploration of the field data. If the pixel value was greater than the threshold, the third step determined if the threshold value for the µm infrared band for that pixel was greater than 12.5%. The threshold was again identified through visual inspection of the imagery combined with information about the conditions from the field GPS points. The final step sought to distinguish Brazilian waterweed from other emerged vegetation based on selecting pixels with a Normalized Difference Vegetation Index (NDVI) <0.3. We refer throughout this report to classifying Brazilian waterweed, since 80% or more of the SAV in the Sacramento-San Joaquin Delta is Brazilian waterweed (Julie Owens, CDBW, personnel communication), however, the mapping effort likely captures other submerged aquatic vegetation. A different decision tree approach was utilized for classifying water hyacinth (Figure 9). In contrast to Brazilian waterweed, water hyacinth was characterized as having a high infrared reflectance (>= 12.5% in band µm) and high NDVI (>=0.3). The high values occur because of strong absorption in the red spectral region and reflection in the infrared by the plant cells of water hyacinth. Water hyacinth had the highest endmember value among the two other major emergent vegetation classes (pennywort/water primrose and tule/cattail). The thresholds for each target species were selected for each flightline based on our interpretation of image characteristics and the field data. Consequently, for this preliminary report, we restricted our classification to the 32 flightlines that contained the GPS points, with flightline number 23 as our northern boundary and flightline number 55 as the southern boundary. Classification of Target Species at the Priority Site Scale Based on recommendations from the Department of Boating and Waterways, six priority sites (three containing Brazilian waterweed and water hyacinth and three containing only water hyacinth) were selected for a finer-scale classification. One additional site, Seven Mile Slough, was classified to investigate the ability to distinguish Brazilian waterweed from different submerged aquatic species. Classifying the target species at this scale involved a slightly different method than the decision tree approach used for the full flightlines. At the priority site scale, issues such as tidal effects and differences in water appearance were minimized, so specific endmembers for Brazilian waterweed and water hyacinth could be selected and iteratively fine-tuned after each classification was performed. SMA, as with other image processing routines, produces rule images. These images have the same x, y configuration as the original images, but contain a new band for each species class. The values within each pixel are the numeric quality of the fit of the pixel spectrum to the spectral representative for the species. Generating rule images allows classing at various thresholds, or classifications performed at a later time, without the computing costs of reanalysis of the mixture modeling. In this case, pixels were classed based on the dominant species, as determined by the comparative fit among the rule bands for the species classes. For each of the six priority sites the linear unmixed image was converted from the rule image to a classed image based on the dominant species. The sum of the pixels identified for each species, or mixture, was multiplied by the 9 m 2 per pixel to determine the area of the species. The acres of the species or mixtures are derived by converting the square meter values. Assigning tide and date information 16
18 Based on our field observations of the effect of varying tide heights on submerged aquatic vegetation, we tagged accurate tide information to each flightline, to each priority site, and to the field GPS data. Ultimately, this information may aid in explaining inconsistencies in vegetation mapping accuracy. Information for tide monitoring stations throughout the Delta were acquired through the WWW Tide and Current Predictor at and both of which utilize the accurate XTide software to predict tide height information, forward and backward in time. Further information on the XTide predictor is available at as well as a downloadable version of the software, with a public license. The tide predictions are based on accurately assessing harmonic constants from a large number of tide stations in the Delta. Linking the ArcMap display of tide stations in the Delta to a database of the html interfaces for XTide proved to be a quick method for accessing this information at specific locations (Figure 10). 17

19 Combining Hymap Flightlines with Tide Data Figure 10 18
20 RESULTS Fieldwork Data All GPS data files were differentially corrected using Pathfinder Office (version 3, Trimble Navigation Limited, Sunnyvale, California) and exported as ArcMap shapefiles (in the Universal Transverse Mercator, zone 10, North American Datum 1983 projection). The majority of the field work was collected in the Priority 1 region (2,103 GPS points), although one team consisting of an airboat and two researchers spent three days collecting data on the Merced and Tuolumne Rivers in Priority 2 (261 GPS points). The GPS points were screened in three ways. First, the attributes of the GPS points were checked and edited (e.g., points without an associated percent cover were deleted). Second, since many of the positions were recorded with a distance and direction offset from the boat, the GPS points were overlain on the imagery to ensure that all submerged and emerged vegetation fell within the water channels and all levee species aligned on the banks of the channels. Third, to further refine the field data we viewed it in hyperspectral space by extracting the 126 bands for each GPS point using STARSPAN. We performed a multivariate outlier analysis for all the GPS points by species, using the 117 useful bands of hyperspectral imagery associated with each point. This procedure estimates the mean, standard deviation and correlation matrix of the data (jackknife technique) and extreme outliers were then identified and removed. Polygons acquired in the field were not screened, but serve to provide additional reference data for assessing the validation of the classification. Over 200 GPS points from Priority 1 were discarded through this screening process (Appendix, Table 1). Of the submerged aquatic species, Brazilian waterweed had the greatest number of GPS points acquired (432 GPS points). In addition, a substantial number of other submerged aquatic species, such as watermilfoil (Myriophyllum spicatum), coontail (Ceratophyllum demersum), cabomba (Cabomba caroliniana), curly leaf pondweed (Potamogeton crispus), and American pondweed (Potamogeton nodosus) were acquired, which will be utilized to test the ability of distinguishing Brazilian waterweed from the other submerged species. Of the emergent species, water hyacinth had 262 GPS points acquired, with slightly fewer points for pennywort (201) and less for water primrose (71). The main levee species recorded were tule (259 GPS points) and varying numbers for other levee species. Twelve pepperweed points and no purple loosestrife points were acquired in Priority 1. Classification of Target Species at the Flightline Scale A decision tree approach was used for classifying Brazilian waterweed and water hyacinth which involved assessing thresholds for each species from; spectrally unmixed images, one infrared waveband, and an NDVI value. An accuracy assessment of the two target species between flightlines 23 and 55 showed that 29% of the field collected Brazilian waterweed locations were correctly identified by the classification and 65% of the water hyacinth points were correctly classified (Figure 11). The most notable concentration of Brazilian waterweed is in the Franks Tract area along the south-western 19

21 Figure 11 20
22 side and at Big Break to the west of this area. The inset map of Figure 11 also clearly shows the concentration of this species around Rhode Island and Venice Cut, and further to the east along Disappointment Slough. We feel most confident about the results acquired in the western and central portions of the study area, while the slower moving waterways and sloughs in the eastern side of the study site presented significant challenges for mapping Brazilian waterweed (see Discussion). The difficulties encountered in mapping at this coarse scale and the resultant accuracy are in contrast to results from mapping Brazilian waterweed at the finer scale of the priority sites which, according to field data and observations from fieldwork, appear to be much more accurate. Although the overall mapping accuracy for Brazilian waterweed is relatively low, we note that the results show distinct patterns of infestation which provide a useful guide for management decisions relating to control efforts and serves as a baseline dataset to monitor future expansion. The accuracy of classifying water hyacinth over these 32 flightlines is much higher. The areas of infestation are much smaller in size than those of Brazilian waterweed often concentrated in stable waters around islands, and thus they are difficult to decipher at the resolution of Figure 11. Classification of Target Species at the Priority Site Scale 1. Rhode Island Flown on Tidal height at time of over flight: ~1.4 ft Flightline 45b Rhode Island is a very sheltered site. Only one small channel opening provides access to the site from a channel on the western side. The outer areas of the site are dominated by emergent vegetation. Figures 12a-d shows the gray scale fraction images for all unmixed species. Areas that are bright white correspond to dense areas of the target species. In Figure 12a and 12b, tule/cattail is depicted as green dots, and pennywort/primrose as cyan dots at the outer edges of the site. A couple of areas of water hyacinth are located on the inside of Rhode Island, as seen in Figures 12c and 13. The yellow dots depict field locations of known water hyacinth, corresponding to the bright areas in the fractional image. To assess the accuracy of our classification we overlaid the field collected GPS points on the fractional image and calculated the number of GPS points that fell on pixels with a value >=0.5, i.e. where the target species composed the majority of the pixel. For water hyacinth three out four GPS points collected in the field were correctly mapped using SMA. Brazilian waterweed is highly prevalent in the sheltered areas of this site. As seen in Figures 12d and 13, the entire middle section of the site is mapped as Brazilian waterweed. The GPS points of this submerged weed, denoted by red dots, are located in bright white pixels, indicating that SMA successfully mapped Brazilian waterweed at this site. Seven out of nine Brazilian waterweed points were mapped correctly. The total acreage for the weeds at this site was 66.4 acres for Brazilian waterweed and 7.8 acres for water hyacinth (Table 1). 21
23 2. Venice Cut Flown on Tidal height at time of over flight: ~0.6 ft Flightline 42 Venice Cut is sheltered on three sides by emergent plants along the outer shoreline edges and the interior is dominated by SAV. Figures 14a and 14b are the gray scale fractional images with the target species water hyacinth and Brazilian waterweed in bright white pixels. Figure 15 shows this distribution overlaid on the true color mosaic. GPS field collected points, shown as red and yellow dots, are located in bright white pixels, indicating that SMA successfully mapped both the water hyacinth along the outer edges and SAV in the middle areas. All eighteen Brazilian waterweed points and five of seven water hyacinth points had values >=0.05 in their respective fractional images and were thus correctly identified. The total acreage for the weeds at this site was 72.5 acres for Brazilian waterweed and 5.9 acres for water hyacinth (Table 1). 3. Pixley Slough Flown on Tidal height at time of over flight: ~0.5 ft Flightline 42 Pixley Slough is composed of two narrow channels running west to east that are joined together by a strait. This site is located on the far eastern side of the Delta study area and characterized by riparian vegetation. As seen in Figures 16a and 17, Brazilian waterweed is very distinct along the upper channel and along the narrow straits to the east. This corresponds well with locations of the aquatic weeds that were collected in the field, seen as red dots on the gray scale image. Fourteen of sixteen Brazilian waterweed points fell onto pixels which had values of >=0.05 and were therefore mapped correctly. Brighter pixels of water hyacinth are located in the northern channel and along the levee banks of the southern channel (Figures 16b and 17). Mapped areas corresponded well with the GPS locations for the weed. Six of nine water hyacinth points overlaid with the pixels dominated by water hyacinth in the SMA fractional image. The total acreage for the weeds at this site was 16.5 acres for Brazilian waterweed and 3.7 acres for water hyacinth (Table 1). 4. Dutch Slough Flown on Tidal height at time of over flight: ~2.3 ft Flightline 45b Dutch Sough channel narrows into a very small area surrounded by riprap levees. As seen in Figures 18a and 19 the majority of the area is dominated by Brazilian waterweed, the southern section most heavily dominated as depicted in white pixels. All eight Brazilian waterweed field points overlaid correctly on the bright white pixels and thus with pixels dominated with that species in the SMA fractional image. Water hyacinth mats are seen in Figures 18b and 19 along the outer edges of Dutch Slough. Three of four water hyacinth points were mapped correctly. The total acreage for the weeds at this site was 22.7 acres for Brazilian waterweed and 1.0 acres for water hyacinth (Table 1). 22
24 5. Disappointment Slough Flown on Tidal height at time of over flight: ~0.5 ft Flightline 42 Disappointment Slough is a control site located in the eastern part of the Delta. In Figures 20a and 21, Brazilian waterweed is seen as bright white pixels in the curved channels of the slough. A couple of large water hyacinth mats can be seen in the eastern section of the slough (Figures 20b and 21). GPS points of the Brazilian waterweed and water hyacinth correspond with mapped areas of the weeds. All seven Brazilian waterweed GPS points were mapped correctly as were the two water hyacinth points. The total acreage for the weeds at this site was 70.8 acres for Brazilian waterweed and 4.5 acres for Water hyacinth (Table 1). 6. Latham Slough Flown on Tidal height at time of over flight: ~1.0 ft Flightline 45b Latham Slough is another control site. As seen in Figure 22a and 23, the waterways surrounding the five fingers of emergent vegetation are highly infested with the Brazilian waterweed. Mapped locations correspond with field collected GPS points. Nine of twelve Brazilian waterweed points were correct in that those pixels were classified as being dominated by Brazilian waterweed. The middle area is either less dominated by weeds or perhaps flooded to a greater depth. A large patch of water hyacinth is visible in Figures 22b and 23. A few smaller patches of water hyacinth are seen along the outer edges of the emergent vegetation. All five water hyacinth points overlaid correctly on pixels dominated by this species in the SMA fractional image. The patches of water hyacinth in the five fingers region were mixed with larger stands of tule and cattail. These water hyacinth mats are clearly identified among the stands of emergent vegetation in the fractional images. The total acreage for the weeds at this site was 20.1 acres for Brazilian waterweed and 53.6 acres for water hyacinth (Table 1). 7. Seven Mile Slough Flown on Tidal height at time of overflight ~1.9 ft Flightline 37 Seven Mile Slough, near Owl Harbor, was identified as a potential priority site in 2004 and was a priority site in This site was chosen to investigate whether other submerged aquatic vegetation can be differentiated from Brazilian waterweed. In addition to Brazilian waterweed, coontail, curly leaf pondweed, American pondweed, and watermilfoil were present at the site. American pondweed was spectrally distinct from Brazilian waterweed and the other submerged aquatic vegetation. Mats of Brazilian waterweed are seen in Figure 24a surrounding islands of tule and cattail. Three of four Brazilian waterweed points were correctly mapped in the SMA fractional images. In comparison to 2003, Brazilian waterweed was not the dominant submerged aquatic vegetation at the site, which is probably due to Diquat treatments conducted last year by CDBW. As seen in Figure 24b, one large patch of American pondweed can be seen in the middle of the image. Our GPS points collected in the field overlaid this bright white patch and verified that this 30 m x 30 m surface patch was American pondweed. We also distinguished coontail 23
25 from Brazilian waterweed. As seen in Figure 24c, the northwest area of the slough is very dense with coontail mats. This corresponds with field collected location data that overlaid the bright white pixels. Additional coontail mats are present along the northern levees in the slough. All eight coontail points were correctly mapped, i.e., coontail was the dominant species within the pixels. These preliminary results are encouraging and we will continue to investigate whether hyperspectral imagery can be used to detect other submerged aquatic vegetation from Brazilian waterweed at this and other sites in the Delta. 24
26 Table 1. Area of target species in six priority areas identified by California Department of Boating and Waterways. Total Area Water hyacinth Brazilian waterweed Tule / Cattail Priority Areas Acres Sq. Meters Acres Sq. Meters Extent (%) Acres Sq. Meters Extent (%) Acres Sq. Meters Extent (%) Disappointment Slough , , , , Dutch Slough , , , <0.1 Latham Slough , , , , Pixley Slough , , , , Rhode Island , , , , Venice Cut ,011, , , ,

27 Figure 12 26

28 Figure 13 27

29 Figure 14 28
30 Figure 15 29
31 Figure 16 30

32 Figure 17 31
33 Figure 18 32

34 Figure 19 33
35 Figure 20 34

36 Figure 21 35

37 Figure 22 36
38 Figure 23 37

39 Figure 24 38
40 DISCUSSION While the priority areas demonstrated that high accuracy classification is achievable, the variability in the spectra for the individual target species and water for the entire project area produced low accuracy for some species. In part, the lower accuracy was due to the broad scale of the project and the amount of imagery acquired. This project represents one of the largest airborne hyperspectral image acquisition efforts undertaken for vegetation mapping purposes. As a consequence, we encountered a number of issues that were not seen in the smaller area of 10 flightlines in the 2003 pilot project. A number of these issues are described below, followed by a discussion of potential steps to improve the accuracy of the mapping. Field work Protocol One of the difficulties encountered in this study stemmed from inaccuracies in the geographic positioning and species recording during the field data acquisition. The airboats were successful in driving on top of Brazilian waterweed and water hyacinth patches for accurate GPS positions, however, the motorboats were unable to enter patches of submerged vegetation without trapping weeds in the propellers. In these situations, the field crew recorded the GPS positions by estimating the distance and direction offset. Given inherent differences between observers, some GPS points may have been erroneously placed with the non-target species. The small ~3 m pixel size made precise positioning essential for successful mapping in the field and in the imagery. In selecting representative vegetation sites, adequate cover size and density estimates are needed. The cover viewed nearly horizontally from the boats is substantially greater than when viewed from above by the airborne instrument. At the oblique angle of the observers, offsets in the sample points may have appeared greater than actual cover density. Newer techniques such as real-time display of aerial and satellite imagery within the GPS may produce greater precision in selecting the pixels that best represent the locations being mapped in the field. Image Georegistration Accessible representative vegetation sites were often no larger than one pixel (3 m), therefore extremely accurate georegistation was required to properly extract the spectral data from the images. The image georegistation provided by HyVista was based on their airborne ephemeris location and plane attitude data which was not sufficiently accurate, ranging from 3 to 10 m off position. Significant effort was made to register the imagery to the 1-foot orthophotos provided by the Department of Water Resources. While this improved our positional accuracy, our classification results did improve significantly by averaging the individual pixel classifications using a 3 x 3 pixel window (median filter) over the final results. As shown in the Results section (and Appendix, Table 2), the georegistration accuracies are within a single pixel across all control points within each image, even this single pixel error can affect the accuracy of the classification. One suggestion for future data collection is to utilize GPS units that 39
41 display an existing current or recent aerial image to acquire while in the field clear and distinct feature positions for registration. Variation in Tidal Height and Water Quality One major problem encountered in the study this year in identifying submerged vegetation, compared to the 2003 pilot project, was the large variation in water depth due to tidal differences. The best opportunity to distinguished SAV from the surrounding water was during low tide when the tops of the vegetation are afloat on the water surface. In contrast to floating mats of water hyacinth, Brazilian waterweed and other SAV are rooted to the channel bottoms, as a consequence increased water height exposed less SAV, and the image pixel spectra was composed of a greater proportion of water spectra. Given the large number flightlines, combined with wind and cloud considerations, image acquisitions spanned almost two weeks. Our opportunity to coordinate the flight times with low tides was constrained by these and other operational conditions. In addition, the channel size and meandering patterns delay tidal movement and promote inconsistent water heights, from the western to eastern and from the northern to southern area of the study. The disparities between the tidal heights at the time the field crew collected representative sites and when the imagery was acquired added errors to acquiring representative locations. Figure 25. Flightline number 40 extracted water spectra from west to east at channel centers 40
42 The identification of Brazilian waterweed and other SAV was further complicated by the variability in water spectra due to the range of turbidity and algae within the Delta. Since turbid water spectra are similar in many wavelengths to that of submerged aquatic vegetation, it was difficult to extract adequate spectral representatives of the water. Example spectral from the middle of the Delta study area is shown in Figure 25 for the selected Universal Transverse Mercator (UTM) coordinates in the legend. These water spectra were extracted along a transect of channel centers from west to east in flightline number 40, a flightline that encompasses both the Sacramento and San Joaquin Rivers, the vegetation edges of Franks Tract and Honker Cut. In this Delta region, the western channels are cleaner, larger water bodies. The rate water is refreshed is slower in the middle and eastern region due to smaller channels. Generally the water in the northern flightlines is clear with brighter visible spectral regions due to fine clay and silt reflectance. In the southern flightlines, the water is darker in the visible region due to light absorption by a mixture of algae and other detritus. Additionally, algae in the water may be confused with the greenness of Brazilian water weed in the water, and further confounded as the amount of water in the pixel varies. The mix of green water and green vegetation is not easily discriminated. In the future, the sub-dividing the project into smaller areas where the timing of the tide and flight can be better coordinated, and greater control on the water spectra can be achieved will improve the accuracy of the vegetation classification. Further refinement of the water spectra and vegetation spectral analysis will also improve the classification accuracy. ReMetrix Pre-Treatment Field Support for Hyperspectral Image Classification ReMetrix field crews collected pre-treatment surface vegetation location and measurement information by sampling eight priority sites between 25 June and 9 July 2004, prior to herbicide application. The eight sites sampled were: Dutch Slough 112, Franks Tract 173, Big Break 118, Little Potato Slough/Grindstone 40, Pixley Slough 31, Rhode Island 99, Venice Cut 16, and White Slough 36. The submerged plant samples were collected in transects across each site using a thatch rake device. They provided the vegetation information in an Excel spreadsheet. Sample positions and surface vegetation areas were mapped using GPS and supplied as ArcMap shapefiles. In addition, ReMetrix supplied tidal information for their sample collection times. By collecting data during high tide, the submerged plants are distributed as much as possible throughout the water column. During low tide, the dense plants tended to tangle into mats at the water surface, reducing the accuracy of the ReMetrix acoustic measurements. Unfortunately, the ReMetrix requirement to collect their data at high tide is the opposite of our requirement to acquire imagery at or around low tide for species identification. Weed patches that may be present at low tide and in the imagery may not have been observed by the ReMetrix field crews. ReMetrix supplied shapefiles for mixed vegetation patch locations of five of the eight sites. The location and identification of the patches helped confirm the presence of mixtures of submerged weeds, however, we were unable to use these mixtures since it is necessary to capture individual weed spectra for separating Brazilian waterweed from 41
43 other submerged vegetation. In the future, it will be more helpful if points are collected for distinct patches of predominantly monospecific weeds. The point sampling from within the patches was also ineffective in remote sensing identification of the SAV. The ReMetrix sampling protocol involved lifting the submerged vegetation from the channel bottom with the rake to the surface for identification and measurement. Plant samples collected from the bottom and within the water column are not representative of the vegetation at the water surface seen by the airborne instrument. CONTINUED INVESTIGATIONS Improving Current Delta-wide Classification Our investigations will continue to improve the identification of target species within Priority 1 by creating a GIS network of the rivers and channels to separate tidal heights and water characteristics at the time of the overflights. Stratifying the Delta into channel and large water body segments of consistent water height and quality (sediment load, algae, etc.) should improve classification accuracy by reducing the variability in the water and vegetation spectra. These investigations will also allow us to better extend our mapping of the target species to areas not visited in field work, i.e., north of flightline number 23 and for the southern portion of Priority 1 below flightline number 55. Combining the water movement patterns with the GIS network may also be helpful in anticipating the spread of Brazilian waterweed under various natural and anthropomorphic environmental changes. Mapping Invasive Species in Priority 2 Our work from January to June 2005, will focus on analysis of the imagery acquired for Priority 2. The techniques developed in Priority 1 will be improved and extended to the mapping the same SAV and water hyacinth. We will also investigate the potential for mapping pepperweed and purple loosestrife along the banks of the Tuolumne, Merced and San Joaquin Rivers. This effort will utilize the GPS locations of purple loosestrife provided by CDFA (Figure 26). While we acquired some field data for the Priority 2 region in early July, 2004, we do anticipate additional fieldwork to collect representative vegetation sites. 42

44 Figure 26 43
45 CONCLUSION This study has expanded on the knowledge gained in the pilot project conducted in 2003 and extended the mapping of Brazilian waterweed and water hyacinth across 32 flightlines of the Delta. In addition, this work has classified these two target species and provided estimates of weed infestations at six priority sites identified by CDBW, and also made some preliminary investigations into the ability to distinguish Brazilian waterweed from other submerged aquatic species at one other site. The direct result of this research is an improved understanding of the distribution of Brazilian waterweed and water hyacinth throughout the Delta and provides a baseline dataset for the Department of Boating and Waterways and California Department of Food and Agriculture to monitor the spread of infestations as well as guidance for decision-making relating to control and eradication efforts within the Delta. ACKNOWLEDGEMENTS We would like to extend our appreciation for the assistance and collaboration of CDFA staff. We would also like to thank other members of CSTARS/CalSpace for their assistance in the field; Jaylee Tuil, David A. Darling, Edward T. Tom, Margaret E. Andrew, and John M. Kefauver III, and Solomon Dobrowski for valuable technical advice. 44
46 REFERENCES Ackleson, S. G. and Klemas, V. (1987). Remote sensing of submerged aquatic vegetation in lower Chesapeake Bay: a comparison of Landsat MSS and TM Imagery. Remote Sensing of Environment, 22, Adams, J. B., Sabot, D.E., Kapos, V., Almeida Filho, R., Roberts, D.A., Smith, M.O., and Gillespie, A.R. (1995). Classification of multispectral images based on fractions of endmembers: application to land cover change in the Brazilian Amazon. Remote Sensing of Environment, 52, Adams, J. B., Smith, M. O., and Gillespie, A. R. (1993). Imaging spectroscopy: interpretation based on spectral mixture analysis. In: C. M. Pieters and P. A. J. Englert (Eds.), Remote geochemical analysis: elemental and mineralogical composition (pp ). Cambridge University Press, New York City, New York. Bossard, C. C., Randall, J. M., and Hoshovsky, M. C. (Eds.) (2000). Invasive plants of California s wildlands. University of California Press, Berkeley, California. Cocks, T., Jennsen, R., Stewart, A., Wilson, I. and Shields, T. (1998). The HyMap airborne hyperspectral sensor: the system, calibration and performance, Proceedings of the 1 st EARSEL Workshop on Imaging Spectroscopy, Zurich, October Elmore, A. J., Mustard, J. F., Manning, S. J., and Lobell, D. B. (2000). Quantifying vegetation change in semiarid environments: precision and accuracy of spectral mixture analysis and the normalized difference vegetation index. Remote Sensing of Environment, 73, Hortwitz, H. M., Lewis, J. T., and Pentland, A. P. (1975). Estimating proportions of objects from Multispectral Scanner Data. Final Report. NASA-CR pp. Johnson, D.E. (1999). Surveying, mapping, and monitoring noxious weeds on rangelands. In R. L. Sheley, and J. K. Petroff (Eds.), Biology and management of noxious rangeland weeds (pp ). Oregon State University Press, Corvallis, Oregon. Lehmann, A. and Lachavanne, J.B. (1997). Geographic information systems and remote sensing in aquatic botany. In: Lachavanne, J. B., Caloz, R., Lahmann, A. (Eds.), Geographic information systems and remote sensing in aquatic botany. Aquatic Botany, 58, Lehmann, A., Jaquet, J. M., Lachavanne, J. B. (1997). A GIS approach of aquatic plant spatial heterogeneity in relation to sediment and depth gradients, Lake Geneva, Switzerland. In: Lachavanne, J. B., Caloz, R., Lehmann, A. (Eds.), Geographic information systems and remote sensing in aquatic botany. Aquatic Botany, 58, Mooney, H. A. and Cleland, E. E. (2001). The evolutionary impact of invasive species. Procedures of National Academy of Science, 98 (10),
Progress Report Year 2, NAG5-6003: The Dynamics of a Semi-Arid Region in Response to Climate and Water-Use Policy
 Progress Report Year 2, NAG5-6003: The Dynamics of a Semi-Arid Region in Response to Climate and Water-Use Policy Principal Investigator: Dr. John F. Mustard Department of Geological Sciences Brown University
Application of Remote Sensing and Global Positioning Technology for Survey and Monitoring of Plant Pests
 Application of Remote Sensing and Global Positioning Technology for Survey and Monitoring of Plant Pests David Bartels, Ph.D. USDA APHIS PPQ CPHST Mission Texas Laboratory Spatial Technology and Plant
Pierce Cedar Creek Institute GIS Development Final Report. Grand Valley State University
 Pierce Cedar Creek Institute GIS Development Final Report Grand Valley State University Major Goals of Project The two primary goals of the project were to provide Matt VanPortfliet, GVSU student, the
Minimum Standards for Wetland Delineations
 Minimum Standards for Wetland Delineations Jason Gipson Chief, Utah/Nevada Regulatory Branch Sacramento District Regulatory Program Workshop 16 Mar 2016 US Army Corps of Engineers Delineation Report Minimum
Using Remote Sensing to Map the Evolution of Marsh Vegetation in the South Bay of San Francisco
 Using Remote Sensing to Map the Evolution of Marsh Vegetation in the South Bay of San Francisco Brian Fulfrost Design, Community and Environment (DC&E) 6 th Annual Bay-Delta Science Conference PROJECT
The Road to Data in Baltimore
 Creating a parcel level database from high resolution imagery By Austin Troy and Weiqi Zhou University of Vermont, Rubenstein School of Natural Resources State and local planning agencies are increasingly
Briggs Lake Water Quality Report 2014
 Briggs Lake Water Quality Report 2014 Seasonal Report for Briggs Lake Green Oak Township, Livingston Co. T1N, R6E, Sec. 3,4 74 Surface Acres 414 Hadley Street Holly, MI 48442 Main Phone: 248-634-8388 Northern
The Invasive Status of Giant Salvinia and Hydrilla in Mississippi
 Wilfredo Robles, John D. Madsen, Victor L. Maddox and Ryan M. Wersal GeoResources Institute Mississippi State University Box 9952 Starkville, MS 39762 662-325-2311 E-mail: wr40@pss.msstate.edu ABSTRACT
Home About Us Articles Press Releases Image Gallery Contact Us Media Kit Free Subscription 10/5/2006 5:56:35 PM
 Home About Us Articles Press Releases Image Gallery Contact Us Media Kit Free Subscription 10/5/2006 5:56:35 PM Industry Resources Industry Directory NASA Links Missions/Launches Calendar Human development
GIS 2010: Coastal Erosion in Mississippi Delta
 1) Introduction Problem overview To what extent do large storm events play in coastal erosion rates, and what is the rate at which coastal erosion is occurring in sediment starved portions of the Mississippi
Flowering Rush Hand Removal. Lake Minnetonka Pilot Program
 Flowering Rush Hand Lake Minnetonka Pilot Program Spring 2012 Survey Report Provided For the Minnehaha Creek Watershed District By Waterfront Restoration LLC & Blue Water Science May 31, Waterfront Restoration,
LAKE SURVEY REPORT. Fisheries Management. DOW Number: Survey ID Date: 07/31/2017. Lake Identification. Lake Location. Legal Descriptions
 Fisheries Management LAKE SURVEY REPORT Lake Name: Kroon Survey Type: Targeted Survey DOW Number: 13-0013-00 Survey ID Date: 07/31/2017 Lake Identification Alternate Lake Name: N/A Primary Lake Class ID:
Steve Pye LA /22/16 Final Report: Determining regional locations of reference sites based on slope and soil type. Client: Sonoma Land Trust
 Steve Pye LA 221 04/22/16 Final Report: Determining regional locations of reference sites based on slope and soil type. Client: Sonoma Land Trust Deliverables: Results and working model that determine
USING HYPERSPECTRAL IMAGERY
 USING HYPERSPECTRAL IMAGERY AND LIDAR DATA TO DETECT PLANT INVASIONS 2016 ESRI CANADA SCHOLARSHIP APPLICATION CURTIS CHANCE M.SC. CANDIDATE FACULTY OF FORESTRY UNIVERSITY OF BRITISH COLUMBIA CURTIS.CHANCE@ALUMNI.UBC.CA
Appendix I Feasibility Study for Vernal Pool and Swale Complex Mapping
 Feasibility Study for Vernal Pool and Swale Complex Mapping This page intentionally left blank. 0 0 0 FEASIBILITY STUDY BY GIC AND SAIC FOR MAPPING VERNAL SWALE COMPLEX AND VERNAL POOLS AND THE RESOLUTION
Aquatic Plants of Eastman Pond, Eastman
 Aquatic Plants of Eastman Pond, Eastman State Contact: Amy P. Smagula Limnologist/Exotic Aquatic Plant Program Coordinator 603-271 271-22482248 or asmagula@des.state.nh.us Current status of exotic plant
7.1 INTRODUCTION 7.2 OBJECTIVE
 7 LAND USE AND LAND COVER 7.1 INTRODUCTION The knowledge of land use and land cover is important for many planning and management activities as it is considered as an essential element for modeling and
Aquatic Weed Identification and Control
 Aquatic Weed Identification and Control David Kratville, Environmental Scientist Integrated Pest Control Branch California Department of Food and Agriculture Emergent/Floating Aquatic Weed ID Riparian
Distribution of Hydrilla and Giant Salvinia in Mississippi in 2005
 An Annual Report to the Mississippi Bureau of Plant Industry for 2005 John D. Madsen, Ryan M. Wersal, and Wilfredo Robles GeoResources Institute and Department of Plant and Soil Science Mississippi State
DUC 2017 Fieldwork Overview: Akaitcho Wetland Mapping Project
 DUC 2017 Fieldwork Overview: Akaitcho Wetland Mapping Project Prepared for MobileDemand Project Managers: Kevin Smith, Al Richard Lead Technical Analyst: *Michael Merchant Support Analysts: Becca Warren,
identify tile lines. The imagery used in tile lines identification should be processed in digital format.
 Question and Answers: Automated identification of tile drainage from remotely sensed data Bibi Naz, Srinivasulu Ale, Laura Bowling and Chris Johannsen Introduction: Subsurface drainage (popularly known
Chesapeake Bay Remote Sensing Pilot Executive Briefing
 Chesapeake Bay Remote Sensing Pilot Executive Briefing Introduction In his Executive Order 13506 in May 2009, President Obama stated The Chesapeake Bay is a national treasure constituting the largest estuary
Hydroacoustic survey and bathymetric map creation for Brant Lake, New York
 Hydroacoustic survey and bathymetric map creation for Brant Lake, New York Holly A. Waterfield CLM 1 INTRODUCTION Brant Lake is located in Warren County, New York, within the bounds of the Adirondack Park.
Technical Drafting, Geographic Information Systems and Computer- Based Cartography
 Technical Drafting, Geographic Information Systems and Computer- Based Cartography Project-Specific and Regional Resource Mapping Services Geographic Information Systems - Spatial Analysis Terrestrial
A Basic Introduction to Geographic Information Systems (GIS) ~~~~~~~~~~
 ~~~~~~~~~~") A Basic Introduction to Geographic Information Systems (GIS) ~~~~~~~~~~ Rev. Ronald J. Wasowski, C.S.C. Associate Professor of Environmental Science University of Portland Portland, Oregon 3 September
A Basic Introduction to Geographic Information Systems (GIS) ~~~~~~~~~~ Rev. Ronald J. Wasowski, C.S.C. Associate Professor of Environmental Science University of Portland Portland, Oregon 3 September
Vegetation and Wildlife Habitat Mapping Study in the Upper and Middle Susitna Basin Study Plan Section 11.5
 (FERC No. 14241) Vegetation and Wildlife Habitat Mapping Study in the Upper and Middle Susitna Basin Study Plan Section 11.5 Initial Study Report Part C: Executive Summary and Section 7 Prepared for Prepared
Vegetation Change Detection of Central part of Nepal using Landsat TM
 Vegetation Change Detection of Central part of Nepal using Landsat TM Kalpana G. Bastakoti Department of Geography, University of Calgary, kalpanagb@gmail.com Abstract This paper presents a study of detecting
HYPERSPECTRAL IMAGING
 1 HYPERSPECTRAL IMAGING Lecture 9 Multispectral Vs. Hyperspectral 2 The term hyperspectral usually refers to an instrument whose spectral bands are constrained to the region of solar illumination, i.e.,
Geographical Information Systems
 Geographical Information Systems Geographical Information Systems (GIS) is a relatively new technology that is now prominent in the ecological sciences. This tool allows users to map geographic features
Mapping Coastal Change Using LiDAR and Multispectral Imagery
 Mapping Coastal Change Using LiDAR and Multispectral Imagery Contributor: Patrick Collins, Technical Solutions Engineer Presented by TABLE OF CONTENTS Introduction... 1 Coastal Change... 1 Mapping Coastal
Characterization of the Nigerian Shoreline using Publicly-Available Satellite Imagery
 University of New Hampshire University of New Hampshire Scholars' Repository Center for Coastal and Ocean Mapping Center for Coastal and Ocean Mapping 1-2014 Characterization of the Nigerian Shoreline
Lecture 6 - Raster Data Model & GIS File Organization
 Lecture 6 - Raster Data Model & GIS File Organization I. Overview of Raster Data Model Raster data models define objects in a fixed manner see Figure 1. Each grid cell has fixed size (resolution). The
Hydraulic Processes Analysis System (HyPAS)
") Hydraulic Processes Analysis System (HyPAS) by Thad C. Pratt and Daryl S. Cook PURPOSE: This Coastal Engineering Technical Note (CETN) describes a PC-Windows-based system for analyzing, visualizing, and
Hydraulic Processes Analysis System (HyPAS) by Thad C. Pratt and Daryl S. Cook PURPOSE: This Coastal Engineering Technical Note (CETN) describes a PC-Windows-based system for analyzing, visualizing, and
Remote Sensing and GIS Techniques for Monitoring Industrial Wastes for Baghdad City
 The 1 st Regional Conference of Eng. Sci. NUCEJ Spatial ISSUE vol.11,no.3, 2008 pp 357-365 Remote Sensing and GIS Techniques for Monitoring Industrial Wastes for Baghdad City Mohammad Ali Al-Hashimi University
BASE MAPPING. Technical Approachs
 BASE MAPPING Technical Approachs STATEMENT OF THE PROBLEM A major stumbling block to the integration of remotely sensed data into existing GIS data base structures is the issue of positional accuracy of
A Comprehensive Inventory of the Number of Modified Stream Channels in the State of Minnesota. Data, Information and Knowledge Management.
 A Comprehensive Inventory of the Number of Modified Stream Channels in the State of Minnesota Data, Information and Knowledge Management Glenn Skuta Environmental Analysis and Outcomes Division Minnesota
The Looming Threat of Rising Sea Levels to the Florida Keys
 The Looming Threat of Rising Sea Levels to the Florida Keys 1. Introduction Sea levels are rising, and possibly faster than we thought before. In a recent report in 2017 by the National Oceanic and Atmospheric
Introduction. Project Summary In 2014 multiple local Otsego county agencies, Otsego County Soil and Water
 Introduction Project Summary In 2014 multiple local Otsego county agencies, Otsego County Soil and Water Conservation District (SWCD), the Otsego County Planning Department (OPD), and the Otsego County
GIS Workshop Data Collection Techniques
 GIS Workshop Data Collection Techniques NOFNEC Conference 2016 Presented by: Matawa First Nations Management Jennifer Duncan and Charlene Wagenaar, Geomatics Technicians, Four Rivers Department QA #: FRG
MAPPING THE SPECTRAL AND SPATIAL CHARACTERISTICS OF MOUND SPRING WETLAND VEGETATION IN SOUTH AUSTRALIA: A NOVEL SPECTRALLY SEGMENTED PCA APPROACH
 MAPPING THE SPECTRAL AND SPATIAL CHARACTERISTICS OF MOUND SPRING WETLAND VEGETATION IN SOUTH AUSTRALIA: A NOVEL SPECTRALLY SEGMENTED PCA APPROACH Dr. Davina White, Postdoctoral Research Fellow Associate
Sea Level Rise in Miami-Dade County Florida Implications for Management of Coastal Wetlands and the Everglades
 Sea Level Rise in Miami-Dade County Florida Implications for Management of Coastal Wetlands and the Everglades Peter W. Harlem Dr. John F. Meeder Florida International University Southeast Environmental
Aerial Thermal Infrared Imaging White - tailed Deer Counts Fort Thomas, Kentucky
 Aerial Thermal Infrared Imaging White - tailed Deer Counts Fort Thomas, Kentucky Submitted to: Don Martin, MPA City Administrative Officer 130 North Fort Thomas Ave Ft Thomas, KY 41075 Via email: DMartin@FtThomas.org
DATA SOURCES AND INPUT IN GIS. By Prof. A. Balasubramanian Centre for Advanced Studies in Earth Science, University of Mysore, Mysore
 DATA SOURCES AND INPUT IN GIS By Prof. A. Balasubramanian Centre for Advanced Studies in Earth Science, University of Mysore, Mysore 1 1. GIS stands for 'Geographic Information System'. It is a computer-based
Resolving habitat classification and structure using aerial photography. Michael Wilson Center for Conservation Biology College of William and Mary
 Resolving habitat classification and structure using aerial photography Michael Wilson Center for Conservation Biology College of William and Mary Aerial Photo-interpretation Digitizing features of aerial
Characterization of Coastal Wetland Systems using Multiple Remote Sensing Data Types and Analytical Techniques
 Characterization of Coastal Wetland Systems using Multiple Remote Sensing Data Types and Analytical Techniques Daniel Civco, James Hurd, and Sandy Prisloe Center for Land use Education and Research University
Wetland Mapping. Wetland Mapping in the United States. State Wetland Losses 53% in Lower US. Matthew J. Gray University of Tennessee
 Wetland Mapping Caribbean Matthew J. Gray University of Tennessee Wetland Mapping in the United States Shaw and Fredine (1956) National Wetlands Inventory U.S. Fish and Wildlife Service is the principle
17-20 November 2007 Incidental Take Monitoring Methodology and Results
 Sample Site Selection Protocol 17-20 November 2007 Incidental Take Monitoring Methodology and Results On 16 November 2007, the U.S. Fish and Wildlife Service (USFWS) provided the USACE Mobile District
Lecture 9: Reference Maps & Aerial Photography
 Lecture 9: Reference Maps & Aerial Photography I. Overview of Reference and Topographic Maps There are two basic types of maps? Reference Maps - General purpose maps & Thematic Maps - maps made for a specific
Display data in a map-like format so that geographic patterns and interrelationships are visible
 Vilmaliz Rodríguez Guzmán M.S. Student, Department of Geology University of Puerto Rico at Mayagüez Remote Sensing and Geographic Information Systems (GIS) Reference: James B. Campbell. Introduction to
3 SHORELINE CLASSIFICATION METHODOLOGY
 3 SHORELINE CLASSIFICATION METHODOLOGY Introduction The ESI scale, as described in Section 2, categorizes coastal habitats in terms of their susceptibility to spilled oil, taking into consideration a number
Improvement of the National Hydrography Dataset for Parts of the Lower Colorado Region and Additional Areas of Importance to the DLCC
 Improvement of the National Hydrography Dataset for Parts of the Lower Colorado Region and Additional Areas of Importance to the DLCC Carlos Reyes-Andrade California State University, Northridge September
Describing Greater sage-grouse (Centrocercus urophasianus) Nesting Habitat at Multiple Spatial Scales in Southeastern Oregon
 Nesting Habitat at Multiple Spatial Scales in Southeastern Oregon") Describing Greater sage-grouse (Centrocercus urophasianus) Nesting Habitat at Multiple Spatial Scales in Southeastern Oregon Steven Petersen, Richard Miller, Andrew Yost, and Michael Gregg SUMMARY Plant
Describing Greater sage-grouse (Centrocercus urophasianus) Nesting Habitat at Multiple Spatial Scales in Southeastern Oregon Steven Petersen, Richard Miller, Andrew Yost, and Michael Gregg SUMMARY Plant
Quick Response Report #126 Hurricane Floyd Flood Mapping Integrating Landsat 7 TM Satellite Imagery and DEM Data
 Quick Response Report #126 Hurricane Floyd Flood Mapping Integrating Landsat 7 TM Satellite Imagery and DEM Data Jeffrey D. Colby Yong Wang Karen Mulcahy Department of Geography East Carolina University
The Wide Dynamic Range Vegetation Index and its Potential Utility for Gap Analysis
 Summary StatMod provides an easy-to-use and inexpensive tool for spatially applying the classification rules generated from the CT algorithm in S-PLUS. While the focus of this article was to use StatMod
ENVI Tutorial: Vegetation Analysis
 ENVI Tutorial: Vegetation Analysis Vegetation Analysis 2 Files Used in this Tutorial 2 About Vegetation Analysis in ENVI Classic 2 Opening the Input Image 3 Working with the Vegetation Index Calculator
Rio Santa Geodatabase Project
 Rio Santa Geodatabase Project Amanda Cuellar December 7, 2012 Introduction The McKinney research group (of which I am a part) collaborates with international and onsite researchers to evaluate the risks
GIS feature extraction tools in diverse landscapes
 CE 394K.3 GIS in Water Resources GIS feature extraction tools in diverse landscapes Final Project Anna G. Kladzyk M.S. Candidate, Expected 2015 Department of Environmental and Water Resources Engineering
Louisiana Transportation Engineering Conference. Monday, February 12, 2007
 Louisiana Transportation Engineering Conference Monday, February 12, 2007 Agenda Project Background Goal of EIS Why Use GIS? What is GIS? How used on this Project Other site selection tools I-69 Corridor
A GLOBAL ANALYSIS OF URBAN REFLECTANCE. Christopher SMALL
 A GLOBAL ANALYSIS OF URBAN REFLECTANCE Christopher SMALL Lamont Doherty Earth Observatory Columbia University Palisades, NY 10964 USA small@ldeo.columbia.edu ABSTRACT Spectral characterization of urban
Crystal Lake Aquatic Plants. Dr. George Knoecklein
 Crystal Lake Aquatic Plants Dr. George Knoecklein Things to keep in mind 1. You will not learn it all in one season 2. Start a library of plant keys 3. Begin to get familiar with scientific names 1. In
McHenry County Property Search Sources of Information
 Disclaimer: The information in this system may contain inaccuracies or typographical errors. The information in this system is a digital representation of information derived from original documents; as
New Land Cover & Land Use Data for the Chesapeake Bay Watershed
 New Land Cover & Land Use Data for the Chesapeake Bay Watershed Why? The Chesapeake Bay Program (CBP) partnership is in the process of improving and refining the Phase 6 suite of models used to inform
Modeling the Rural Urban Interface in the South Carolina Piedmont: T. Stephen Eddins Lawrence Gering Jeff Hazelton Molly Espey
 Modeling the Rural Urban Interface in the South Carolina Piedmont: T. Stephen Eddins (teddins@clemson.edu) Lawrence Gering Jeff Hazelton Molly Espey ABSTRACT Continuing growth of America s cities has created
USE OF RADIOMETRICS IN SOIL SURVEY
 USE OF RADIOMETRICS IN SOIL SURVEY Brian Tunstall 2003 Abstract The objectives and requirements with soil mapping are summarised. The capacities for different methods to address these objectives and requirements
1.1 What is Site Fingerprinting?
 Site Fingerprinting Utilizing GIS/GPS Technology 1.1 What is Site Fingerprinting? Site fingerprinting is a planning tool used to design communities where protection of natural resources is the primary
Baseline Estuarine-Upland Transition Zone
 Baseline Estuarine-Upland Transition Zone in SF, San Pablo and Suisun Bays 10/5/18 Prepared for San Francisco Bay Joint Venture (SFBJV) Prepared by Brian Fulfrost, Principal bfaconsult@gmail.com with additional
Monitoring Vegetation Growth of Spectrally Landsat Satellite Imagery ETM+ 7 & TM 5 for Western Region of Iraq by Using Remote Sensing Techniques.
 Monitoring Vegetation Growth of Spectrally Landsat Satellite Imagery ETM+ 7 & TM 5 for Western Region of Iraq by Using Remote Sensing Techniques. Fouad K. Mashee, Ahmed A. Zaeen & Gheidaa S. Hadi Remote
Quality Assurance Project Plan (QAPP) - Vegetation Survey of Huron Creek Houghton, MI
 - Vegetation Survey of Huron Creek Houghton, MI") Quality Assurance Project Plan (QAPP) - Vegetation Survey of Huron Creek Houghton, MI Prepared By: Linda D. Kersten, Dr. Alex S. Mayer Michigan Technological University, Center for Water & Society Prepared
Quality Assurance Project Plan (QAPP) - Vegetation Survey of Huron Creek Houghton, MI Prepared By: Linda D. Kersten, Dr. Alex S. Mayer Michigan Technological University, Center for Water & Society Prepared
WeatherHawk Weather Station Protocol
 WeatherHawk Weather Station Protocol Purpose To log atmosphere data using a WeatherHawk TM weather station Overview A weather station is setup to measure and record atmospheric measurements at 15 minute
The Invasion of False Brome in Western Oregon
 The Invasion of False Brome in Western Oregon GIS II Presentation Winter 2006 Will Fellers Kurt Hellerman Kathy Strope Statia Cupit False Brome (Brachypodium sylvaticum) Perennial bunchgrass native to
Evaluating Urban Vegetation Cover Using LiDAR and High Resolution Imagery
 Evaluating Urban Vegetation Cover Using LiDAR and High Resolution Imagery Y.A. Ayad and D. C. Mendez Clarion University of Pennsylvania Abstract One of the key planning factors in urban and built up environments
Great California Delta Trail Blueprint for Contra Costa and Solano Counties GIS AND MAPPING MEMORANDUM JULY 2010
 Great California Delta Trail Blueprint for Contra Costa and Solano Counties GIS AND MAPPING MEMORANDUM JULY 2010 {DRAFT} July 2010 Introduction Geographic Information Systems (GIS) are computer-based
Making Accurate Field Spectral Reflectance Measurements By Dr. Alexander F. H. Goetz, Co-founder ASD Inc., Boulder, Colorado, 80301, USA October 2012
 Making Accurate Field Spectral Reflectance Measurements By Dr. Alexander F. H. Goetz, Co-founder ASD Inc., Boulder, Colorado, 80301, USA October 2012 Introduction Accurate field spectral reflectance measurements
Geographic Systems and Analysis
 Geographic Systems and Analysis New York University Robert F. Wagner Graduate School of Public Service Instructor Stephanie Rosoff Contact: stephanie.rosoff@nyu.edu Office hours: Mondays by appointment
IMPROVING REMOTE SENSING-DERIVED LAND USE/LAND COVER CLASSIFICATION WITH THE AID OF SPATIAL INFORMATION
 IMPROVING REMOTE SENSING-DERIVED LAND USE/LAND COVER CLASSIFICATION WITH THE AID OF SPATIAL INFORMATION Yingchun Zhou1, Sunil Narumalani1, Dennis E. Jelinski2 Department of Geography, University of Nebraska,
Investigation of the Effect of Transportation Network on Urban Growth by Using Satellite Images and Geographic Information Systems
 Presented at the FIG Congress 2018, May 6-11, 2018 in Istanbul, Turkey Investigation of the Effect of Transportation Network on Urban Growth by Using Satellite Images and Geographic Information Systems
Data Fusion and Multi-Resolution Data
 Data Fusion and Multi-Resolution Data Nature.com www.museevirtuel-virtualmuseum.ca www.srs.fs.usda.gov Meredith Gartner 3/7/14 Data fusion and multi-resolution data Dark and Bram MAUP and raster data Hilker
Aquatic Plants of MESSER POND
 Aquatic Plants of MESSER POND State Contact: Amy P. Smagula Limnologist/Exotic Aquatic Plant Program Coordinator 603-271-2248 or Amy.Smagula@des.nh.gov Overview This slideshow includes four sections aimed
CHAPTER 6 RESULTS FIGURE 8.- DATA WORK FLOW FOR BACKSCATTER PROCESSING IN HYPACK
 CHAPTER 6 RESULTS 6.1. Backscatter Workflow Comparison Currently, INOCAR owns and operates RESON and Kongsberg multibeam systems for nearshore surveys. The RESON system is integrated with HYPACK Hysweep
A Help Guide for Using gssurgo to Find Potential Wetland Soil Landscapes
 A Help Guide for Using gssurgo to Find Potential Wetland Soil Landscapes Wetland Mapping Consortium Webinar September 17, 2014 Dr. John M. Galbraith Crop & Soil Environmental Sciences Virginia Tech Wetland
Digital Change Detection Using Remotely Sensed Data for Monitoring Green Space Destruction in Tabriz
 Int. J. Environ. Res. 1 (1): 35-41, Winter 2007 ISSN:1735-6865 Graduate Faculty of Environment University of Tehran Digital Change Detection Using Remotely Sensed Data for Monitoring Green Space Destruction
Mapping Soils, Crops, and Rangelands by Machine Analysis of Multi-Temporal ERTS-1 Data
 Purdue University Purdue e-pubs LARS Technical Reports Laboratory for Applications of Remote Sensing 1-1-1973 Mapping Soils, Crops, and Rangelands by Machine Analysis of Multi-Temporal ERTS-1 Data M. F.
10/13/2011. Introduction. Introduction to GPS and GIS Workshop. Schedule. What We Will Cover
 Introduction Introduction to GPS and GIS Workshop Institute for Social and Environmental Research Nepal October 13 October 15, 2011 Alex Zvoleff azvoleff@mail.sdsu.edu http://rohan.sdsu.edu/~zvoleff Instructor:
Remote detection of giant reed invasions in riparian habitats: challenges and opportunities for management planning
 Remote detection of giant reed invasions in riparian habitats: challenges and opportunities for management planning Maria do Rosário Pereira Fernandes Forest Research Centre, University of Lisbon Number
Remote Sensing, Computers, and Land Use Planning
 Purdue University Purdue e-pubs LARS Technical Reports Laboratory for Applications of Remote Sensing 1-1-1973 Remote Sensing, Computers, and Land Use Planning Harry C. Hitchcock Follow this and additional
Department of Biological Sciences, Murray State University, Murray, Kentucky 42071, USA
 1 Department of Biological Sciences, Murray State University, Murray, Kentucky 42071, USA 2 Fondazione Edmund Mach, Research and Innovation Center, Department of Biodiversity and Molecular Ecology, GIS
SURVEY OF SUBMERGED NOXIOUS WEED SPECIES IN LAKE CHELAN WASHINGTON
 SURVEY OF SUBMERGED NOXOUS WEED SPECES N LAKE CHELAN WASHNGTON 1/26/215 Produced by AquaTechnex Lake Chelan was surveyed by air and by boat in the fall of 214 to locate noxious weeds and assess their overall
Relatively little hard substrate occurs naturally in the
 CHAPTER FIVE Rock Habitats Relatively little hard substrate occurs naturally in the estuary, owing mainly to the vast quantities of fine sediment that have been deposited by the rivers. Rock habitat is
Grant Opportunity Monitoring Bi-State Sage-grouse Populations in Nevada
 Grant Opportunity Monitoring Bi-State Sage-grouse Populations in Nevada Proposals are due no later than November 13, 2015. Grant proposal and any questions should be directed to: Shawn Espinosa @ sepsinosa@ndow.org.
Tasks 2 & 3: MARSH CONDITION ASSESSMENT, FEASIBILITY, & SPATIAL DATA REPORT
 The Coastal Research Center Ph. 609-652-4245 Fax 609-748-0656 30 Wilson Avenue Port Republic, NJ 08241 www.stockton.edu/crc NEW JERSEY S DISTINCTIVE PUBLIC UNIVERSITY Tasks 2 & 3: MARSH CONDITION ASSESSMENT,
GIS APPLICATIONS IN SOIL SURVEY UPDATES
 GIS APPLICATIONS IN SOIL SURVEY UPDATES ABSTRACT Recent computer hardware and GIS software developments provide new methods that can be used to update existing digital soil surveys. Multi-perspective visualization
Native species (Forbes and Graminoids) Less than 5% woody plant species. Inclusions of vernal pools. High plant diversity
 Less than 5% woody plant species. Inclusions of vernal pools. High plant diversity") WILLAMETTE VALLEY WET-PRAIRIE RESTORATION MODEL WHAT IS A WILLAMETTE VALLEY WET-PRAIRIE Hot Spot s Native species (Forbes and Graminoids) Rare plant species Less than 5% woody plant species Often dominated
WILLAMETTE VALLEY WET-PRAIRIE RESTORATION MODEL WHAT IS A WILLAMETTE VALLEY WET-PRAIRIE Hot Spot s Native species (Forbes and Graminoids) Rare plant species Less than 5% woody plant species Often dominated
Delineation of Watersheds
 Delineation of Watersheds Adirondack Park, New York by Introduction Problem Watershed boundaries are increasingly being used in land and water management, separating the direction of water flow such that
How Do Human Impacts and Geomorphological Responses Vary with Spatial Scale in the Streams and Rivers of the Illinois Basin?
 How Do Human Impacts and Geomorphological Responses Vary with Spatial Scale in the Streams and Rivers of the Illinois Basin? Bruce Rhoads Department of Geography University of Illinois at Urbana-Champaign
Looking at the big picture to plan land treatments
 Looking at the big picture to plan land treatments Eva Strand Department of Rangeland Ecology and Management University of Idaho evas@uidaho.edu, http://www.cnr.uidaho.edu/range Why land treatment planning?
An Internet-based Agricultural Land Use Trends Visualization System (AgLuT)
") An Internet-based Agricultural Land Use Trends Visualization System (AgLuT) Prepared for Missouri Department of Natural Resources Missouri Department of Conservation 07-01-2000-12-31-2001 Submitted by
An Internet-based Agricultural Land Use Trends Visualization System (AgLuT) Prepared for Missouri Department of Natural Resources Missouri Department of Conservation 07-01-2000-12-31-2001 Submitted by
To: Ross Martin, Lisa Stapleton From: Brad Lind Subject: Joint Funding Agreement with USGS for 2012 Imagery Date: March 14, 2012.
 To: Ross Martin, Lisa Stapleton From: Brad Lind Subject: Joint Funding Agreement with USGS for 2012 Imagery Date: March 14, 2012 Attached are two copies of the Joint Funding Agreement (JFA) between SanGIS
UC Berkeley Technical Completion Reports
 UC Berkeley Technical Completion Reports Title Hydrodynamics of shallow water habitats in the Sacramento-San Joaquin Delta Permalink https://escholarship.org/uc/item/3j77h7t6 Author Stacey, Mark T Publication
Nested Frequency Plot Sample Design and Field Methods for Vegetation Monitoring
 1 Nested Frequency Plot Sample Design and Field Methods for Vegetation Monitoring Materials Plot frame Map of site showing boundaries and sampling point locations Compass GPS pre-loaded with sample points
Vermont Stream Geomorphic Assessment. Appendix E. River Corridor Delineation Process. VT Agency of Natural Resources. April, E0 - April, 2004
 Vermont Stream Geomorphic Assessment Appendix E River Corridor Delineation Process Vermont Agency of Natural Resources - E0 - River Corridor Delineation Process Purpose A stream and river corridor delineation