Bipole III Transmission Project Adjusted Route Assessment for Boreal Woodland Caribou and Moose
|
|
|
- Myles Cross
- 5 years ago
- Views:
Transcription


1 Bipole III Transmission Project Adjusted Route Assessment for Boreal Woodland Caribou and Moose 1

2 Wabowden AFPR Segment 2
3 Methods - Evaluation of Wabowden Caribou Habitat Modeling Analysis and Constraints; Range-Wide Calving Habitat Suitability Assessment Known Calving Locations Winter and Summer Core Use Areas Aboriginal Traditional Knowledge Caribou Cumulative Effects Analysis 3

4 Winter and Summer Core Habitats Wabowden Evaluation Range 4
5 Summary of AFPR on Wabowden Caribou Aspect of Bipole III Transmission Project Potential Effect on Wabowden Caribou Length of Transmission Line Length of Transmission Line The AFPR eliminates the requirement of approximately 49 km of new ROW through the Wabowden evaluation range. The AFPR follows existing ROWs and disturbed areas within the evaluation range, resulting in no new additional fragmentation or access in the area. Length of Transmission Line The total length of ROW which intersects the Wabowden evaluation range has been reduced by approximately 8.85 km. Access The existing forestry buffers along the Provincial Road (PR) 373 provide additional mitigation to any additional effects from the ROW on local caribou movements; Disturbance Use of small core use areas by the Wabowden caribou between PR 373, Wabowden, and Bucko Lake is not expected to change or be affected by this new routing due to the existing disturbance regimes in the local area. 5
6 Wabowden AFPR - Conclusions The AFPR is similar to the original PPR recommend for BWC. Reduces new ROW in the Wabowden BWC Range, follows existing ROW s and disturbed areas. Avoids winter core areas near PTH #6. Reduces scientific uncertainty regarding potential residual effects and conclusions for the FPR. 6

7 Moose Meadows AFPR Segment 7
8 Methods Moose Aerial Survey; Model Verification Distance to Feature Analysis; Habitat Modeling; ATK and EACP; Enhanced Assessment. 8

9 Moose Meadows Survey 9
10 Moose Meadows Survey Results Results for Entire Survey Area Area Elk Bulls Cows Calves Total Moose GHA GHA 13/13a GHA 14 (including Moose Meadows) Total Moose Meadow Area Alone n/a Overall Calves:100 Cows for Survey Area = 51 Calves:100 Cows 10

11 High Quality Moose Habitat in Moose Meadows and Observed Concentrations 11
12 Summary of High Quality Habitat Intersected by the AFPR and FPR FPR AFPR Area of Segment Amount of Modeled Habitat within 3 mile buffer (km 2 and %) Amount of Modeled Habitat within 66m ROW (km 2 and %) Area of Segment Amount of Modeled Habitat within 3 mile buffer (km 2 and %) (4.74%) (0.83%) (21.98%) Amount of Modeled Habitat within 66m ROW (km 2 and %) (1.11%) 12
13 13
14 AFPR Moose Habitat 14

15 AFPR- Shrub 5 15

16 AFPR- Shrub 19 16
17 Main Moose Meadows (2&3) 17

18 Moose Meadows Main 12 18

19 Moose Meadows Main 3 19

20 Moose Meadows Main 14 20
21 Willow Areas (South of MM) 21

22 FRP- Moose Meadows 5 22

23 FRP- Moose Meadows 2 23

24 Moose Observations and Willow Habitat 24

25 Moose Observations Relative to FRI in Moose Meadows 25
26 Bellsite Habitat (5) 26

27 Bellsite- Shrub 8 27
28 Model Verification Two distance to feature analyses were undertaken to characterize moose locations relative to high quality moose habitat and linear features: 1) Wilcoxon Rank Sum Tests; 2) Principal Component Analysis. 28
29 Model Verification - Wilcoxon Rank Sum Tests Observed Moose Random Moose Wilcoxon Test Evaluation Distribution - Mean Distance to Linear Feature Distribution - Mean Distance to Linear Feature P-Value Minor Roads Closer Forestry Roads Closer Major Roads Closer Transmission Closer Lines Rail Lines Closer Cut Blocks Closer Fire Closer High Quality Habitat < Closer 29

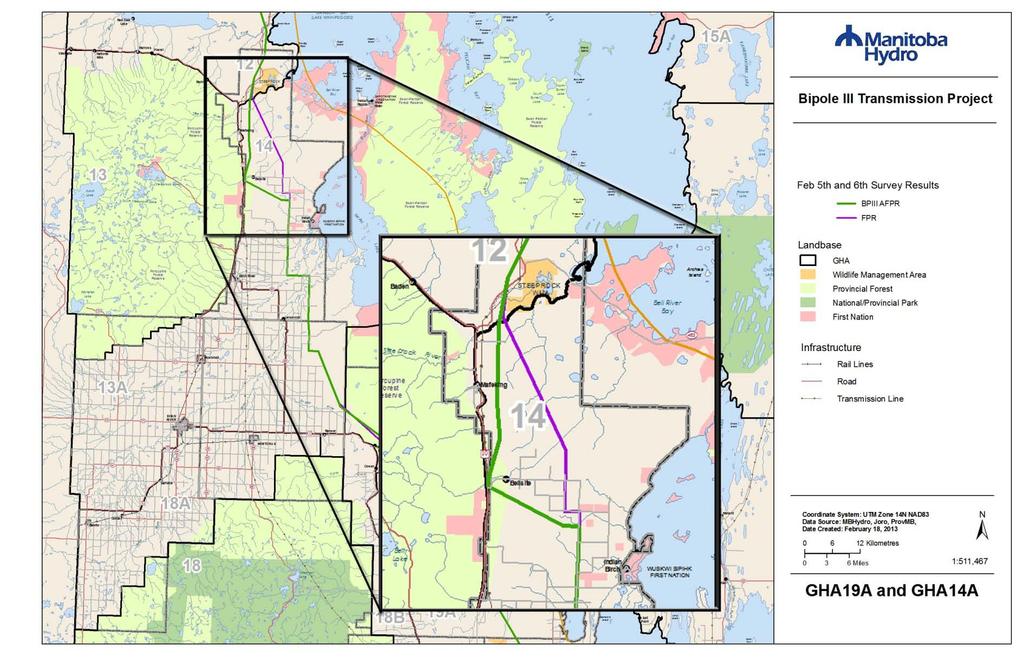
30 GHA 19A and 14A AFPR Segment 30

31 GHA 19A AFPR Survey Area 91 moose observed Note: No previous survey data available for GHA 19A 31

32 High Quality Moose Habitat in GHA 19A and 14A 32
33 Summary of High Quality Habitat Intersected by the AFPR and FPR FPR AFPR Area of Amount of Amount of Area of Amount of Amount of Segment Modeled Habitat Modeled Segment Modeled Habitat Modeled within 3mile Habitat within within 3mile Habitat within buffer (km 2 and 66m ROW (km 2 buffer (km 2 and 66m ROW (km 2 %) and %) %) and %) (36.16%) (1.53%) (33.16%) 1.96 (1.65%) 33

34 Enhanced Assessment 34
35 Introduction Provide a review of temporal, historical, and present day disturbance regimes with respect to moose populations for GHAs in western Manitoba in proximity to the Bipole III Project. Identify (if possible) landscape thresholds of disturbance that explain moose decline in the western region GHA s. 35
36 Methods Natural Disturbance Assessment Comparisons of Historical Moose Density to Disturbance Metrics (Past & Present) Regression Analysis Moose population modelling via Riskman 36

37 Study Area STUDY AREA 37
38 Landscape Cover Data Decade 1960s Available FRI or LCCEB GHA s 12, 13, 14A 1970s GHA s s Current GHA s 13, 14, 18, 19, 19A LCCEB for all areas 38
39 Data Sources Source Manitoba Infrastructure and Transportation Name Description Years Manitoba Official Government Road Map, Manitoba Official Road Map, Manitoba Official Highway Map Digitized highways from the hard copy map , 1953, 1959, 1970, , , , 2012 Manitoba Mines Branch Manitoba Conservation and Water Stewardship (via Manitoba Land Initiative) Manitoba Conservation and Water Stewardship Drill Holes up to 2008 Drill holes in Manitoba up to Fires up to 2011 Fires in Manitoba up to FRI data 1960s, 1970 s, and 1980 s Tolko Industries Ltd Tolko Harvest Louisiana Pacific Canada Ltd. LP Harvest , LP Planned Harvest Forest Resource Inventory for the 1960's, 1970 s, and 1980 s Historical Tolko Harvest Polygons (used ) Historical LP Harvest Polygons (used ), Future LP Planned Harvest Polygons for 10 year plan 1960, 1970, ,
40 Creation of Common Land Cover Land cover classification LCCEB Land cover classification FRI Habitat Classification Classes Cover Type Codes Contiguous Mature Coniferous Deciduous 220 Broadleaf Mixedwood Shrub Shrub Classes Wetlands Wetland Classes Habitat Classification Sub Type Cutting Class Contiguous Mature Productive Forests Stand Types 01-98, cutting Class 2-5 Shrub Productive Forests Stand Types 01-98, cutting Class 0-1 Willow Alder Classes Wetlands Marsh/Muskeg Classes Treed Wetland Classes

41 FRI Data 41

42 Contiguous Forest Patches 42
43 Landscape Metrics Metric Edge density Mean patch edge Mean patch size Median patch size Definition Amount of edge relative to the landscape area Average amount of edge per patch Average patch size The middle patch size, or 50th percentile. Example: Median Patch size of Conifer Patches Number of patches Total number of patches in the landscape if Analyze by Landscape is selected, or Number of Patches for each individual class, if Analyze by Class is selected 43
44 Summary of Analysis Population Estimates summarized by year in each GHA, per Era of FRI GHA 12 GHA 13 GHA 14 GHA 18 GHA 19 FRI - ERA Years Years Years Years Years to Current

45 Example of linear disturbance over time 45

46 Example: 1980 s Shrubland habitat in GHA 18 46

47 Example: Current Shurbland habitat in GHA 18 47

48 Example: 1980 Fire in Porcupine Mts 48
49 Summary of Data GHA Productive Years of Population Linear Years of Moose Era of Landscape Data Major Density Density Survey Habitat (km 2 ) Burn (moose/km 2 ) (km/km 2 ) 12 2, Estimate (metrics current) 1991, , s , Current 2007, 2010, , Estimate (metrics 1980s) , Current 2002, , s 1983, , Current 2007, 2010, , s metrics from 1980s 1993,
50 Methods Regression Analysis Using all available historical and current FRI, LCCEB, LP, and MIT data, landscape and linear density metrics; Regression analysis was conducted using moose density to test for any significance among landscape and linear density metrics; IE: do any of these variables explain population density? 50
51 Regression Analysis Example: Shrubs Linear regression of relationship of shrubland to moose density per square kilometre. The regression slope is positive but the relationship is nonsignificant with a r 2 = 0.36 and a P- value of
52 Regression Analysis Example: Linear Density Linear regression of relationship of linear feature/road density per square kilometre to moose density per square kilometre. The regression slope is positive but the relationship is nonsignificant with a r 2 = 0.36 and a P- value of
53 Regression Analysis Percent Wetland Linear regression of percent wetland to moose density per square kilometre. Note: Significance 53

54 Wetlands Moose Meadows 54
55 Summary: Regression Analysis The results of single and multi-regression analyses did not yield any potential threshold value or significant correlations that explain moose density. Higher densities of moose are associated with more shrubland, more contiguous mature forest, higher densities of linear feature/roads, and higher total linear feature/road length, however, in all cases these relationships are not significant. 55
56 Summary of future disturbance in the Game Hunting Areas intersected by the Bipole III Project within the Project Study Area (20 Years) GHA Current Linear Density (km/km2) Future Linear Density (including Bipole III AFPR (km/km2) Future Drilling (km2) Future % of Area Forest Harvest A * Linear Density Thresholds Used/Reported in Canada (km/km 2 ) Greater Fundy Ecosystem Research Group (2005) 0.6 Manitoba Model Forest 0.58 Salmo et al. (2004) - Target Threshold 0.4 Salmo et al. (2004) - Critical Threshold
57 Moose Population Modeling 57
58 Modelling Objectives Western Manitoba moose populations Consider likely limiting factors Examine their effects on population growth Candidate limiting factors: diseases; parasites; predation; licensed hunting; and other 58
59 Diseases and parasites Chronic Wasting Disease (CWD) Never detected in Manitoba in any species Brain worm (Parelaphostrongylus tenuis) Single verified case in moose in Manitoba near Cromer Verified cases in deer in study area Verified cases in moose across border in Saskatchewan Likely present in study area at times, prevalence likely low Winter tick (Dermacentor albipictus) Occasional outbreaks can yield mass mortality in moose Anecdotal evidence suggests about 1/3 of moose in western Manitoba may have died in
60 Predation Predators in area include black bears and wolves Regional study (RMNP) shows wolves consume 3 times as much elk as moose From other NA studies, wolf and bear predation is highest on moose calves In western MB, surveys show more than 50 calves per 100 cows 60
61 Density (km 2 ) RMNP Saskatchewan56 Saskatchewan57 Saskatchewan59 18,18A,18B,18C 13,13A 14 18,18A 14,14A Moose Population Density of Manitoba Game Hunting Areas, Saskatchewan Wildlife Management Zones, and Riding Mountain National Park 61


62 Western Moose Densities Western Moose Densities 62
63 Model Input Parameters Winter survey data from western Manitoba: Calf:cow ratio = 0.56 (n=12) Bull:cow ratio = 0.66 (n=10) I.e., for every 100 cow moose observed there were 56 calves and 66 bulls observed. Literature: annual adult female survival of 0.88 to 0.92; 50:50 sex ratio at birth. 63
64 Model Input Parameters Annual survival rates Age in May Age Class Female Survival Rate (SE) Male Survival Rate 0 Calves 0.55 (0.05) 0.55 (0.05) 1 Yearlings 0.91 (0.01) 0.85 (0.01) 2-11 Two year olds plus adults (SE) 0.91 (0.01) 0.85 (0.01) Older adults 0.81 (0.02) 0.75 (0.02) The yearling and adult male survival rates were selected to yield the mean bull:cow ratio observed in the surveys conducted after 1990 (66:100) The survival rate was set to 0.0 for males age 15 and for females age 18 64
65 Model Input Parameters Age specific parturition and twinning rates Age in May Age Class Parturition Rate * (SE) Twinning Rate (SE) 1 Yearlings Two year olds 0.30 (0.1) Adults 0.91 (0.1) 0.30 (0.1) Older adults 0.70 (0.1) 0.30 (0.1) Twinning rate is expressed as a proportion of parturient animals. The parturition rate was set to 0.0 for females age
66 Moose - general Model Parameters Age of Maturity 2.5 years 30% at 1.5 years 70% at 2.5 years Pregnancy rate Up to 97% Yearlings 30% 2-11years old 91% 11 year old 70% Twinning rate Up to 80%, Typically 25-50% Yearlings 0% 2 years 30% Fecundity rate (calves born per female) Annual Recruitment rate (calves surviving per female) Adult female survival rate (without hunting) Potential population growth rate (Lambda) Up to Up to 1.00, Highly variable year to year Commonly to 98%, Typically about 90% Up to 1.40 Commonly Weighted: 88%
67 Model Input Parameters - check Winter survey data from western Manitoba: Calf:cow ratio = 0.56 Bull:cow ratio = 0.66 Literature: annual adult female survival of 0.88 to 0.92; 50:50 sex ratio at birth. 67
68 Model Results: GHA 14 Model Type No Harvests Licenced Harvest No Harvests Licenced Harvest Other Mortality No Harvests Licenced Harvest Other Mortality MCWS Initial MCWS Final Annual Licensed Other Annual Modelled Time Span Pop Estimate * Pop Estimate Harvest (%) Mortality Population Result ,560 2, , ,560 2, , , , , , , (329) (329) (329)
69 Model Results: Other Mortality MCWS Initial MCWS Final Annual Licensed Other Annual Modelled Model Type Time Span Pop Estimate * Pop Estimate Harvest (%) Mortality Population Result GHA GHA 13/13A ,118(745) GHA 13/13A , GHA 14/14A , GHA 14/14A (329) GHA 18-18C GHA 18-18C (2044) GHA 18-18C
70 Survey Data & Model Discussion Moose recruitment rate is high (MCWS surveys) High recruitment rates are associated with low predation rates (literature) Given normal adult survival, populations should be growing (model) Observed population decline requires high and persistent additional source (s) of mortality (model) 70
71 Survey data are inconsistent with high predation rates (i.e., recruitment is high) No evidence for disease related mortality Models accounted for winter tick mortality Models accounted for maximum effect of licensed hunting (non-selective harvest model) Unknown other mortality rate is high By process of elimination non-licensed hunting is best working hypothesis Plausible additive effect of access related mortality from Bipole III (hunting or predation) is insignificant by comparison. 71
72 Moose Response The contribution of predation facilitated by increased access resulting in direct moose population decline is limited. several examples of positive moose population response in highly fragmented and accessible habitats are found in Manitoba, Saskatchewan and Ontario. Crichton (2004) documented a positive increase in the Happy Lake area moose population following intensive access development and forest harvest through access management and hunting closures. A similar but less dramatic increase was also observed in the Beaver Creek area of eastern Manitoba where access was managed and hunting remained open (MCWS ). 72
73 Moose Response Saskatchewan monitored effectiveness of road management and wildlife refuges in forest harvest areas to protect moose from over hunting and documented increases in local moose populations after both large area and road corridor game preserves were established (pers. comm. E. Kowal, 2013). Rempel et al., 1997 illustrated that moose population rate of increase was positive in unmodified clear-cut areas and remained constant in modified clearcuts, which was thought to be a consequence of hunting. In all examples, hunting of moose was considered to be the main variable in explaining moose response with no documented effects or concern regarding increased predation by wolves as a result of increased access and fragmentation. 73
74 Conclusions Based on the analysis conducted, no threshold of linear density or habitat metric could be determined to explain moose decline. Increase of linear density in GHA s 12, 14 or 19A as a result of Bipole III are minimal and well below linear density thresholds found in the literature for ecosystem maintenance and moose management. I.E. Salmo et al. (2004) - Critical Threshold = 0.9 compared to cumulative effect calculations of 0.14 (GHA 14) and 0.36 (GHA 14A-19A). 74
75 Conclusions Moose Meadows The GHA 14 (Moose Meadows) segment of the AFPR has 35.0 km 2 (21.98%) of high quality moose habitat within the Local Study Area (LSA) 3 mile corridor; km 2 (1.11%) of this moose habitat within the LSA is within the 66 m ROW. Compared to the FPR (6.59 km 2 within the LSA) the AFPR contains considerably more (28 km 2 ) of high quality moose habitat. Based on the results of the aerial survey conducted between December 4 and 6, 2012, the AFPR compared to the FPR will intersect or come in proximity to additional areas of high moose density which are in proximity to existing access. 75
76 Conclusions GHA 19A and 14A The GHA 19A and 14A segment of the AFPR has km 2 of high quality moose habitat within the LSA and 1.96 km 2 within the 66 m ROW. The amount of high quality habitat within the FPR LSA is comparable to the AFPR ( km 2 high quality moose habitat). Based on the results of the aerial survey conducted between February 4 th, 2013, the AFPR compared to the FPR intersects less areas of observed moose. Additional specific mitigation measures for 8 kilometres of the FPR have been identified by Manitoba Hydro to further reduce potential impacts to moose in GHA 19A and 14A. 76
77 Conclusions Based on the results of the enhanced analysis and proposed (and enhanced) mitigation, the conclusions in the EIS remain consistent with those predictions in the original Bipole III EIS, Bipole III Mammal Technical Report, and the Route Adjustment Supplemental Report for the Bipole III Transmission Line Project. The residual effects on moose resulting from the project (AFPR / FPR) are not significant Page
Project 4 Wildlife Technical Report. Lake. Winnipeg. Project 4 WTR. Ecological Land Classification in the Project 4 Study Area
 Ecoregion Number and Ecodistrict Name 90, Berens River 90, Wrong Project 1: PR304 to Berens River Project 4: to Transmission Line Ecodistricts: Government of Canada, Agriculture and Agri-Food Canada, Ecological
2009 WMU 525 Moose. Section Authors: Nathan Carruthers and Dave Moyles
 2009 WMU 525 Moose Section Authors: Nathan Carruthers and Dave Moyles Suggested Citation: Carruthers, N. and D. Moyles. WMU 525 Moose. Pages 78 83. In: N. Webb and R. Anderson. Delegated aerial ungulate
2010 Wildlife Management Unit 347 moose
 2010 Wildlife Management Unit 347 moose Photo: Curtis Stambaugh Section Authors: Curtis Stambaugh and Corey Rasmussen Suggested Citation: Stambaugh, C., and C. Rasmussen. 2010. Wildlife Management Unit
RE: Bipole III Transmission Project Information Request #1 Caribou
 PO Box 7950 Stn Main Winnipeg, Manitoba Canada R3C 0J1 (204) 360-4394 sjohnson@hydro.mb.ca June 18, 2012 Ms. Cathy Johnson Secretary, Clean Environment Commission 305-155 Carlton St. Winnipeg, MB R3C 3H8
2010 Wildlife Management Unit 358 moose
 2010 Wildlife Management Unit 358 moose Photo: Dave Stepnisky Section Authors: Dave Stepnisky and Robb Stavne Suggested Citation: Stepnisky, D., and R. Stavne. 2010. Wildlife Management Unit 358 moose.
MOOSE POPULATION SURVEY. Tetlin National Wildlife Refuge Game Management Unit 12, eastern Alaska
 MOOSE POPULATION SURVEY Tetlin National Wildlife Refuge Game Management Unit 12, eastern Alaska H.K. Timm, USFWS Progress Report 04-02 March 8, 2004 Gail H. Collins W. N. Johnson Henry K. Timm U. S. Fish
2010 Wildlife Management Unit 347 moose
 2010 Wildlife Management Unit 347 moose Photo: Curtis Stambaugh Section Authors: Curtis Stambaugh and Corey Rasmussen Stambaugh, C., and C. Rasmussen. 2012. Wildlife Management Unit 347 moose. Pages 54-57.
2009 WMU 349 Moose. Section Authors: Curtis Stambaugh and Nathan Webb
 2009 WMU 349 Moose Section Authors: Curtis Stambaugh and Nathan Webb Suggested Citation: Stambaugh, C. and N. Webb 2009. WMU 349 Moose. Pages 58 62. In: N. Webb and R. Anderson. Delegated aerial ungulate
Spatial Graph Theory for Cross-scale Connectivity Analysis
 Spatial Graph Theory for Cross-scale Connectivity Analysis Andrew Fall School of Resource and Environmental Management, SFU and Gowlland Technologies Ltd., Victoria, BC Acknowledgements Marie-Josée Fortin,
2010 Wildlife Management Unit 340 moose
 2010 Wildlife Management Unit 340 moose Photo: Shevenell Webb Section Authors: Dave Hobson, Kirby Smith, and Shevenell Webb Hobson, D., K. Smith, and S. Webb. 2012. Wildlife Management Unit 340 moose.
LOCAL KNOWLEDGE BASED MOOSE HABITAT SUITABILITY ASSESSMENT FOR THE SOUTH CANOL REGION, YUKON. Prepared by: Tess McLeod and Heather Clarke
 LOCAL KNOWLEDGE BASED MOOSE HABITAT SUITABILITY ASSESSMENT FOR THE SOUTH CANOL REGION, YUKON Prepared by: Tess McLeod and Heather Clarke September 2017 LOCAL KNOWLEDGE BASED MOOSE HABITAT SUITABILITY ASSESSMENT
2013 Aerial Moose Survey Final Results
 2013 Aerial Moose Survey Final Results Glenn D. DelGiudice, Forest Wildlife Populations and Research Group Introduction Each year, we conduct an aerial survey in northeastern Minnesota in an effort to
Through their research, geographers gather a great deal of data about Canada.
 Ecozones What is an Ecozone? Through their research, geographers gather a great deal of data about Canada. To make sense of this information, they often organize and group areas with similar features.
Spring Composition of the Ahiak and Beverly Herds, March 2008
 Spring Composition of the Ahiak and Beverly Herds, March 2008 D. Johnson and J. Williams Environment and Natural Resources Government of the Northwest Territories 2013 Manuscript Report No. 232 The contents
Bipole III Transmission Project Construction Environmental Protection Plan Construction Section N2 Environmentally Sensitive Site Locations Map 81
 ± DOCUMENT PATH: G :\_GIS_PROJECT_FOLDER\00_HYDRO\111440054_BPIII_EPP\ARCMAP\ESS_N2\BPIII_CENVPP_N1N2N3N4C1SECTIONBASEMAP_MAPBOOK_BTB_STANTEC_20131201.MXD 196 Coordinate System: UTM Zone NAD83 Data Source:
Assessing caribou survival in relation to the distribution and abundance of moose and wolves
 Assessing caribou survival in relation to the distribution and abundance of moose and wolves Final report May 2017 Prepared for the BC Oil and Gas Research and Innovation Society (BC OGRIS) Prepared by
SCHEDULE A WILDLIFE DIVISION CUT BLOCK RESTRICTIONS FOR NEWFOUNDLAND MARTEN CORE AREAS
 SCHEDULE A WILDLIFE DIVISION CUT BLOCK RESTRICTIONS FOR NEWFOUNDLAND MARTEN CORE AREAS DISTRICT 2 COMMERCIAL These areas also have additional restrictions: C0209 - This cut block intersects with Newfoundland
The Refugia Concept: Using Watershed Analysis to Prioritize Salmonid Habitat for Conservation and Restoration
 The Refugia Concept: Using Watershed Analysis to Prioritize Salmonid Habitat for Conservation and Restoration Christopher May Battelle & UW Cumulative Impacts of Urbanization Landscape Alterations Loss
Criteria for delineating a new boundary for the Fisher Bay Park Reserve, Manitoba
 1 Criteria for delineating a new boundary for the Fisher Bay Park Reserve, Manitoba R. A. Lastra Department of Botany, University of Manitoba, Winnipeg, MB, Canada, R3T 2N2 1. INTRODUCTION Historic park
Biomes. What is a Biome?
 Biomes What is a Biome? Ecosystems can be grouped into larger categories called biomes Biome A collection of ecosystems that are related to each other, usually based on the type of places they support
Bear Conservation. Recolonization. Reintroduction IDENTIFYING POTENTIAL COLONIZATION PATTERNS FOR REINTRODUCED BLACK BEAR POPULATIONS
 IDENTIFYING POTENTIAL COLONIZATION PATTERNS FOR REINTRODUCED BLACK BEAR POPULATIONS Jared Laufenberg Department of Forestry, Wildlife and Fisheries University of Tennessee Bear Conservation Distribution
Spatio-temporal Patterns of Wildlife Distribution and Movement in Canmore s Benchlands Corridor.
 Spatio-temporal Patterns of Wildlife Distribution and Movement in Canmore s Benchlands Corridor. March 2010 Prepared by Tracy Lee, Samantha Managh and Neil Darlow Prepared for: Alberta Tourism, Parks and
Extra Credit: due Thursday 28 September at 5pm as a.doc ed to Jake. Help session Tuesday 26 September.
 Main Points 1) Functional responses of predators -- prey switching and prey preferences -- Example: removing protected populations to save an endangered species -- apparent competition and the decline
HABITAT EFFECTIVENESS AND SECURITY AREA ANALYSES
 HABITAT EFFECTIVENESS AND SECURITY AREA ANALYSES ESGBP 194 12. HABITAT EFFECTIVENESS AND SECURITY AREA ANALYSIS Michael Gibeau As demands on the land increase, cumulative effects result from individually
2018 Aerial Moose Survey
 2018 Aerial Moose Survey Glenn D. DelGiudice, Forest Wildlife Populations and Research Group Introduction Each year we conduct an aerial survey in northeastern Minnesota to estimate the moose (Alces americanus)
Southwest LRT Habitat Analysis. May 2016 Southwest LRT Project Technical Report
 Southwest LRT Habitat Analysis Southwest LRT Project Technical Report This page intentionally blank. Executive Summary This technical report describes the habitat analysis that was performed to support
How does the greenhouse effect maintain the biosphere s temperature range? What are Earth s three main climate zones?
 Section 4 1 The Role of Climate (pages 87 89) Key Concepts How does the greenhouse effect maintain the biosphere s temperature range? What are Earth s three main climate zones? What Is Climate? (page 87)
Name: Section: Number:
 Name: Section: Number: 2 3 Vocabulary Word Definition competition p.114 parasite p.117 host p.117 succession p.118 extinct p.120 endangered p.120 hazardous waste p.126 4 5 6 7 Lesson 1: How are ecosystems
Moose Day Summary Report 8th Annual February 27th, 2016
 Moose Day Summary Report 8th Annual February 27th, 2016 Photo taken by Kathy McCurdy. Moose Day 2016 Prepared by: Paul Hood and Alyson Courtemanch Jackson Hole Wildlife Foundation Nature Mapping Jackson
Huron Creek Watershed 2005 Land Use Map
 Huron Creek Watershed 2005 Land Use Map Created By: Linda Kersten, 12/20/06 Created For: MTU Introduction to GIS Class (FW 5550) The Huron Creek Watershed Advisory Committee Michigan Technological University,
Relationship between weather factors and survival of mule deer fawns in the Peace Region of British Columbia
 P E A C E R E G I O N T E C H N I C A L R E P O R T Relationship between weather factors and survival of mule deer fawns in the Peace Region of British Columbia by: Nick Baccante and Robert B. Woods Fish
Land Accounts - The Canadian Experience
 Land Accounts - The Canadian Experience Development of a Geospatial database to measure the effect of human activity on the environment Who is doing Land Accounts Statistics Canada (national) Component
Wildlife and Traffic in the Carpathians
 Wildlife and Traffic in the Carpathians How to solve the problem between green and gray infrastructure Václav Hlaváč TRANSGREEN Kick-off Meeting Vienna, 28 February 2 March 2017 Nature Conservation Agency
Name Hour. Chapter 4 Review
 Name Hour Chapter 4 Review 1. The average, year-after-year conditions of temperature and precipitation within a particular region are its weather. climate. greenhouse effect. d. biotic factors. 2. The
Ecology of Boreal Woodland Caribou in the Lower Mackenzie Valley, NT:
 Ecology of Boreal Woodland Caribou in the Lower Mackenzie Valley, NT: Work Completed in the Inuvik Region April 2003 to November 2004 Prepared by: John A. Nagy A, Denise Auriat B, Wendy Wright A, Todd
Figure 2.5 Flood Risk At Crossing
 6th MER 7 6 5 4 3 2 1 0 9 8 7 6th MER Figure 2.4 7 6 5 4 3 2 1 0 9 8 7 7 2001 ALBERTA NEWSPRINT COMPANY All rights reserved. 7 6 Figure 2.5 Risk At Crossing 6th MER 6th MER 6 5 5 4 4 3 3 2 2 1 1 0 0 9
WMU 531 Aerial Moose (Alces alces) Survey February Traci Morgan, Wildlife Technician & Todd Powell, Senior Wildlife Biologist
 Survey February Traci Morgan, Wildlife Technician & Todd Powell, Senior Wildlife Biologist") WMU 531 Aerial Moose (Alces alces) Survey February 2009 Traci Morgan, Wildlife Technician & Todd Powell, Senior Wildlife Biologist Alberta Sustainable Resource Development Wildlife Division Fort McMurray,
WMU 531 Aerial Moose (Alces alces) Survey February 2009 Traci Morgan, Wildlife Technician & Todd Powell, Senior Wildlife Biologist Alberta Sustainable Resource Development Wildlife Division Fort McMurray,
Moose Stratified Block Census, Management Unit 8-5, Okanagan Region, February 2005
 Moose Stratified Block Census, Management Unit 8-5, Okanagan Region, February 2005 by Les W. Gyug, R.P.Bio. Okanagan Wildlife Consulting 3130 Ensign Way Westbank, B.C. V4T 1T9 Prepared for B.C. Ministry
Bipole III Transmission Project Construction Environmental Protection Plan Construction Section N1 Environmentally Sensitive Site Locations Map 25
 ± DOCUMENT PATH: G :\_GIS_PROJECT_FOLDER\00_HYDRO\111440054_BPIII_EPP\ARCMAP\ESS_N1\BPIII_CENVPP_N1N2N3N4C1SECTIONBASEMAP_MAPBOOK_BTB_STANTEC_20131207.MXD N1-S11 Tower 10 E-723206, N-6272609 N1-Soils-154
TESTING FUNCTIONAL RESTORATION OF LINEAR FEATURES PHASE I PROGRESS REPORT WITHIN BOREAL CARIBOU RANGE
 TESTING FUNCTIONAL RESTORATION OF LINEAR FEATURES WITHIN BOREAL CARIBOU RANGE PHASE I PROGRESS REPORT Craig DeMars, Ph.D., Department of Biological Sciences, University of Alberta, and Alberta Biodiversity
Lecture 24 Plant Ecology
 Lecture 24 Plant Ecology Understanding the spatial pattern of plant diversity Ecology: interaction of organisms with their physical environment and with one another 1 Such interactions occur on multiple
Environmental. Plan Update. By Jodie Pavlica
 E i t l and d Environmental Recreational Analysis Snake Salt Basin Plan Update By Jodie Pavlica i for f oday s d Presentation P t ti opics 1. 2. 3. 4. 5. 6. Recreational and Environmental Uses in the Last
Define Ecology. study of the interactions that take place among organisms and their environment
 Ecology Define Ecology Define Ecology study of the interactions that take place among organisms and their environment Describe each of the following terms: Biosphere Biotic Abiotic Describe each of the
¾À 280. ESS Features Heritage. Points of Access* !( Proposed Access Point. !( Archaeological Water. Major Stream Crossing Abandoned Rail Crossing # #
 ± DOCUMENT PATH: G :\_GIS_PROJECT_FOLDER\00_HYDRO\111440054_BPIII_EPP\ARCMAP\ESS_N1\BPIII_CENVPP_N1N2N3N4C1SECTIONBASEMAP_MAPBOOK_BTB_STANTEC_20131207.MXD 386 N1-S30 385 BURNTWOOD RIVER Coordinate System:
WMU 512 Crow Lake Aerial Moose (Alces alces) Survey January Grant Chapman, Wildlife Biologist & Justin Gilligan, Wildlife Monitoring Biologist
 Survey January Grant Chapman, Wildlife Biologist & Justin Gilligan, Wildlife Monitoring Biologist") WMU 512 Crow Lake Aerial Moose (Alces alces) Survey January 2013 Grant Chapman, Wildlife Biologist & Justin Gilligan, Wildlife Monitoring Biologist Alberta Environment and Sustainable Resource Development
WMU 512 Crow Lake Aerial Moose (Alces alces) Survey January 2013 Grant Chapman, Wildlife Biologist & Justin Gilligan, Wildlife Monitoring Biologist Alberta Environment and Sustainable Resource Development
Chapter 6 Reading Questions
 Chapter 6 Reading Questions 1. Fill in 5 key events in the re-establishment of the New England forest in the Opening Story: 1. Farmers begin leaving 2. 3. 4. 5. 6. 7. Broadleaf forest reestablished 2.
BIOLOGY WORKSHEET GRADE: Two robins eating worms on the same lawn is an example of
 BIOLOGY WORKSHEET GRADE: 11 Q.1: Choose the letter of the best answer. 1. Two robins eating worms on the same lawn is an example of a. mutualism. b. commensalism. c. competition. d. parasitism. 2. Predation
Name Hour. Section 4-1 The Role of Climate (pages 87-89) What Is Climate? (page 87) 1. How is weather different from climate?
 What Is Climate? (page 87) 1. How is weather different from climate?") Name Hour Section 4-1 The Role of Climate (pages 87-89) What Is Climate? (page 87) 1. How is weather different from climate? 2. What factors cause climate? The Greenhouse Effect (page 87) 3. Circle the
Name Hour Section 4-1 The Role of Climate (pages 87-89) What Is Climate? (page 87) 1. How is weather different from climate? 2. What factors cause climate? The Greenhouse Effect (page 87) 3. Circle the
Biosphere Biome Ecosystem Community Population Organism
 Ecology ecology - The study of living things and how they relate to their environment Levels of Organization in Ecology organism lowest level one living thing population collection of organisms of the
SIF_7.1_v2. Indicator. Measurement. What should the measurement tell us?
 Indicator 7 Area of natural and semi-natural habitat Measurement 7.1 Area of natural and semi-natural habitat What should the measurement tell us? Natural habitats are considered the land and water areas
Main Points. Test #1 Thursday 1 October minutes for questions on Test #1 Tuesday 29 September.
 Main Points 1) Predation as a driver of ecological communities -- experiments in ecology -- top-down vs bottom-up regulation of populations -- example: apparent competition in northern ungulates -- example:
Snowtrack surveys for Canada lynx presence in Minnesota west of Highway 53
 Snowtrack surveys for Canada lynx presence in Minnesota west of Highway 53 2005 Annual Report to Minnesota Department of Natural Resources Ronald Moen, Ph.D. Gerald Niemi, Ph.D. Julie Palakovich Christopher
Chapter 6 Population and Community Ecology. Thursday, October 19, 17
 Chapter 6 Population and Community Ecology Module 18 The Abundance and Distribution of After reading this module you should be able to explain how nature exists at several levels of complexity. discuss
GREATER SAGE-GROUSE HABITAT SUITABILITY ANALYSIS IN GRAND TETON NATIONAL PARK, WYOMING, USA Jean Edwards
 GREATER SAGE-GROUSE HABITAT SUITABILITY ANALYSIS IN GRAND TETON NATIONAL PARK, WYOMING, USA Jean Edwards INTRODUCTION AND PURPOSE The greater sage-grouse (Centrocercus urophasianus) is a large game bird
White-tailed Deer Winter Severity Index Volunteer Winter Weather Monitors Required
 Weather Monitoring White-tailed Deer Winter Severity Index Volunteer Winter Weather Monitors Required The Manitoba Wildlife Federation, in partnership with Manitoba Sustainable Development - Wildlife and
Forest Investment Account Seral Stage and Patch Size Distribution Analysis
 Forest Investment Account Seral Stage and Patch Size Distribution Analysis Submitted to PricewaterhouseCoopers By Mill & Timber Products Ltd. Box 106, Port Hardy, BC, V0N 2P0 Contact Person: Ione Brown,
BIOMES. Copyright Cmassengale
 BIOMES Continental drift - slow motion of continents Dispersal of organisms Movement of organisms from 1 place to another Dispersal is usually caused by wind, water or living things Species that evolve
WOOD SUPPLY ANALYSIS REPORT SASKATCHEWAN RIVER FOREST SECTION
 WOOD SUPPLY ANALYSIS REPORT SASKATCHEWAN RIVER FOREST SECTION Effective April 1 st, 2015 Photo Credit: Mike Paddock Table of Contents 1 INTRODUCTION... 11 2 PROVINCIAL POLICY AND MANDATE... 11 3 RESOURCE
Landform Regions of Canada
 Landform Regions of Canada The movement of the earth s plates, and the resulting folding, faulting, and volcanic activity, have combined with the forces of erosion and weathering to create a variety of
IUCN Red List Process. Cormack Gates Keith Aune
 IUCN Red List Process Cormack Gates Keith Aune The IUCN Red List Categories and Criteria have several specific aims to provide a system that can be applied consistently by different people; to improve
Section A: Multiple choice (30 Marks)
") Grade 7 Science Unit 1 SAMPLE TEST Section A: Multiple choice (30 Marks) 1. Which term defines a group of interacting living and non-living things? A. community B. ecosystem C. habitat D. niche 2. Which
Grade 7 Science Unit 1 SAMPLE TEST Section A: Multiple choice (30 Marks) 1. Which term defines a group of interacting living and non-living things? A. community B. ecosystem C. habitat D. niche 2. Which
PROGRESS REPORT for COOPERATIVE BOBCAT RESEARCH PROJECT. Period Covered: 1 January 31 May Prepared by
 PROGRESS REPORT for COOPERATIVE BOBCAT RESEARCH PROJECT Period Covered: 1 January 31 May 2011 Prepared by John A. Litvaitis, Derek Broman, and Marian K. Litvaitis Department of Natural Resources University
Evaluating Wildlife Habitats
 Lesson C5 4 Evaluating Wildlife Habitats Unit C. Animal Wildlife Management Problem Area 5. Game Animals Management Lesson 4. Evaluating Wildlife Habitats New Mexico Content Standard: Pathway Strand: Natural
H IGHWAY 3 WILDLIFE MORTALITY
 Miistakis Institute for the Rockies H IGHWAY 3 WILDLIFE MORTALITY CONTENTS Introduction 1 Methods 2 Data Limitations 3 Results 3 Discussion 8 Special points of interest: The analysis includes mortality
Appendix III. Grizzly Bear Habitat Analysis, MPB Harvest Plan
 Sundance Forest Industries Ltd. Appendices (Revised) Appendix III. Grizzly Bear Habitat Analysis, MPB Harvest Plan 14 Feb. 2008 Jerome Cranston, Foothills Model Forest Grizzly Bear Research Program 1.
A Small Migrating Herd. Mapping Wildlife Distribution 1. Mapping Wildlife Distribution 2. Conservation & Reserve Management
 A Basic Introduction to Wildlife Mapping & Modeling ~~~~~~~~~~ Rev. Ronald J. Wasowski, C.S.C. Associate Professor of Environmental Science University of Portland Portland, Oregon 8 December 2015 Introduction
Ski touring and fauna: which interactions?
 Ski touring and fauna: which interactions? Antoine DUPARC Workshop "Wildlife and winter sport activities" Lescheraines March 4th 2016 Increase of interaction human/fauna Increase of human activities all
BIOS 230 Landscape Ecology. Lecture #32
 BIOS 230 Landscape Ecology Lecture #32 What is a Landscape? One definition: A large area, based on intuitive human scales and traditional geographical studies 10s of hectares to 100s of kilometers 2 (1
BIOMES. Copyright Cmassengale
 BIOMES Biogeography - study of where organisms live Continental drift - slow motion of continents Dispersal of organisms Movement of organisms from 1 place to another Dispersal is usually caused by wind,
Statistical challenges in Disease Ecology
 Statistical challenges in Disease Ecology Jennifer Hoeting Department of Statistics Colorado State University February 2018 Statistics rocks! Get thee to graduate school Colorado State University, Department
Population Ecology NRM
 Population Ecology NRM What do we need? MAKING DECISIONS Consensus working through views until agreement among all CONSENSUS Informed analyze options through respectful discussion INFORMED DECISION Majority
Biomes, Populations, Communities and Ecosystems Review
 Multiple Choice Biomes, Populations, Communities and Ecosystems Review 1. The picture below is a school (group) of Jack fish. What type of distribution does this represent? A) Random B) Even C) Uniform
Abiotic Dominant Dominant Factors Plants Animals
 TERRESTRIAL BIOMES Abiotic Dominant Dominant Factors Plants Animals Tropical Rain Forest Hot & wet year round Ferns Woody vines Broad leaved evergreen trees Sloths Jaguars Monkeys Toucans Tropical Dry
Channel Assessments of Selected Watersheds within TFL 52
 Channel Assessments of Selected Watersheds within TFL 52 prepared for: West Fraser Mills Ltd. Quesnel, BC prepared by: John Berry, M.Sc., R.P.F. Victoria, BC Channel Assessments TFL 52 Summary SUMMARY
W-S1: WILDLIFE HABITAT USE AND MOVEMENT STUDY - DRAFT
 W-S1: WILDLIFE HABITAT USE AND MOVEMENT STUDY - DRAFT INTRODUCTION The (AEA) is preparing a License Application that will be submitted to the Federal Energy Regulatory Commission (FERC) for the Susitna-Watana
1 29 g, 18% Potato chips 32 g, 23% 2 30 g, 18% Sugar cookies 35 g, 30% 3 28 g, 19% Mouse food 27 g, 18%
 1. When testing the benefits of a new fertilizer on the growth of tomato plants, the control group should include which of the following? A Tomato plants grown in soil with no fertilizer B Tomato plants
Doug MacNearney, Caribou Program, fri Research, Hinton, Alberta,
 fri Research is a unique community of Partners joined by a common concern for the welfare of the land, its resources, and the people who value and use them. fri Research connects managers and researchers
Two Concerns for Managers of Polar Bear Populations in the Near Future
 Two Concerns for Managers of Polar Bear Populations in the Near Future Presentation to the Polar Bear Range States Meeting 24-26 October, 2011 Ian Stirling, PhD, FRSC on behalf of the IUCN Polar Bear Specialist
Putative Canada Lynx (Lynx canadensis) Movements across I-70 in Colorado
 Movements across I-70 in Colorado") Putative Canada Lynx (Lynx canadensis) Movements across I-70 in Colorado INTRODUCTION March 8, 2012 Jake Ivan, Mammals Researcher Colorado Parks and Wildlife 317 W. Prospect Fort Collins, CO 80526 970-472-4310
Putative Canada Lynx (Lynx canadensis) Movements across I-70 in Colorado INTRODUCTION March 8, 2012 Jake Ivan, Mammals Researcher Colorado Parks and Wildlife 317 W. Prospect Fort Collins, CO 80526 970-472-4310
4. Ecology and Population Biology
 4. Ecology and Population Biology 4.1 Ecology and The Energy Cycle 4.2 Ecological Cycles 4.3 Population Growth and Models 4.4 Population Growth and Limiting Factors 4.5 Community Structure and Biogeography
Summer 95% Utilization Distribution
 PROJECT # 0194096-0039 GIS # BAC-23-258c November 12 2013 115 0'0"W 105 0'0"W!. Kugluktuk Coronation Gulf Omingmaktok (Bay Chimo)!. Kiligiktokmik ) Arctic Circle Kingaok )!. Hannigayok () Aylmer Yellowknife!.
How does the physical environment influence communities and ecosystems? Hoodoos in Cappadocia, Turkey
 Biomes of the World How does the physical environment influence communities and ecosystems? Hoodoos in Cappadocia, Turkey ecosystems are shaped by: abiotic factors climate/weather space Rainfall Soil air
CONSERVATIONISTS COLLABORATE TO SAVE GIANT PANDAS
 CASE STUDY CONSERVATIONISTS COLLABORATE TO SAVE GIANT PANDAS SMITHSONIAN NATIONAL ZOOLOGICAL PARK In July 2005, many Americans were delighted by new reports about the birth and early development of Tai
Chapter 4 Ecosystems and Communities
 Chapter 4 Ecosystems and Communities 4-1 The Role of Climate In the atmosphere, temperature, precipitation, and other environmental factors combine to produce weather and climate. weather - day-to-day
Review of Policies Spring Road Restrictions (SRR), and Winter Seasonal Weights (WSW)... MCCC Meeting November 16, 2016
, and Winter Seasonal Weights (WSW)... MCCC Meeting November 16, 2016") Review of Policies Spring Road Restrictions (SRR), and Winter Seasonal Weights (WSW)............................... MCCC Meeting November 16, 2016 Objective and Outline of Today s Presentation Objective:
Review of Policies Spring Road Restrictions (SRR), and Winter Seasonal Weights (WSW)............................... MCCC Meeting November 16, 2016 Objective and Outline of Today s Presentation Objective:
Discuss the impact of biotic and abiotic factors on their environment and the significant ecological levels of organization.
 Learning Targets Discuss the impact of biotic and abiotic factors on their environment and the significant ecological levels of organization. Explain the difference between an organism s habitat and niche
Goals: Be able to. Basic conflict: Economic opportunity vs. Environmental quality. Human population is growing exponentially
 Goals: Be able to Describe the general history of biodiversity and extinctions on Earth. Discuss why species go extinct. Explain why predators generally need larger land area than herbivores. Describe
Chapter 6 Population and Community Ecology
 Chapter 6 Population and Community Ecology Friedland and Relyea Environmental Science for AP, second edition 2015 W.H. Freeman and Company/BFW AP is a trademark registered and/or owned by the College Board,
A. My name is Watsun Randolph and my business address is 45 Horner Street Warrenton
 DIRECT TESTIMONY OF WATSUN RANDOLPH ON BEHALF OF PIEDMONT ENVIRONMENTAL COUNCIL BEFORE THE STATE CORPORATION COMMISSION OF VIRGINIA CASE NOS. PUE-00-000 AND PUE-00-000 0 Q. PLEASE STATE YOUR NAME AND BUSINESS
Levels of Ecological Organization. Biotic and Abiotic Factors. Studying Ecology. Chapter 4 Population Ecology
 Chapter 4 Population Ecology Lesson 4.1 Studying Ecology Levels of Ecological Organization Biotic and Abiotic Factors The study of how organisms interact with each other and with their environments Scientists
Chapter 4 Population Ecology
 Chapter 4 Population Ecology Lesson 4.1 Studying Ecology Levels of Ecological Organization The study of how organisms interact with each other and with their environments Scientists study ecology at various
CHAPTER 14. Interactions in Ecosystems: Day One
 CHAPTER 14 Interactions in Ecosystems: Day One Habitat versus Niche Review! What is a habitat? All of the biotic and abiotic factors in the area where an organism lives. Examples: grass, trees, and watering
Conservation Plan for the Wood Turtle in the Northeastern United States. Mapping Guidelines
 Conservation Plan for the Wood Turtle in the Northeastern United States Mapping Guidelines Northeast Wood Turtle Working Group Supported in part by the USFWS Competitive State Wildlife Grant Program Overview:
Weather and Climate in Canada. October 2 nd, 2017
 Weather and Climate in Canada October 2 nd, 2017 Big Ideas How are climate and weather in Canada influenced by geography? How do weather and climate affect the lives of Canadians? Weather and Climate
Temperature. (1) directly controls metabolic rates of ectotherms (invertebrates, fish) Individual species
 directly controls metabolic rates of ectotherms (invertebrates, fish) Individual species") Temperature (1) directly controls metabolic rates of ectotherms (invertebrates, fish) Individual species (2) controls concentrations (3) is relatively predictable over and can provide a basis for species.
Temperature (1) directly controls metabolic rates of ectotherms (invertebrates, fish) Individual species (2) controls concentrations (3) is relatively predictable over and can provide a basis for species.
Environmental Science: Biomes Test
 Name: Date: Pd. VERSION 1 Environmental Science: Biomes Test 1. Eland are large herbivores with loose skin under the throat and neck. This patch of skin aids in lowering the body temperature when temperatures
Activity 5 Changes Ahoof?
 Activity 5 Changes Ahoof? Forces of Change >> Arctic >> Activity 5 >> Page 1 ACTIVITY 5 CHANGES AHOOF? COULD CLIMATE CHANGE AFFECT ARCTIC CARIBOU? Caribou or Reindeer? They are the same species, but called
Unit 6 Populations Dynamics
 Unit 6 Populations Dynamics Define these 26 terms: Commensalism Habitat Herbivory Mutualism Niche Parasitism Predator Prey Resource Partitioning Symbiosis Age structure Population density Population distribution
Grizzly Bear Value Summary April 2016
 Grizzly Bear Value Summary April 2016 The Cumulative Effects Framework (CEF) provides statutory decision-makers and resource managers with critical information for managing cumulative effects on CEF values
STATE OF MINNESOTA OFFICE MEMORANDUM. DATE: March 16, TO: John Williams, Regional Wildlife Manager, Bemidji (e-copy)
") STATE OF MINNESOTA OFFICE MEMORANDUM DATE: March 16, 2018 TO: John Williams, Regional Wildlife Manager, Bemidji (e-copy) FROM: Doug Franke, Area Wildlife Manager, Thief River Falls SUBJECT: 2018 NW MN
STATE OF MINNESOTA OFFICE MEMORANDUM DATE: March 16, 2018 TO: John Williams, Regional Wildlife Manager, Bemidji (e-copy) FROM: Doug Franke, Area Wildlife Manager, Thief River Falls SUBJECT: 2018 NW MN