KJ 2022 Spectroscopic Methods in Organic Chemistry Laboratory exercise Report
|
|
|
- Victor Riley
- 6 years ago
- Views:
Transcription

1 KJ 2022 Spectroscopic Methods in Organic Chemistry Laboratory exercise Report Audun F. Buene Silje Henriksen Pia Haarseth Alexander Asplin NTNU October 16, 2014
2 Contents 1 Introduction 3 2 Theory UV/VIS spctroscopy IR spectroscopy Mass Spectroscopy NMR spectroscopy Results UV/VIS IR MS NMR Experimental UV/VIS IR NMR MS Discussion 16 6 Conclusion 18 A UV/VIS spectrum B MS spectrum C IR spectrum D Collection of NMR spectrums II III V VI 2
3 1 Introduction This report is part of the compulsory laboratory exercise in the subject KJ 2022 Spectroscopic methods in organic chemistry at NTNU in the spring of The aim of this exercise is to elucidate the structure of an unknown compound. This is to be done using four spectroscopic methods: UV, IR, MS and NMR. The experiments will be carried out on the equipment mentioned, and the structure of the compound puzzled together piece by piece. From the experimental spectroscopy data, the unknown compound assigned to Group 2 was found to be mandelic acid. UV and IR didn t give any big clues, but from MS it was clear that mandelic acid was the only possible compound. Both 1 H NMR and 13 C NMR later confirmed that mandelic acid was the right decision. 3
4 2 Theory 2.1 UV/VIS spctroscopy UV-VIS spectroscopy is based on a compound s absorption of certain electromagnetic wavelengths in the visible spectrum as well as in the UV region of the electromagnetic spectrum. The reason for this absorption of energy is that electrons in π systems as well as non-bonding electrons may be exited to orbitals of higher energy. The normal excitation pattern is from a bonding π orbital (or non-bonding p orbital) to the anti-bonding π og σ. The bigger the gap between the HOMO and LUMO orbital, the shorter the wavelengths have to be for the light to excite the electrons. This means that if short wavelengths are required, the chemical bonds need a lot of energy to get excited. The energy of electromagnetic radiation E depends on the wavelength λ. E = h ν = h 1 λ (2.1) where ν is the frequency and h is the Planck constant. The energy can be absorbed as electronic, vibrational or rotational energy, which are the energies making up the total energy of a molecule. UV-VIS spectroscopy is particularly useful for compounds containing conjugated chromophores, such as dienes, aromatic rings and enones. However, for molecules not containing such systems, UV-VIS spectroscopy is useless and gives no information at all. The UV-VIS instrument works by sending electromagnetic radiation of different wavelengths through a cuvette containing the sample solution. The intensities of the radiation that makes it through is measured, and compared to a beam that has been sent through a reference cuvette. The way to do this in the instrument is usually solved in either of two ways. If the instrument is a double beam instrument, it has one lamp producing one beam, which is then split in two by a half mirror. The two beams are then sent through the sample and reference respectively. A 4
5 single beam instrument can not split the beam, and have to analyze the sample and the reference separately. The signal from the reference cuvette with the pure solvent is used as a measurement for the background signal which is assumed to be the same as for the incident beam for the sample cuvette. The transmittance is then calculated as the ratio of the intensity if the beam hitting the sample I equal to the one emerging from the reference and the intensity of the beam emerging from the reference cuvette I 0. T = I (2.2) I 0 Beer-Lamberts law can be used to predict the absorption for a certain compound. It was proposed in 1729 by Lambert and then improved by Beer in It also gives the relation between the inverse transmittance and the absorbance. A = εlc = log 10 (I/I 0 ) (2.3) where ε is the molar absorptivity of the solute, c is the conscentration of the solute, l is the lights pathlength through the cuvette. The Woodward-Fieser rules are a set of empirical rules for predicting the wavelength of maximum absorption λ max. In order to calculate this, one needs to know which chromophores are present in the molecule. Chromophores are the parts of the compound which are responsible for the colour, and in the Woodward-Fieser rules chromophores are generally functional groups. Auxochromes are substituents to the chromophore and change its absorption maxima. If the auxochrome moves the absorption maxima to a longer wavelength, it s called a bathochromic shift, in contrast to a hypsochromic shift where the maxima is moved to a shorter wavelength. 5
6 2.2 IR spectroscopy Infrared (IR) radiation refers to that part of the electromagnetic spectrum between the visible light and the microwave regions. Organic compounds will absorbe and convert infrared radiation between cm 1 into energy of molecular vibration, but the most interesting region is between cm 1. The whole molecule can vibrate or just some of the individual bonds or functional groups within the molecule. There are two types of molecular vibration: stretching and bending. It is only the vibrations that result in a change in the dipole moment that can be observed in the IR spectra. It is possible with both asymmetrical and symmetrical vibration. Since symmetrical vibrations doesn t result in a change of dipole moment, they are inactive in IR spectroscopy Fourier transform infrared spectroscopy Fourier transform infrared (FTIR) spectroscopy is a technique used to obtain an infrared spectrum. A beam of light containing the whole range of IR frequencies is passed through the sample, and measure how much of the beam is absorbed by the sample. A second beam, which has travelled a longer path length, is combined with the first beam and an interferogram is produced. A computer uses Fourier transformation to convert this interferogram into a plot of absorption against frequency Sample preparation Infrared spectra may be obtained for liquids, solids and gases. Liquids can either be examined neat or in solutions. If it is examined neat, a few drops of the liquid is placed between two sodium chloride plates and the spectrum can be recorded. Both liquids and solids can be dissolved in a solvent. The solution is placed in an IR solution cell which consists of two rectangular sodium chloride plates. IR spectra for solids can also be recorded in the form of a KBr disk. The sample is mixed with potassium bromide and is exposed for a very high pressure with the use of a hydraulic press. This high pressure causes potassium bromide to become fluid and the result is a KBr disk containing the solid sample. Potassium bromide 6
7 is transparent throughout the IR range and therefore doesn t interfere with the spectra. 2.3 Mass Spectroscopy The concept of mass spectrometry is that a compound is ionized and the ions are separated based on their mass/charge ratio, and the number of ions representing each mass/charge unit is plotted as a spectrum. The spectrum will consist of x- axis with mass/ratio and intensity of the mass/ratio units at the y-axis. The mass spectrometry instrument consist of sample introduction, ionization method, mass analyzer/ion separation method and detector. Some instruments have direct insertion of the sample into the ionization chamber. There are different types of ion sources, one example is electron impact ionization. In the electron impact ionization method the mass spectrometer bombards molecules in vapour phase with a high-energy electron beam. This result in the ejection of an electron from the sample molecule to produce a radical cation, molecular ion. Molecular ion, M +, then represents the intact molecule with one less electron which is removed by the electron beam. The smaller ions are fragments of the molecular ion. The molecular ion is fragmented because of excess energy recieved from the bombarding electron. Covalent bonds in the molecular ion breaks in predictable patterns and is useful in the identification of an unknown compound. The detector consist of collimating slits that direct only one set of ions at a time into a collector where they are detected and amplified by an electron multiplier. The signals are saved and plotted. The fragmentation pattern and the molecular ions are helpful in the identification of an unknown compound. From the molecular ion you find the molecular mass of the compound. From the different fragments it is possible to find the different units the compound consist of and how the compound is constructed. The most 7
8 intense peak in the spectra is called the base peak (100%) and the other fragments are measured in percentage to this base peak. Often the base peak is the molecular ion, this is however only when there are no fragments that are more stable than the molecular ion. The molecular ion is usually the peak with the highest m/z value. The probability that a given bond will be cleaved is related to the strength of the bond, to the possibilty of low energy transition, and to the stability of the formed fragments. There are some general signal and fragment patterns listed below: For straight-chained compounds the relative height of M + is greatest, and the height decreases with the degree of branching in the molecule. With an increasing molecular weight in a homologous series, the relative height of M + decreases accordingly. Cleavage is favored at the alkyl-substituted carbon. The more substituted, the more likely is a cleavage. Generally the largest substituent is removed first, then the subsituent leaves as a radical. The double bonds, cyclic structures and aromatic systems stabilize the molecular ion. Allylic cleavage is favored for double bonds, because the allylic carbocation is resonance-stabilized. Saturated rings generally lose their alkyl side chains at the α position. In alkyl substituted aromatic compounds there is often a cleavage at the bond β to the ring, since this gives a resonance-stabilized ion. The carbon-carbon bond next to a heteroatom is easily cleaved. The charge is then left on the fragment containing the heteroatom. Elimination of small, neutral molecules often result in cleavage. Example of such small neutral molecules are carbon monoxide or water. 8
9 A computer calculate the molecular formula for the analyzed compound. From the calculated molecular formula the index of hydrogen deficiency (IHD) can be found using Equation (2.4) relating it the the chemical formula C n H m X X N y O z. The hydrogen deficency index is the number of hydrogen molecules missing from the linear saturated version of the compound. From the hydrogen deficency one therefore find if and how many multiple bonds and rings the compound contain. IHD = n m 2 x 2 + y (2.4) 2.4 NMR spectroscopy Nuclear magnetic resonance (NMR) is an absorption spectrometry. A sample can absorb electromagnetic radiation in the radio frequency region when it is in a magnetic field. A plot of the frequencies of the absorption peaks against peak intensities is a NMR spectra, and it provides more information about the molecular structure than any other spectroscopic method. All nuclei carry a charge, and if this charge spins on the nuclear axis a magnetic dipole will be generated. Nuclear angular momentum is related to quantum spin number I. These numbers can have values of 0, 1/2, 1, 3/2 and so on. All isotopes that contain an odd number of protons and/or neutrons, such as hydrogen, nitrogen and carbon-13, will have half-integer spin quantum number and will be NMR active. It is the atomic nuclei that absorbs the electromagnetic radiation. This results in change in the angular momentum. After some time the atomic nuclei will relax back to ground state of angular momentum while emitting electromagnetic radiation. This radiation is measured and plotted in the NMR spectra Chemical shift Protons in a molecule is shielded by its electron cloud to a very small extent. The intensities of the shielding varies with the chemical environment that leads to differences in chemical shift positions. The degree of shielding depends on the density of the circulating electrons and the inductive effect of other groups attached to the carbon molecule. The difference in the absorption position of a proton from 9
10 the absorption position of a reference proton is called the chemical shift of the proton Spin coupling Spin coupling is a phenomenon caused by coupling of proton spins through the intervening bonding electrons. This spin coupling results in multiplets in the NMR spectra. The number of peaks in a multiplet is n+1, where n is the number of hydrogen atoms at the neighbouring carbon atoms. Spin coupling is typical for 1 H NMR NMR spectra There are different types of NMR spectra, for example 1 H NMR, 13 C NMR, HSQC, HMBC and COSY. They can be further divided in to one dimensional and two dimensional spectra. The one dimensional 1 H NMR spectra illustrate what type of chemical environment the different hydrogen atoms have in the compound. 13 C NMR is similar to 1 H NMR except that in 13 C NMR the spin coupling is not expressed. The two dimensional spectra is otained by preforming sevral one dimensional analysis and plotting them together. COSY stands for Correlation spectroscopy. In COSY spectra coupling between hydrogen atoms in the compound is displayed. HSQC stands for Heteronuclear single quantum coherence. In HSQC NMR the coupling between carbon atoms and hydrogen atoms displayed. HMBC stands for Heteronuclear multiple bond correlation. In HMBC spectra coupling between carbon atoms and hydrogen atoms two to four carbons away from the given carbon. COSY, HSQC and HMBC are all two dimensional methods/analysis. 10
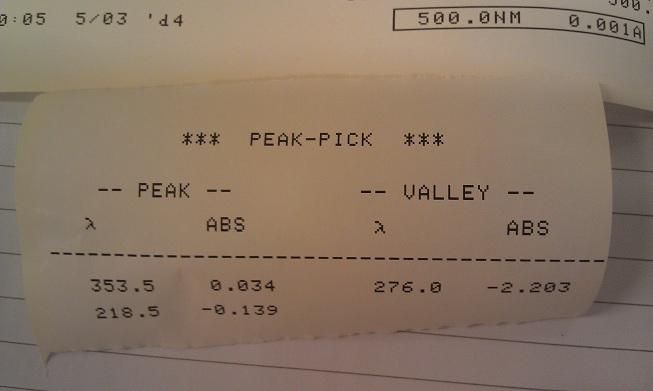
11 3 Results 3.1 UV/VIS The UV/VIS-spectroscopy analysis revealed a very weak absorption for the unknown compound, and the λ max was observed at 354 nm. The absorption spectrum is attached as Appendix A. 3.2 IR The diamond tip FTIR spectroscopy experiment gave an absorption spectrum attached as Appendix C. The spectrum gave the following absorption for the unknown compound. IR (diamond tip, cm 1 ): (O-H stretch), (ν as (CH) stretch), (C=0 stretch), (C-C stretch), (C- C stretch), (C-O stretch, COOH), (C-C stretch), (C-O stretch, sec. alc.), (C-C aromatic stretch). 3.3 MS The MS spectrum is attached as Appendix B. The spectrum clearly shows the molecular ion peak at m/z. And from high resolution MS the molecular ion peak was determined to have a mass over charge ratio of exactly Which leaves two potential formulas: C 8 H 8 O 3 ( ) and CH 8 ON 6 S ( ). The most important peaks in the MS spectrum are explained in Table 3.1, and the important fragments are shown in Figure 3.1 and Figure
12 Table 3.1: List of peaks and assosiated fragments from the MS analysis. Peak m/z Fragment Comment Molecular ion Molecular ion M + Base peak COOH Loss of COOH group (m/z 45), usual clevage at α-carbon for aromatic carboxylic acids Strong peak C 6 H 7 Characteristic cluster from 77 to 79 derived from monoalkylbenzene, from benzyl alcohol Weaker peaks C 4 H 4 Loss of acetyl group from fenyl ion C 7 H 7 Tropylium ion usual fragment from alkyl substituted benzene C 7 H 5 O(Ph C O) Benzaldehyd cation Figure 3.1: Fragmentation patterns common for aromatic alcohol fragments. 12
13 Figure 3.2: Fragment responsible for the m/z signal in the MS spectrum. From the molecular formula, one can find the hydrogren defficiency index of the compound with Equation (2.4). For the unknown compound the calculation will be: IHD = This means that in order to fully saturate the molecule, one would have to add 5 molecules of H NMR The various NMR spectrums are attached as Appendix D. It is clear from the 13 C NMR spectrum that the compound has eight carbon atoms, the ortho and meta carbons being equivalent and showing higher intensities. The integrals from the 1 H NMR spectrum indicated that there are a ratio of 5 to 1 of aromatic hydrogens to aliphatic hydrogens. The following shifts were found from the 1 H NMR and the 13 C NMR spectrums. 1 H NMR (400 MHz, DMSO-d 6 ) δ: (m, 2H, CH), (m, 2H, CH), (m, 1H, CH), 5.02 (s, 1H, C-H). 13 C NMR (400 MHz, DMSO-d 6 ) δ: (1H, COOH), (1H, C), (2H, CH), (1H, CH), (2H, CH), (1H, CH). Table 3.2 shows the correlations found using HSQC, while Table 3.3 shows the correlations found using HMBC. The COSY spectrum gave little information because of extensive coupling between almost all the protons. 13
14 Table 3.2: Correlations found using HSQC found from 1 H NMR and 13 C NMR spectrums run at 400 MHz in DMSO-d 6 δ1 H [ppm] δ13 C [ppm] Table 3.3: Correlations found using HMBC found from 1 H NMR and 13 C NMR spectrums run at 400 MHz in DMSO-d 6 δ1 H [ppm] δ13 C [ppm]
15 4 Experimental 4.1 UV/VIS 2.5 mg of the unknown compound was dissolved in methanol and transferred to a volumetric flask. The solution was then diluted to 10 ml. 1 ml of the first solution was transferred to another 10 ml volumetric flask and diluted to 10 ml. This was done once again, so that three different dilutions of the compound had been prepared. After analysis, another two samples were prepared, with even stronger concentrations. The strongest of these concentrations (9.7 mg / 10 ml) gave barely visible UV absorption. 4.2 IR A spatula tip of compound was transferred to the diamond tip FTIR instrument. The diamond tip was lowered until it was touching the compound. The IR spectrum was obtained using a 32 smart scan setting. 4.3 NMR The compound was dissolved in deuturated DMSO, transferred to an NMR tube, placed in a spinner and then loaded into the NMR instrument. The full characterization of the compound was performed, giving 1 H NMR, 13 C NMR, HSQC, HMBC, COSY, DEPT 95, DEPT 135 spectrums. During a meeting in the NMR lab the NMR spectras were handed over from the supervisor for the NMR lab. 4.4 MS The MS spectrum was handed over from the superviser for the MS lab. The MS-spectrum was obtained with Thermo Quest MAT95X double focusing high resolution instrument using electron impact ionization (EI) at 70eV. 15
16 5 Discussion The low absorbance of the unknown compound was a bit unexpected, seeing that it has an aromatic ring. The π-system of the conjugated ring should be quite visible in UV/VIS spectroscopy, and the recorded λ max is higher than expected from our compound. The low absorbance might come from the UV/VIS machine possibly being broken on the day of the experiment. The most important information gathered from the UV/VIS spectrum is that the compound shows signs of absorbance. This indicates that there are some conjugated electrons present. From the IR spectrum there are a few more pieces of information to notice. The primary being that there is a sharp absorbance peak around 1710 cm 1. This is a very clear indication of a carbonyl group with the C=O stretching vibration. Also the absorbance at 2894 cm 1 might indicate a methine C-H stretching vibration, as well as the 3437 which might be an indication of an O-H stretching vibration. In the fingerprint region between 1500 and 500 cm 1 the IR spectrum shows a lot of absorption which is in correspondence with aromatic C-H stretching vibrations. From the high resolution MS spectrum the molecular ion peak gave the molecular mass of the unknown compound, , which corresponds well with C 8 H 8 O 3 ( ) and CH 8 ON 6 S ( ), where only the first is a real molecule. The base peak of [M-45] is characteristic for aromatic carboxylic acids, by cleavage at the α-carbon, and loss of a COOH group. The m/z peak comes from benzyl alcohol, which follows the fragmentation pattern shown in Figure 3.1. This explains the strong peaks at 79.1 m/z and 77 m/z as well. The m/z peak likely comes from loss of H 2 from the benzyl alcohol. The 90.1 m/z peak is usually strong in all alkyl substituted benzyl compounds, and is also clearly visible in our spectrum. The peaks in the MS spectrum is in accordance with already reported peaks for mandelic acid, as well as the spectrum [2]. None of the other possible structures with the same molecular formula coincide with the MS-spectrum 16
17 The unknown compound consist of eight carbon atoms, this can be seen in the 13 C NMR spectrum. In the spectrum there are six peaks, were two of them have very strong intensities, indicating that there are two equivalent carbons for each peak, so eight carbon atoms in total. A ratio of 5 to 1 of aromatic hydrogen to aliphatic hydrogen is found from the 1 H NMR spectrum. In the 1 H NMR the total integral of hydrogen atoms is 5 in the aromatic part of the spectrum and 1 in the aliphatic part of the spectrum. This indicates a ring with substitution in the ratio 5:1 hydrogen atoms. From the MS it is clear that there are 8 hydrogen atoms in the compound, the proton NMR only shows 6. Therefore one can conclude that there are two hydrogens bound through heteroatons, in this case oxygen atoms. The correlations between hydrogen and hydrogen atoms, and hydrogen and carbon atoms in the HSQC and HMBC spectra fits with the obtained structure. 17

18 6 Conclusion The structure of the unknown compound was initially found using the data for the molecular mass from the MS experiment as well as MS spectrums. The molecular weight was compared to a database, and mandelic acid was the only compound with a match. IR and NMR was used to confirm the results obtained from MS. The proposed structure with the assigned carbon and proton NMR shifts is shown in Figure 6.1. Figure 6.1: Structure of the unknown compound with the assigned carbon and proton NMR shifts 18
19 Trondheim, October 16, 2014 References [1] Silverstein, R., Webster, F. & Kiemle, D. Spectrometric Identification of Organic Compounds, 7th ed., John Wiley & Sons Inc., 2005, Hoboken, USA. [2] SDBSWeb : National Institute of Advanced Industrial Science and Technology, , CAS nr: I

20 A UV/VIS spectrum II
21 B MS spectrum III
22 IV
23 C IR spectrum V
24 D Collection of NMR spectrums VI
25 VII
26 VIII
27 IX
28 X
29 XI
Chapter 12 Mass Spectrometry and Infrared Spectroscopy
 Organic Chemistry, 6 th Edition L. G. Wade, Jr. Chapter 12 Mass Spectrometry and Infrared Spectroscopy Jo Blackburn Richland College, Dallas, TX Dallas County Community College District 2006, Prentice
Lecture 14 Organic Chemistry 1
 CHEM 232 Organic Chemistry I at Chicago Lecture 14 Organic Chemistry 1 Professor Duncan Wardrop February 25, 2010 1 CHEM 232 Organic Chemistry I at Chicago Mass Spectrometry Sections: 13.24-13.25 2 Spectroscopy
Advanced Pharmaceutical Analysis
 Lecture 2 Advanced Pharmaceutical Analysis IR spectroscopy Dr. Baraa Ramzi Infrared Spectroscopy It is a powerful tool for identifying pure organic and inorganic compounds. Every molecular compound has
CHM 223 Organic Chemistry I Prof. Chad Landrie. Lecture 10: September 20, 2018 Ch. 12: Spectroscopy mass spectrometry infrared spectroscopy
 M 223 Organic hemistry I Prof. had Landrie Lecture 10: September 20, 2018 h. 12: Spectroscopy mass spectrometry infrared spectroscopy i>licker Question onsider a solution that contains 65g R enantiomer
Infrared Spectroscopy: Identification of Unknown Substances
 Infrared Spectroscopy: Identification of Unknown Substances Suppose a white powder is one of the four following molecules. How can they be differentiated? H N N H H H H Na H H H H H A technique that is
(2) Read each statement carefully and pick the one that is incorrect in its information.
 Read each statement carefully and pick the one that is incorrect in its information.") Organic Chemistry - Problem Drill 17: IR and Mass Spectra No. 1 of 10 1. Which statement about infrared spectroscopy is incorrect? (A) IR spectroscopy is a method of structure determination based on the
Organic Chemistry - Problem Drill 17: IR and Mass Spectra No. 1 of 10 1. Which statement about infrared spectroscopy is incorrect? (A) IR spectroscopy is a method of structure determination based on the
2. Separate the ions based on their mass to charge (m/e) ratio. 3. Measure the relative abundance of the ions that are produced
 ratio. 3. Measure the relative abundance of the ions that are produced") I. Mass spectrometry: capable of providing both quantitative and qualitative information about samples as small as 100 pg (!) and with molar masses in the 10 4-10 5 kdalton range A. The mass spectrometer
I. Mass spectrometry: capable of providing both quantitative and qualitative information about samples as small as 100 pg (!) and with molar masses in the 10 4-10 5 kdalton range A. The mass spectrometer
Infrared Spectroscopy
 Infrared Spectroscopy Introduction Spectroscopy is an analytical technique which helps determine structure. It destroys little or no sample. The amount of light absorbed by the sample is measured as wavelength
OAT Organic Chemistry - Problem Drill 19: NMR Spectroscopy and Mass Spectrometry
 OAT Organic Chemistry - Problem Drill 19: NMR Spectroscopy and Mass Spectrometry Question No. 1 of 10 Question 1. Which statement concerning NMR spectroscopy is incorrect? Question #01 (A) Only nuclei
7a. Structure Elucidation: IR and 13 C-NMR Spectroscopies (text , , 12.10)
") 2009, Department of Chemistry, The University of Western Ontario 7a.1 7a. Structure Elucidation: IR and 13 C-NMR Spectroscopies (text 11.1 11.5, 12.1 12.5, 12.10) A. Electromagnetic Radiation Energy is
2009, Department of Chemistry, The University of Western Ontario 7a.1 7a. Structure Elucidation: IR and 13 C-NMR Spectroscopies (text 11.1 11.5, 12.1 12.5, 12.10) A. Electromagnetic Radiation Energy is
The rest of topic 11 INTRODUCTION TO ORGANIC SPECTROSCOPY
 The rest of topic 11 INTRODUCTION TO ORGANIC SPECTROSCOPY 1. Mass spectrometry: SPECTROSCOPIC TECHNIQUES - A technique capable of identifying the presence of various mass segments of organic molecules.
SPECTROSCOPY MEASURES THE INTERACTION BETWEEN LIGHT AND MATTER
 SPECTROSCOPY MEASURES THE INTERACTION BETWEEN LIGHT AND MATTER c = c: speed of light 3.00 x 10 8 m/s (lamda): wavelength (m) (nu): frequency (Hz) Increasing E (J) Increasing (Hz) E = h h - Planck s constant
12. Structure Determination: Mass Spectrometry and Infrared Spectroscopy
 12. Structure Determination: Mass Spectrometry and Infrared Spectroscopy Determining the Structure of an Organic Compound The analysis of the outcome of a reaction requires that we know the full structure
Welcome to Organic Chemistry II
 Welcome to Organic Chemistry II Erika Bryant, Ph.D. erika.bryant@hccs.edu Class Syllabus 3 CHAPTER 12: STRUCTURE DETERMINATION 4 What is this solution Soda Tea Coffee??? 5 What is this solution Soda Tea
ORGANIC SPECTROSCOPY NOTES
 - 1 - ORGANIC SPECTROSCOPY NOTES Basics of Spectroscopy UV/vis, IR and NMR are all types of Absorption Spectroscopy, where EM radiation corresponding to exactly the energy of specific excitations in molecules
Spectroscopy. Page 1 of 8 L.Pillay (2012)
") Spectroscopy Electromagnetic radiation is widely used in analytical chemistry. The identification and quantification of samples using electromagnetic radiation (light) is called spectroscopy. Light has
Spectroscopy Electromagnetic radiation is widely used in analytical chemistry. The identification and quantification of samples using electromagnetic radiation (light) is called spectroscopy. Light has
NUCLEAR MAGNETIC RESONANCE AND INTRODUCTION TO MASS SPECTROMETRY
 NUCLEAR MAGNETIC RESONANCE AND INTRODUCTION TO MASS SPECTROMETRY A STUDENT SHOULD BE ABLE TO: 1. Identify and explain the processes involved in proton ( 1 H) and carbon-13 ( 13 C) nuclear magnetic resonance
Chapter 9. Nuclear Magnetic Resonance. Ch. 9-1
 Chapter 9 Nuclear Magnetic Resonance Ch. 9-1 1. Introduction Classic methods for organic structure determination Boiling point Refractive index Solubility tests Functional group tests Derivative preparation
Increasing energy. ( 10 4 cm -1 ) ( 10 2 cm -1 )
 ( 10 2 cm -1 )") The branch of science which deals with the interaction of electromagnetic radiation with matter is called spectroscopy The energy absorbed or emitted in each transition corresponds to a definite frequency
The branch of science which deals with the interaction of electromagnetic radiation with matter is called spectroscopy The energy absorbed or emitted in each transition corresponds to a definite frequency
3 Use of Mass Spectra to Obtain Structural Information
 3 Use of Mass Spectra to Obtain Structural Information 1 Mass Spectrometry One of the most sensitive and versatile analytical tools More sensitive than other spectroscopic methods (e.g. IR spectroscopy)
Infrared Spectroscopy
 Infrared Spectroscopy IR Spectroscopy Used to identify organic compounds IR spectroscopy provides a 100% identification if the spectrum is matched. If not, IR at least provides information about the types
16.1 Introduction to NMR Spectroscopy. Spectroscopy. Spectroscopy. Spectroscopy. Spectroscopy. Spectroscopy 4/11/2013
 What is spectroscopy? NUCLEAR MAGNETIC RESONANCE (NMR) spectroscopy may be the most powerful method of gaining structural information about organic compounds. NMR involves an interaction between electromagnetic
SECOND YEAR ORGANIC CHEMISTRY - REVISION COURSE Lecture 2 MOLECULAR STRUCTURE 2: SPECTROSCOPIC ANALYSIS
 Prof Ben Davis SECOND YEAR ORGANIC CEMISTRY - REVISION COURSE Lecture 2 MOLECULAR STRUCTURE 2: SPECTROSCOPIC ANALYSIS Books: Williams and Fleming, " Spectroscopic Methods in Organic Chemistry", arwood
Unit 11 Instrumentation. Mass, Infrared and NMR Spectroscopy
 Unit 11 Instrumentation Mass, Infrared and NMR Spectroscopy Spectroscopic identification of organic compounds Qualitative analysis: presence but not quantity (i.e. PEDs) Quantitative analysis: quantity
PAPER No.12 :Organic Spectroscopy MODULE No.29: Combined problem on UV, IR, 1 H NMR, 13 C NMR and Mass - Part I
 Subject Chemistry Paper No and Title Module No and Title Module Tag 12: rganic Spectroscopy 29: Combined problem on UV, IR, 1 H NMR, 13 C NMR and Mass - Part I CHE_P12_M29 TABLE F CNTENTS 1. Learning utcomes
CHEMISTRY Topic #3: Using Spectroscopy to Identify Molecules: Radicals and Mass Spectrometry (MS) Spring 2018 Dr.
 Spring 2018 Dr.") CHEMISTRY 2600 Topic #3: Using Spectroscopy to Identify Molecules: Radicals and Mass Spectrometry (MS) Spring 2018 Dr. Susan Findlay Mass Spectrometry: How Does It Work? In CHEM 1000, you saw that mass
CHEMISTRY 2600 Topic #3: Using Spectroscopy to Identify Molecules: Radicals and Mass Spectrometry (MS) Spring 2018 Dr. Susan Findlay Mass Spectrometry: How Does It Work? In CHEM 1000, you saw that mass
STRUCTURE ELUCIDATION BY INTEGRATED SPECTROSCOPIC METHODS
 Miscellaneous Methods UNIT 14 STRUCTURE ELUCIDATION BY INTEGRATED SPECTROSCOPIC METHODS Structure 14.1 Introduction Objectives 14.2 Molecular Formula and Index of Hydrogen Deficiency 14.3 Structural Information
sample was a solution that was evaporated in the spectrometer (such as with ESI-MS) ions such as H +, Na +, K +, or NH 4
 ions such as H +, Na +, K +, or NH 4") Introduction to Spectroscopy V: Mass Spectrometry Basic Theory: Unlike other forms of spectroscopy used in structure elucidation of organic molecules mass spectrometry does not involve absorption/emission
Introduction to Spectroscopy V: Mass Spectrometry Basic Theory: Unlike other forms of spectroscopy used in structure elucidation of organic molecules mass spectrometry does not involve absorption/emission
Propose a structure for an alcohol, C4H10O, that has the following
 Propose a structure for an alcohol, C4H10O, that has the following 13CNMR spectral data: Broadband _ decoupled 13CNMR: 19.0, 31.7, 69.5 б DEPT _90: 31.7 б DEPT _ 135: positive peak at 19.0 & 31.7 б, negative
Symmetric Stretch: allows molecule to move through space
 BACKGROUND INFORMATION Infrared Spectroscopy Before introducing the subject of IR spectroscopy, we must first review some aspects of the electromagnetic spectrum. The electromagnetic spectrum is composed
Structural Determination Of Compounds
 EXPERIMENT 10 Mass Spectroscopy Structural Determination Of Compounds. Introduction - In mass spectrometry, a substance is bombarded with an electron beam having sufficient energy to fragment the molecule.
E35 SPECTROSCOPIC TECHNIQUES IN ORGANIC CHEMISTRY
 E35 SPECTRSCPIC TECNIQUES IN RGANIC CEMISTRY Introductory Comments. These notes are designed to introduce you to the basic spectroscopic techniques which are used for the determination of the structure
Chapter 20. Mass Spectroscopy
 Chapter 20 Mass Spectroscopy Mass Spectrometry (MS) Mass spectrometry is a technique used for measuring the molecular weight and determining the molecular formula of an organic compound. Mass Spectrometry
Lecture 13 Organic Chemistry 1
 EM 232 rganic hemistry I at hicago Lecture 13 rganic hemistry 1 Professor Duncan Wardrop February 23, 2010 1 EM 232 rganic hemistry I at hicago Spectroscopy & Spectrometry hapter 13 2 EM 232 rganic hemistry
MASS SPECTROSCOPY (MS)
") MASS SPECTOSCOPY (MS) Castor seeds icin (toxic protein) INTODUCTION Does not involve absorption of electromagnetic radiation. It is a spectroscopic technique, by virtue of its use in structure elucidation.
MASS SPECTOSCOPY (MS) Castor seeds icin (toxic protein) INTODUCTION Does not involve absorption of electromagnetic radiation. It is a spectroscopic technique, by virtue of its use in structure elucidation.
ORGANIC - CLUTCH CH ANALYTICAL TECHNIQUES: IR, NMR, MASS SPECT
 !! www.clutchprep.com CONCEPT: PURPOSE OF ANALYTICAL TECHNIQUES Classical Methods (Wet Chemistry): Chemists needed to run dozens of chemical reactions to determine the type of molecules in a compound.
Lecture 11. IR Theory. Next Class: Lecture Problem 4 due Thin-Layer Chromatography
 Lecture 11 IR Theory Next Class: Lecture Problem 4 due Thin-Layer Chromatography This Week In Lab: Ch 6: Procedures 2 & 3 Procedure 4 (outside of lab) Next Week in Lab: Ch 7: PreLab Due Quiz 4 Ch 5 Final
Yin and yang in chemistry education: the complementary nature of FTIR and NMR spectroscopies
 APPLICATION NOTE Yin and yang in chemistry education: the complementary nature of FTIR and NMR spectroscopies No. 52742 Authors: Matthew Gundlach, Katherine Paulsen, Michael Garry, Steve Lowry, Thermo
ORGANIC - CLUTCH CH ANALYTICAL TECHNIQUES: IR, NMR, MASS SPECT
 !! www.clutchprep.com CONCEPT: PURPOSE OF ANALYTICAL TECHNIQUES Classical Methods (Wet Chemistry): Chemists needed to run dozens of chemical reactions to determine the type of molecules in a compound.
Structure Determination. How to determine what compound that you have? One way to determine compound is to get an elemental analysis
 Structure Determination How to determine what compound that you have? ne way to determine compound is to get an elemental analysis -basically burn the compound to determine %C, %H, %, etc. from these percentages
Chapter 5. Mass spectrometry
 ionization and fragmentation Chapter 5. Mass spectrometry which fragmentations? mass and frequency, m/z and count rate Reading: Pavia Chapters 3 and 4 Don t need 3.3 B-D, 3.4 B-D Use the text to clarify
Spectroscopy. a laboratory method of analyzing matter using electromagnetic radiation.
 Spectroscopy a laboratory method of analyzing matter using electromagnetic radiation. Mass Spectrometry Determines the relative abundance of the different isotopes of an element Used to determine the average
Fourier Transform IR Spectroscopy
 Fourier Transform IR Spectroscopy Absorption peaks in an infrared absorption spectrum arise from molecular vibrations Absorbed energy causes molecular motions which create a net change in the dipole moment.
Spectroscopy. a laboratory method of analyzing matter using electromagnetic radiation
 Spectroscopy a laboratory method of analyzing matter using electromagnetic radiation The electromagnetic spectrum Radiation Scale of Absorption involves: Example of spectroscopy Gamma rays pm Nuclear reactions
Introduction. The analysis of the outcome of a reaction requires that we know the full structure of the products as well as the reactants
 Introduction The analysis of the outcome of a reaction requires that we know the full structure of the products as well as the reactants Spectroscopy and the Electromagnetic Spectrum Unlike mass spectrometry,
EMISSION SPECTROSCOPY
 IFM The Department of Physics, Chemistry and Biology LAB 57 EMISSION SPECTROSCOPY NAME PERSONAL NUMBER DATE APPROVED I. OBJECTIVES - Understand the principle of atomic emission spectra. - Know how to acquire
Chapter 13 Spectroscopy
 hapter 13 Spectroscopy Infrared spectroscopy Ultraviolet-Visible spectroscopy Nuclear magnetic resonance spectroscopy Mass Spectrometry 13.1 Principles of Molecular Spectroscopy: Electromagnetic Radiation
Mass Spectrometry. Introduction EI-MS and CI-MS Molecular mass & formulas Principles of fragmentation Fragmentation patterns Isotopic effects
 Mass Spectrometry Introduction EI-MS and CI-MS Molecular mass & formulas Principles of fragmentation Fragmentation patterns Isotopic effects 1 Introduction to MS Mass spectrometry is the method of analysis
Structure Determination
 There are more than 5 million organic compounds, the great majority of which are colourless liquids or white solids. Identifying or at least characterising determining some of its properties and features
EXPT. 9 DETERMINATION OF THE STRUCTURE OF AN ORGANIC COMPOUND USING UV, IR, NMR AND MASS SPECTRA
 EXPT. 9 DETERMINATION OF THE STRUCTURE OF AN ORGANIC COMPOUND USING UV, IR, NMR AND MASS SPECTRA Structure 9.1 Introduction Objectives 9.2 Principle 9.3 Requirements 9.4 Strategy for the Structure Elucidation
ULTRAVIOLET SPECTROSCOPY or ELECTRONIC SPECTROSCOPY
 ULTRAVILET SPECTRSCPY or ELECTRNIC SPECTRSCPY S. SANKARARAMAN Department of Chemistry Indian Institute of Technology Madras Chennai 600036, INDIA Sanka@iitm.ac.in Absorption of electromagnetic radiation
Mass Spectrometry. 2000, Paul R. Young University of Illinois at Chicago, All Rights Reserved
 Mass Spectrometry 2000, Paul R. Young University of Illinois at Chicago, All Rights Reserved Mass Spectrometry When a molecule is bombarded with high-energy electrons, one of the process that can occur
Fourier Transform Infrared Spectroscopy of Metal Ligand Complexes *
 OpenStax-CNX module: m34660 1 Fourier Transform Infrared Spectroscopy of Metal Ligand Complexes * Jiebo Li Andrew R. Barron This work is produced by OpenStax-CNX and licensed under the Creative Commons
William H. Brown & Christopher S. Foote
 Requests for permission to make copies of any part of the work should be mailed to:permissions Department, Harcourt Brace & Company, 6277 Sea Harbor Drive, Orlando, Florida 32887-6777 William H. Brown
Electrophiles are attracted to the π bond Addition sees a π bond replaced with a σ bond There are many different types of addition reactions:
 Nucleophiles and Electrophiles Nucleophiles are the atoms that donates the electron pairs and is added to the molecules (In the example above this is the CN) Electrophiles are the atoms that seek electron
ORGANIC - EGE 5E CH UV AND INFRARED MASS SPECTROMETRY
 !! www.clutchprep.com CONCEPT: IR SPECTROSCOPY- FREQUENCIES There are specific absorption frequencies in the functional group region that we should be familiar with EXAMPLE: What are the major IR absorptions
Calculate a rate given a species concentration change.
 Kinetics Define a rate for a given process. Change in concentration of a reagent with time. A rate is always positive, and is usually referred to with only magnitude (i.e. no sign) Reaction rates can be
CHEM 241 UNIT 5: PART A DETERMINATION OF ORGANIC STRUCTURES BY SPECTROSCOPIC METHODS [MASS SPECTROMETRY]
![CHEM 241 UNIT 5: PART A DETERMINATION OF ORGANIC STRUCTURES BY SPECTROSCOPIC METHODS [MASS SPECTROMETRY]](/thumbs/83/88348834.jpg "CHEM 241 UNIT 5: PART A DETERMINATION OF ORGANIC STRUCTURES BY SPECTROSCOPIC METHODS [MASS SPECTROMETRY]") CHEM 241 UNIT 5: PART A DETERMINATION OF ORGANIC STRUCTURES BY SPECTROSCOPIC METHODS [MASS SPECTROMETRY] 1 Introduction Outline Mass spectrometry (MS) 2 INTRODUCTION The analysis of the outcome of a reaction
CHEM 241 UNIT 5: PART A DETERMINATION OF ORGANIC STRUCTURES BY SPECTROSCOPIC METHODS [MASS SPECTROMETRY] 1 Introduction Outline Mass spectrometry (MS) 2 INTRODUCTION The analysis of the outcome of a reaction
Molecular Spectroscopy
 Molecular Spectroscopy Types of transitions: 1) Electronic (UV-Vis-Near IR) 2) Vibrational (IR) 3) Rotational (microwave) Electronic Absorption Spectra π π* Gary L. Miessler and Donald A. Tarr, Inorganic
13.24: Mass Spectrometry: molecular weight of the sample
 hapter 13: Spectroscopy Methods of structure determination Nuclear Magnetic Resonances (NMR) Spectroscopy (Sections 13.3-13.19) Infrared (IR) Spectroscopy (Sections 13.20-13.22) Ultraviolet-visible (UV-Vis)
EXPT. 7 CHARACTERISATION OF FUNCTIONAL GROUPS USING IR SPECTROSCOPY
 EXPT. 7 CHARACTERISATION OF FUNCTIONAL GROUPS USING IR SPECTROSCOPY Structure 7.1 Introduction Objectives 7.2 Principle 7.3 Requirements 7.4 Strategy for the Interpretation of IR Spectra 7.5 Practice Problems
Chapter 13: Molecular Spectroscopy
 Chapter 13: Molecular Spectroscopy Electromagnetic Radiation E = hν h = Planck s Constant (6.63 x 10⁻³⁴ J. s) ν = frequency (s -1 ) c = νλ λ = wavelength (nm) Energy is proportional to frequency Spectrum
PAPER No.12 :Organic Spectroscopy MODULE No.30: Combined problem on UV, IR, 1 H NMR, 13 C NMR and Mass - Part II
 Subject Chemistry Paper No and Title Module No and Title Module Tag 12 : rganic Spectroscopy 30: Combined problem on UV, IR, 1 H NMR, 13 C NMR and Mass Part-II CHE_P12_M30 TABLE F CNTENTS 1. Learning utcomes
Nuclear Magnetic Resonance
 Nuclear Magnetic Resonance PRINCIPLES OF NMR SPECTROSCOPY Contents Principles of nuclear magnetic resonance The nmr spectrometer Basic principles in nmr application NMR tools used to obtain information
Objective 4. Determine (characterize) the structure of a compound using IR, NMR, MS.
 the structure of a compound using IR, NMR, MS.") Objective 4. Determine (characterize) the structure of a compound using IR, NMR, MS. Skills: Draw structure IR: match bond type to IR peak NMR: ID number of non-equivalent H s, relate peak splitting to
Objective 4. Determine (characterize) the structure of a compound using IR, NMR, MS. Skills: Draw structure IR: match bond type to IR peak NMR: ID number of non-equivalent H s, relate peak splitting to
Chapter 14 Spectroscopy
 hapter 14 Spectroscopy There are four major analytical techniques used for identifying the structure of organic molecules 1. Nuclear Magnetic Resonance or NMR is the single most important technique for
1. neopentyl benzene. 4 of 6
 I. 1 H NMR spectroscopy A. Theory 1. The protons and neutrons in atomic nuclei spin, as does the nucleus itself 2. The circulation of nuclear charge can generate a nuclear magnetic moment, u, along the
All measurement has a limit of precision and accuracy, and this must be taken into account when evaluating experimental results.
 Chapter 11: Measurement and data processing and analysis 11.1 Uncertainty and error in measurement and results All measurement has a limit of precision and accuracy, and this must be taken into account
Principles of Molecular Spectroscopy: Electromagnetic Radiation and Molecular structure. Nuclear Magnetic Resonance (NMR)
") Principles of Molecular Spectroscopy: Electromagnetic Radiation and Molecular structure Nuclear Magnetic Resonance (NMR) !E = h" Electromagnetic radiation is absorbed when the energy of photon corresponds
Principles of Molecular Spectroscopy: Electromagnetic Radiation and Molecular structure Nuclear Magnetic Resonance (NMR) !E = h" Electromagnetic radiation is absorbed when the energy of photon corresponds
Spectroscopy in Organic Chemistry. Types of Spectroscopy in Organic
 Spectroscopy in Organic Chemistry Spectroscopy Spectrum dealing with light, or more specifically, radiation Scope to see Organic Spectroscopy therefore deals with examining how organic molecules interact
CHEM Chapter 13. Nuclear Magnetic Spectroscopy (Homework) W
 W") CHEM 2423. Chapter 13. Nuclear Magnetic Spectroscopy (Homework) W Short Answer 1. For a nucleus to exhibit the nuclear magnetic resonance phenomenon, it must be magnetic. Magnetic nuclei include: a. all
CHEM 2423. Chapter 13. Nuclear Magnetic Spectroscopy (Homework) W Short Answer 1. For a nucleus to exhibit the nuclear magnetic resonance phenomenon, it must be magnetic. Magnetic nuclei include: a. all
Topic 2.11 ANALYTICAL TECHNIQUES. High Resolution Mass Spectrometry Infra-red Spectroscopy
 Topic 2.11 ANALYTICAL TECHNIQUES High Resolution Mass Spectrometry Infra-red Spectroscopy HIGH RESOLUTION MASS SPECTROMETRY The technique of mass spectrometry was used in Unit 1 to: a) determine the relative
C h a p t e r S i x t e e n: Nuclear Magnetic Resonance Spectroscopy. An 1 H NMR FID of ethanol
 0.2 0.4 0.6 0.8 1.0 1.2 1.4 1.6 1.8 2.0 2.2 2.4 2.6 2.8 3.0 3.2 3.4 3.6 C h a p t e r S i x t e e n: Nuclear Magnetic Resonance Spectroscopy An 1 NMR FID of ethanol Note: Problems with italicized numbers
CH 3. mirror plane. CH c d
 CAPTER 20 Practice Exercises 20.1 The index of hydrogen deficiency is two. The structural possibilities include two double bonds, a double do 20.3 (a) As this is an alkane, it contains only C and and has
( ) x10 8 m. The energy in a mole of 400 nm photons is calculated by: ' & sec( ) ( & % ) 6.022x10 23 photons' E = h! = hc & 6.
 x10 8 m. The energy in a mole of 400 nm photons is calculated by: ' & sec( ) ( & % ) 6.022x10 23 photons' E = h! = hc & 6.") Introduction to Spectroscopy Spectroscopic techniques are widely used to detect molecules, to measure the concentration of a species in solution, and to determine molecular structure. For proteins, most
Introduction to Spectroscopy Spectroscopic techniques are widely used to detect molecules, to measure the concentration of a species in solution, and to determine molecular structure. For proteins, most
Vibrational Spectroscopy
 Vibrational Spectroscopy In this part of the course we will look at the kind of spectroscopy which uses light to excite the motion of atoms. The forces required to move atoms are smaller than those required
Ferdowsi University of Mashhad
 Spectroscopy in Inorganic Chemistry Nuclear Magnetic Resonance Spectroscopy spin deuterium 2 helium 3 The neutron has 2 quarks with a -e/3 charge and one quark with a +2e/3 charge resulting in a total
Chemistry 213 Practical Spectroscopy
 Chemistry 213 Practical Spectroscopy Dave Berg djberg@uvic.ca Elliott 314 A course in determining structure by spectroscopic methods Different types of spectroscopy afford different information about molecules
Magnetic Resonance Spectroscopy EPR and NMR
 Magnetic Resonance Spectroscopy EPR and NMR A brief review of the relevant bits of quantum mechanics 1. Electrons have spin, - rotation of the charge about its axis generates a magnetic field at each electron.
Organic Chemistry: CHEM2322
 Etiquette & Course Overview Organic Chemistry: Structure Determination MS & IR Dr. Christopher J. O Brien 203 CRB, cobrien@uta.edu Classroom etiquette Arrive on time if you are late you must quietly take
Infrared Spectroscopy
 Reminder: These notes are meant to supplement, not replace, the laboratory manual. Infrared Spectroscopy History and Application: Infrared (IR) radiation is simply one segment of the electromagnetic spectrum
Ultraviolet Spectroscopy. CH- 521 Course on Interpreta2ve Molecular Spectroscopy; Course Instructor: Krishna P. Kaliappan
 Ultraviolet Spectroscopy CH- 521 Course on Interpreta2ve Molecular Spectroscopy; Course Instructor: Krishna P. Kaliappan Ultraviolet Spectroscopy UV light can be absorbed by molecules to excite higher
CHEM*3440. Photon Energy Units. Spectrum of Electromagnetic Radiation. Chemical Instrumentation. Spectroscopic Experimental Concept.
 Spectrum of Electromagnetic Radiation Electromagnetic radiation is light. Different energy light interacts with different motions in molecules. CHEM*344 Chemical Instrumentation Topic 7 Spectrometry Radiofrequency
Molecular Spectroscopy. H 2 O e -
 Molecular Spectroscopy ν (cm -1 ) λ (cm) 10 6 10 8 10 10 10 12 10 14 10 16 10 18 10 20 10 22 ν (Hz) NMR ESR microwave IR UV/Vis VUV X-Ray Gamma Ray H 2 e - UV/Vis Spectroscopy absorption technique X hν
UV-Vis Spectroscopy. Chem 744 Spring Gregory R. Cook, NDSU Thursday, February 14, 13
 UV-Vis Spectroscopy Chem 744 Spring 2013 UV-Vis Spectroscopy Every organic molecule absorbs UV-visible light Energy of electronic transitions saturated functionality not in region that is easily accessible
Spectroscopy. Empirical Formula: Chemical Formula: Index of Hydrogen Deficiency (IHD)
") Spectroscopy Empirical Formula: Chemical Formula: Index of Hydrogen Deficiency (IHD) A)From a structure: B)From a molecular formula, C c H h N n O o X x, Formula for saturated hydrocarbons: Subtract the
Spectroscopy Empirical Formula: Chemical Formula: Index of Hydrogen Deficiency (IHD) A)From a structure: B)From a molecular formula, C c H h N n O o X x, Formula for saturated hydrocarbons: Subtract the
ORGANIC - BRUICE 8E CH MASS SPECT AND INFRARED SPECTROSCOPY
 !! www.clutchprep.com CONCEPT: PURPOSE OF ANALYTICAL TECHNIQUES Classical Methods (Wet Chemistry): Chemists needed to run dozens of chemical reactions to determine the type of molecules in a compound.
Radiant energy is proportional to its frequency (cycles/s = Hz) as a wave (Amplitude is its height) Different types are classified by frequency or
 as a wave (Amplitude is its height) Different types are classified by frequency or") CHEM 241 UNIT 5: PART B INFRA-RED RED SPECTROSCOPY 1 Spectroscopy of the Electromagnetic Spectrum Radiant energy is proportional to its frequency (cycles/s = Hz) as a wave (Amplitude is its height) Different
CHEM 241 UNIT 5: PART B INFRA-RED RED SPECTROSCOPY 1 Spectroscopy of the Electromagnetic Spectrum Radiant energy is proportional to its frequency (cycles/s = Hz) as a wave (Amplitude is its height) Different
Nuclear Magnetic Resonance Spectroscopy
 Nuclear Magnetic Resonance Spectroscopy Structural Elucidation Nuclear magnetic resonance spectroscopy is the name given to the technique which exploits the magnetic properties of nuclei and measures their
Identification of functional groups in the unknown Will take in lab today
 Qualitative Analysis of Unknown Compounds 1. Infrared Spectroscopy Identification of functional groups in the unknown Will take in lab today 2. Elemental Analysis Determination of the Empirical Formula
Magnetic Nuclei other than 1 H
 Magnetic Nuclei other than 1 H 2 H (Deuterium): I = 1 H,D-Exchange might be used to simplify 1 H-NMR spectra since H-D couplings are generally small; - - - -O- - - -D 2 -O- triplet of triplets slightly
Quantum Chemistry. NC State University. Lecture 5. The electronic structure of molecules Absorption spectroscopy Fluorescence spectroscopy
 Quantum Chemistry Lecture 5 The electronic structure of molecules Absorption spectroscopy Fluorescence spectroscopy NC State University 3.5 Selective absorption and emission by atmospheric gases (source:
Chemistry Instrumental Analysis Lecture 3. Chem 4631
 Chemistry 4631 Instrumental Analysis Lecture 3 Quantum Transitions The energy of a photon can also be transferred to an elementary particle by adsorption if the energy of the photon exactly matches the
Measurement and Data Processing. Ms.Peace
 Measurement and Data Processing Ms.Peace Lesson 1 11.1 Uncertainties and Errors in Measurements and Results Qualitative vs. Quantitative Qualitative data includes all non-numerical information obtained
Lecture 2 nmr Spectroscopy
 Lecture 2 nmr Spectroscopy Pages 427 430 and Chapter 13 Molecular Spectroscopy Molecular spectroscopy: the study of the frequencies of electromagnetic radiation that are absorbed or emitted by substances
Skoog Chapter 6 Introduction to Spectrometric Methods
 Skoog Chapter 6 Introduction to Spectrometric Methods General Properties of Electromagnetic Radiation (EM) Wave Properties of EM Quantum Mechanical Properties of EM Quantitative Aspects of Spectrochemical
More information can be found in Chapter 12 in your textbook for CHEM 3750/ 3770 and on pages in your laboratory manual.
 CHEM 3780 rganic Chemistry II Infrared Spectroscopy and Mass Spectrometry Review More information can be found in Chapter 12 in your textbook for CHEM 3750/ 3770 and on pages 13-28 in your laboratory manual.
two slits and 5 slits
 Electronic Spectroscopy 2015January19 1 1. UV-vis spectrometer 1.1. Grating spectrometer 1.2. Single slit: 1.2.1. I diffracted intensity at relative to un-diffracted beam 1.2.2. I - intensity of light
Instrumental Chemical Analysis
 L6 page 1 Instrumental Chemical Analysis Ultraviolet and visible spectroscopy Dr. Ahmad Najjar Philadelphia University Faculty of Pharmacy Department of Pharmaceutical Sciences 2 nd semester, 2016/2017
Questions on Instrumental Methods of Analysis
 Questions on Instrumental Methods of Analysis 1. Which one of the following techniques can be used for the detection in a liquid chromatograph? a. Ultraviolet absorbance or refractive index measurement.