Chapter 9. Nuclear Magnetic Resonance. Ch. 9-1
|
|
|
- Emory Johnson
- 6 years ago
- Views:
Transcription


1 Chapter 9 Nuclear Magnetic Resonance Ch. 9-1
2 1. Introduction Classic methods for organic structure determination Boiling point Refractive index Solubility tests Functional group tests Derivative preparation Sodium fusion (to identify N, Cl, Br, I & S) Mixture melting point Combustion analysis Degradation Ch. 9-2
3 Classic methods for organic structure determination Require large quantities of sample and are time consuming Ch. 9-3
4 Spectroscopic methods for organic structure determination a) Mass Spectroscopy (MS) Molecular Mass & characteristic fragmentation pattern b) Infrared Spectroscopy (IR) Characteristic functional groups c) Ultraviolet Spectroscopy (UV) Characteristic chromophore d) Nuclear Magnetic Resonance (NMR) Ch. 9-4
5 Spectroscopic methods for organic structure determination Combination of these spectroscopic techniques provides a rapid, accurate and powerful tool for Identification and Structure Elucidation of organic compounds Rapid Effective in mg and microgram quantities Ch. 9-5
6 General steps for structure elucidation 1. Elemental analysis Empirical formula e.g. C 2 4 O 2. Mass spectroscopy Molecular weight Molecular formula e.g. C 4 8 O 2, C 6 12 O 3 etc. Characteristic fragmentation pattern for certain functional groups Ch. 9-6
7 General steps for structure elucidation 3. From molecular formula Double bond equivalent (DBE) 4. Infrared spectroscopy (IR) Identify some specific functional groups e.g. C=O, C O, O, COO, N 2 etc. Ch. 9-7
8 General steps for structure elucidation 5. UV Sometimes useful especially for conjugated systems e.g. dienes, aromatics, enones 6. 1, 13 C NMR and other advanced NMR techniques Full structure determination Ch. 9-8
9 Electromagnetic spectrum cosmic & γ-rays X-rays ultraviolet visible infrared microwave radiowave λ: 0.1nm 200nm 400nm 800nm 50µm X-Ray Crystallography UV IR NMR 1Å = m 1nm = 10-9 m 1µm = 10-6 m Ch. 9-9
10 2. Nuclear Magnetic Resonance (NMR) Spectroscopy A graph that shows the characteristic energy absorption frequencies and intensities for a sample in a magnetic field is called a nuclear magnetic resonance (NMR) spectrum Ch. 9-10
11 Ch. 9-11
12 1. The number of signals in the spectrum tells us how many different sets of protons there are in the molecule 2. The position of the signals in the spectrum along the x-axis tells us about the magnetic environment of each set of protons arising largely from the electron density in their environment Ch. 9-12
13 3. The area under the signal tells us about how many protons there are in the set being measured 4. The multiplicity (or splitting pattern) of each signal tells us about the number of protons on atoms adjacent to the one whose signal is being measured Ch. 9-13
14 Typical 1 NMR spectrum Chemical Shift (δ) Integration (areas of peaks no. of ) Multiplicity (spin-spin splitting) and coupling constant Ch. 9-14
15 Typical 1 NMR spectrum Record as: 1 NMR (300 Mz, CDCl 3 ): δ 4.35 (2, t, J = 7.2 z, c ) 2.05 (2, sextet, J = 7.2 z, b ) 1.02 (3, t, J = 7.2 z, a ) chemical shift (δ) in ppm no. of (integration) multiplicity coupling constant in z Ch. 9-15
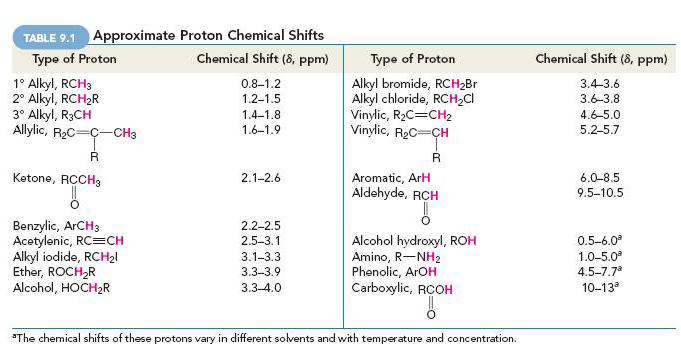
16 2A. Chemical Shift The position of a signal along the x-axis of an NMR spectrum is called its chemical shift The chemical shift of each signal gives information about the structural environment of the nuclei producing that signal Counting the number of signals in a 1 NMR spectrum indicates, at a first approximation, the number of distinct proton environments in a molecule Ch. 9-16
17 Ch. 9-17
18 Ch. 9-18
19 Normal range of 1 NMR "upfield" (more shielded) "downfield" (deshielded) δ ppm (low field strength) (high field strength) Ch. 9-19
20 Reference compound TMS = tetramethylsilane Me Me Si Me as a reference standard (0 ppm) Me Reasons for the choice of TMS as reference Resonance position at higher field than other organic compounds Unreactive and stable, not toxic Volatile and easily removed (B.P. = 28 o C) Ch. 9-20
21 NMR solvent Normal NMR solvents should not contain hydrogen Common solvents CDCl 3 C 6 D 6 CD 3 OD CD 3 COCD 3 (d 6 -acetone) Ch. 9-21
22 The 300-Mz 1 NMR spectrum of 1,4-dimethylbenzene Ch. 9-22
23 2B. Integration of Signal Areas Integral Step eights The area under each signal in a 1 NMR spectrum is proportional to the number of hydrogen atoms producing that signal It is signal area (integration), not signal height, that gives information about the number of hydrogen atoms Ch. 9-23
24 a a b R O b b 2 a 3 b b a Ch. 9-24
 has n neighbors of magnetically equivalent protons. It s multiplicity is n + 1 Ch.")
25 2C. Coupling (Signal Splitting) Coupling is caused by the magnetic effect of nonequivalent hydrogen atoms that are within 2 or 3 bonds of the hydrogens producing the signal The n+1 rule Rule of Multiplicity: If a proton (or a set of magnetically equivalent nuclei) has n neighbors of magnetically equivalent protons. It s multiplicity is n + 1 Ch. 9-25
26 Examples (1) b a b C C Cl b a a : multiplicity = = 4 (a quartet) b : multiplicity = = 3 (a triplet) (2) a b Cl C C Cl Cl b a : multiplicity = = 3 (a triplet) b : multiplicity = = 2 (a doublet) Ch. 9-26
27 Ch. 9-27
28 Examples (3) b a b C C Br b b b b a : multiplicity = = 7 (a septet) b : multiplicity = = 2 (a doublet) Note: All b s are chemically and magnetically equivalent. Ch. 9-28
29 Pascal s Triangle Use to predict relative intensity of various peaks in multiplet Given by the coefficient of binomial expansion (a + b) n singlet (s) 1 doublet (d) 1 1 triplet (t) quartet (q) quintet sextet Ch. 9-29
30 Pascal s Triangle For For a b Br C C Br Cl Cl a b Cl C C Br Cl Br Due to symmetry, a and b are identical a singlet a b two doublets Ch. 9-30
31 3. ow to Interpret Proton NMR Spectra 1. Count the number of signals to determine how many distinct proton environments are in the molecule (neglecting, for the time being, the possibility of overlapping signals) 2. Use chemical shift tables or charts to correlate chemical shifts with possible structural environments Ch. 9-31
32 3. Determine the relative area of each signal, as compared with the area of other signals, as an indication of the relative number of protons producing the signal 4. Interpret the splitting pattern for each signal to determine how many hydrogen atoms are present on carbon atoms adjacent to those producing the signal and sketch possible molecular fragments 5. Join the fragments to make a molecule in a fashion that is consistent with the data Ch. 9-32
33 Example: 1 NMR (300 Mz) of an unknown compound with molecular formula C 3 7 Br Ch. 9-33
34 Three distinct signals at ~ δ3.4, 1.8 and 1.1 ppm δ3.4 ppm: likely to be near an electronegative group (Br) Ch. 9-34
35 δ (ppm): Integral: Ch. 9-35
36 δ (ppm): Multiplicity: triplet sextet triplet 2 's on adjacent C 5 's on adjacent C 2 's on adjacent C Ch. 9-36
37 Complete structure: most downfield signal Br C 2 C 2 C 3 most upfield signal 2 's from integration triplet 2 's from integration sextet 3 's from integration triplet Ch. 9-37
38 4. Nuclear Spin: The Origin of the Signal The magnetic field associated with a spinning proton The spinning proton resembles a tiny bar magnet Ch. 9-38
39 Ch. 9-39
40 Ch. 9-40
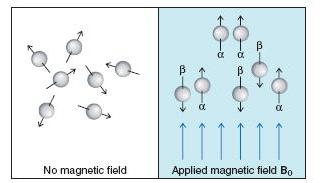
41 Spin quantum number (I) 1 : I = ½ (two spin states: +½ or -½) (similar for 13 C, 19 F, 31 P) 12 C, 16 O, 32 S: I = 0 These nuclei do not give an NMR spectrum Ch. 9-41

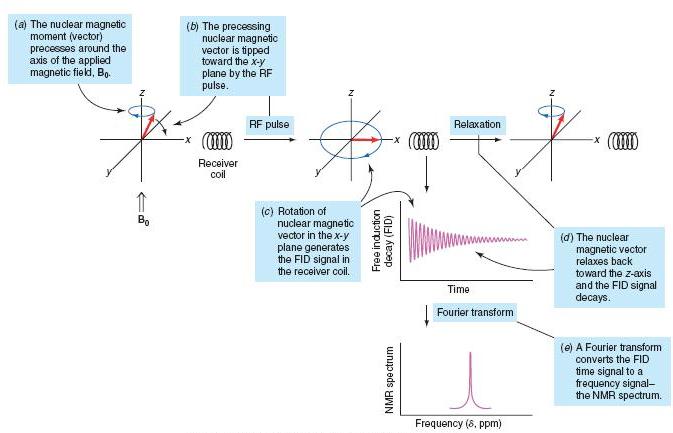
42 5. Detecting the Signal: Fourier Transform NMR Spectrometers Ch. 9-42
43 Ch. 9-43
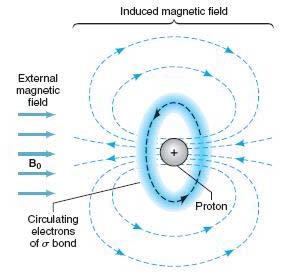
44 6. Shielding & Deshielding of Protons All protons do not absorb energy at the same frequency in a given external magnetic field Lower chemical shift values correspond with lower frequency igher chemical shift values correspond with higher frequency "upfield" (more shielded) "downfield" (deshielded) (low field δ ppm (high field strength) strength) Ch. 9-44
45 Ch. 9-45
46 Deshielding by electronegative groups C 3 X X = F O Cl Br I Electronegativity δ (ppm) Greater electronegativity Deshielding of the proton Larger δ Ch. 9-46
47 Shielding and deshielding by circulation of π electrons If we were to consider only the relative electronegativities of carbon in its three hybridization states, we might expect the following order of protons attached to each type of carbon: (higher frequency) sp < sp2 < sp 3 (lower frequency) Ch. 9-47
48 In fact, protons of terminal alkynes absorb between δ 2.0 and δ 3.0, and the order is (higher frequency) sp2 < sp < sp 3 (lower frequency) Ch. 9-48
49 This upfield shift (lower frequency) of the absorption of protons of terminal alkynes is a result of shielding produced by the circulating π electrons of the triple bond Shielded (δ 2 3 ppm) Ch. 9-49
50 Aromatic system Shielded region Deshielded region Ch. 9-50
51 e.g. d c a b δ (ppm) a & b : 7.9 & 7.4 (deshielded) c & d : (shielded) Ch. 9-51
52 Alkenes Deshielded (δ ppm) Ch. 9-52
53 Aldehydes R O Electronegativity effect + Anisotropy effect δ = ppm (deshielded) Ch. 9-53
54 7. The Chemical Shift Reference compound TMS = tetramethylsilane Me Me as a reference standard (0 ppm) Reasons for the choice of TMS as reference Resonance position at higher field than other organic compounds Unreactive and stable, not toxic Volatile and easily removed (B.P. = 28 o C) Si Me Me Ch. 9-54

55 7A. PPM and the δ Scale The chemical shift of a proton, when expressed in hertz (z), is proportional to the strength of the external magnetic field Since spectrometers with different magnetic field strengths are commonly used, it is desirable to express chemical shifts in a form that is independent of the strength of the external field Ch. 9-55
56 Since chemical shifts are always very small (typically 5000 z) compared with the total field strength (commonly the equivalent of 60, 300, or 600 million hertz), it is convenient to express these fractions in units of parts per million (ppm) This is the origin of the delta scale for the expression of chemical shifts relative to TMS δ = (observed shift from TMS in hertz) x 10 6 (operating frequency of the instrument in hertz) Ch. 9-56
57 For example, the chemical shift for benzene protons is 2181 z when the instrument is operating at 300 Mz. Therefore δ = The chemical shift of benzene protons in a 60 Mz instrument is 436 z: δ = 2181 z x x 10 6 z 436 z x x 10 6 z = 7.27 ppm = 7.27 ppm Thus, the chemical shift expressed in ppm is the same whether measured with an instrument operating at 300 or 60 Mz (or any other field strength) Ch. 9-57
58 8. Chemical Shift Equivalent and Nonequivalent Protons Two or more protons that are in identical environments have the same chemical shift and, therefore, give only one 1 NMR signal Chemically equivalent protons are chemical shift equivalent in 1 NMR spectra Ch. 9-58
59 8A. omotopic and eterotopic Atoms If replacing the hydrogens by a different atom gives the same compound, the hydrogens are said to be homotopic omotopic hydrogens have identical environments and will have the same chemical shift. They are said to be chemical shift equivalent Ch. 9-59
60 same compounds Br Br C C C Br C C C C C Ethane The six hydrogens of ethane are homotopic and are, therefore, chemical shift equivalent Ethane, consequently, gives only one signal in its 1 NMR spectrum C C C Br C C C Br Br same compounds Ch. 9-60
61 If replacing hydrogens by a different atom gives different compounds, the hydrogens are said to be heterotopic eterotopic atoms have different chemical shifts and are not chemical shift equivalent Ch. 9-61
62 same compounds these 3 s of the C 3 group are homotopic the C 3 group gives only one 1 NMR signal Cl Cl C C C Cl Br C Br C Br C C Br C C Br C C These 2 s are also homotopic to each other Br C Cl Cl different compounds heterotopic Ch. 9-62
63 Br C C C 3 C 2 Br two sets of hydrogens that are heterotopic with respect to each other two 1 NMR signals Ch. 9-63
64 Other examples (1) C C C 3 C NMR signals C 3 (2) 4 1 NMR signals C 3 Ch. 9-64
65 Other examples (3) 3 C C NMR signals Ch. 9-65
66 Application to 13 C NMR spectroscopy Examples (1) 3 C C C NMR signal C 3 (2) C C NMR signals Ch. 9-66
67 (3) 5 13 C NMR signals O O (4) O 4 13 C NMR signals O Ch. 9-67
68 8B. Enantiotopic and Diastereotopic ydrogen Atoms If replacement of each of two hydrogen atoms by the same group yields compounds that are enantiomers, the two hydrogen atoms are said to be enantiotopic Ch. 9-68
69 Enantiotopic hydrogen atoms have the same chemical shift and give only one 1 NMR signal: enantiotopic 3 C G Br 3 C Br enantiomer G 3 C Br Ch. 9-69
70 3 C b chirality centre a O C 3 diastereotopic 3 C b 3 C G G a O C 3 O C 3 diastereomers Ch. 9-70
71 G Br a b diastereotopic Br Br a b G diastereomers Ch. 9-71
72 9. Signal Splitting: Spin Spin Coupling Vicinal coupling is coupling between hydrogen atoms on adjacent carbons (vicinal hydrogens), where separation between the hydrogens is by three σ bonds a b 3 J or vicinal coupling Ch. 9-72
73 9A. Vicinal Coupling Vicinal coupling between heterotopic protons generally follows the n + 1 rule. Exceptions to the n + 1 rule can occur when diastereotopic hydrogens or conformationally restricted systems are involved Signal splitting is not observed for protons that are homotopic (chemical shift equivalent) or enantiotopic Ch. 9-73

74 9B. Splitting Tree Diagrams and the Origin of Signal Splitting Splitting analysis for a doublet b C a C Ch. 9-74
75 Splitting analysis for a triplet b C b a C b a b C C C Ch. 9-75
76 Splitting analysis for a quartet b b C b a C Ch. 9-76
77 Pascal s Triangle Use to predict relative intensity of various peaks in multiplet Given by the coefficient of binomial expansion (a + b) n singlet (s) 1 doublet (d) 1 1 triplet (t) quartet (q) quintet sextet Ch. 9-77


78 9C. Coupling Constants Recognizing Splitting Patterns a b X C C b a b Ch. 9-78
79 9D. The Dependence of Coupling Constants on Dihedral Angle 3 J values are related to the dihedral angle (φ) φ Ch. 9-79
80 Karplus curve φ ~0 o or 180 o Maximum 3 J value φ ~90 o 3 J ~0 z Ch. 9-80
81 Karplus curve Examples b b a (axial, axial) a φ = 180º J a,b = z a b φ = 60º J a,b = 4-5 z b a (equatorial, equatorial) Ch. 9-81
82 Karplus curve Examples b a (equatorial, axial) b a φ = 60º J a,b = 4-5 z Ch. 9-82
83 9E. Complicating Features The 60 Mz 1 NMR spectrum of ethyl chloroacetate Ch. 9-83
84 The 300 Mz 1 NMR spectrum of ethyl chloroacetate Ch. 9-84
85 9F. Analysis of Complex Interactions Ch. 9-85
86 The 300 Mz 1 NMR spectrum of 1- nitropropane Ch. 9-86
87 10. Proton NMR Spectra and Rate Processes Protons of alcohols (RO) and amines may appear over a wide range from ppm ydrogen-bonding is the reason for this range in high dilution (free O): R O δ = ~ ppm in conc. solution (-bonded): R δ R O O δ + O R proton more deshielded Ch. 9-87
88 Why don t we see coupling with the O proton, e.g. C 2 O (triplet?) Because the acidic protons are exchangeable about 10 5 protons per second (residence time 10-5 sec), but the NMR experiment requires a time of sec. to take a spectrum, usually we just see an average (thus, O protons are usually a broad singlet) Ch. 9-88
89 Trick: Run NMR in d -DMSO where - 6 bonding with DMSO s oxygen prevents s from exchanging and we may be able to see the coupling Ch. 9-89
90 Deuterium Exchange To determine which signal in the NMR spectrum is the O proton, shake the NMR sample with a drop of D O and whichever peak 2 disappears that is the O peak (note: a new peak of OD appears) D 2 O R O R O D + OD Ch. 9-90
91 Phenols Phenol protons appear downfield at 4-7 ppm They are more acidic - more + character More dilute solutions - peak appears upfield: towards 4 ppm O O Ch. 9-91
92 Phenols Intramolecular -bonding causes downfield shift O O 12.1 ppm Ch. 9-92


93 11. Carbon-13 NMR Spectroscopy 11A. Interpretation of 13 C NMR Spectra Unlike 1 with natural abundance ~99.98%, only 1.1% of carbon, namely 13 C, is NMR active Ch. 9-93
94 11B. One Peak for Each Magnetically Distinct Carbon Atom 13 C NMR spectra have only become commonplace more recently with the introduction of the Fourier Transform (FT) technique, where averaging of many scans is possible (note 13 C spectra are 6000 times weaker than 1 spectra, thus require a lot more scans for a good spectrum) Ch. 9-94
95 Note for a 200 Mz NMR (field strength 4.70 Tesla) 1 NMR Frequency = 200 Mz 13 C NMR Frequency = 50 Mz Ch. 9-95
96 Example: 2-Butanol C 3 C C 2 C 3 O Proton-coupled 13 C NMR spectrum Ch. 9-96
97 Example: 2-Butanol C 3 C C 2 C 3 O Proton-decoupled 13 C NMR spectrum Ch. 9-97
98 11C. 13 C Chemical Shifts Decreased electron density around an atom deshields the atom from the magnetic field and causes its signal to occur further downfield (higher ppm, to the left) in the NMR spectrum Relatively higher electron density around an atom shields the atom from the magnetic field and causes the signal to occur upfield (lower ppm, to the right) in the NMR spectrum Ch. 9-98
99 Factors affecting chemical shift i. Diamagnetic shielding due to bonding ii. iii. electrons Paramagnetic shielding due to low-lying electronic excited state Magnetic Anisotropy through space due to the near-by group (especially π electrons) In 1 NMR, (i) and (iii) most significant; in 13 C NMR, (ii) most significant (since chemical shift range >> 1 NMR) Ch. 9-99
100 Electronegative substituents cause downfield shift Increase in relative atomic mass of substituent causes upfield shift X Electronegativity Atomic Mass 13 C NMR: C 3 X Cl ppm Br ppm I ppm Ch
101 ybridization of carbon sp 2 > sp > sp 3 e.g. 2 C C 2 C C 3 C C ppm 71.9 ppm 5.7 ppm Ch
102 Anisotropy effect Shows shifts similar to the effect e.g. in 1 NMR C C C shows large upfield shift Ch
103 Ch
104 Ch
105 (a) (b) (c) Cl C 2 C C 3 O 1-Chloro-2-propanol (b) (a) (c) Ch
106 11D. Off-Resonance Decoupled Spectra NMR spectrometers can differentiate among carbon atoms on the basis of the number of hydrogen atoms that are attached to each carbon In an off-resonance decoupled 13 C NMR spectrum, each carbon signal is split into a multiplet of peaks, depending on how many hydrogens are attached to that carbon. An n + 1 rule applies, where n is the number of hydrogens on the carbon in question. Thus, a carbon with no hydrogens produces a singlet (n = 0), a carbon with one hydrogen produces a doublet (two peaks), a carbon with two hydrogens produces a triplet (three peaks), and a methyl group carbon produces a quartet (four peaks) Ch
107 Off-resonance decoupled 13 C NMR 1 2 N O N Broadband proton-decoupled 13 C NMR Ch


108 11E. DEPT 13 C Spectra DEPT 13 C NMR spectra indicate how many hydrogen atoms are bonded to each carbon, while also providing the chemical shift information contained in a broadband proton-decoupled 13 C NMR spectrum. The carbon signals in a DEPT spectrum are classified as C 3, C 2, C, or C accordingly Ch
109 (a) (b) (c) (b) (a) (c) Cl C 2 C C 3 O 1-Chloro-2-propanol Ch
110 The broadband proton-decoupled 13 C NMR spectrum of methyl methacrylate Ch
111 12. Two-Dimensional (2D) NMR Techniques COSY 1 1 correlation spectroscopy ETCOR eteronuclear correlation spectroscopy Ch
112 COSY of 2-chloro-butane Ch
113 ETCOR of 2-chloro-butane C 3 C 1 C 4 C Ch
114 END OF CAPTER 9 Ch
Chapter 9. Nuclear Magnetic Resonance and Mass Spectrometry. 1. Introduction. 2. Nuclear Magnetic Resonance (NMR) Spectroscopy
 Spectroscopy") hapter 9 Nuclear Magnetic Resonance and Mass Spectrometry reated by Professor William Tam & Dr. Phillis hang 1. Introduction Spectroscopy the study of the interaction of light with matter Spectroscopy
hapter 9 Nuclear Magnetic Resonance and Mass Spectrometry reated by Professor William Tam & Dr. Phillis hang 1. Introduction Spectroscopy the study of the interaction of light with matter Spectroscopy
4) protons experience a net magnetic field strength that is smaller than the applied magnetic field.
 protons experience a net magnetic field strength that is smaller than the applied magnetic field.") 1) Which of the following CANNOT be probed by an spectrometer? See sect 16.1 Chapter 16: 1 A) nucleus with odd number of protons & odd number of neutrons B) nucleus with odd number of protons &even number
1) Which of the following CANNOT be probed by an spectrometer? See sect 16.1 Chapter 16: 1 A) nucleus with odd number of protons & odd number of neutrons B) nucleus with odd number of protons &even number
The Use of NMR Spectroscopy
 Spektroskopi Molekul Organik (SMO): Nuclear Magnetic Resonance (NMR) Spectroscopy All is adopted from McMurry s Organic Chemistry The Use of NMR Spectroscopy Used to determine relative location of atoms
Nuclear spin and the splitting of energy levels in a magnetic field
 Nuclear spin and the splitting of energy levels in a magnetic field Top 3 list for 13 C NMR Interpretation 1. Symmetry 2. Chemical Shifts 3. Multiplicity 13 C NMR of C 3 O 1 NMR of C 3 O 13 C NMR of C
CHEM Chapter 13. Nuclear Magnetic Spectroscopy (Homework) W
 W") CHEM 2423. Chapter 13. Nuclear Magnetic Spectroscopy (Homework) W Short Answer 1. For a nucleus to exhibit the nuclear magnetic resonance phenomenon, it must be magnetic. Magnetic nuclei include: a. all
CHEM 2423. Chapter 13. Nuclear Magnetic Spectroscopy (Homework) W Short Answer 1. For a nucleus to exhibit the nuclear magnetic resonance phenomenon, it must be magnetic. Magnetic nuclei include: a. all
4) protons experience a net magnetic field strength that is smaller than the applied magnetic field.
 protons experience a net magnetic field strength that is smaller than the applied magnetic field.") 1) Which of the following CANNOT be probed by an spectrometer? See sect 16.1 Chapter 16: 1 A) nucleus with odd number of protons & odd number of neutrons B) nucleus with odd number of protons &even number
1) Which of the following CANNOT be probed by an spectrometer? See sect 16.1 Chapter 16: 1 A) nucleus with odd number of protons & odd number of neutrons B) nucleus with odd number of protons &even number
NUCLEAR MAGNETIC RESONANCE AND INTRODUCTION TO MASS SPECTROMETRY
 NUCLEAR MAGNETIC RESONANCE AND INTRODUCTION TO MASS SPECTROMETRY A STUDENT SHOULD BE ABLE TO: 1. Identify and explain the processes involved in proton ( 1 H) and carbon-13 ( 13 C) nuclear magnetic resonance
Chapter 13 Structure t Determination: Nuclear Magnetic Resonance Spectroscopy
 John E. McMurry www.cengage.com/chemistry/mcmurry Chapter 13 Structure t Determination: ti Nuclear Magnetic Resonance Spectroscopy Revisions by Dr. Daniel Holmes MSU Paul D. Adams University of Arkansas
Structure Determination: Nuclear Magnetic Resonance Spectroscopy
 Structure Determination: Nuclear Magnetic Resonance Spectroscopy Why This Chapter? NMR is the most valuable spectroscopic technique used for structure determination More advanced NMR techniques are used
NMR = Nuclear Magnetic Resonance
 NMR = Nuclear Magnetic Resonance NMR spectroscopy is the most powerful technique available to organic chemists for determining molecular structures. Looks at nuclei with odd mass numbers or odd number
16.1 Introduction to NMR Spectroscopy. Spectroscopy. Spectroscopy. Spectroscopy. Spectroscopy. Spectroscopy 4/11/2013
 What is spectroscopy? NUCLEAR MAGNETIC RESONANCE (NMR) spectroscopy may be the most powerful method of gaining structural information about organic compounds. NMR involves an interaction between electromagnetic
4) protons experience a net magnetic field strength that is smaller than the applied magnetic field.
 protons experience a net magnetic field strength that is smaller than the applied magnetic field.") 1) Which of the following CANNOT be probed by an NMR spectrometer? See sect 15.1 Chapter 15: 1 A) nucleus with odd number of protons & odd number of neutrons B) nucleus with odd number of protons &even
1) Which of the following CANNOT be probed by an NMR spectrometer? See sect 15.1 Chapter 15: 1 A) nucleus with odd number of protons & odd number of neutrons B) nucleus with odd number of protons &even
Module 13: Chemical Shift and Its Measurement
 Subject Chemistry Paper No and Title Module No and Title Module Tag Paper 12: Organic Spectroscopy CHE_P12_M13_e-Text TABLE OF CONTENTS 1. Learning Outcomes 2. Introduction 3. Shielding and deshielding
Chapter 14 Spectroscopy
 hapter 14 Spectroscopy There are four major analytical techniques used for identifying the structure of organic molecules 1. Nuclear Magnetic Resonance or NMR is the single most important technique for
4) protons experience a net magnetic field strength that is smaller than the applied magnetic field.
 protons experience a net magnetic field strength that is smaller than the applied magnetic field.") 1) Which of the following CANNOT be probed by an spectrometer? See sect 15.1 Chapter 15: 1 A) nucleus with odd number of protons & odd number of neutrons B) nucleus with odd number of protons &even number
1) Which of the following CANNOT be probed by an spectrometer? See sect 15.1 Chapter 15: 1 A) nucleus with odd number of protons & odd number of neutrons B) nucleus with odd number of protons &even number
Chapter 15 Lecture Outline
 Organic Chemistry, First Edition Janice Gorzynski Smith University of Hawaii Chapter 5 Lecture Outline Introduction to NMR Two common types of NMR spectroscopy are used to characterize organic structure:
To Do s. Answer Keys are available in CHB204H
 To Do s Read Chapters 2, 3 & 4. Complete the end-of-chapter problems, 2-1, 2-2, 2-3 and 2-4 Complete the end-of-chapter problems, 3-1, 3-3, 3-4, 3-6 and 3-7 Complete the end-of-chapter problems, 4-1, 4-2,
Nuclear Spin States. NMR Phenomenon. NMR Instrumentation. NMR Active Nuclei. Nuclear Magnetic Resonance
 Nuclear Magnetic Resonance NMR Phenomenon µ A spinning charged particle generates a magnetic field. A nucleus with a spin angular momentum will generate a magnetic moment (!). E Nuclear Spin States aligned
Nuclear Magnetic Resonance (NMR) Spectroscopy Introduction:
 Spectroscopy Introduction:") Nuclear Magnetic Resonance (NMR) Spectroscopy Introduction: Nuclear magnetic resonance spectroscopy (NMR) is the most powerful tool available for organic structure determination. Like IR spectroscopy,
Nuclear Magnetic Resonance (NMR) Spectroscopy Introduction: Nuclear magnetic resonance spectroscopy (NMR) is the most powerful tool available for organic structure determination. Like IR spectroscopy,
NUCLEAR MAGNETIC RESONANCE SPECTROSCOPY
 NMR Spectroscopy 1 NULEAR MAGNETI RESONANE SPETROSOPY Involves interaction of materials with the low-energy radiowave region of the electromagnetic spectrum Origin of Spectra Theory All nuclei possess
To Do s. Answer Keys are available in CHB204H
 To Do s Read Chapters 2, 3 & 4. Complete the end-of-chapter problems, 2-1, 2-2, 2-3 and 2-4 Complete the end-of-chapter problems, 3-1, 3-3, 3-4, 3-6 and 3-7 Complete the end-of-chapter problems, 4-1, 4-2,
ORGANIC - CLUTCH CH ANALYTICAL TECHNIQUES: IR, NMR, MASS SPECT
 !! www.clutchprep.com CONCEPT: PURPOSE OF ANALYTICAL TECHNIQUES Classical Methods (Wet Chemistry): Chemists needed to run dozens of chemical reactions to determine the type of molecules in a compound.
ORGANIC - CLUTCH CH ANALYTICAL TECHNIQUES: IR, NMR, MASS SPECT
 !! www.clutchprep.com CONCEPT: PURPOSE OF ANALYTICAL TECHNIQUES Classical Methods (Wet Chemistry): Chemists needed to run dozens of chemical reactions to determine the type of molecules in a compound.
Chapter 16 Nuclear Magnetic Resonance Spectroscopy
 hapter 16 Nuclear Magnetic Resonance Spectroscopy The Spinning Proton A spinning proton generates a magnetic field, resembling that of a small bar magnet. An odd number of protons in the nucleus creates
William H. Brown & Christopher S. Foote
 Requests for permission to make copies of any part of the work should be mailed to:permissions Department, Harcourt Brace & Company, 6277 Sea Harbor Drive, Orlando, Florida 32887-6777 William H. Brown
Chapter 13 Nuclear Magnetic Resonance Spectroscopy
 William. Brown Christopher S. Foote Brent L. Iverson Eric Anslyn http://academic.cengage.com/chemistry/brown Chapter 13 Nuclear Magnetic Resonance Spectroscopy William. Brown Beloit College Two Nobel Prizes
CH 3. mirror plane. CH c d
 CAPTER 20 Practice Exercises 20.1 The index of hydrogen deficiency is two. The structural possibilities include two double bonds, a double do 20.3 (a) As this is an alkane, it contains only C and and has
Chapter 14. Nuclear Magnetic Resonance Spectroscopy
 Organic Chemistry, Second Edition Janice Gorzynski Smith University of Hawai i Chapter 14 Nuclear Magnetic Resonance Spectroscopy Prepared by Rabi Ann Musah State University of New York at Albany Copyright
Chapter 13: Nuclear Magnetic Resonance (NMR) Spectroscopy direct observation of the H s and C s of a molecules
 Spectroscopy direct observation of the H s and C s of a molecules") hapter 13: Nuclear Magnetic Resonance (NMR) Spectroscopy direct observation of the s and s of a molecules Nuclei are positively charged and spin on an axis; they create a tiny magnetic field + + Not all
hapter 13: Nuclear Magnetic Resonance (NMR) Spectroscopy direct observation of the s and s of a molecules Nuclei are positively charged and spin on an axis; they create a tiny magnetic field + + Not all
Chapter 13: Molecular Spectroscopy
 Chapter 13: Molecular Spectroscopy Electromagnetic Radiation E = hν h = Planck s Constant (6.63 x 10⁻³⁴ J. s) ν = frequency (s -1 ) c = νλ λ = wavelength (nm) Energy is proportional to frequency Spectrum
Tuesday, January 13, NMR Spectroscopy
 NMR Spectroscopy NMR Phenomenon Nuclear Magnetic Resonance µ A spinning charged particle generates a magnetic field. A nucleus with a spin angular momentum will generate a magnetic moment (μ). If these
ORGANIC - BROWN 8E CH NUCLEAR MAGNETIC RESONANCE.
 !! www.clutchprep.com CONCEPT: 1 H NUCLEAR MAGNETIC RESONANCE- GENERAL FEATURES 1 H (Proton) NMR is a powerful instrumental method that identifies protons in slightly different electronic environments
Nuclear Magnetic Resonance Spectroscopy: Tools for Structure Determination
 Nuclear Magnetic Resonance Spectroscopy: Tools for Structure Determination Chung-Ming Sun Department of Applied Chemistry National Chiao Tung University Hualien 300, Taiwan Introduction NMR (Nuclear Magnetic
Spectroscopy in Organic Chemistry. Types of Spectroscopy in Organic
 Spectroscopy in Organic Chemistry Spectroscopy Spectrum dealing with light, or more specifically, radiation Scope to see Organic Spectroscopy therefore deals with examining how organic molecules interact
Experiment 11: NUCLEAR MAGNETIC RESONANCE SPECTROSCOPY
 Experiment 11: NUCLEAR MAGNETIC RESONANCE SPECTROSCOPY Purpose: This is an exercise to introduce the use of nuclear magnetic resonance spectroscopy, in conjunction with infrared spectroscopy, to determine
January 30, 2018 Chemistry 328N
 Lecture 4 Some More nmr January 30, 2018 Tricks for solving unknowns Review. Empirical formula is lowest common denominator ratio of atomic composition From Homework: unknown has an empirical formula of
Nuclear Magnetic Resonance Spectroscopy (NMR)
") OCR Chemistry A 432 Spectroscopy (NMR) What is it? An instrumental method that gives very detailed structural information about molecules. It can tell us - how many of certain types of atom a molecule
OCR Chemistry A 432 Spectroscopy (NMR) What is it? An instrumental method that gives very detailed structural information about molecules. It can tell us - how many of certain types of atom a molecule
OAT Organic Chemistry - Problem Drill 19: NMR Spectroscopy and Mass Spectrometry
 OAT Organic Chemistry - Problem Drill 19: NMR Spectroscopy and Mass Spectrometry Question No. 1 of 10 Question 1. Which statement concerning NMR spectroscopy is incorrect? Question #01 (A) Only nuclei
Chapter 13 Nuclear Magnetic Resonance Spectroscopy
 Organic Chemistry, 6 th Edition L. G. Wade, Jr. Chapter 13 Nuclear Magnetic Resonance Spectroscopy Jo Blackburn Richland College, Dallas, TX Dallas County Community College District 2006, Prentice Hall
3.15 Nuclear Magnetic Resonance Spectroscopy, NMR
 3.15 Nuclear Magnetic Resonance Spectroscopy, NMR What is Nuclear Magnetic Resonance - NMR Developed by chemists and physicists together it works by the interaction of magnetic properties of certain nuclei
Nuclear Magnetic Resonance Spectroscopy
 13 Nuclear Magnetic Resonance Spectroscopy Solutions to In-Text Problems 13.1 (b) Apply Eq. 13.2b with = 360 MHz. chemical shift in Hz = δ = (4.40)(360) = 1584 Hz 13.2 (b) Follow the same procedure used
13.24: Mass Spectrometry: molecular weight of the sample
 hapter 13: Spectroscopy Methods of structure determination Nuclear Magnetic Resonances (NMR) Spectroscopy (Sections 13.3-13.19) Infrared (IR) Spectroscopy (Sections 13.20-13.22) Ultraviolet-visible (UV-Vis)
In a solution, there are thousands of atoms generating magnetic fields, all in random directions.
 Nuclear Magnetic Resonance Spectroscopy: Purpose: onnectivity, Map of - framework Process: In nuclear magnetic resonance spectroscopy, we are studying nuclei. onsider this circle to represent a nucleus
Nuclear Magnetic Resonance H-NMR Part 1 Introduction to NMR, Instrumentation, Sample Prep, Chemical Shift. Dr. Sapna Gupta
 Nuclear Magnetic Resonance H-NMR Part 1 Introduction to NMR, Instrumentation, Sample Prep, Chemical Shift Dr. Sapna Gupta Introduction NMR is the most powerful tool available for organic structure determination.
Answers to Assignment #5
 Answers to Assignment #5 A. 9 8 l 2 5 DBE (benzene + 1 DBE) ( 9 2(9)+2-9 8+1+1 = 10 ˆ 5 DBE) nmr pattern of two doublets of equal integration at δ7.4 and 7.9 ppm means the group (the δ7.9 shift) IR band
Principles of Molecular Spectroscopy: Electromagnetic Radiation and Molecular structure. Nuclear Magnetic Resonance (NMR)
") Principles of Molecular Spectroscopy: Electromagnetic Radiation and Molecular structure Nuclear Magnetic Resonance (NMR) !E = h" Electromagnetic radiation is absorbed when the energy of photon corresponds
Principles of Molecular Spectroscopy: Electromagnetic Radiation and Molecular structure Nuclear Magnetic Resonance (NMR) !E = h" Electromagnetic radiation is absorbed when the energy of photon corresponds
Experiment 2 - NMR Spectroscopy
 Experiment 2 - NMR Spectroscopy OBJECTIVE to understand the important role of nuclear magnetic resonance spectroscopy in the study of the structures of organic compounds to develop an understanding of
Chapter 18: NMR Spectroscopy
 The most important tool of the chemist for the determination of molecular structure is Nuclear Magnetic Resonance Spectroscopy, or NMR spectroscopy. NMR spectra are acquired on a special instrument called
Introduction to NMR spectroscopy
 Introduction to NMR spectroscopy Nuclei of isotopes which possess an odd number of protons, an odd number of neutrons, or both, have a nuclear spin quantum number, I, such that, I = 1/2n, where n is an
NMR Spectroscopy. Chapter 19
 NMR Spectroscopy Chapter 19 Nuclear Magnetic Resonance spectroscopy is a powerful analytical technique used to characterize organic molecules by identifying carbon-hydrogen frameworks within molecules.
Instrumental Chemical Analysis
 L15 Page1 Instrumental Chemical Analysis Nuclear Magnetic Resonance Dr. Ahmad Najjar Philadelphia University Faculty of Pharmacy Department of Pharmaceutical Sciences 1 st semester, 2017/2018 Nuclear Magnetic
Nuclear Magnetic Resonance Spectroscopy: Purpose: Connectivity, Map of C-H framework
 Nuclear Magnetic Resonance Spectroscopy: Purpose: Connectivity, Map of C- framework Four Factors of Proton NMR (PMR OR NMR):. Symmetry: Number of chemically different protons (symmetry) as shown by number
1,1,2-Tribromoethane. Spin-Spin Coupling
 NMR Spin oupling Spin-Spin oupling Spectra usually much more complicated than a series of single lines, one for each type of hydrogen. Peaks are often split into a number of smaller peaks, sometimes with
Objective 4. Determine (characterize) the structure of a compound using IR, NMR, MS.
 the structure of a compound using IR, NMR, MS.") Objective 4. Determine (characterize) the structure of a compound using IR, NMR, MS. Skills: Draw structure IR: match bond type to IR peak NMR: ID number of non-equivalent H s, relate peak splitting to
Objective 4. Determine (characterize) the structure of a compound using IR, NMR, MS. Skills: Draw structure IR: match bond type to IR peak NMR: ID number of non-equivalent H s, relate peak splitting to
NMR Nuclear Magnetic Resonance Spectroscopy p. 83. a hydrogen nucleus (a proton) has a charge, spread over the surface
 has a charge, spread over the surface") NMR Nuclear Magnetic Resonance Spectroscopy p. 83 a hydrogen nucleus (a proton) has a charge, spread over the surface a spinning charge produces a magnetic moment (a vector = direction + magnitude) along
NMR Nuclear Magnetic Resonance Spectroscopy p. 83 a hydrogen nucleus (a proton) has a charge, spread over the surface a spinning charge produces a magnetic moment (a vector = direction + magnitude) along
C h a p t e r S i x t e e n: Nuclear Magnetic Resonance Spectroscopy. An 1 H NMR FID of ethanol
 0.2 0.4 0.6 0.8 1.0 1.2 1.4 1.6 1.8 2.0 2.2 2.4 2.6 2.8 3.0 3.2 3.4 3.6 C h a p t e r S i x t e e n: Nuclear Magnetic Resonance Spectroscopy An 1 NMR FID of ethanol Note: Problems with italicized numbers
Yale Chemistry 800 MHz Supercooled Magnet. Nuclear Magnetic Resonance
 Yale Chemistry 800 Mz Supercooled Magnet Nuclear Magnetic Resonance B o Atomic nuclei in The absence of a magnetic field Atomic nuclei in the presence of a magnetic field α spin - with the field β spin
16.1 Introduction to NMR. Spectroscopy
 16.1 Introduction to NMR What is spectroscopy? Spectroscopy NUCLEAR MAGNETIC RESNANCE (NMR) spectroscopy may be the most powerful method of gaining structural information about organic compounds. NMR involves
CHEM 242 NUCLEAR MAGNETIC RESONANCE SPECTROSCOPY CHAP 14B ASSIGN
 CHEM 242 NUCLEAR MAGNETIC RESNANCE SPECTRSCPY CHAP 14B ASSIGN 1. A proton NMR spectrum is observed to contain following the pattern below; what do you conclude? A. This must be a quartet that is part of
CHEM 322 Laboratory Methods in Organic Chemistry. Introduction to NMR Spectroscopy
 EM 322 Laboratory Methods in Organic hemistry Introduction to NMR Spectroscopy What structural information does NMR spectroscopy provide? 1) hemical shift (δ) data reveals the molecular (functional group)
In a solution, there are thousands of atoms generating magnetic fields, all in random directions.
 Nuclear Magnetic Resonance Spectroscopy: Purpose: onnectivity, Map of - framework Process: In nuclear magnetic resonance spectroscopy, we are studying nuclei. onsider this circle to represent a nucleus
Lecture Notes Chem 51A S. King
 Lecture Notes hem 51A S. King hapter 14 Nuclear Magnetic Resonance Spectroscopy Nuclear Magnetic Resonance (NMR) spectroscopy uses energy in the radiowave portion of the electromagnetic spectrum. The nuclei
Spin-Spin Coupling. H b1 H 3 C C Br. Review: 1 H- 1 H Coupling
 Review: 1-1 Coupling b1 3 C C Br b2 multiplicity: n + 1 rule can determine peak intensities by considering nuclear spin probabilities on adjacent hydrogens or use Pascal's triangle Coupling Constants (J)
Química Orgânica I. Nuclear Magnetic Resonance Spectroscopy (I) Ciências Farmacêuticas Bioquímica Química AFB QO I 2007/08 1 AFB QO I 2007/08 2
 Ciências Farmacêuticas Bioquímica Química AFB QO I 2007/08 1 AFB QO I 2007/08 2") Química Orgânica I Ciências Farmacêuticas Bioquímica Química AFB QO I 2007/08 1 Nuclear Magnetic Resonance Spectroscopy (I) AFB QO I 2007/08 2 1 Adaptado de: Organic Chemistry, 6th Edition; L. G. Wade,
Química Orgânica I Ciências Farmacêuticas Bioquímica Química AFB QO I 2007/08 1 Nuclear Magnetic Resonance Spectroscopy (I) AFB QO I 2007/08 2 1 Adaptado de: Organic Chemistry, 6th Edition; L. G. Wade,
Analysis of NMR Spectra Part 2
 Analysis of NMR Spectra Part 2-1- Analysis of NMR Spectra Part 2 "Things should be made as simple as possible, but not any simpler." Albert Einstein 1.1 Review of Basic NMR Concepts NMR analysis is a complex
NMRis the most valuable spectroscopic technique for organic chemists because it maps the carbon-hydrogen framework of a molecule.
 Chapter 13: Nuclear magnetic resonance spectroscopy NMRis the most valuable spectroscopic technique for organic chemists because it maps the carbon-hydrogen framework of a molecule. 13.2 The nature of
Chapter 13 Spectroscopy
 hapter 13 Spectroscopy Infrared spectroscopy Ultraviolet-Visible spectroscopy Nuclear magnetic resonance spectroscopy Mass Spectrometry 13.1 Principles of Molecular Spectroscopy: Electromagnetic Radiation
E35 SPECTROSCOPIC TECHNIQUES IN ORGANIC CHEMISTRY
 E35 SPECTRSCPIC TECNIQUES IN RGANIC CEMISTRY Introductory Comments. These notes are designed to introduce you to the basic spectroscopic techniques which are used for the determination of the structure
Calculate a rate given a species concentration change.
 Kinetics Define a rate for a given process. Change in concentration of a reagent with time. A rate is always positive, and is usually referred to with only magnitude (i.e. no sign) Reaction rates can be
To Do s. Read Chapter 3. Complete the end-of-chapter problems, 3-1, 3-3, 3-4, 3-6 and 3-7. Answer Keys are available in CHB204H
 Read Chapter 3. To Do s Complete the end-of-chapter problems, 3-1, 3-3, 3-4, 3-6 and 3-7 Answer Keys are available in CB204 NMR Chemical Shifts Further Discussion A set of spectral data is reported when
1 H NMR Spectroscopy: Background
 1 NMR Spectroscopy: Background Molecules are too small to be observed with the naked eye. In fact, it was only recently that the technology was developed to directly observe molecules by a specialized
CHEM311 FALL 2005 Practice Exam #3
 EM311 FALL 2005 Practice Exam #3 Instructions: This is a multiple choice / short answer practice exam. For the multiple-choice questions, there may be more than one correct answer. If so, then circle as
22 and Applications of 13 C NMR
 Subject Chemistry Paper No and Title Module No and Title Module Tag 12 and rganic Spectroscopy 22 and Applications of 13 C NMR CHE_P12_M22 TABLE F CNTENTS 1. Learning utcomes 2. Introduction 3. Structural
Paper 12: Organic Spectroscopy
 Subject Chemistry Paper No and Title Module No and Title Module Tag Paper 12: Organic Spectroscopy 31: Combined problem on UV, IR, 1 H NMR, 13 C NMR and Mass - Part III CHE_P12_M31 TABLE OF CONTENTS 1.
Chapter 16 Nuclear Magnetic Resonance Spectroscopy
 Chapter 16 Nuclear Magnetic Resonance Spectroscopy Review of Concepts Fill in the blanks below. To verify that your answers are correct, look in your textbook at the end of Chapter 16. Each of the sentences
NMR Spectroscopy. This handout is intended to give you a practical understanding of NMR Spectroscopy.
 NMR Spectroscopy This handout is intended to give you a practical understanding of NMR Spectroscopy. 1. Quantum theory allows us to consider each nucleus as a spinning charge. Note: we are only considering
1. Predict the structure of the molecules given by the following spectral data: a Mass spectrum:m + = 116
 Additional Problems for practice.. Predict the structure of the molecules given by the following spectral data: a Mass spectrum:m + = IR: weak absorption at 9 cm - medium absorption at cm - NMR 7 3 3 C
11. Proton NMR (text , 12.11, 12.12)
") 2009, Department of Chemistry, The University of Western Ontario 11.1 11. Proton NMR (text 12.6 12.9, 12.11, 12.12) A. Proton Signals Like 13 C, 1 H atoms have spins of ±½, and when they are placed in
2009, Department of Chemistry, The University of Western Ontario 11.1 11. Proton NMR (text 12.6 12.9, 12.11, 12.12) A. Proton Signals Like 13 C, 1 H atoms have spins of ±½, and when they are placed in
C NMR Spectroscopy
 13.14 13 C NMR Spectroscopy 1 H and 13 C NMR compared: both give us information about the number of chemically nonequivalent nuclei (nonequivalent hydrogens or nonequivalent carbons) both give us information
Proton NMR. Four Questions
 Proton NMR Four Questions How many signals? Equivalence Where on spectrum? Chemical Shift How big? Integration Shape? Splitting (coupling) 1 Proton NMR Shifts Basic Correlation Chart How many 1 H signals?
Magnetic Nuclei other than 1 H
 Magnetic Nuclei other than 1 H 2 H (Deuterium): I = 1 H,D-Exchange might be used to simplify 1 H-NMR spectra since H-D couplings are generally small; - - - -O- - - -D 2 -O- triplet of triplets slightly
Chem 213 Final 2012 Detailed Solution Key for Structures A H
 Chem 213 Final 2012 Detailed Solution Key for Structures A H COMPOUND A on Exam Version A (B on Exam Version B) C 8 H 6 Cl 2 O 2 DBE = 5 (aromatic + 1) IR: 1808 cm 1 suggests an acid chloride since we
PAPER No.12 :Organic Spectroscopy MODULE No.29: Combined problem on UV, IR, 1 H NMR, 13 C NMR and Mass - Part I
 Subject Chemistry Paper No and Title Module No and Title Module Tag 12: rganic Spectroscopy 29: Combined problem on UV, IR, 1 H NMR, 13 C NMR and Mass - Part I CHE_P12_M29 TABLE F CNTENTS 1. Learning utcomes
SECOND YEAR ORGANIC CHEMISTRY - REVISION COURSE Lecture 2 MOLECULAR STRUCTURE 2: SPECTROSCOPIC ANALYSIS
 Prof Ben Davis SECOND YEAR ORGANIC CEMISTRY - REVISION COURSE Lecture 2 MOLECULAR STRUCTURE 2: SPECTROSCOPIC ANALYSIS Books: Williams and Fleming, " Spectroscopic Methods in Organic Chemistry", arwood
Clickers. a. I watched all 5 videos b. The dog ate my iphone
 Clickers a. I watched all 5 videos b. The dog ate my iphone 40% 33% 33% 40% 59% 67% of you: Watch youtube! PRBLEMS: Complete end of chapter 13 problems 1 10 from Lab Manual Answers 1 NMR Protons (nucleus
ORGANIC SPECTROSCOPY NOTES
 - 1 - ORGANIC SPECTROSCOPY NOTES Basics of Spectroscopy UV/vis, IR and NMR are all types of Absorption Spectroscopy, where EM radiation corresponding to exactly the energy of specific excitations in molecules
Lecture 03 Nuclear Magnetic Resonance Spectroscopy Principle and Application in Structure Elucidation
 Application of Spectroscopic Methods in Molecular Structure Determination Prof. S. Sankararaman Department of Chemistry Indian Institute of Technology, Madras Lecture 03 Nuclear Magnetic Resonance Spectroscopy
HWeb27 ( ; )
") HWeb27 (9.1-9.2; 9.12-9.18) 28.1. Which of the following cannot be determined about a compound by mass spectrometry? [a]. boiling point [b]. molecular formula [c]. presence of heavy isotopes (e.g., 2 H,
HWeb27 (9.1-9.2; 9.12-9.18) 28.1. Which of the following cannot be determined about a compound by mass spectrometry? [a]. boiling point [b]. molecular formula [c]. presence of heavy isotopes (e.g., 2 H,
CHEMISTRY Organic Chemistry Laboratory II Spring 2019 Lab #5: NMR Spectroscopy
 Team Members: Unknown # CHEMISTRY 244 - Organic Chemistry Laboratory II Spring 2019 Lab #5: NMR Spectroscopy Purpose: You will learn how to predict the NMR data for organic molecules, organize this data
Using NMR and IR Spectroscopy to Determine Structures Dr. Carl Hoeger, UCSD
 Using NMR and IR Spectroscopy to Determine Structures Dr. Carl Hoeger, UCSD The following guidelines should be helpful in assigning a structure from NMR (both PMR and CMR) and IR data. At the end of this
Spectroscopy. Empirical Formula: Chemical Formula: Index of Hydrogen Deficiency (IHD)
") Spectroscopy Empirical Formula: Chemical Formula: Index of Hydrogen Deficiency (IHD) A)From a structure: B)From a molecular formula, C c H h N n O o X x, Formula for saturated hydrocarbons: Subtract the
Spectroscopy Empirical Formula: Chemical Formula: Index of Hydrogen Deficiency (IHD) A)From a structure: B)From a molecular formula, C c H h N n O o X x, Formula for saturated hydrocarbons: Subtract the
7a. Structure Elucidation: IR and 13 C-NMR Spectroscopies (text , , 12.10)
") 2009, Department of Chemistry, The University of Western Ontario 7a.1 7a. Structure Elucidation: IR and 13 C-NMR Spectroscopies (text 11.1 11.5, 12.1 12.5, 12.10) A. Electromagnetic Radiation Energy is
2009, Department of Chemistry, The University of Western Ontario 7a.1 7a. Structure Elucidation: IR and 13 C-NMR Spectroscopies (text 11.1 11.5, 12.1 12.5, 12.10) A. Electromagnetic Radiation Energy is
Organic Chemistry 321 Workshop: Spectroscopy NMR-IR Problem Set
 Organic Chemistry 321 Workshop: Spectroscopy NMR-IR Problem Set 1. Draw an NMR spectrum for each of the following compounds. Indicate each peak by a single vertical line (for example, a quartet would be
Structure Determination
 There are more than 5 million organic compounds, the great majority of which are colourless liquids or white solids. Identifying or at least characterising determining some of its properties and features
Unit 11 Instrumentation. Mass, Infrared and NMR Spectroscopy
 Unit 11 Instrumentation Mass, Infrared and NMR Spectroscopy Spectroscopic identification of organic compounds Qualitative analysis: presence but not quantity (i.e. PEDs) Quantitative analysis: quantity
Nuclear Magnetic Resonance Spectroscopy
 Nuclear Magnetic Resonance Spectroscopy Structural Elucidation Nuclear magnetic resonance spectroscopy is the name given to the technique which exploits the magnetic properties of nuclei and measures their
IR, MS, UV, NMR SPECTROSCOPY
 CHEMISTRY 318 IR, MS, UV, NMR SPECTROSCOPY PROBLEM SET All Sections CHEMISTRY 318 IR, MS, UV, NMR SPECTROSCOPY PROBLEM SET General Instructions for the 318 Spectroscopy Problem Set Consult the Lab Manual,
4. NMR spectra. Interpreting NMR spectra. Low-resolution NMR spectra. There are two kinds: Low-resolution NMR spectra. High-resolution NMR spectra
 1 Interpreting NMR spectra There are two kinds: Low-resolution NMR spectra High-resolution NMR spectra In both cases the horizontal scale is labelled in terms of chemical shift, δ, and increases from right
Nuclear Magnetic Resonance Spectroscopy Chem 4010/5326: Organic Spectroscopic Analysis Andrew Harned
 Nuclear Magnetic Resonance Spectroscopy Chem 4010/5326: Organic Spectroscopic Analysis 2015 Andrew Harned NMR Spectroscopy NMR Spectroscopy All nuclei have a nuclear spin quantum number (I) I = 0, 1/2,
- 1/2. = kb o = hνν + 1/2. B o increasing magnetic field strength. degenerate at B o = 0
 NMR EXPERIMENT When magnetically active nuclei are placed into an external magnetic field, the magnetic fields align themselves with the external field into two orientations. During the experiment, electromagnetic